
Abstract
Synapse loss has been considered as a major pathological change in Alzheimer’s disease (AD). It remains unclear about whether and how synapse loss relates to functional and structural connectivity dysfunction in AD. We measured synaptic vesicle glycoprotein 2 A (SV2A) binding using 18F-SynVesT-1 PET to evaluate synaptic alterations in 33 participants with AD, 31 with mild cognitive impairment (MCI), and 30 controls. We examined the correlation between synaptic density and cognitive function. Functional MRI was performed to analyze functional connectivity in lower synaptic density regions. We tracked the white matter tracts between impaired functional connectivity regions using Diffusion MRI. In AD group, lower synaptic density in bilateral cortex and hippocampus was found when compared with controls. The synaptic density changes in right insular cortex and bilateral caudal middle frontal gyrus (MFG) were correlated with cognitive decline. Among them, right MFG synaptic density was positively associated with right MFG - bilateral superior frontal gyrus (SFG) functional connectivity. AD had lower probability of tract (POT) between right MFG and SFG than controls, which was significantly associated with global cognition. These findings provide evidence supporting synapse loss contributes to functional and related structural connectivity alterations underlying cognitive impairment of AD.
Keywords
Introduction
As one of the most common neurodegenerative diseases and the main cause of dementia, Alzheimer’s disease (AD) was related to the structural and functional impairment of synapses. 1 Changes in synaptic proteins, 2 consequent destroyed transmission and plasticity of synapses, 3 as well as loss of synapses in hippocampus, 4 were observed in previous studies. In AD mouse models, complement and microglia mediated early synapse loss. 5 Diffusible oligomeric assemblies of the amyloid β protein could cause synaptic dysfunction. 6 Synapses were important to both the initiation and the spread of disease processes throughout the brain. 1
Synapse loss has been considered as a major pathological change that correlated with cognitive impairment in AD according to previous autopsy and biopsy studies.4,7–9 With the recent advent of synaptic PET imaging, synaptic vesicle glycoprotein 2 A (SV2A) PET has emerged as a promising method to evaluate synaptic alterations in human brain. SV2A is expressed ubiquitously in synapses of the central nervous system 4 and is located in synaptic vesicles at presynaptic terminals. 10 The radioligand binding to SV2A can serve as a proxy for the quantification of synaptic density. 11 11C-UCB-J was developed as a PET tracer for SV2A and was widely used in a variety of neuropsychiatric diseases.11–17 The 18F-labeled SV2A PET imaging was developed partly due to its longer radioactive half-life compared to 11C-UCB-J, which will improve the accessibility, enable multicenter studies, and accelerate their potential clinical applications. 18 As an 18F-labeled difluoro-analog of UCB-J, 18F-SynVesT-1 has good properties similar to 11C-UCB-J, which include high brain uptake, fast and reversible kinetics, and high specific binding. 19 It has been used in several neurological diseases, including amyotrophic lateral sclerosis 20 and focal cortical dysplasia type II. 21
In recent SV2A PET studies, Mecca et al. found SV2A binding was widely reduced in medial temporal and neocortical brain regions in early AD compared to cognitively normal (CN) participants. 22 They further demonstrated a significant association between synaptic density and cognitive performance. 15 Tau deposition was associated with lower synaptic density. Vanhaute and colleagues found that synaptic density loss was related to tau deposition in the medial temporal lobe in amnestic mild cognitive impairment (MCI) subjects. 12 Mecca et al. showed that entorhinal cortical tau deposition was related to reduced hippocampal synaptic density. 23 Moreover, Vanderlinden et al. demonstrated that the spatial decrease of synaptic density follows the specific tau build-up pattern in amnestic MCI patients in the two-year follow-up study. 17 However, whether and how synapse loss relates to functional and structural connectivity dysfunction, which may contribute to the neurobiology underlying cognitive impairment in AD, is unclear.
Based on the evidence above, we first validate that synaptic density, as measured by SV2A PET, would be positively associated with cognitive function across AD spectrum. Our primary hypothesis is that lower synaptic density, which correlates with cognitive impairment, is likely to have adverse consequences for network function and organization. Therefore, we examine whether functional connections are impaired in reduced synaptic density regions in AD. Furthermore, we investigate the structural connectivity changes in lower synaptic density regions using diffusion MRI via tractography-based analysis.
Methods
Participants
Thirty-three AD patients (mean age ± SD = 68.0 ± 7.8 years; 19 females), 31 MCI participants (mean age ± SD = 70.1 ± 6.8 years; 18 females) and 30 cognitively normal controls (CN; mean age ± SD = 63.4 ± 8.0 years; 24 females) participated in the study. The diagnosis was made based on their medical history, neuropsychological tests, and Aβ-PET imaging as described below. The criteria for AD and MCI followed the research criteria proposed by National Institute on Aging-Alzheimer's Association (NIA-AA, 2011) workgroups, including both clinical features and one biomarker, 24 based on cognitive status, neuropsychologic performance, and Aβ positivity determined by agreement between nuclear medicine specialists and one memory-disorder specialist (Table 1).
Demographic and clinical characteristics for each group.
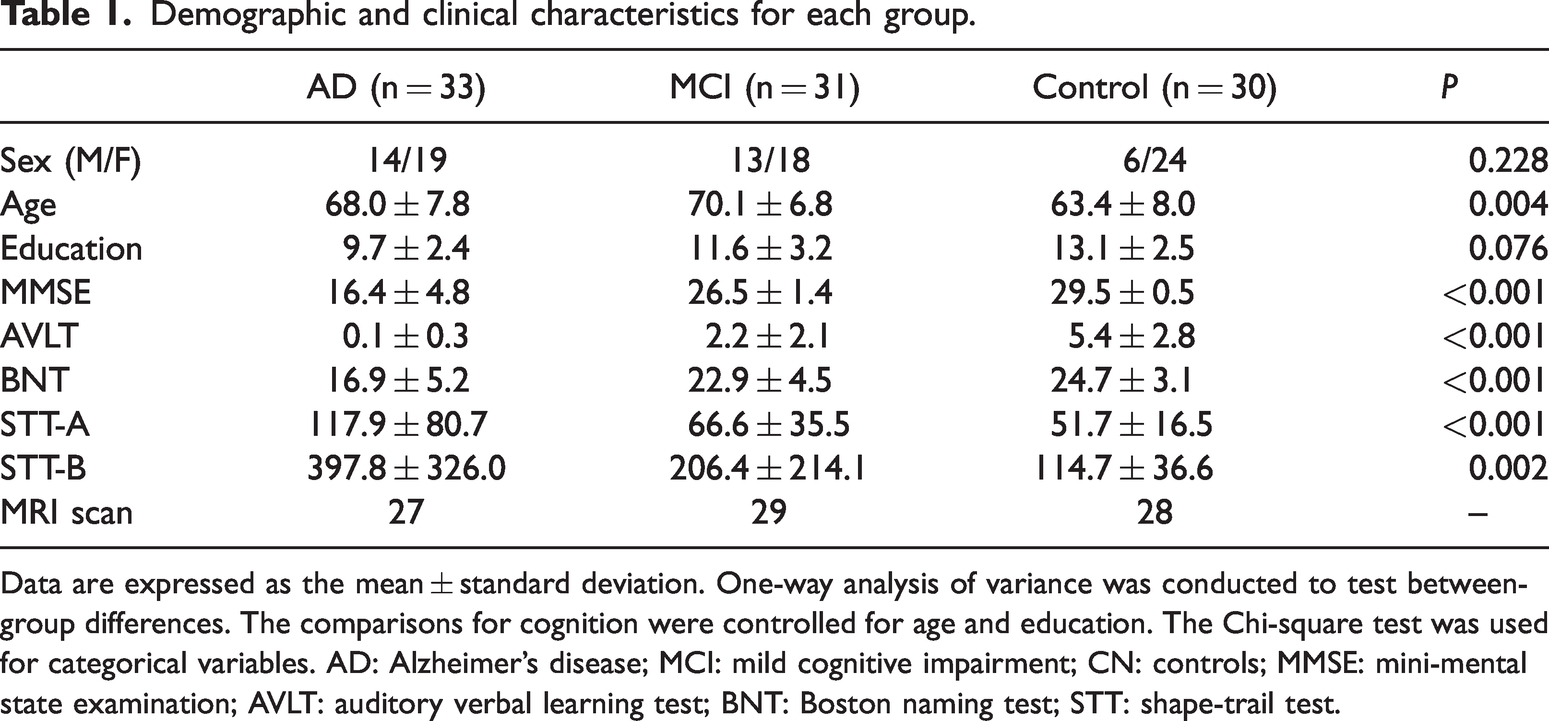
Data are expressed as the mean ± standard deviation. One-way analysis of variance was conducted to test between-group differences. The comparisons for cognition were controlled for age and education. The Chi-square test was used for categorical variables. AD: Alzheimer’s disease; MCI: mild cognitive impairment; CN: controls; MMSE: mini-mental state examination; AVLT: auditory verbal learning test; BNT: Boston naming test; STT: shape-trail test.
All participants were assessed by the Mini-Mental State Examination (MMSE, Chinese Version), 25 global clinical dementia rating (CDR = 0.5 for MCI and >0.5 for AD diagnosis), 20-min auditory verbal learning test (AVLT), Boston naming test (BNT) and shape-trail test (STT-A and STT-B). Demographics included sex, age, and education level. After inclusion, participant underwent SV2A PET and multimodal brain MRI, including structural scans, resting state functional MRI (fMRI) and diffusion MRI.
The present study was approved by the ethics committee, Huashan Hospital, Fudan Univeristy and Ruijin Hospital, Shanghai Jiao Tong University School of Medicine, China. All participants in the study or their caregivers signed written informed consent after fully understanding the procedure involved. All procedures were conducted according to the Declaration of Helsinki of 1975 (and as revised in 1983).
Acquisition of MRI and PET images
MRI data were acquired on a 3 T scanner (uMR 890, United Imaging Healthcare, Shanghai, China: https://www.united-imaging.com/zh-cn/product-service/products/mr/umr-890) with a dedicated 64-channel head coil. The T1-weighted structural image was acquired with a 3D fast spoiled gradient-echo sequence, with 0.75 mm isotropic voxels (field of view read: 240 mm, output images of 360 × 439× 480 slices, repetition time (TR)/inversion time (TI) = 7.5 ms/1100 ms, echo time (TE) = 3.4 ms, flip angle = 7 degree).
The scan parameters used for the fMRI and diffusion scans were very similar to those used in Human Connectome Project-Aging. 26 The fMRI scans were acquired with a 2 D multiband gradient-recalled echo (GRE) echo-planar imaging (EPI) sequence (multiple band = 10, TR/TE = 700/37.2 ms, flip angle = 52 degree) and 2.0 mm isotropic voxels covering the whole brain (70 slices). We acquired 670 whole-brain volumes with anterior-to-posterior (AP) phase encoding and 10 volumes with posterior-to-anterior (PA) phase encoding to correct EPI distortion.
Diffusion images were acquired with an EPI sequence, and the parameters were: TR/TE= 3500/77.3 ms, voxel size = 1.5 × 1.5 × 1.5 mm, 100 slices, multiple band = 10, diffusion direction = 32/64, b = 1500/3000, phase encoding direction = PA. A pair of four b0 images with reversed phase-encode blips (AP and PA) was acquired to correct susceptibility-induced distortion.
18F-SynVesT-1 was synthesized as previously described.19,27 All participants did not take drugs targeted to SV2A for at least 24 hours before PET scans, if indicated. 18F-SynVesT-1 PET/MR scans were collected on a 3 T whole-body PET/MR scanner (uPMR 790, United Imaging, China). A 30-min static PET scan started at 60-min post-injection of 18F-SynVesT-1 (∼3.7 MBq/kg body weight), while a T1-weighted MR scan was simultaneously acquired using the following parameters: TR/TE = 7200 ms/3.0 ms, flip angle = 10 degree, trans-axial acquisition matrix =256 × 329, in-plane resolution = 1 mm × 1 mm, slice thickness = 1 mm, sagittal slice = 176. The participants underwent 18F-SynVesT-1 PET study within one week before or after the day of MRI scan.
PET image analysis
The outcome measure for SV2A was standardized uptake value ratios (SUVR),12,17,19 and we employed an automatic pipeline implemented in FreeSurfer 7.1.1 (https://surfer.nmr.mgh.harvard.edu/fswiki/PetSurfer) to extract cortical and subcortical SUVR. In detail, structural T1 images were used to create a high-resolution segmentation to run the partial volume correction (PVC) methods. The PET/anatomical image registration was then performed and visually checked. The PET data were corrected for partial volume effects using a segmented grey matter mask and the Muller-Gartner method,28,29 and SUVR was calculated using a whole cerebellar cortex as the reference region. 22 Cortical SUVR maps were further sampled onto the brain surface and smoothed by a Gaussian kernel of 5 mm in full width at half maximum (FWHM). Subcortical SUVR maps were aligned to standard Montreal Neurological Institute (MNI) standard space and smoothed by 5 mm FWHM kernel. For additional comparisons for SV2A uptakes in the cerebellum, cerebellar cortex/white matter SV2A uptakes were defined as the regional raw PET tracer uptake values after partial volume correction.
We used analysis of covariance (ANCOVA) as the general linear model (GLM) to adjust for age and sex in vertex-wise and voxel-wise comparisons between groups of SV2A (synaptic) density. The vertex-wise cortical thickness and mean hippocampus volume were set as covariates in the vertex-wise comparison. The cortical and subcortical regions with reduced synaptic density (defined as seeds) in AD were chosen as seeds for the following functional connectivity analysis.
MRI analysis
The pre-processing pipelines for resting state fMRI and diffusion MRI generally followed the protocols of an image-processing pipeline 30 developed by UK Biobank using FSL (https://fsl.fmrib.ox.ac.uk/fsl/). For fMRI, the following pre-processing was applied: removal of the first 10 volumes, motion correction using MCFLIRT, 31 grand-mean intensity normalization of the entire 4 D dataset by a single multiplicative factor, high pass temporal filtering (Gaussian-weighted least-squares straight line fitting, with sigma = 50.0 s), and top-up correction for EPI distortion. Structured artefacts were removed by ICA + FIX processing (Independent Component Analysis followed by FMRIB’s ICA-based X-noiseifier).32,33 After slice timing correction by FSL, fMRI data were further processed by several steps implemented in the CONN toolbox (version 21.a) (https://www.nitrc.org/projects/conn). They included realignment of functional scans and normalization to MNI space, spatial smoothing (Gaussian kernel of 5 mm FWHM) and regression out influence from the white matter and cerebrospinal fluid voxels. Finally, the denoising step included temporal bandpass filtering (0.008–0.09 Hz), and linear detrending of the functional time series.
Seed-based connectivity analysis was performed to explore the seeds identified by SV2A-PET group comparisons to determine the connections that were impaired by reduced synaptic density. The mean time series of the seed region was correlated with the time series for every other voxel in the grey matter to create a map of r-values. The r-values were transformed to z-values using Fisher’s transform yielding functional connectivity (FC) map. Voxel-wise correlation was used to find cortical regions (defined as regions of interest, ROIs) whose FC with the seed was associated with synaptic density in the seed. Imaging results are shown at a cluster-level threshold of p < 0.05 with family-wise error (FWE) correction.
For diffusion MRI, the original data were corrected for susceptibility-induced distortion by top-up method. 34 Then the data were further corrected for head motion and eddy currents using the Eddy tool in FSL. The output data were fed into tractography-based analysis by the following steps: fitting of the probabilistic diffusion model on corrected data, registration to structural reference image and standard MNI space, and finally probabilistic tractography by XTRACT tool implemented in FSL. 35 To validate the synaptic change related FC from fMRI analysis, we tracked the white matter tracts from seeds to the ROIs of impaired FC.
Statistical analysis
The demographic and clinical characteristics of AD, MCI, and CN were compared using analysis of variance (ANOVA) or chi-square test for continuous or categorical variables, respectively. For PET analysis, GLM tests were two-tailed and all significant results of p < 0.01 went through cluster-wise correction for multiple comparisons by 10,000 permutations. In fMRI analysis, voxel-wise comparisons were used to find the between-group difference of seed connectivity. Imaging results are shown at a cluster-level threshold of p < 0.05 with FWE correction. For diffusion MRI, tractography of each participant yields several parameters of a tract, including volume, probability and length. The between-group difference of these parameters was compared by one-way Welch’s ANOVA. Partial Pearson’s correlation was used to assess the association between connectivity and cognitive function controlling for age.
Results
Synaptic density and cognitive impairment
The study sample consisted of 94 participants: 33 with AD, 31 with MCI and 30 who were CN, and their characteristics were shown in Table 1. There were no significant differences in sex or education among three groups, while CN were younger than AD and MCI. As shown in the Table 1, AD had the worst performance in all cognitive tests among three groups, while MCI performed better than AD, but worse than CN.
Compared with CN, AD showed significantly lower 18F-SynVesT-1 binding (SV2A SUVR), which was indicative of synaptic density, in the bilateral cortex and hippocampus (Differences in cortex were shown in Figure 1(a)). After regressing out cortical thickness, hippocampus volumes, age and sex, the differences survived in 14 seeds, including superior frontal gyrus, rostral/caudal middle frontal gyrus, post-central gyrus, inferior parietal gyrus, insular cortex, and hippocampus in the right hemisphere, and superior parietal gyrus, rostral/caudal middle frontal gyrus, posterior cingulate gyrus, insular cortex, fusiform, and hippocampus in the left hemisphere (Differences in cortex after regression were shown in Figure 1(b)). There was no significant difference after permutation test in synaptic density between MCI and CN in the vertex-wise GLM controlling for age and sex.
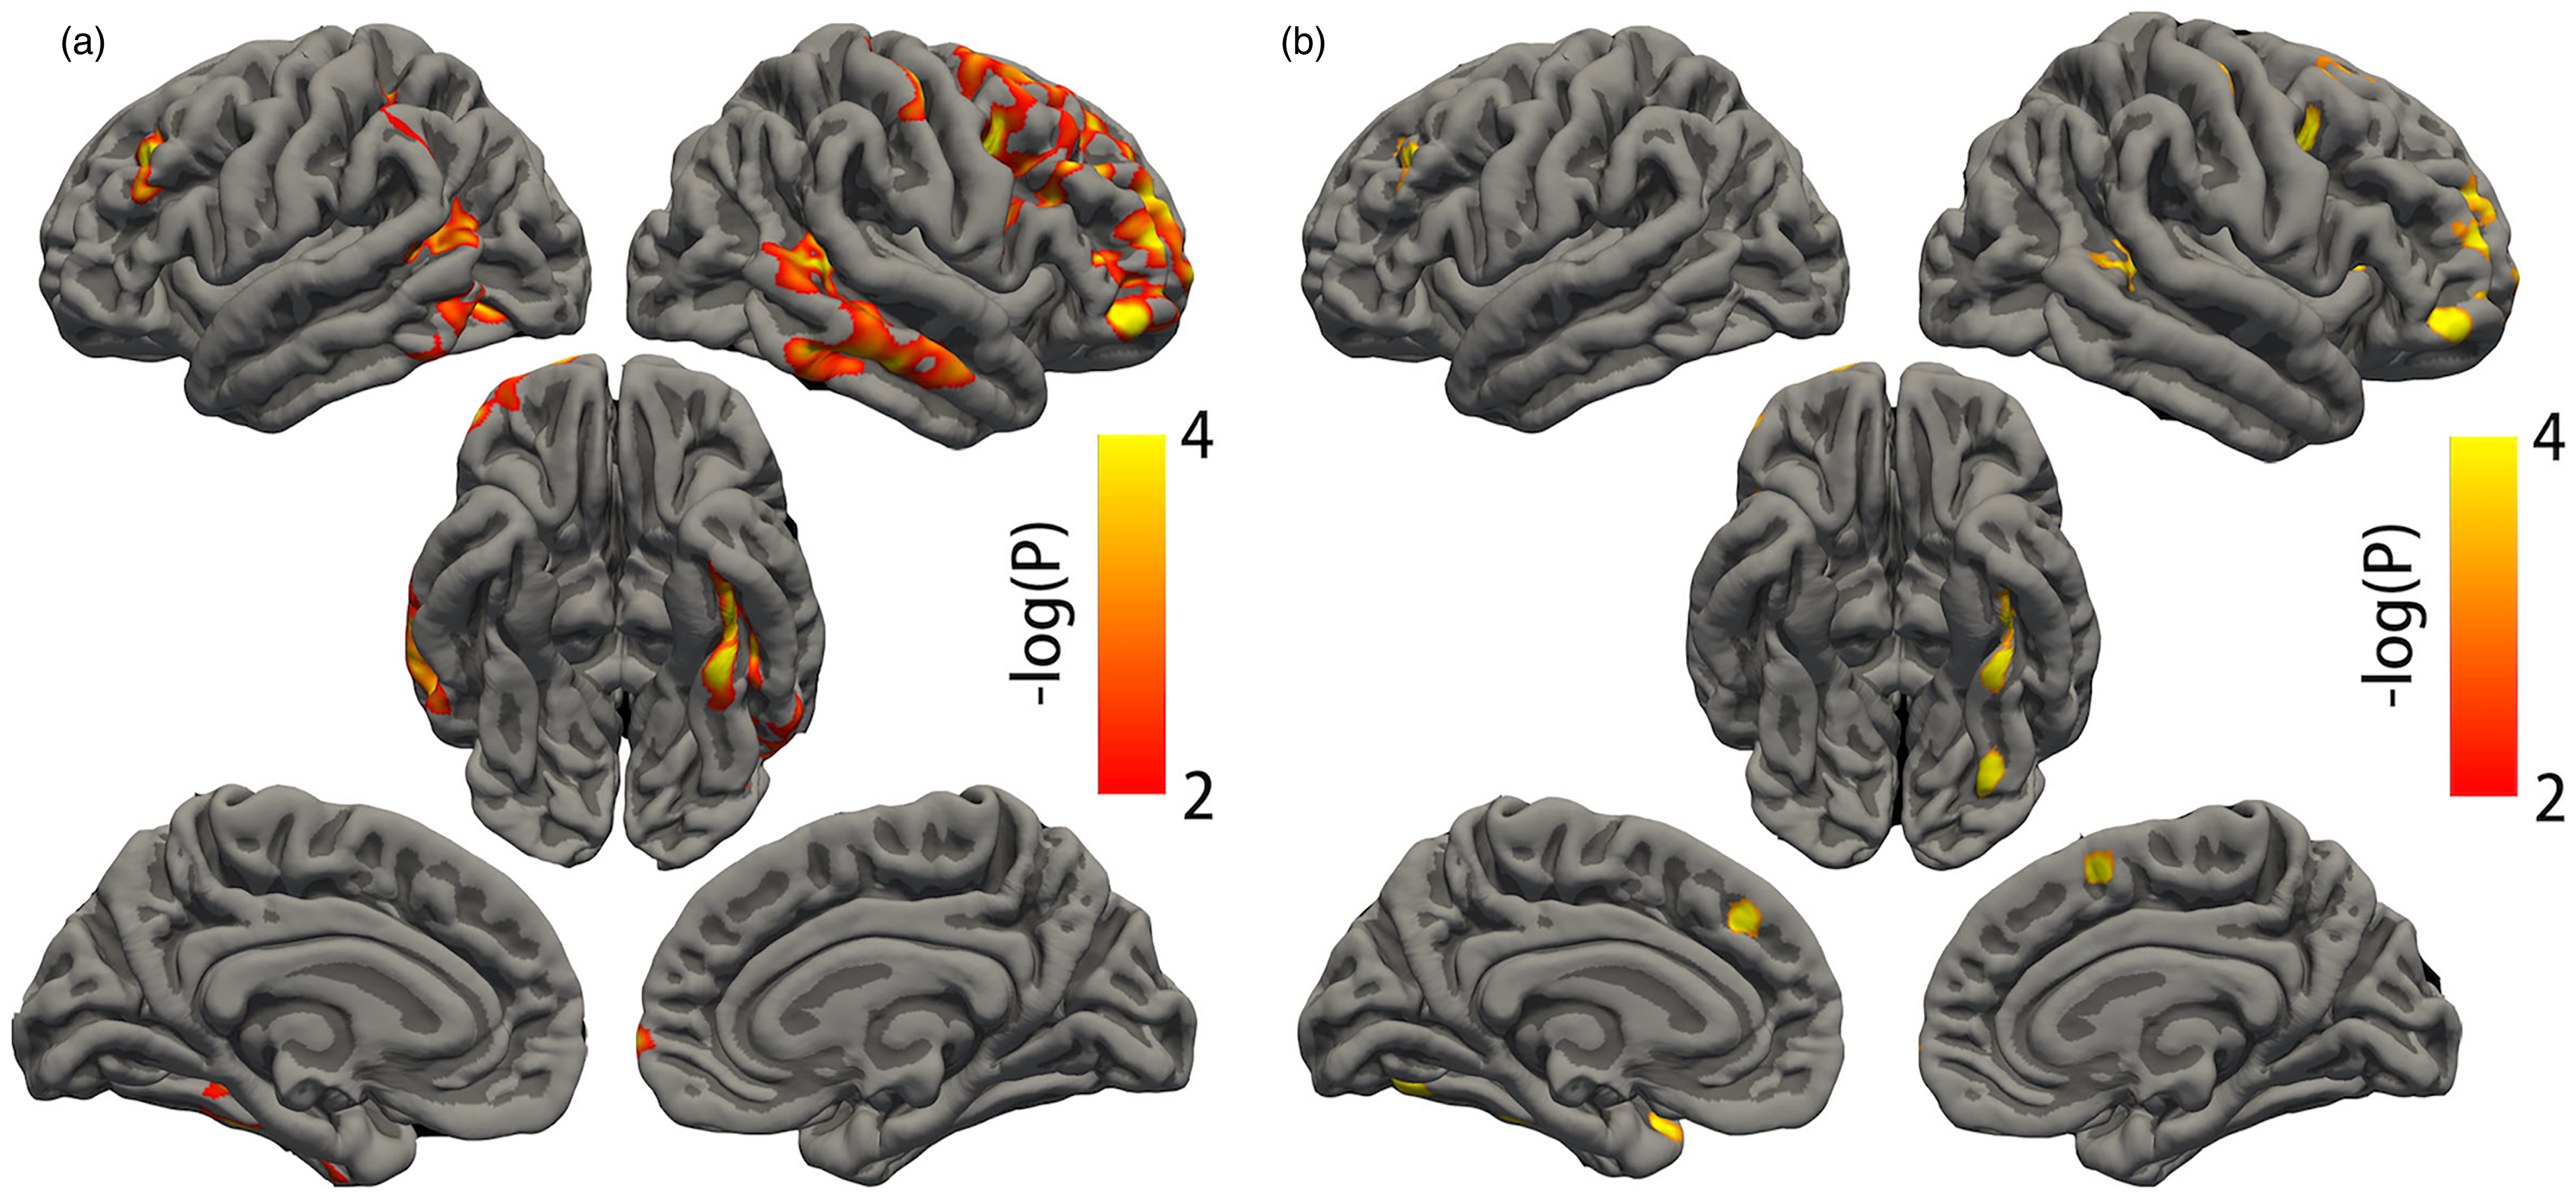
Differences in cortical SV2A density between AD and controls. (a) Compared to controls, AD had reduced cortical SV2A density after controlling for age and sex and (b) Difference of cortical SV2A density between AD and controls after controlling for cortical thickness at each vertex along the cortex, as well as age and sex. Only the significant clusters with corrected P < 0.01 after permutations are colored.
We additionally compared SV2A uptake in the cerebellum between groups to explore the variability of the reference region. The three groups had similar SV2A uptake in the left and right cerebellar cortex (p = 0.853 and 0.875), as well as the left and right cerebellar white matter (p = 0.693 and 0.674). As shown by histogram in the Supplementary Fig 1, the standard deviations of SV2A uptake in the left cerebellar cortex were 3720 in AD, 4732 in MCI, and 5287 in CN, and the standard deviations of SV2A uptake in the right cerebellar cortex were 3584 in AD, 4638 in MCI, and 5348 in CN.
Compared with MCI, AD also had reduced synaptic density in left caudal middle frontal gyrus (lMFG, p = 0.007), right caudal middle frontal gyrus (rMFG, p = 0.004) and right insular cortex (p = 0.013, Figure 2(a) to (c)). After Bonferroni correction, in the clinical participants (AD and MCI), synaptic density was correlated with MMSE in lMFG (r = 0.124, corrected p = 0.039), rMFG (r = 0.278, corrected p = 0.037) and right insular cortex (r = 0.213, corrected p = 0.038, Figure 2(d) to (f)). To further validate our procedures, we examined the relationship between hippocampal SV2A density and cognition (Supplementary Fig 2). Both left and right hippocampal SV2A SUVR were related to verbal memory and naming tests in the clinical participants (left hippocampus – AVLT: r = 0.467, p = 0.002; right hippocampus – AVLT: r = 0.533, p < 0.001; left hippocampus – BNT: r = 0.390, p =0.012; right hippocampus – BNT: r = 0.460, p = 0.002). The SV2A SUVR in the right hippocampus was also related to MMSE (r = 0.309, p = 0.020), while SUVR in the left hippocampus was related to STT-A (r = −0.348, p = 0.027).
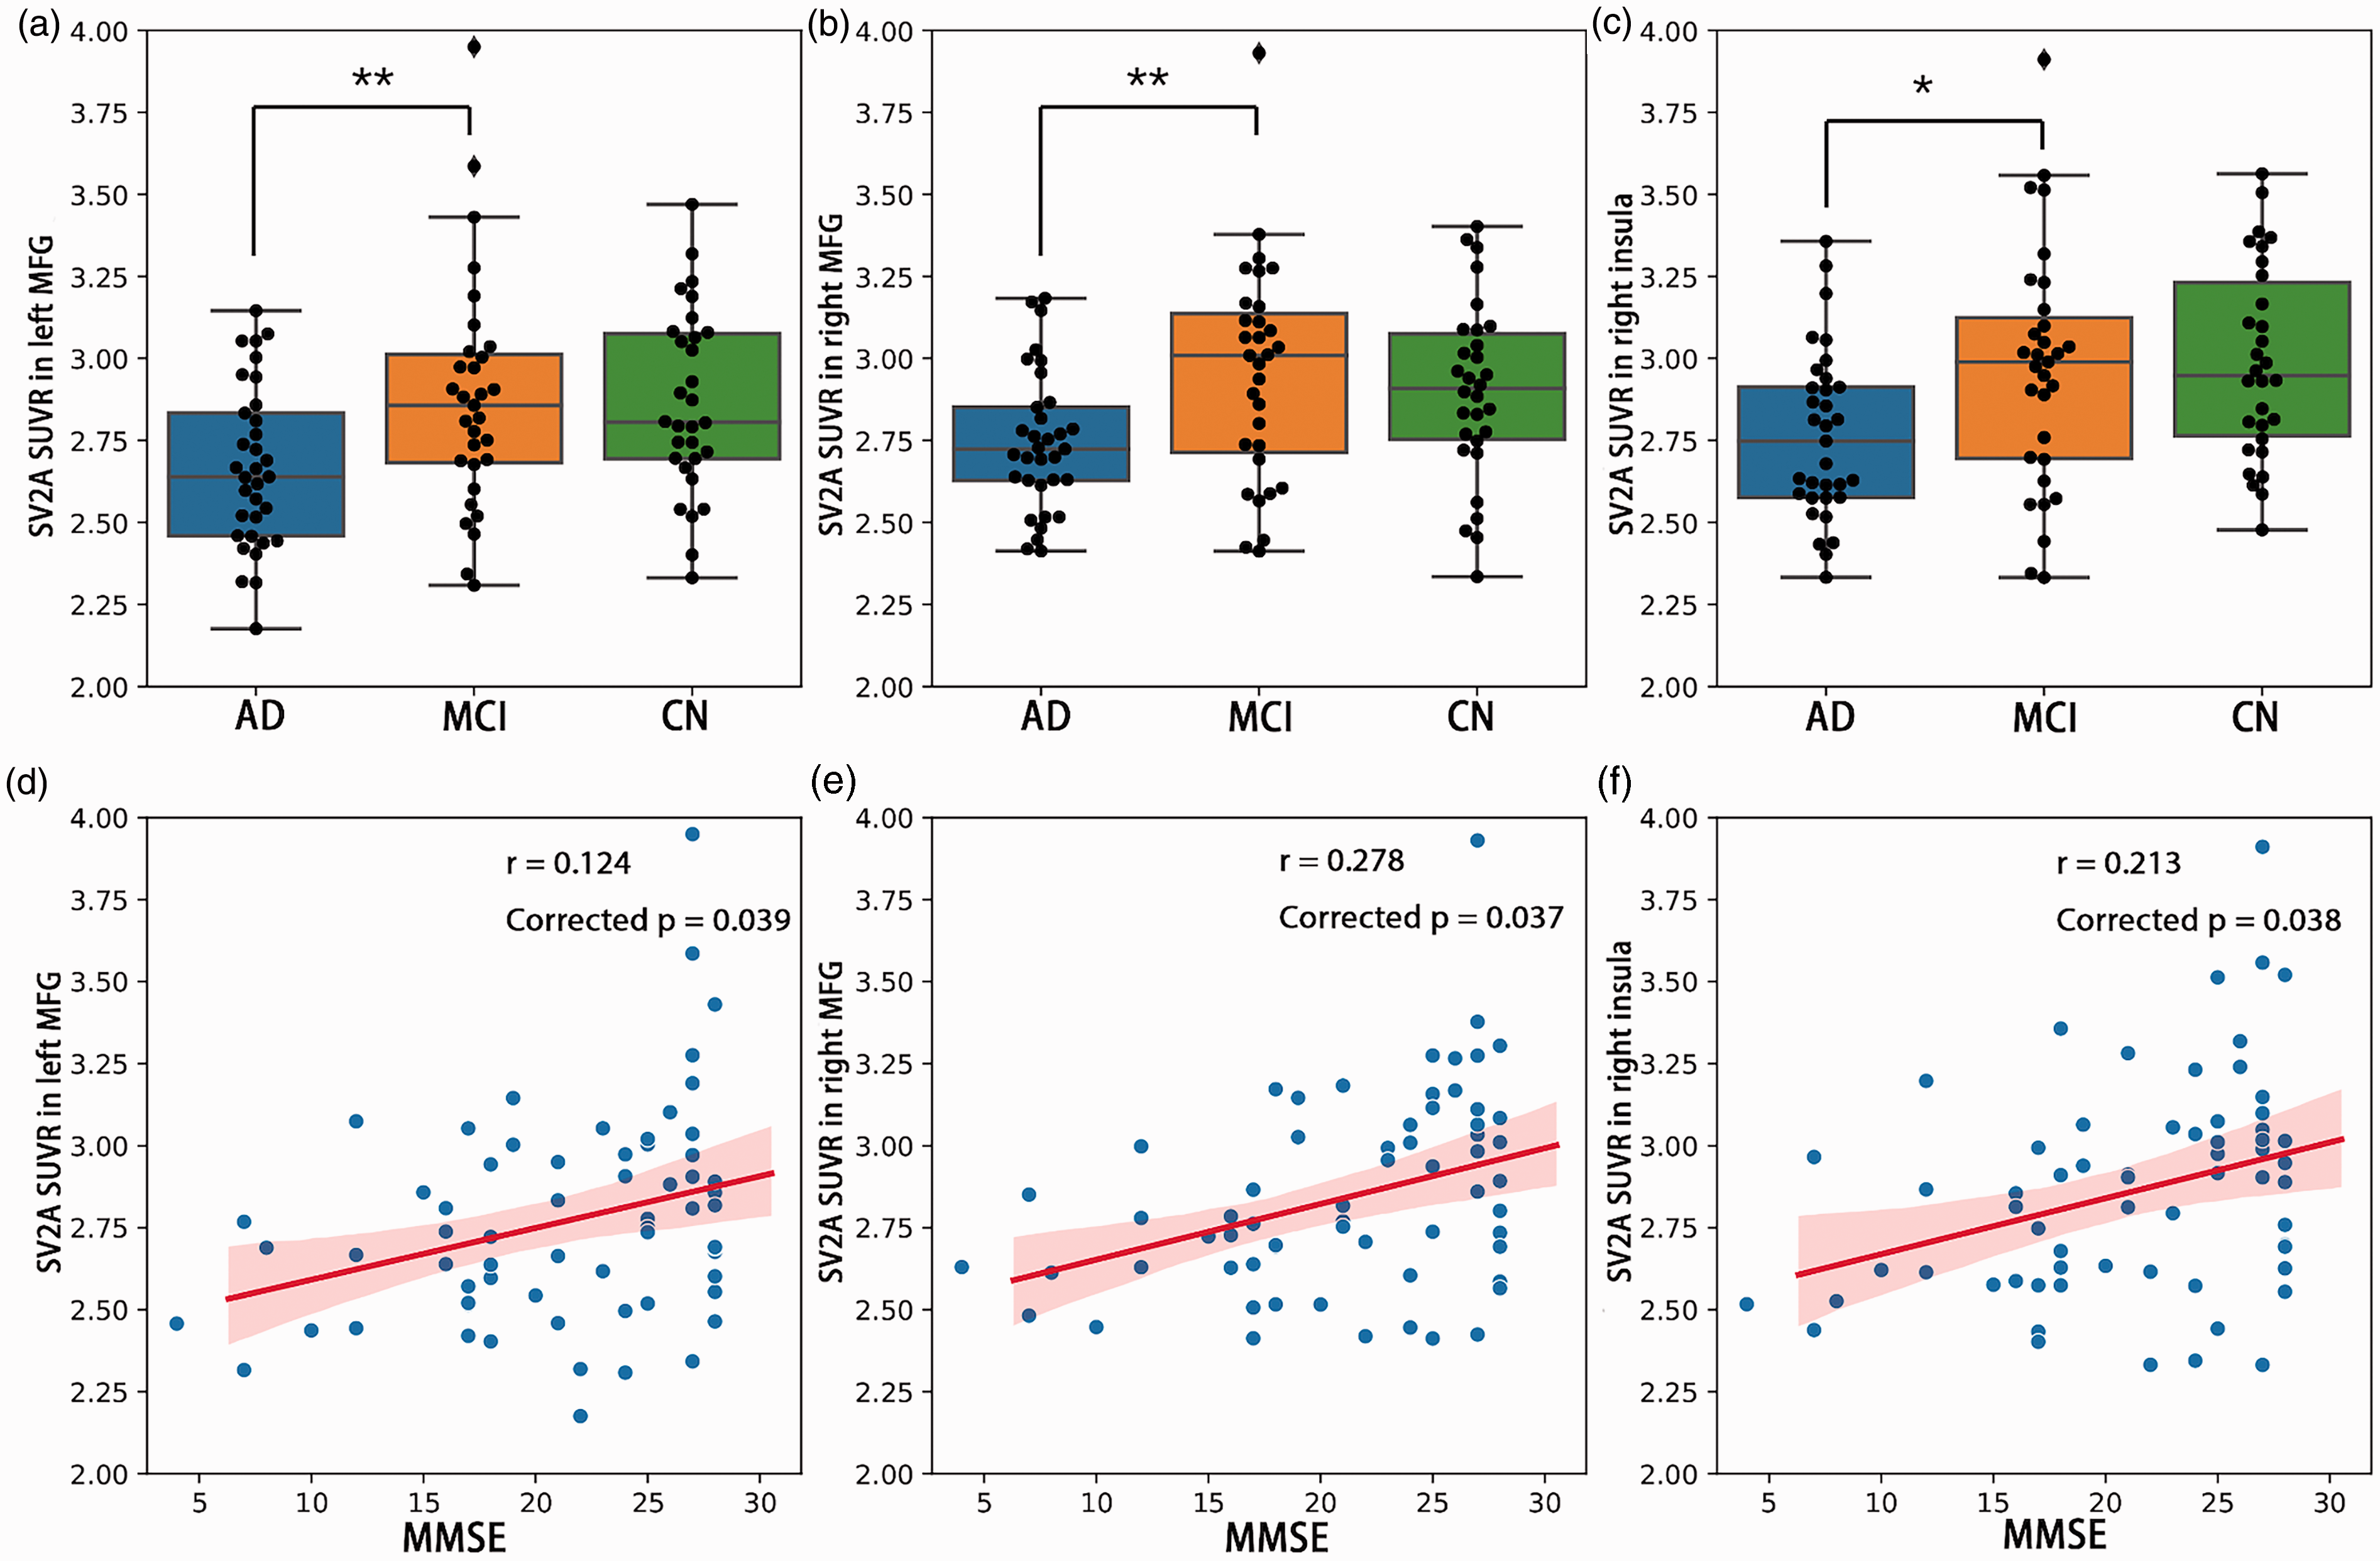
SV2A density and cognition. (a–c) Difference of SV2A SUVR in the left MFG, right MFG and right insula between AD, MCI and CN. ** p < 0.01; * p < 0.05; (d–f) Significant positive correlation between MMSE and SV2A density (SUVR) in left MFG, right MFG and right insula across clinical participants (AD and MCI). Shadow represented 95% confidential intervals. Correlations were computed using Pearson’s r, and p values were corrected by Bonferroni correction. MFG: middle frontal gyrus; AD: Alzheimer’s disease; MCI: mild cognitive impairment; CN: controls; MMSE: mini-mental state examination.
In an exploratory manner, we investigated the associations between synaptic density and specific cognitive domains including AVLT, BNT and STT. The memory and naming tests were significantly correlated with synaptic density in three seeds respectively (AVLT – right insular cortex: r = 0.279, p = 0.016; rMFG: r = 0.282, p = 0.016; lMFG: r = 0.259, p = 0.026; BNT – right insular cortex: r = 0.281, p = 0.017; rMFG: r = 0.262, p = 0.025; lMFG: r = 0.257, p = 0.029). No association was observed between synaptic density and STT. The mean synaptic density of the three seeds were extracted respectively for the following FC analysis.
Synaptic density associated functional connectivity and cognitive function
Using the right insular cortex, rMFG and lMFG as seeds respectively, we observed a significant positive correlation between rMFG-bilateral superior frontal gyrus (rMFG-SFG) connectivity and synaptic density in the rMFG across all participants (r = 0.607, p < 0.001; Figure 3(a) and (b)). We also observed a significant positive correlation between lMFG – left inferior frontal gyrus (lIFG) connectivity and synaptic density in the lMFG across all participants (r = 0.667, p < 0.001, Figure 3(c) and (d)). The correlations remained significant in clinical subjects including AD and MCI (rMFG-SFG: r = 0.609, p < 0.001; lMFG-lIFG: r = 0.732, p < 0.001).
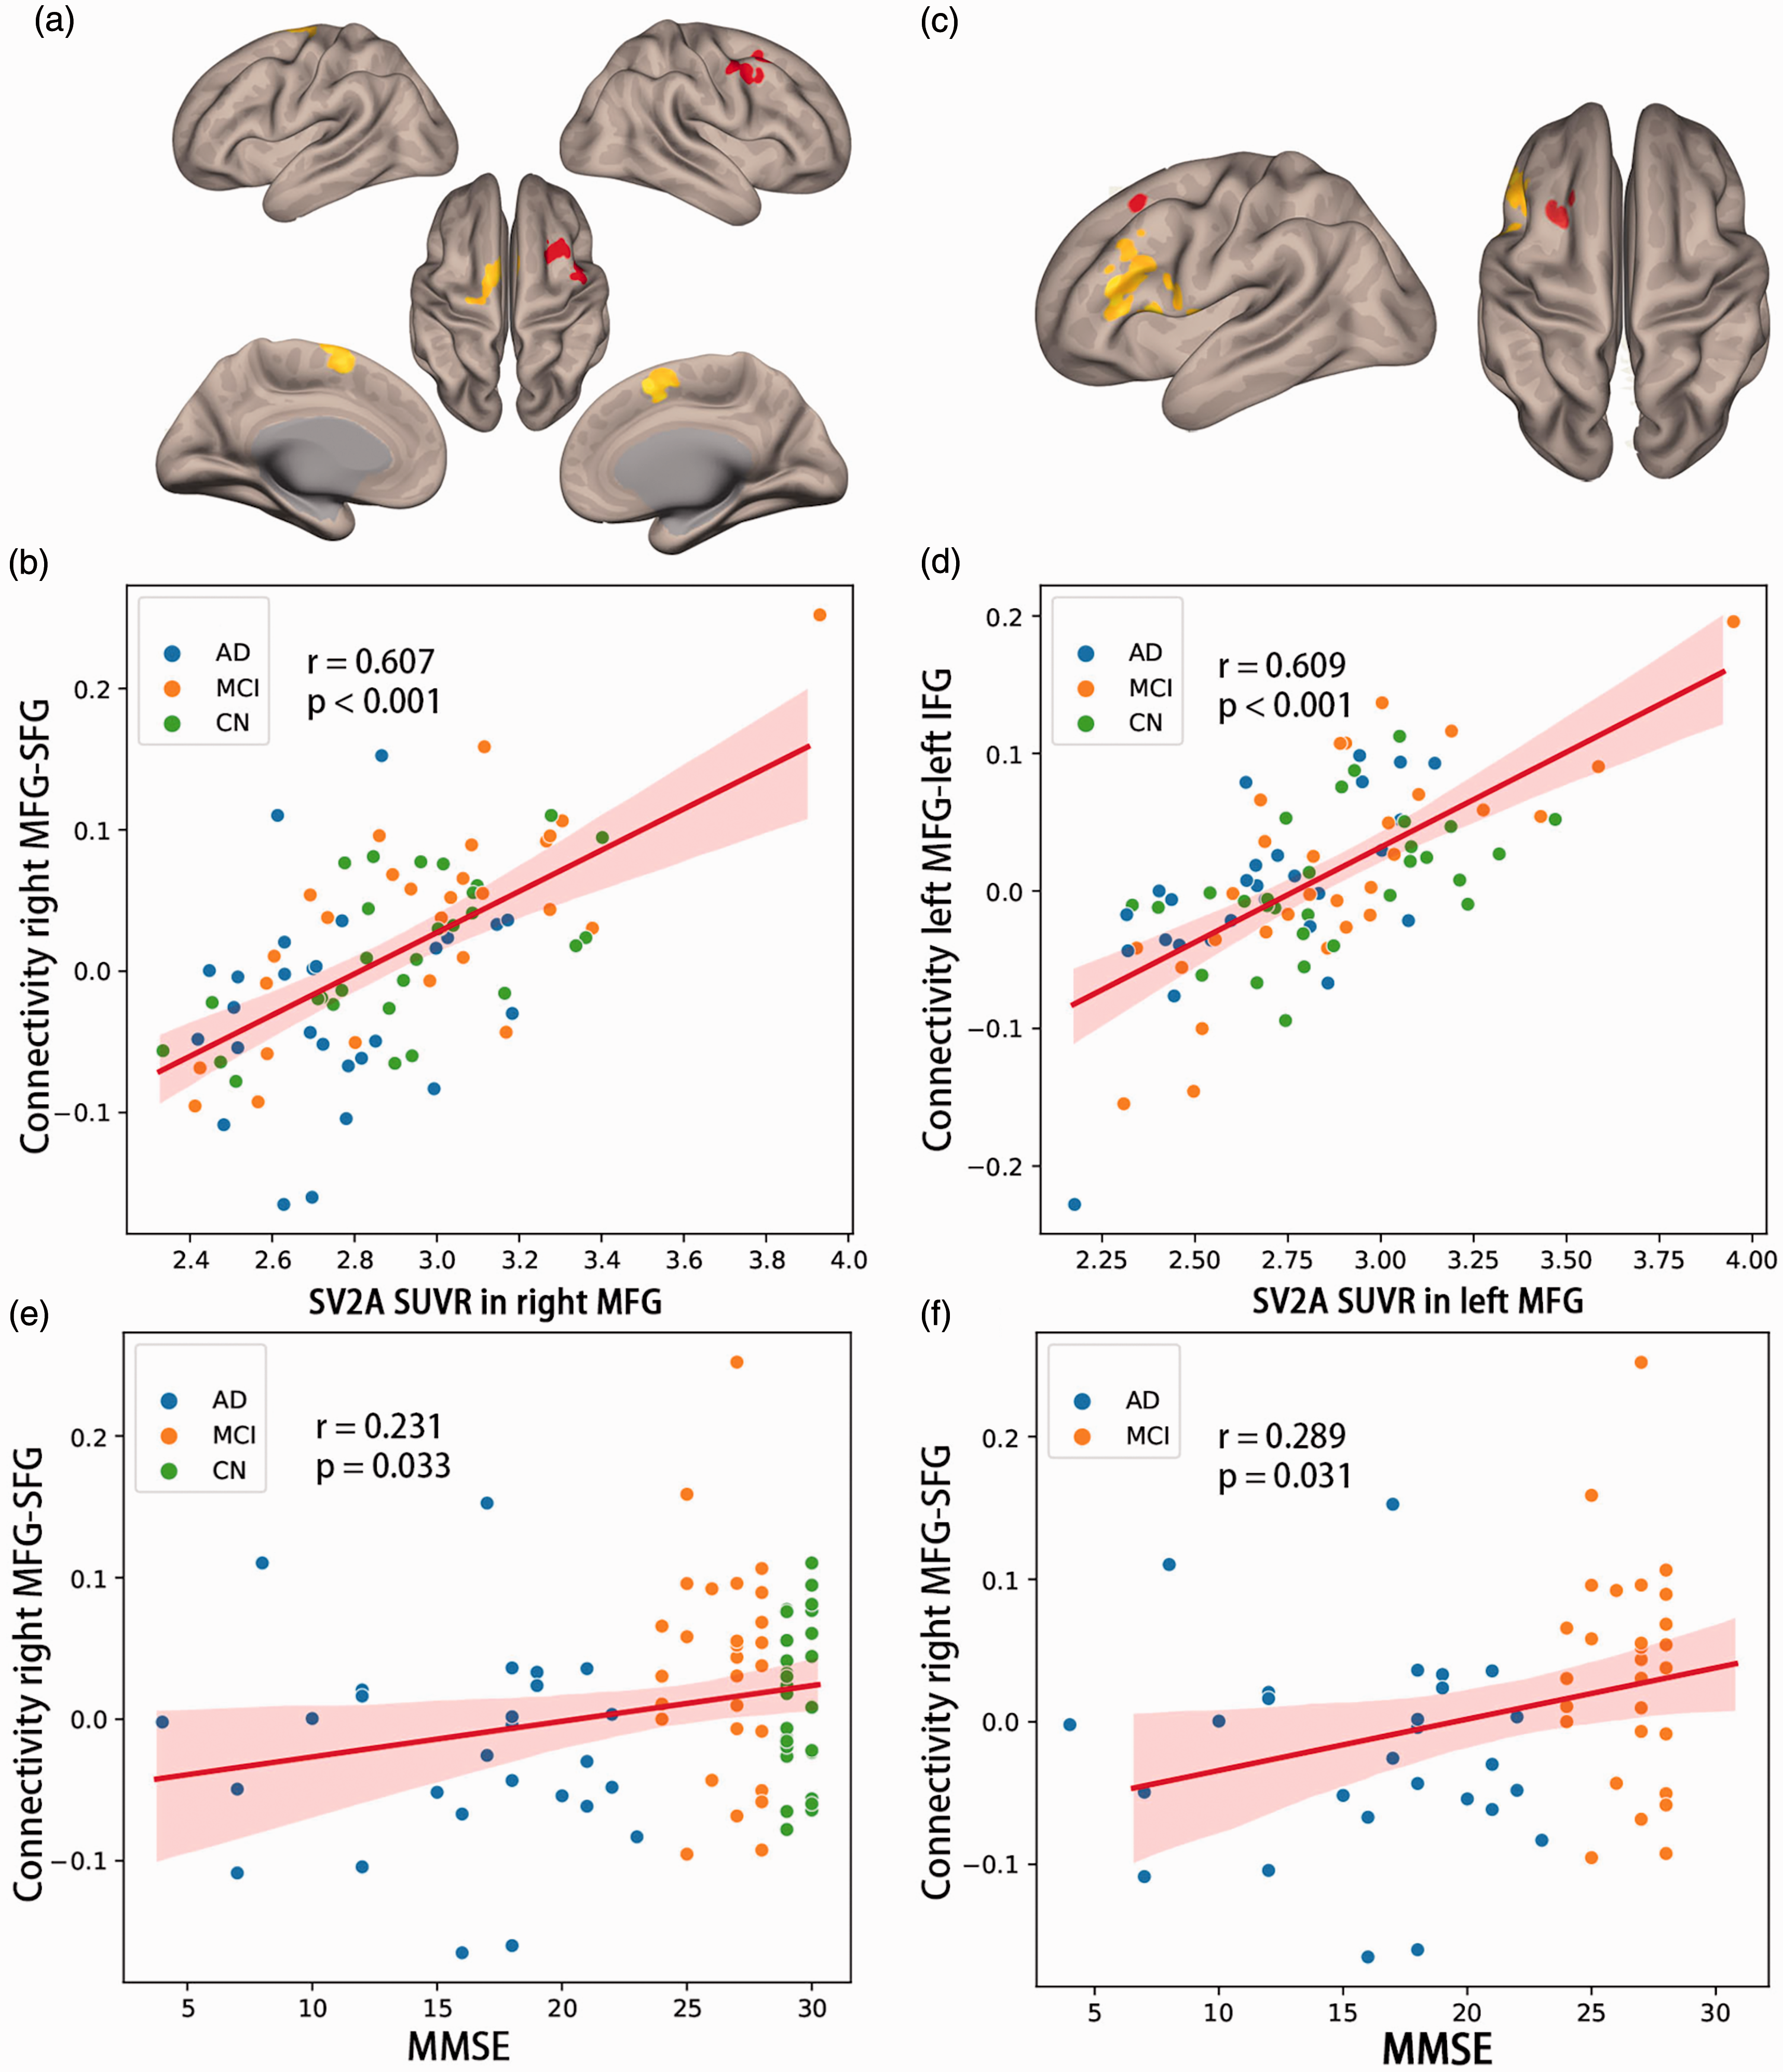
Functional connectivity, SV2A density and cognition. (a) The right MFG ROI was shown in red and the SFG ROI was shown in yellow. (b) Functional connectivity between right MFG and SFG was positively correlated with SV2A density (SUVR) in right MFG. (c) The left MFG ROI was in red and left IFG ROI was in yellow. (d) Functional connectivity between left MFG and left IFG was positively correlated with SV2A density in left MFG. (e and f) Functional connectivity between right MFG and SFG was positively correlated with MMSE in all participants, as well as in clinical subjects (AD and MCI). Shadow represented 95% confidential intervals. Correlations were computed using Pearson’s r. MFG: middle frontal gyrus; SFG: superior frontal gyrus; AD: Alzheimer’s disease; MCI: mild cognitive impairment; CN: controls; MMSE: mini-mental state examination.
We further explored the role of synapse loss related FC in cognitive decline of AD. The AD had decreased FC than MCI (T = −2.994, p = 0.011), while the difference between MCI and CN did not reach significance (T = −1.318, p = 0.392). The rMFG-SFG connectivity was positively associated with global cognition assessed by MMSE across all participants (r = 0.231, p = 0.033) controlling for age (Figure 3(e)). In the clinical participants only including AD and MCI, the association was still significant (r = 0.289, p = 0.031, Figure 3(f)). There were no correlations between AVLT, naming or STT tasks and rMFG-SFG connectivity measures. The lMFG-lIFG connectivity neither had significant correlation with any cognitive tests.
Structural connectivity changes in lower synaptic density regions
According to the results in FC analysis, we used tractography to track the white matter tracts between rMFG and SFG, and extracted volumes of tract (VOT), length of tract (LT) and probability of tract (POT) to present the structural connectivity between rMFG and SFG. The averaged connectivity maps in CN are shown in Figure 4(a), indicating typical patterns of connectivity from rMFG to SFG via genu of cingulate callosum or subcortical white matter. To reduce effect from individual variability, the above parameters of tracts were corrected by those of the bilateral cortico-spinal tracts. Across three groups, the FC of rMFG-SFG was positively correlated with POT (r = 0.432, p = 0.002) and LT (r = 0.272, p = 0.043). The AD had lower LT and POT than CN (T = −2.994, p = 0.011; T = −3.354, p = 0.003), with the lower POT in AD compared with MCI reaching trend significance (T = −2.182, p = 0.080, Figure 4(b)). The VOT between rMFG and SFG was similar in the three groups. Accordingly, the POT between rMFG and SFG had significant association with MMSE (r = 0.350, p = 0.001) and the association between LT and MMSE reaching trend significance (r = 0.196, p = 0.074) across all participants. In AD and MCI participants, the POT between rMFG and SFG still significantly correlated with MMSE (r = 0.389, p = 0.003, Figure 4(c)).
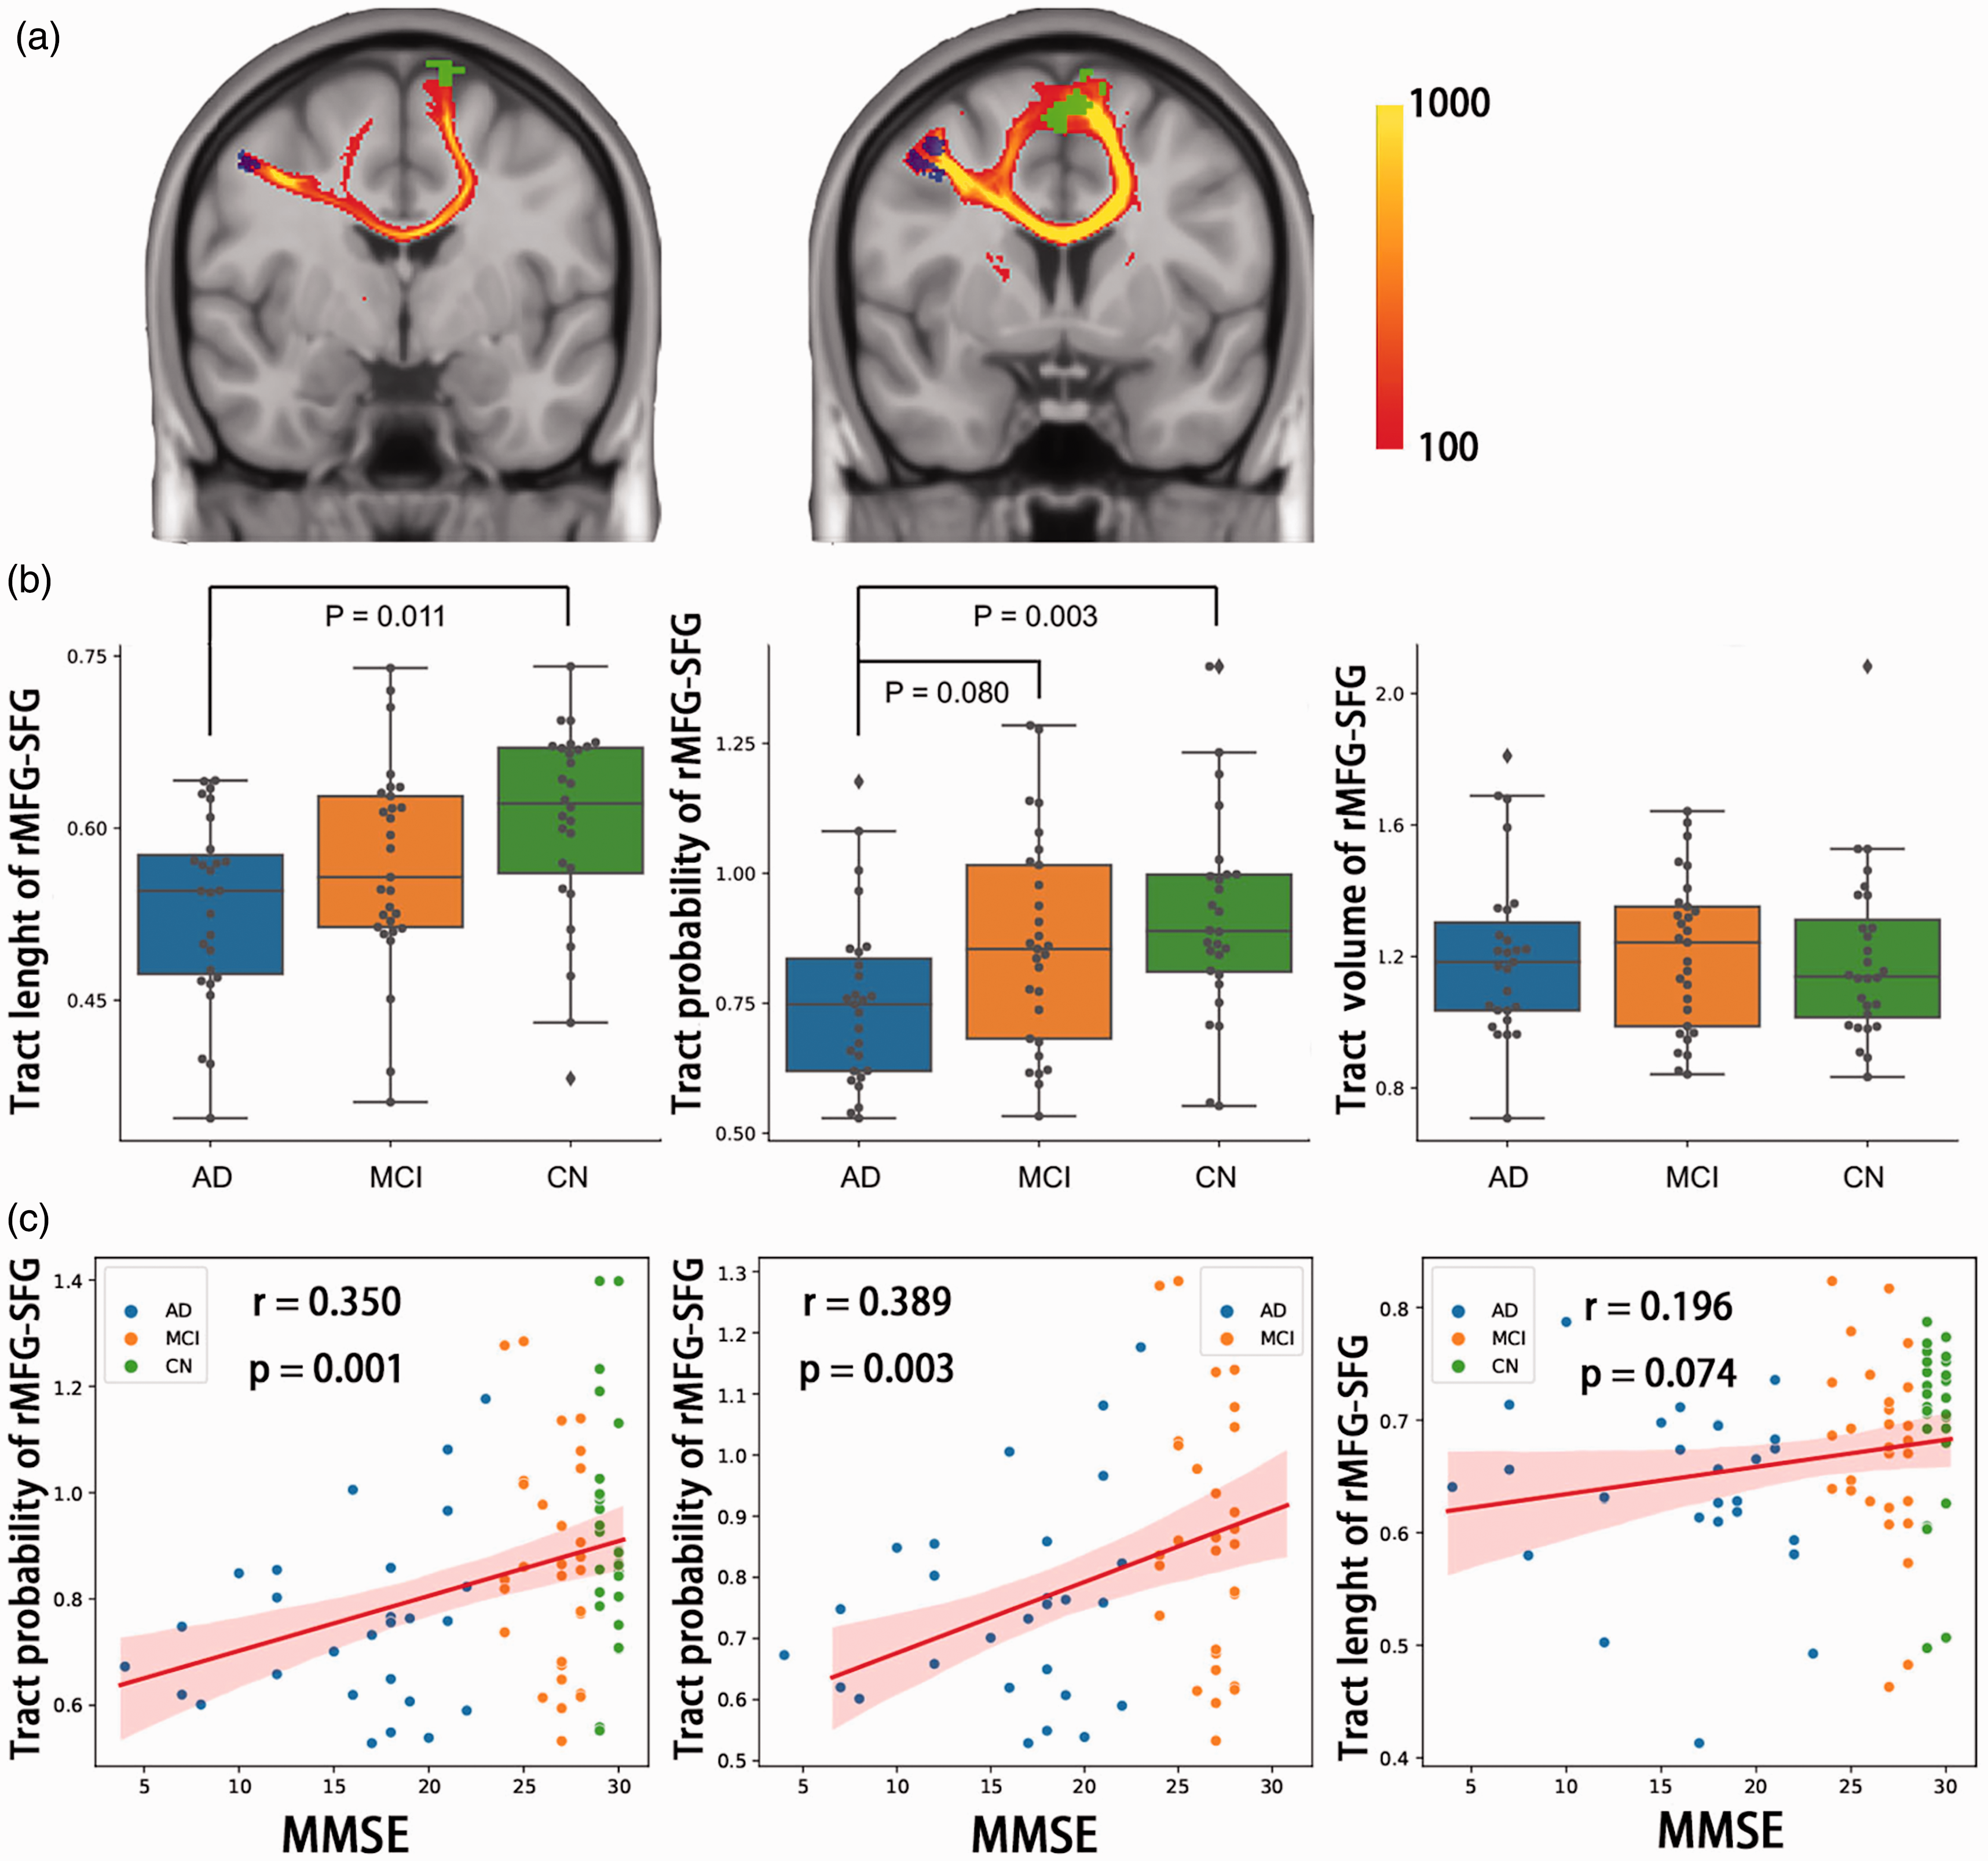
Structural tracts between groups and correlation with cognition. (a) The averaged tractography between rMFG and SFG in normal controls (n = 28). The blue area represented rMFG ROI and the green area represented SFG ROI. The SFG in the left hemisphere had tracts with rMFG via genu of cingulate callosum, while the SFG in the right hemisphere had tracts under cortex to rMFG. The color of tracts represented summed fiber probability distribution. (b) Difference of rMFG-SFG tracts between AD, MCI and controls shown by boxplot. AD had decreased length and probability of tracts than controls, and trend of decrease in tract probability than MCI and (c) Correlations between tracts and cognition by MMSE. Tract probability had positive correlation with MMSE across all participants and clinical participants (AD and MCI). The Shadow represented 95% confidential intervals. Correlations were computed using Pearson’s. rMFG: right middle frontal gyrus; SFG: superior frontal gyrus; AD: Alzheimer’s disease; MCI: mild cognitive impairment; CN: controls; MMSE: mini-mental state examination.
Discussion
In this study, we investigated the changes in synaptic density in patients with AD, and expected synapse loss to be associated with cognitive impairment. Furthermore, we expected that both functional and structural connectivity were impaired in the lower synaptic density regions identified by SV2A PET. In line with our priori hypotheses, we found lower 18F-SynVesT-1 binding in the bilateral cortex and hippocampus in AD compared to CN. Further analysis showed that the synaptic density changes in right insular cortex and bilateral caudal middle frontal gyrus were correlated with cognitive decline. Using these regions as seeds, we found that rMFG-SFG connectivity was positively associated with rMFG synaptic density. We also showed that the functional connectivity of rMFG-SFG was positively correlated with probability of tract, a quantitative measurement of structural connectivity, between rMFG and SFG, and the probability of tract was also positively associated with MMSE. It indicates that synapse loss related network impairment between rMFG and SFG includes both functional and structural connectivity. Findings of this study add to the evidence base suggesting a role for synaptic density changes in cognitive impairment in AD, which was related to both functional and structural network alterations.
Our results confirm the previous findings that AD patients had significantly lower SV2A binding in cortical and hippocampal regions compared with cognitively normal participants.22,36 Considering that grey matter volume reductions were already present in patients with MCI compared to CN,12,22 we employed corrections for partial volume effects when analyzing the PET data. 37 We also regressed out the cortical thickness and hippocampus volumes trying to take those confounding factors into account when performing GLM analysis. After controlling for confounders including age and sex, fourteen clusters survived. These findings confirmed that the significant clusters cannot be explained only by loss of grey matter volume or aging. In a small sample size (AD, n = 10; CN, n = 11) study, Chen et al. first reported AD patients had significant reduction in hippocampal SV2A specific binding compared with CN using 11C-UCB-J. 36 After increasing the sample size (AD, n = 34; CN, n = 19), their group observed a broad pattern of reduction in synaptic density in medial temporal and neocortical brain regions. 22 Another SV2A PET study using 18F-UCB-H (AD or MCI, n = 24; CN, n = 19) also found predominant synapse loss in hippocampus. 38 In a study comparing amnestic MCI (n = 10) with CN (n = 10), Vanhaute et al. showed decreased synaptic density mainly in substructures of the medial temporal lobe. 12 The results of our present study using 18F-SynVesT-1 with relatively large sample size and wide range of disease stages (AD, n = 33; MCI, n = 31; CN, n = 30) were generally consistent with those previous studies.
Our findings validated the previous neuropathologic studies and SV2A PET imaging studies that synaptic density was significantly related to cognitive performance. Early biopsy or postmortem human studies largely examined AD patients at moderate to severe stages. Those studies demonstrated synapse loss as a major pathological marker that correlated with cognitive impairment in AD, and the synapse loss was observed in frontal cortex, 7 midfrontal and inferior parietal regions 8 and hippocampus. 39 However, the invasive method impedes the further validation of the results in larger sample size, and the limited brain regions targeted hinders a comprehensive understanding of synaptic change in the whole brain. In recent synaptic PET imaging studies, a preliminary report using 11C-UCB-J first observed that synaptic density in hippocampus was related to a composite episodic memory score in AD and CN participants (n = 21). 36 Further study showed that global synaptic density was positively associated with global cognition and performance on five individual cognitive domains in early AD patients (n = 45). 15 Another group using SV2A ligand 18F-UCB-H reported reduced hippocampal synaptic density was related to cognitive decline (MMSE score) in 24 AD patients. 38 In the present study, we found SV2A 18F-SynVesT-1 binding was positively related to global cognition (MMSE score) in right insular cortex, right caudal middle frontal gyrus and left caudal middle frontal cortex after controlling for age and sex. We further explored the relationship between synaptic density and specific cognitive domains, and found that memory (AVLT) and naming (BNT) tests were positively correlated with synaptic density in those clusters. Future longitudinal studies will help to validate those findings, and further assess the temporal relationships between synapse loss in different brain regions and cognitive decline in different cognitive domains.
Large amounts of evidence have suggested that the brain functional and structural connectivity were impaired in AD.40–42 However, whether synapse loss relates to functional and structural connectivity impairment, is unclear. In the present study, we use right insular cortex, rMFG and lMFG as seeds respectively, which significantly related to cognitive performance. We found that rMFG-SFG connectivity was positively associated with rMFG synaptic density and global cognitive function. It suggests that the altered functional connectivity between rMFG-SFG may be driven by synapse loss. Moreover, we found that the probability of tract between rMFG and SFG was positively associated with cognitive impairment assessed by MMSE, indicating that the altered network between rMFG and SFG related to synaptic loss also includes structural connectivity impairment. Those findings raised the possibility that synapse loss may impair both functional and structural connectivity in Alzheimer’s Disease. However, the cross-sectional design of the present study and the lack of other important biomarkers assessed together, especially the tau PET, 43 precluded the inference on the causal relationship between synapse loss and network alterations. It is possible that the tau deposition confounds the relationship between synapse loss and functional and structural connectivity, or tau deposition and synapse loss may have synergistic effect on the dysfunction of functional and structural connectivity. In a preliminary study, Vanhaute et al. found that synapse loss, assessed using 11C-UCB-J, was related to tau deposition in medial temporal lobe in amnestic MCI participants. 12 In a 2-year follow-up study, Vanderlinden et al. observed the synaptic loss followed the specific tau build-up pattern, indicating that the accumulation of tau might drive synaptic vulnerability. 17 Our results justify further studies to clarify the relationship between synapse loss, tau deposition and network dysfunction.
In the current study, we observed the correlation between synaptic density measured with SV2A PET and both functional and structural connectivity measured with MRI in associative frontal cortices. Although the canonical pattern of cortical involvement in AD was temporo-parietal-predominant, the involvement of frontal cortices in AD was widely observed. 44 Strom and colleagues reported the FDG abnormalities in the dorsolateral prefrontal regions (DLPFC) in two cohorts with symptomatic Alzheimer’s disease. 44 It is worth noting that the DLPFC lies in the middle frontal gyrus (MFG) which was the main region reported in the current study. Besides, the positive association between frontal SV2A density in MFG and MMSE in the clinical participants in the current study justifies the role of frontal cortices in AD.
We found the right insular cortex as a major site of synaptic density loss in AD. To validate our procedures, we confirmed the association between hippocampal SV2A SUVR and cognition in clinical participants. Although the role of insular cortex involved in AD was less reported in the literature, pathological study suggested cortical neurofibrillary tangles and neuritic plaques in the insular cortex in AD patients. 45 Moreover, the MRI studies showed insular gray matter loss, 46 abnormal insular activities, 47 and disrupted insular network in the early stage of AD. 48 Future studies are needed to further explore the role of insular cortex in AD.
We used cerebellum as a reference region to analyze the SV2A PET data in the present study. Although many SV2A PET studies in human chose centrum semiovale as reference region due to its lowest SV2A specific binding in the white matter,12,15 it may show too much variance for practical utility in AD. 22 On the contrary, the standard segmentation of cerebellum in several software and pipelines29,49 would reduce the variance in the data process and analysis. Moreover, Mecca et al. evaluated the suitability of cerebellum and centrum semiovale as reference regions and found evidence to support the validity of both reference regions. 22 In addition, when assessing the variability of the SV2A uptake in the cerebellum, we showed similar SV2A uptake and standard deviation between groups. Further studies would help to explore and verify the optimal region as a reference.
There are limitations in the present study. First, the cross-sectional design precluded the inference on causal link between synapse loss and connectivity dysfunction in AD. Many confounding factors may result in inter-individual variability in synaptic density and neuropsychological performance. Longitudinal studies are needed to clarify the causal relationship between synaptic density and connectivity function. Second, we used a simplified reference tissue approach for tracer quantification. Although 1-tissue-compartment (1TC) model was best for quantitative kinetic analysis of 18F-SynVesT-1 imaging data, SUVR from 60 to 90 min after tracer injection was validated to provide excellent match with 1TC binding potential (BPND) of 18F-SynVesT-1 and could be used as a surrogate quantitative measurement of specific binding without invasive arterial sampling procedures. 19 The simplified procedure will facilitate the broaden use of SV2A PET in multicentre clinical studies. Third, although we found the structural connectivity impairment in lower synaptic density regions, we cannot rule out the possibility that the structural connectivity was widely impaired in AD and was not specific to the synapse loss.
In summary, we observed that AD had lower synaptic density in the bilateral cortex and hippocampus compared to controls. The synaptic density changes in right insular cortex and bilateral caudal middle frontal gyrus were correlated with cognitive decline. The right MFG-SFG functional connectivity was positively associated with right MFG synaptic density and global cognitive function, and structural connectivity between these two regions was also positively associated with cognition. These results indicate that the reduced synaptic density contributes to functional and related structural connectivity alterations underlying cognitive impairment of AD. Longitudinal studies are needed to clarify the relationship between reduced synaptic density, amyloid and tau deposition, functional and structural network alterations, and cognitive change.
Supplemental Material
sj-pdf-1-jcb-10.1177_0271678X231153730 - Supplemental material for In vivo synaptic density loss correlates with impaired functional and related structural connectivity in Alzheimer’s disease
Supplemental material, sj-pdf-1-jcb-10.1177_0271678X231153730 for In vivo synaptic density loss correlates with impaired functional and related structural connectivity in Alzheimer’s disease by Junfang Zhang, Jie Wang, Xiaomeng Xu, Zhiwen You, Qi Huang, Yiyun Huang, Qihao Guo, Yihui Guan, Jun Zhao, Jun Liu, Wei Xu, Yulei Deng, Fang Xie and Binyin Li in Journal of Cerebral Blood Flow & Metabolism
Footnotes
Funding
The author(s) disclosed receipt of the following financial support for the research, authorship, and/or publication of this article: This study was supported by National Natural Science Foundation of China (82271441,82071962, 82171473, 81871388), Shanghai Rising-Star Program (21QA1405800), National Key Research and Development Program of China, STI2030-Major Projects (2022ZD0213800), the Shanghai Municipal Science and Technology Major Project (No. 2018SHZDZX03) and ZJLab.
Acknowledgements
We would like to thank our anonymous reviewers for thoughtful comments on the manuscript. We are also grateful to all research participants. We are also grateful to all the study participants for their patience and cooperation.
Declaration of conflicting interests
The author(s) declared no potential conflicts of interest with respect to the research, authorship, and/or publication of this article.
Authors’ contributions
JZ, JW, WX, YD, FX and BL contributed to the conception and design of the study; JZ, JW, XX, ZY, QH, YH, QG, YG, JZ, JL, WX, YD, FX and BL contributed to the acquisition and analysis of data; JZ, JW, FX and BL contributed to drafting the text and preparing the figures. All authors reviewed the drafts and approved the final version of the manuscript.
Supplementary material
Supplemental material for this article is available online.
References
Supplementary Material
Please find the following supplemental material available below.
For Open Access articles published under a Creative Commons License, all supplemental material carries the same license as the article it is associated with.
For non-Open Access articles published, all supplemental material carries a non-exclusive license, and permission requests for re-use of supplemental material or any part of supplemental material shall be sent directly to the copyright owner as specified in the copyright notice associated with the article.