
Abstract
The cellular redox state is essential for inhibiting ferroptosis. Progranulin (PGRN) plays an important role in maintaining the cellular redox state after ischemic brain injury. However, the effect of PGRN on ferroptosis and its underlying mechanism after cerebral ischemia remains unclear. This study assesses whether PGRN affects ferroptosis and explores its mechanism of action on ferroptosis after cerebral ischemia. We found endogenous PGRN expression in microglia increased on day 3 after ischemia. In addition, PGRN agonists chloroquine and trehalose upregulated PGRN expression, reduced brain infarct volume, and improved neurobehavioral outcomes after cerebral ischemia compared to controls (p < 0.05). Moreover, PGRN upregulation attenuated ferroptosis by decreasing malondialdehyde and increasing Gpx4, Nrf2, and Slc7a11 expression and glutathione content (p < 0.05). Furthermore, chloroquine induced microglial lysosome PGRN release, which was associated with increased neuron survival. Our results indicate that PGRN derived from microglial lysosomes effectively inhibits ferroptosis during ischemic brain injury, identifying it as a promising target for ischemic stroke therapy.
Introduction
Neuronal necrosis and apoptosis play an important role in the acute stage of cerebral ischemia.1,2 However, attempts to reduce neuronal necrosis and apoptosis caused by cerebral ischemia in clinical experiments failed, suggesting that other forms and mechanisms of neuronal death also play a key role. Inactivation of phospholipid peroxidase glutathione peroxidase 4 (GPX4) and depletion of glutathione (GSH) increases lipid peroxidation accumulation, ultimately leading to ferroptosis. 3 Iron accumulation exacerbates neuronal damage in clinical and animal models of ischemic stroke and iron chelation and vice versa. 4 Recent studies have shown that ferroptosis inhibition improved neurological functional recovery in a mouse model of middle cerebral artery occlusion (MCAO). Pharmacological selenium (Se) treatment increased GPX4 and transcription factors AP-2 Gamma (TFAP2C) and SP1 activation, inhibiting ferroptosis and improving functional recovery after stroke.5,6 Lipid peroxidation inhibition suppresses ferroptosis in neuronal cells and pro-inflammatory microglia activation induced by inflammation, suggesting that targeting ferroptosis may be a promising therapeutic strategy in neurological diseases. 7 In addition, ferroptosis is associated with neuroinflammation after ischemic stroke, induced by the release of pro-inflammatory factors. 8 Activated immune cells cooperate with these factors to produce reactive oxygen species (ROS) and initiate lipid peroxidation. 9 Microglia are considered the cardinal immune cells in the brain and become activated after ischemic stroke. However, their role in ferroptosis after stroke remains unclear.
Progranulin (PGRN) is a glycoprotein encoded by the GRN gene and expressed in multiple cell types, including neurons, microglia, endothelial cells, and astrocytes. 10 It has strong neurotrophic11,12 and anti-inflammatory13–15 properties. Basal expression and secretion of PGRN in microglia are relatively low. However, PGRN expression significantly increased after microglia activation, playing a role in neuronal function and synaptic density. 16 PGRN is also a neurotrophic factor that enhances neuronal survival and axonal outgrowth, 17 suggesting that PGRN acts as an exogenous trophic factor. Microglia and monocyte-derived macrophages are the primary cellular PGRN sources, whose levels are elevated at the appropriate time and influence neuronal survival and repair after injury. 18 PGRN can modulate secondary injury and subsequent repair or regeneration.
PGRN plays a critical role in the lysosome and regulates secretory vesicle exocytosis. 19 In the microglia, PGRN loss leads to increased activity of transcription Factor EB (TFEB), inducing cell degradation and lysosomal storage disorder. 20 With complete PGRN loss, microglial phagocytosis and pro-inflammatory factor secretion can increase, resulting in further neuron loss. 21 Motivated by these findings, we explore the intracellular source and the effect of PGRN on ferroptosis after ischemic stroke.
Materials and methods
Experiment design
Animal experimental procedures were approved by the Institutional Animal Care and Use Committee (IACUC) of Shanghai Jiao Tong University, Shanghai, China. All studies were performed in accordance with the US National Research Council’s guide for the care and use of laboratory animals and the US Public Health Service’s policy on humane care and use of laboratory animals and guide for the care and use of laboratory animals. This study is reported according to the animal research reporting of in vivo experiments (ARRIVE) guidelines. Age- and weight-matched male Institute of Cancer Research (ICR) mice (n = 105; 25–30 g; 6–8 weeks) were obtained from Vital River Laboratories (Shanghai, China). Mice were randomly divided into four groups: (1) transient MCAO (tMCAO) mice treated with saline as control; (2) tMCAO mice treated with 20 mg/kg chloroquine (Chq; C6628-25G; Sigma-Aldrich; St. Louis, MO, USA); (3) tMCAO mice treated with 1 g/kg trehalose (Treh; T9531-25G; Sigma-Aldrich); (4) sham. Mice were treated with Chq, Treh, or saline immediately after transient ischemia. 22 Modified neurological severe score (mNSS) and grid walking test were assessed at 1, 3, 7, and 14 days after tMCAO. Mice were sacrificed 3 and 14 days after tMCAO. Each experiment was independently performed at least three times.
tMCAO surgery in mice
Surgery was performed as previously described, 23 and mice were kept anesthetized with 1.5% isoflurane and 30% O2/70% N2 mixture on a heating pad (RWD LifeScience; Shenzhen, China) throughout surgery. First, the left common, external, and internal carotid arteries were exposed and isolated with microscopic, curved tweezers. A 6-0 nylon suture (Covidien; Mansfield, MA, USA) coated with silicon was inserted 8–10 mm from the external carotid artery into the internal carotid artery. After 90 minutes of ischemia, the suture was removed for reperfusion. A laser Doppler flowmetry (Moor Instruments; Axminster, UK) was used to monitor the blood flow. The tMCAO model was considered successful if regional blood flow reached 10–20% of baseline after occlusion and returned to ≥70% after reperfusion.
Neurobehavioral test
The neurobehavioral test was performed by another investigator who was blind to the experimental groups. mNSS ranged from 0 to 12 and were recorded daily from 1 to 14 days post-tMCAO as previously described. 24 Briefly, mNSS is an evaluation system for neurological severity in which 0 indicates normal, 1–6 points indicate mild damage, and 7–12 points indicate moderate damage.
The grid walking test was used to evaluate sensorimotor function, motor coordination, and placement errors. Briefly, the mouse was placed in the center of a grid with a camera below that had the entire grid in its field of view. The movements of each mouse were monitored for 5 minutes, recording all instances when a foot did not provide support or slipped through a mesh hole as a “foot placement error.” The total number of foot errors and the number of ipsilateral foot faults were recorded.
Microglia and neuron culture
The primary microglia and neuron were isolated as previously described. 25 Briefly, the cortex was separated from the neonatal ICR mouse. Neurons were cultured for 4–6 hours with Dulbecco’s modified Eagle’s medium (DMEM; Gibco Laboratories; Carlsbad, CA, USA) with 10% (vol/vol) fetal bovine serum (FBS; Gibco Laboratories) and 0.5% (vol/vol) penicillin/streptomycin (Meilun Biotechnology; Shanghai, China), then cultured in Neurobasal A medium (Gibco Laboratories) supplemented with 2% (vol/vol) B27 (Gibco Laboratories) for 6 days in a 37°C incubator with CO2. Microglia cells were cultured in DMEM with 10%(vol/vol) FBS and 0.5% (vol/vol) penicillin/streptomycin in a 37°C incubator with CO2. After culturing for 12–14 days, microglia were gently shaken out of the mixed glia. Next, the isolated microglia were cultured with DMEM containing 10% inactivated FBS for 12 hours and then treated with 50 µM Chq, 100 µM Treh, 100 µM Gly-Phe beta-naphthylamide (GPN; Abcam; Cambridge, UK), and vehicle.
Oxygen-glucose deprivation in cell culture
The oxygen-glucose deprivation (OGD) stimulation model simulates ischemia/hypoxia at the cellular level. First, cells were washed twice with phosphate-buffered saline (PBS), resuspended in a glucose-free culture solution without FBS, and placed in the OGD device. After the chamber was filled with 95% N2 and 5% CO2, the device was placed at 37°C to create the effect of oxygen and glucose deprivation. After 1 hour of OGD, microglia were cultured in DMEM containing 10% inactivated FBS, and neurons were cultured in Neurobasal-A medium containing 2% B27. The cells were then reoxygenated in a CO2 incubator at 37°C for at least 12 hours.
Immunohistochemistry and immunocytochemistry
Frozen sections were fixed with a 4% paraformaldehyde solution for 10 minutes, incubated with 0.3% Triton-X100 for 10 minutes, and then blocked with 1% bovine serum albumin (BSA) for 60 minutes in preparation for immunohistochemistry. After blocking, the sections were incubated with 1:200 dilutions of primary antibodies against PGRN (R&D Systems; Minneapolis, MN, USA), ionized calcium-binding adapter molecule 1 (IBA1; Novusbio; Centennial, CO, USA), microtubule-associated protein 2 (MAP2; Millipore; Burlington, MA, USA), glial fibrillary acidic protein (GFAP; Millipore), and lysosomal associated membrane proteins 1 (LAMP1; Abcam) and 2 (LAMP2; Millipore) for 16 hours at 4°C. The sections were washed three times with PBS (pH 7.4) at 5 minutes each, then incubated with corresponding secondary antibodies for 60 minutes in an incubator at 37°C. Labeled sections were observed under a TCS SP5 Confocal Scanning System (Leica; Wetzlar, Germany).
Cells were fixed with −20°C methanol for 3 minutes, then blocked by BSA solution for 60 minutes in preparation for immunocytochemistry. Its subsequent steps were identical to those described above for immunohistochemistry on the frozen section.
Four fields of the peri-infarct area per brain slice were randomly selected, and the number of cells was counted. Three brain slices were randomly selected for immunostaining and statistics from three randomly chosen mice in each group.
Measurements of brain infarct and atrophy volume
Mice were sacrificed 3 and 14 days after tMCAO. Mice sacrificed on day 3 had their heart perfused with PBS and brain directly removed, frozen in isopentane, and stored at −80°C until sectioning. Samples were cut into 20 µm slices from the corpus callosum to the hippocampus and placed on slides. Mice sacrificed on day 14 had their heart perfused with PBS and 4% paraformaldehyde and brain removed, fixed with 4% paraformaldehyde at 4°C for 4–6 hours, and dehydrated in a 30% sucrose solution. Once the brain was dehydrated, it was cut into 30 µm slices and stored in antifreeze. Sliced samples were used for cresyl violet staining. The infarct and atrophy areas were measured using Image J software (US National Institutes of Health; Bethesda, MD, USA). Infarct size after correction of edema = contralateral area – normal area of the affected hemisphere. The formula for the infarct volume (V) between two adjacent sections was as follows:
Western blotting analysis
Ischemic brain tissue was placed in a protein lysis solution, homogenized with a tissue grinder, and its supernatant was collected by centrifugation at 12,000 g. The protein concentration was determined with a bicinchoninic acid assay (BCA) kit (Meilun Biotechnology) to standardize the same amount of protein applied to 10% polyacrylamide electrophoretic gels. After electrophoresis, proteins were transferred to polyvinylidene fluoride (PVDF) membranes (Merck; Darmstadt, Germany). Next, the PVDF membranes were then incubated with protein-free rapid blocking buffer (Epizyme Biotech; Shanghai, China) for 15 minutes at room temperature. Then, they were incubated with primary antibodies against PGRN, GPX4, and β-actin (ACTB) 4°C overnight and washed three times with Tris-buffered saline with 0.1% Tween 20 (TBST) for 10 minutes. The PVDF membrane was then incubated with the corresponding horseradish peroxidase (HRP)-conjugated secondary antibodies at room temperature for 1 hour. After washing three times with TBST, they were visualized using an enhanced chemiluminescence kit (ECL) and quantified using the Image J software.
Real-time quantitative PCR
Total RNA was extracted from the affected brain tissue with Trizol reagent. RNA concentration was measured using a Nanodrop 1000 spectrophotometer (Thermo Fisher Scientific; Waltham, MA, USA). Next, a standardized quantity of RNA was reverse transcribed into complementary DNA (cDNA) using a cDNA synthesis kit (Yeasen; Shanghai, China) for each sample. Then, a two-step real-time quantitative PCR (RT-qPCR) process using qPCR SYBR Green Master Mix (Yeasen) was used to quantify gene expression with glyceraldehyde 3-phosphate dehydrogenase (Gapdh) as the endogenous control. The RT-qPCR primer sequences are listed in Table 1.
RT-qPCR primer sequences.
GSH assay
Total GSH content was quantified with a total GSH assay kit (Epizyme Biotech). A tissue grinder was used to fully homogenize ∼30 mg of brain tissue in protein removal reagent solution, and the supernatant was collected by centrifugation at 10,000 g. Next, the samples were mixed with the total GSH detection solution and incubated at room temperature for 25 minutes. Then, 0.5 mg/mL nicotinamide adenine dinucleotide phosphate (NADPH) solution was added, and its absorbance at 412 nm was measured immediately after mixing using a microplate reader (Bio Tek; Santa Clara, CA, USA).
Malonaldehyde level assays
The malonaldehyde (MDA) level was quantified with a lipid peroxidation MDA assay kit (Epizyme Biotech). The samples of brain tissue (10 g/100 µl) or cells (100 w cells/50 µl) were added to PBS or protein lysis solution, homogenized with a tissue grinder, and the supernatant was collected by centrifugation at 10,000 g. The sample was mixed with the MDA detection solution and incubated at 100°C for 15 minutes. After cooling to room temperature, the supernatant was centrifuged at 1000 g for 10 minutes. Then, the supernatant was added to a 96-well plate, and its absorbance at 532 nm was measured using a microplate reader.
Lipid ROS assay
Lipid ROS was quantified with the C11-BODIPY 581/591 assay (Thermo Fisher Scientific). Brain cells were isolated with the neural tissue dissociation kit (Miltenyi Biotec; San Diego, CA, USA), and then cultured in 10 µΜ C11-BODIPY 581/591 solution for 30 minutes at room temperature.
Glutathione peroxidase activity assay
Glutathione peroxidase activity was detected using Cellular Glutathione Peroxidase Assay kit (Beyotime; Shanghai, China) according to the manufacturer’s instruction. Firstly, protein sample was obtained using sample homogenization buffer. After centrifugation, 200 μl supernatant was collected and then determine the concentration of protein in each sample using the BCA Protein Assay kit (Meilun Biotechnology). GPx activity was measured by detecting the change in optical density at 340 nm following NADPH consumption in the presence of t-Bu-OOH.
Enzyme-linked immunosorbent assay (ELISA)
Cells were plated in 6-well plates in a complete medium. After 12 hours, cells were washed twice times with PBS and treated with the vehicle or drug at the indicated concentrations for 24 hours. Cell supernatants were collected and immediately spun at 10,000 g for 5 minutes at 4°C to remove debris. Mouse PGRN ELISAs were obtained from R&D Systems and performed according to the manufacturer’s protocol. All ELISA measurements were performed in triplicate and fell within the standard curve generated by the manufacturer-provided recombinant PGRN standard.
Statistical analysis
The sample size was calculated by a two-sided power analysis based on similar previously published results 26 considering an effect size of 0.5, type I error rate of 0.05, and power of 0.8. The normality of the distribution of all experimental data was assessed by Kolmogorov-Smirnov test using SPSS (IBM SPSS; Chicago, IL, USA). Prism GraphPad 9 (San Diego, CA, USA) was used for all other analyses. Intergroup comparisons of normally distributed continuous variables used a t-test (two groups) or one-way analysis of variance (ANOVA; >2 groups) and two-way ANOVA for two-factor variance analysis. Intergroup comparisons of non-normally distributed continuous variables used the Mann-Whitney U test. Data are presented as mean ± standard deviation (SD). Results with p < 0.05 were considered statistically significant.
Results
Elevated PGRN protein levels in microglia after tMCAO
We first explored PGRN protein levels at different time points after ischemic stroke using western blots, finding them to increase beginning on day 3 after tMCAO and then gradually decrease between days 7 and 14 (p < 0.05; Figure 1(a)). Next, we used immunofluorescence staining of the peri-infarct area to determine the cell types contributing to the elevated PGRN levels (Figure 1(b)). Co-staining with PGRN/MAP2, PGRN/IBA1, PGRN/GFAP, and PGRN/CD31 showed that PGRN was mainly present within MAP2+ and IBA1+ cells but not GFAP+ and CD31+ cells (Figure 1(c)). Interestingly, while PGRN levels decreased in MAP2+ cells after tMCAO, they began to increase in IBA1+ and P2RY12+ cells 1 day after tMCAO, plateauing on day 3 before gradually decreasing between days 7 and day 14 (p < 0.05; Figure 1(d) and (e)).
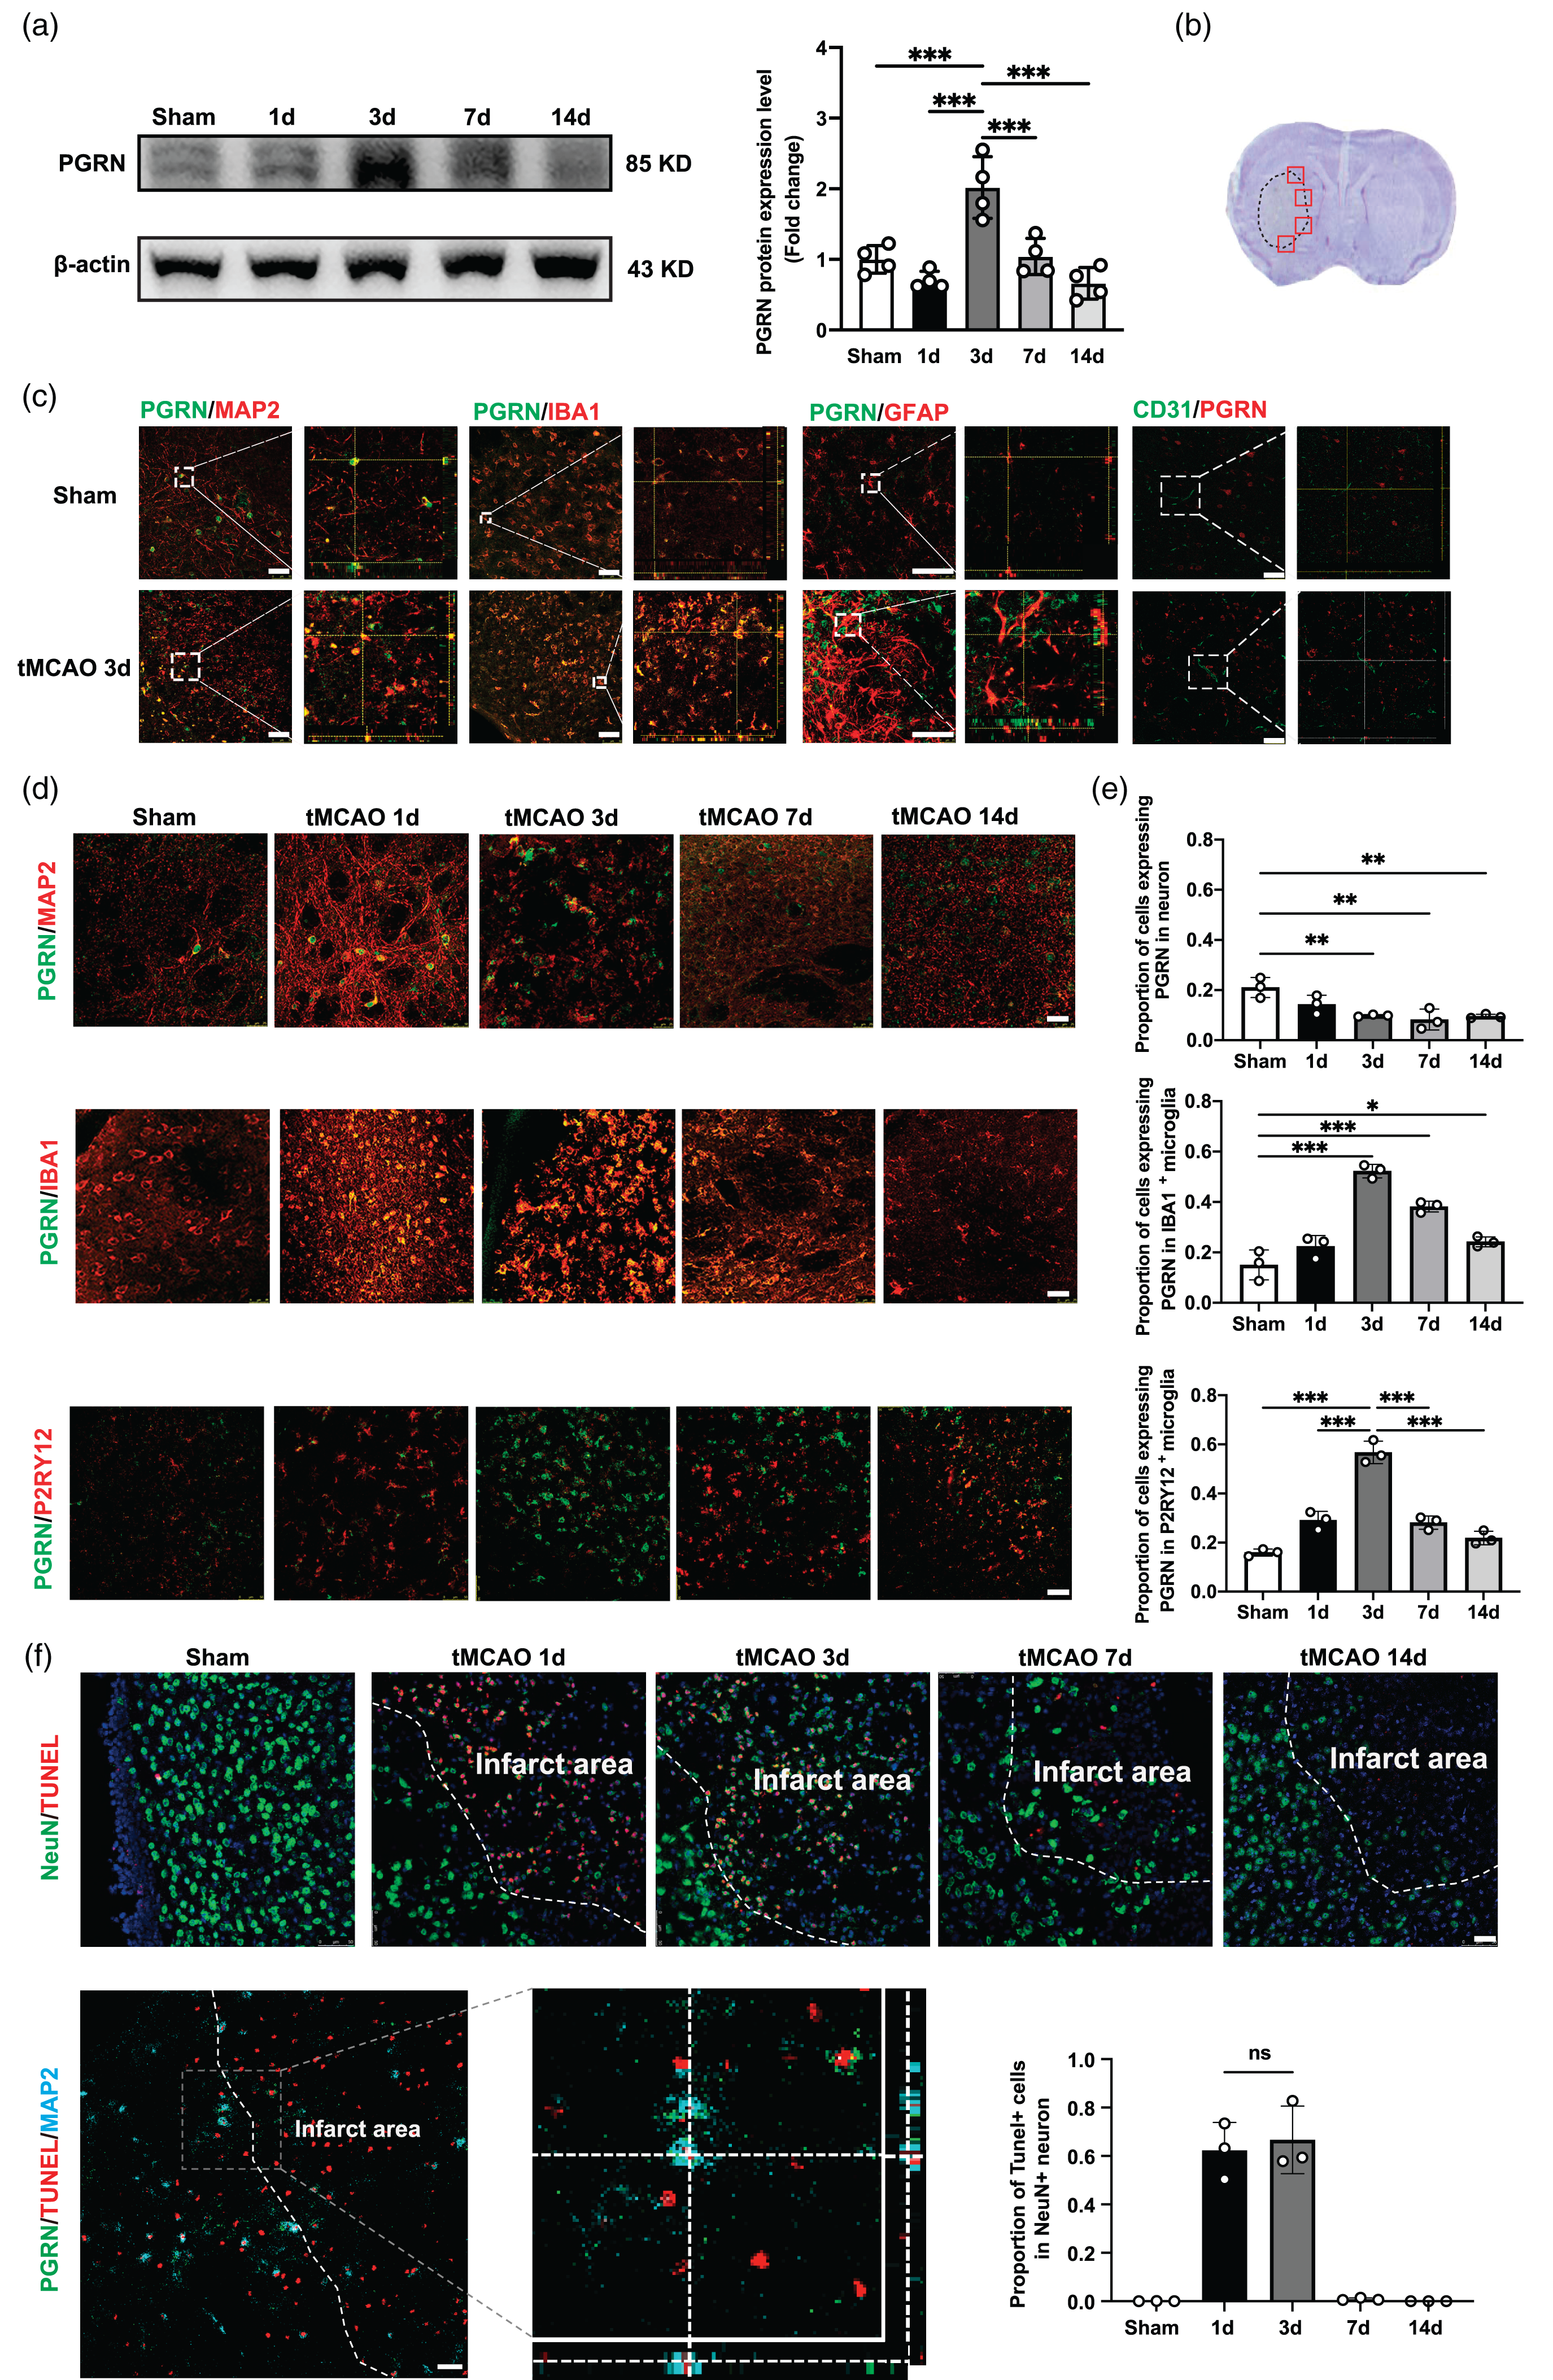
Progranulin expression increased in microglia at 3d after tMCAO. (a) Western blot and the quantification of PGRN at 1d, 3d, 7d and 14 d after tMCAO, n = 4 per group. (b) Red boxes showed the peri-infarct area for immunostaining. (c) Representative Confocal imaging showed the co-localization of PGRN (green) with neurons (MAP2, red), microglia (IBA1/P2RY12, red), astrocytesContinued.(GFAP, red) and endothelial cells (CD31, red) in the peri-infarct area at 3 days after stroke. Scale bar = 50 μm. (d) Representative Confocal imaging showed the co-localization of PGRN (green) with neurons (MAP2, red) and microglia (IBA1/P2RY12, red) at different time points after tMCAO. Scale bar = 25 μm. (e) Proportion of cells expressing PGRN in microglia and neuron at 1d, 3d, 7d and 14 d after tMCAO, n = 3 per group and (f) Representative Confocal imaging showed the co-localization of TUNEL (red) with neurons (NeuN, red) at different time points after tMCAO and co-localization of PGRN (green) with dead neurons (TUNEL/MAP2, red/blue) at 3 days after tMCAO, Scale bar = 25 μm. Proportion of TUNEL+ cells in neuron at 1d, 3d, 7d and 14 d after tMCAO (bottom right), n = 3 per group. *p < 0.05, **p < 0.01, ***p < 0.001. Data are presented as mean ± SD.
To determine whether elevated PGRN levels were due to increased expression in microglia rather than engulfment from MAP2+ cells, we performed PGRN/Tunnel/MAP2 immunofluorescence. We found that neuronal death occurred mostly on days 1 and 3 in the peri-infarct area, which did not differ between the two groups. However, while the dead neurons did not express PGRN, its expression significantly increased in microglia only at 3 days after tMCAO. These results suggest that increased PGRN expression in microglia was not due to neuronal death (Figure 1(f)), consistent with western blot data that indicates elevated PGRN levels after ischemic stroke mainly originate from microglia.
Elevated PGRN protein levels in chq- or treh-treated mice after tMCAO
We used Chq and Treh to increase PGRN expression,27,28 finding that PGRN protein (p < 0.05; Figure 2(a)) and mRNA (p < 0.05; Figure 2(b)) levels were significantly increased in the Chq- and Treh-treated groups compared to the sham and saline groups. Next, we investigated the cellular source of elevated PGRN protein levels with immunostaining, finding that PGRN expression was significantly increased after agonist treatment in microglia (p < 0.05) but not neurons (Figure 2(c)).
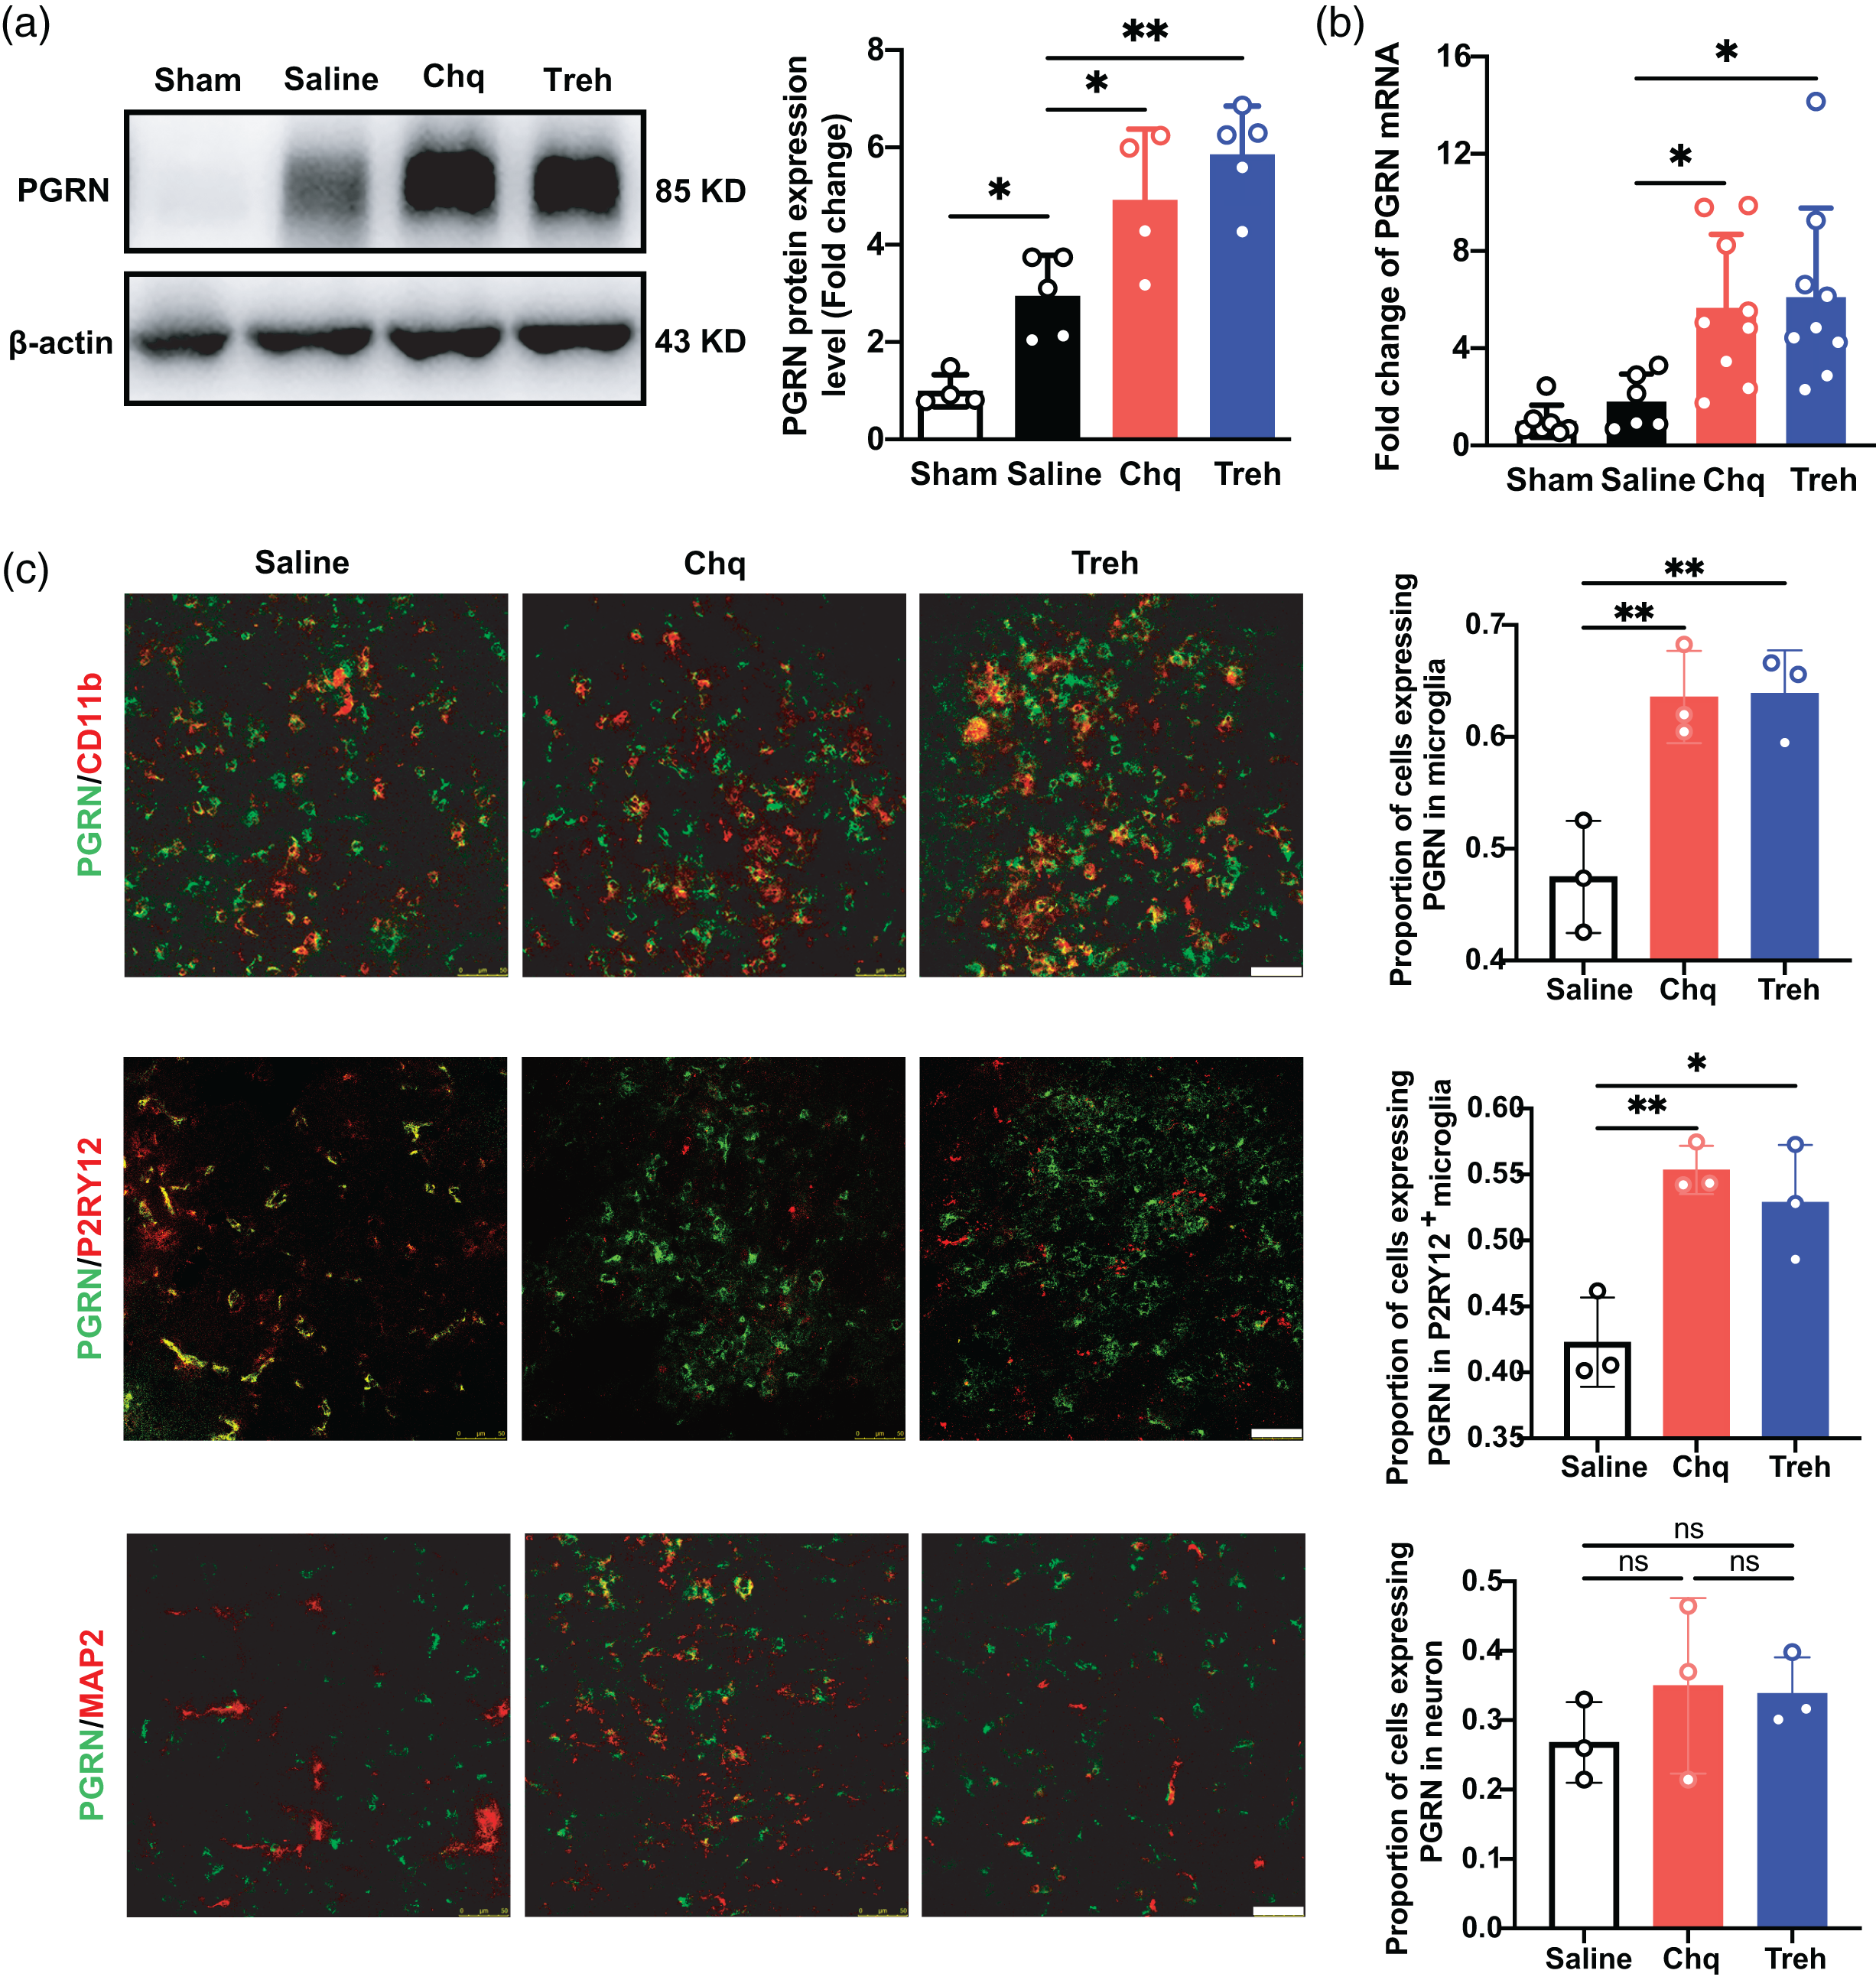
Progranulin expression increased in the chloroquine and trehalose treatment groups after tMCAO. (a) Western blot and the quantification of PGRN in sham group and saline, Chq and Treh group at 3 days after tMCAO, n = 4–5 per group. (b) Quantitative of RT-PCR analysis for the expression of PGRN in sham group and saline, Chq and Treh group at 3 days after tMCAO. n = 6–9 per group. c. Representative Confocal imaging (left) showed the co-localization of PGRN (green) with neurons (MAP2, red) and microglia (CD11b/P2RY12, red) in saline, Chq and Treh group at 3 days after tMCAO, Scale bar = 50 μm. Proportion of cells expressing PGRN in microglia and neuron (right), n = 3 per group. Data are presented as mean ± SD. *p < 0.05, **p < 0.01, ***p<0.001.
Increased PGRN reduces brain infarct volume and promotes neurobehavioral outcomes after tMCAO
We assessed the neuroprotective effect of increased PGRN expression on mice, as illustrated in Figure 3(a). We found that increased PGRN expression significantly reduced the cerebral infarct volume of mice compared with the saline group on day 3 after tMCAO (p < 0.05; Figure 3(b)) and brain atrophy volume on day 14 (p < 0.05; Figure 3(c)). Next, we assessed whether increased PGRN expression promotes neurological function recovery with a neurobehavioral test. The results of the grid walking test showed that increased PGRN expression significantly decreased foot error of the mice on days 3, 7, and 14 compared to the saline group (p < 0.05; Figure 3(e)). In addition, the mNSS of mice in the Chq and Treh treated groups were better than in the saline group (p < 0.05; Figure 3(d)).
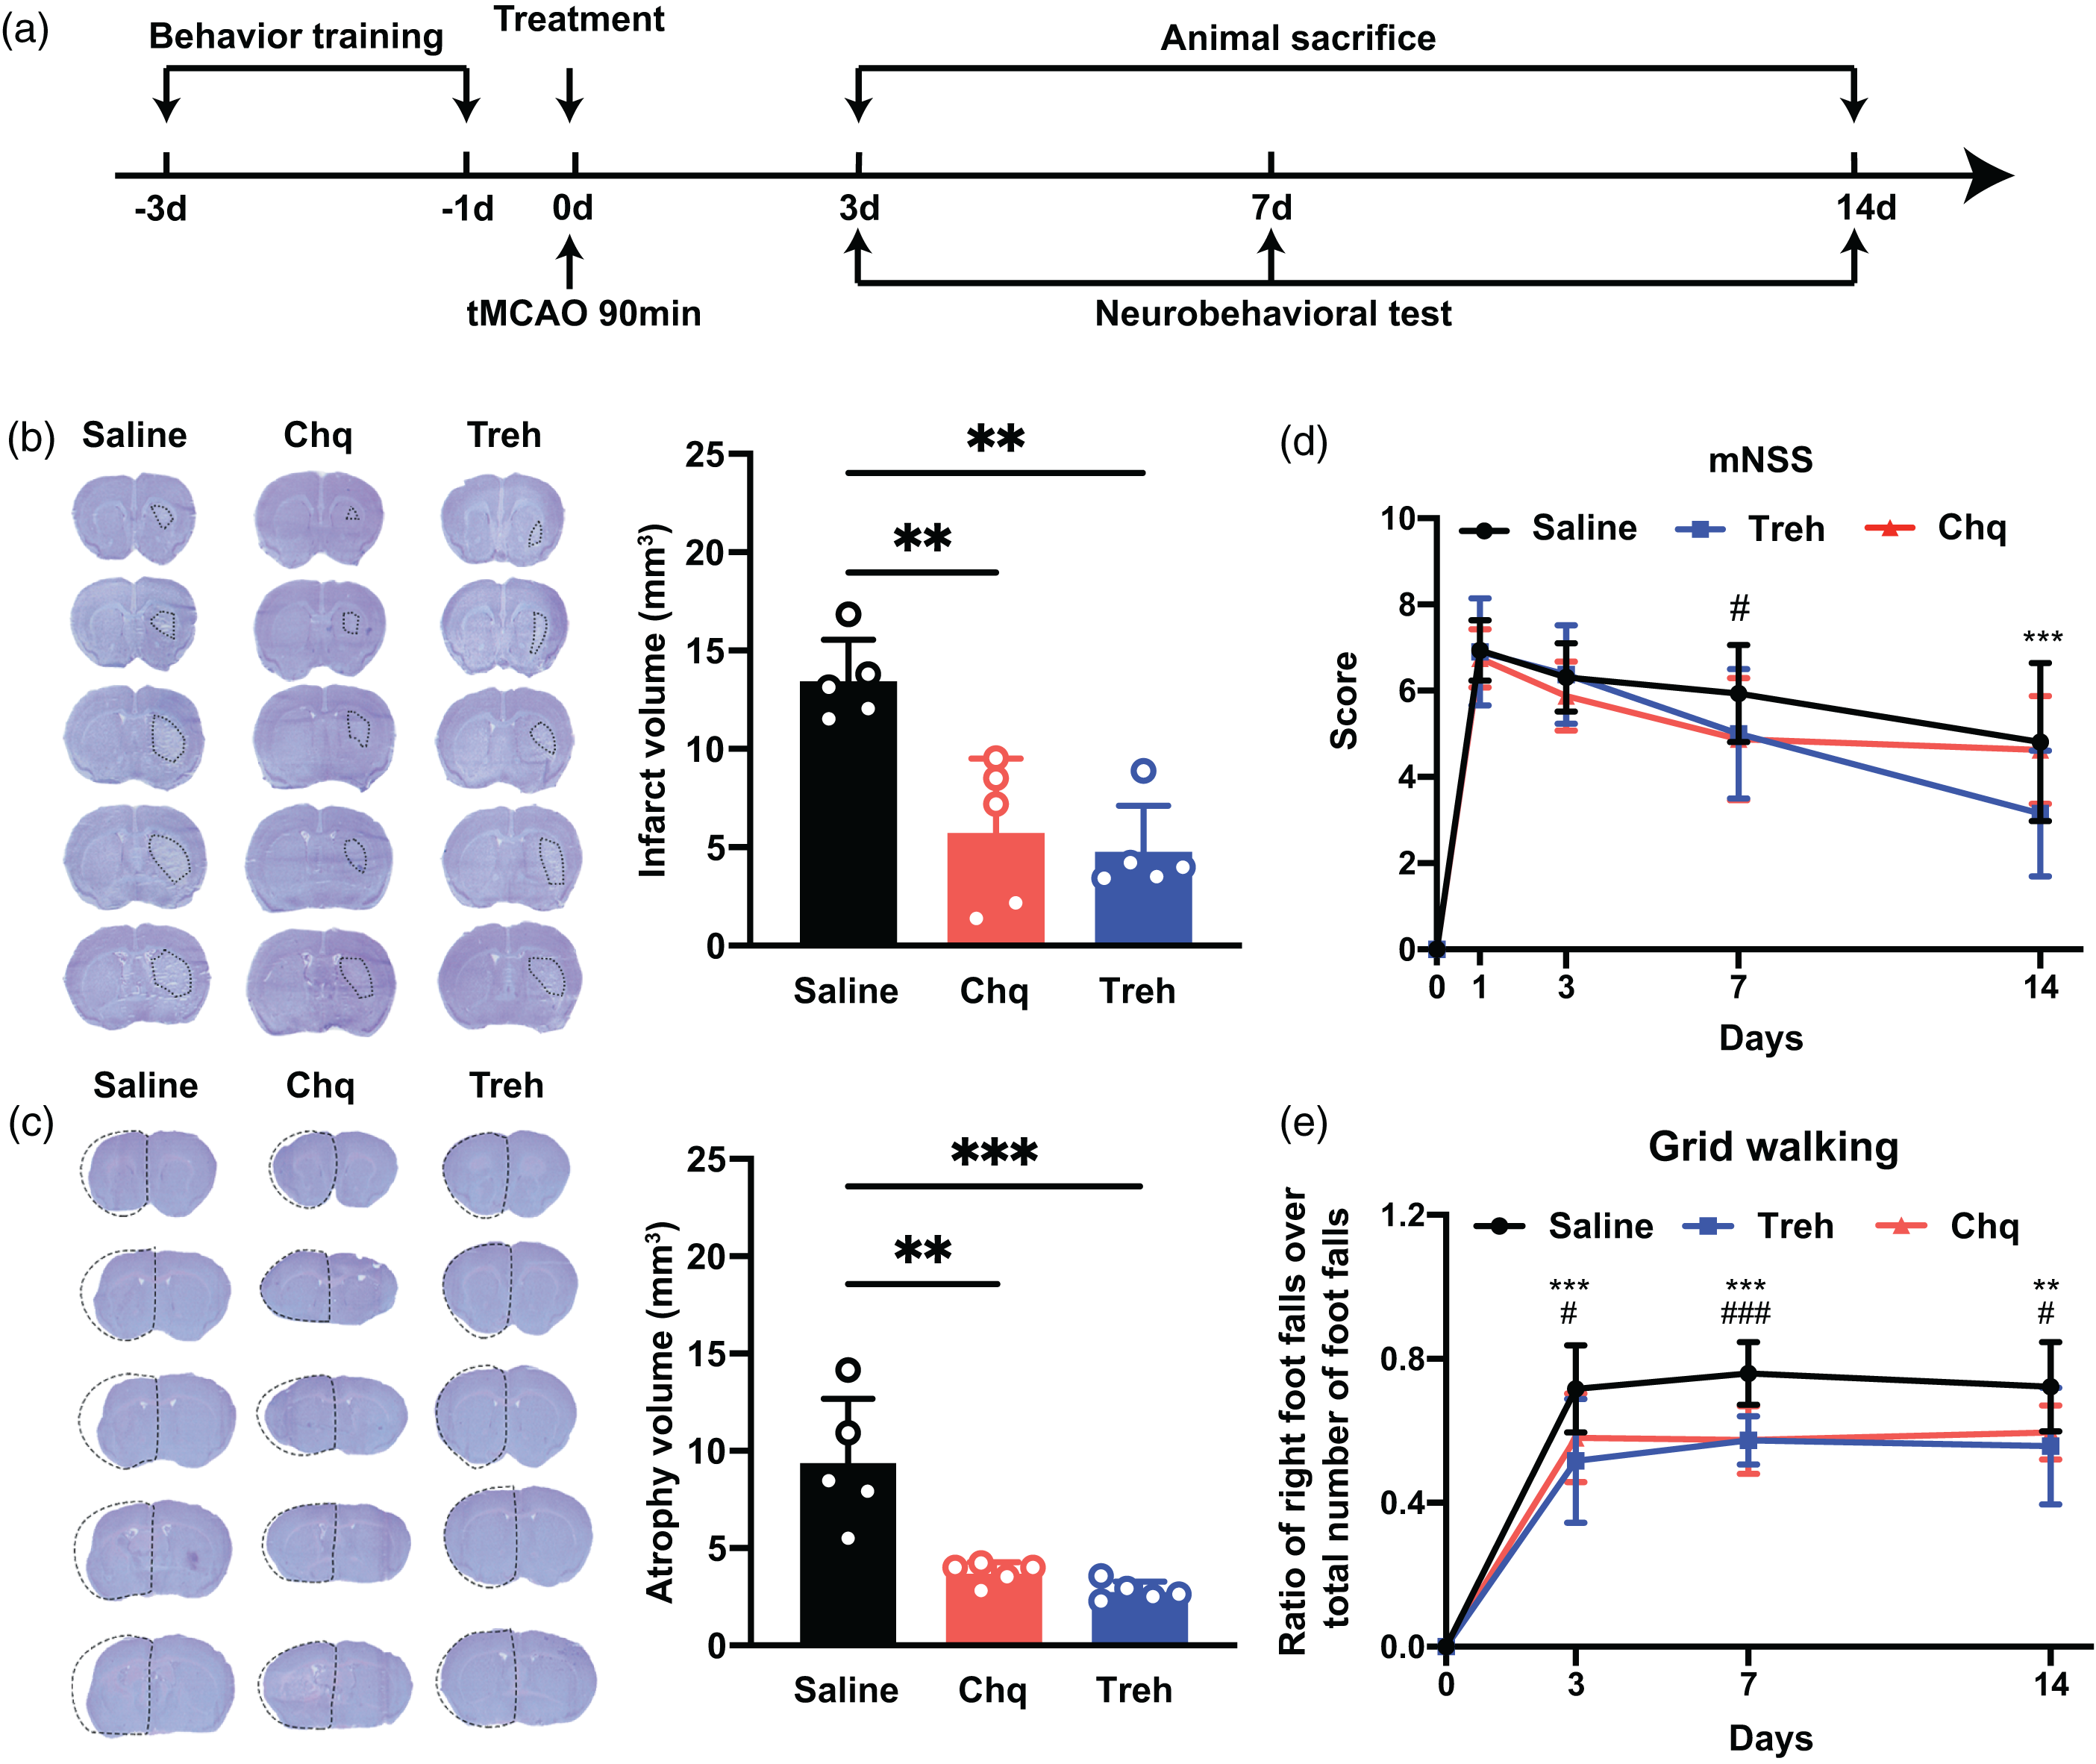
The increase of PGRN reduced brain infarct volume and promoted neurobehavioral recovery after tMCAO. (a) Experimental scheme. (b) Representative cresyl violet-stained brain sections at 3 days of tMCAO mice treated with saline, chloroquine, or trehalose, n = 5 per group. The brain infarct area was circled by the dashed line, and bar graph showed the quantitative comparison of the infarct volume, **p < 0.01. Data are presented as mean ± SD. (c) Brain atrophy at 14 days were also detected by Cresyl violet in saline, chloroquine, and trehalose group, the dashed line represented brain atrophy. Bar graph showed the brain atrophy volume, n = 5 per group, **p < 0.01, ***p < 0.001. Data are presented as mean ± SD and (d–e) Neurobehavioral recovery was assessed by mNSS (d), and Grid walking tests (e), n = 9–15 per group, **p < 0.01, ***p < 0.001 (saline vs Treh), #p < 0.05, ###p < 0.001 (saline vs Chq), Data are presented as mean ± SD.
Increased PGRN attenuates ferroptosis after tMCAO
Ferroptosis is an iron-dependent form of regulatory cell death triggered by the inactivation of the cellular GSH-dependent antioxidant defense system. 29 We found that the cerebral infarct volume of mice on day 3 after tMCAO was significantly reduced after treatment with the ferroptosis inhibitor ferrosstatin-1 (Fer-1; p < 0.05; Figure 4(a)), consistent with previous studies5,30 and indicating that ferroptosis contributes substantially to cell death after ischemic stroke. To explore whether PGRN’s neuroprotective effect was via ferroptosis inhibition, we increased PGRN expression in mice with Chq or Treh and then quantified MDA and lipid ROS levels in the peri-infarct area after tMCAO, finding that increased PGRN expression attenuated the MDA and lipid ROS levels (p < 0.05; Figure 4(b)). Furthermore, we also performed TUNEL/NeuN immunostaining to detect the live/dead cells. We found that the ratio of NeuN+/TUNEL+ cells decreased in the Chq- and Treh-treated groups (p < 0.05, Figure 4(c)).
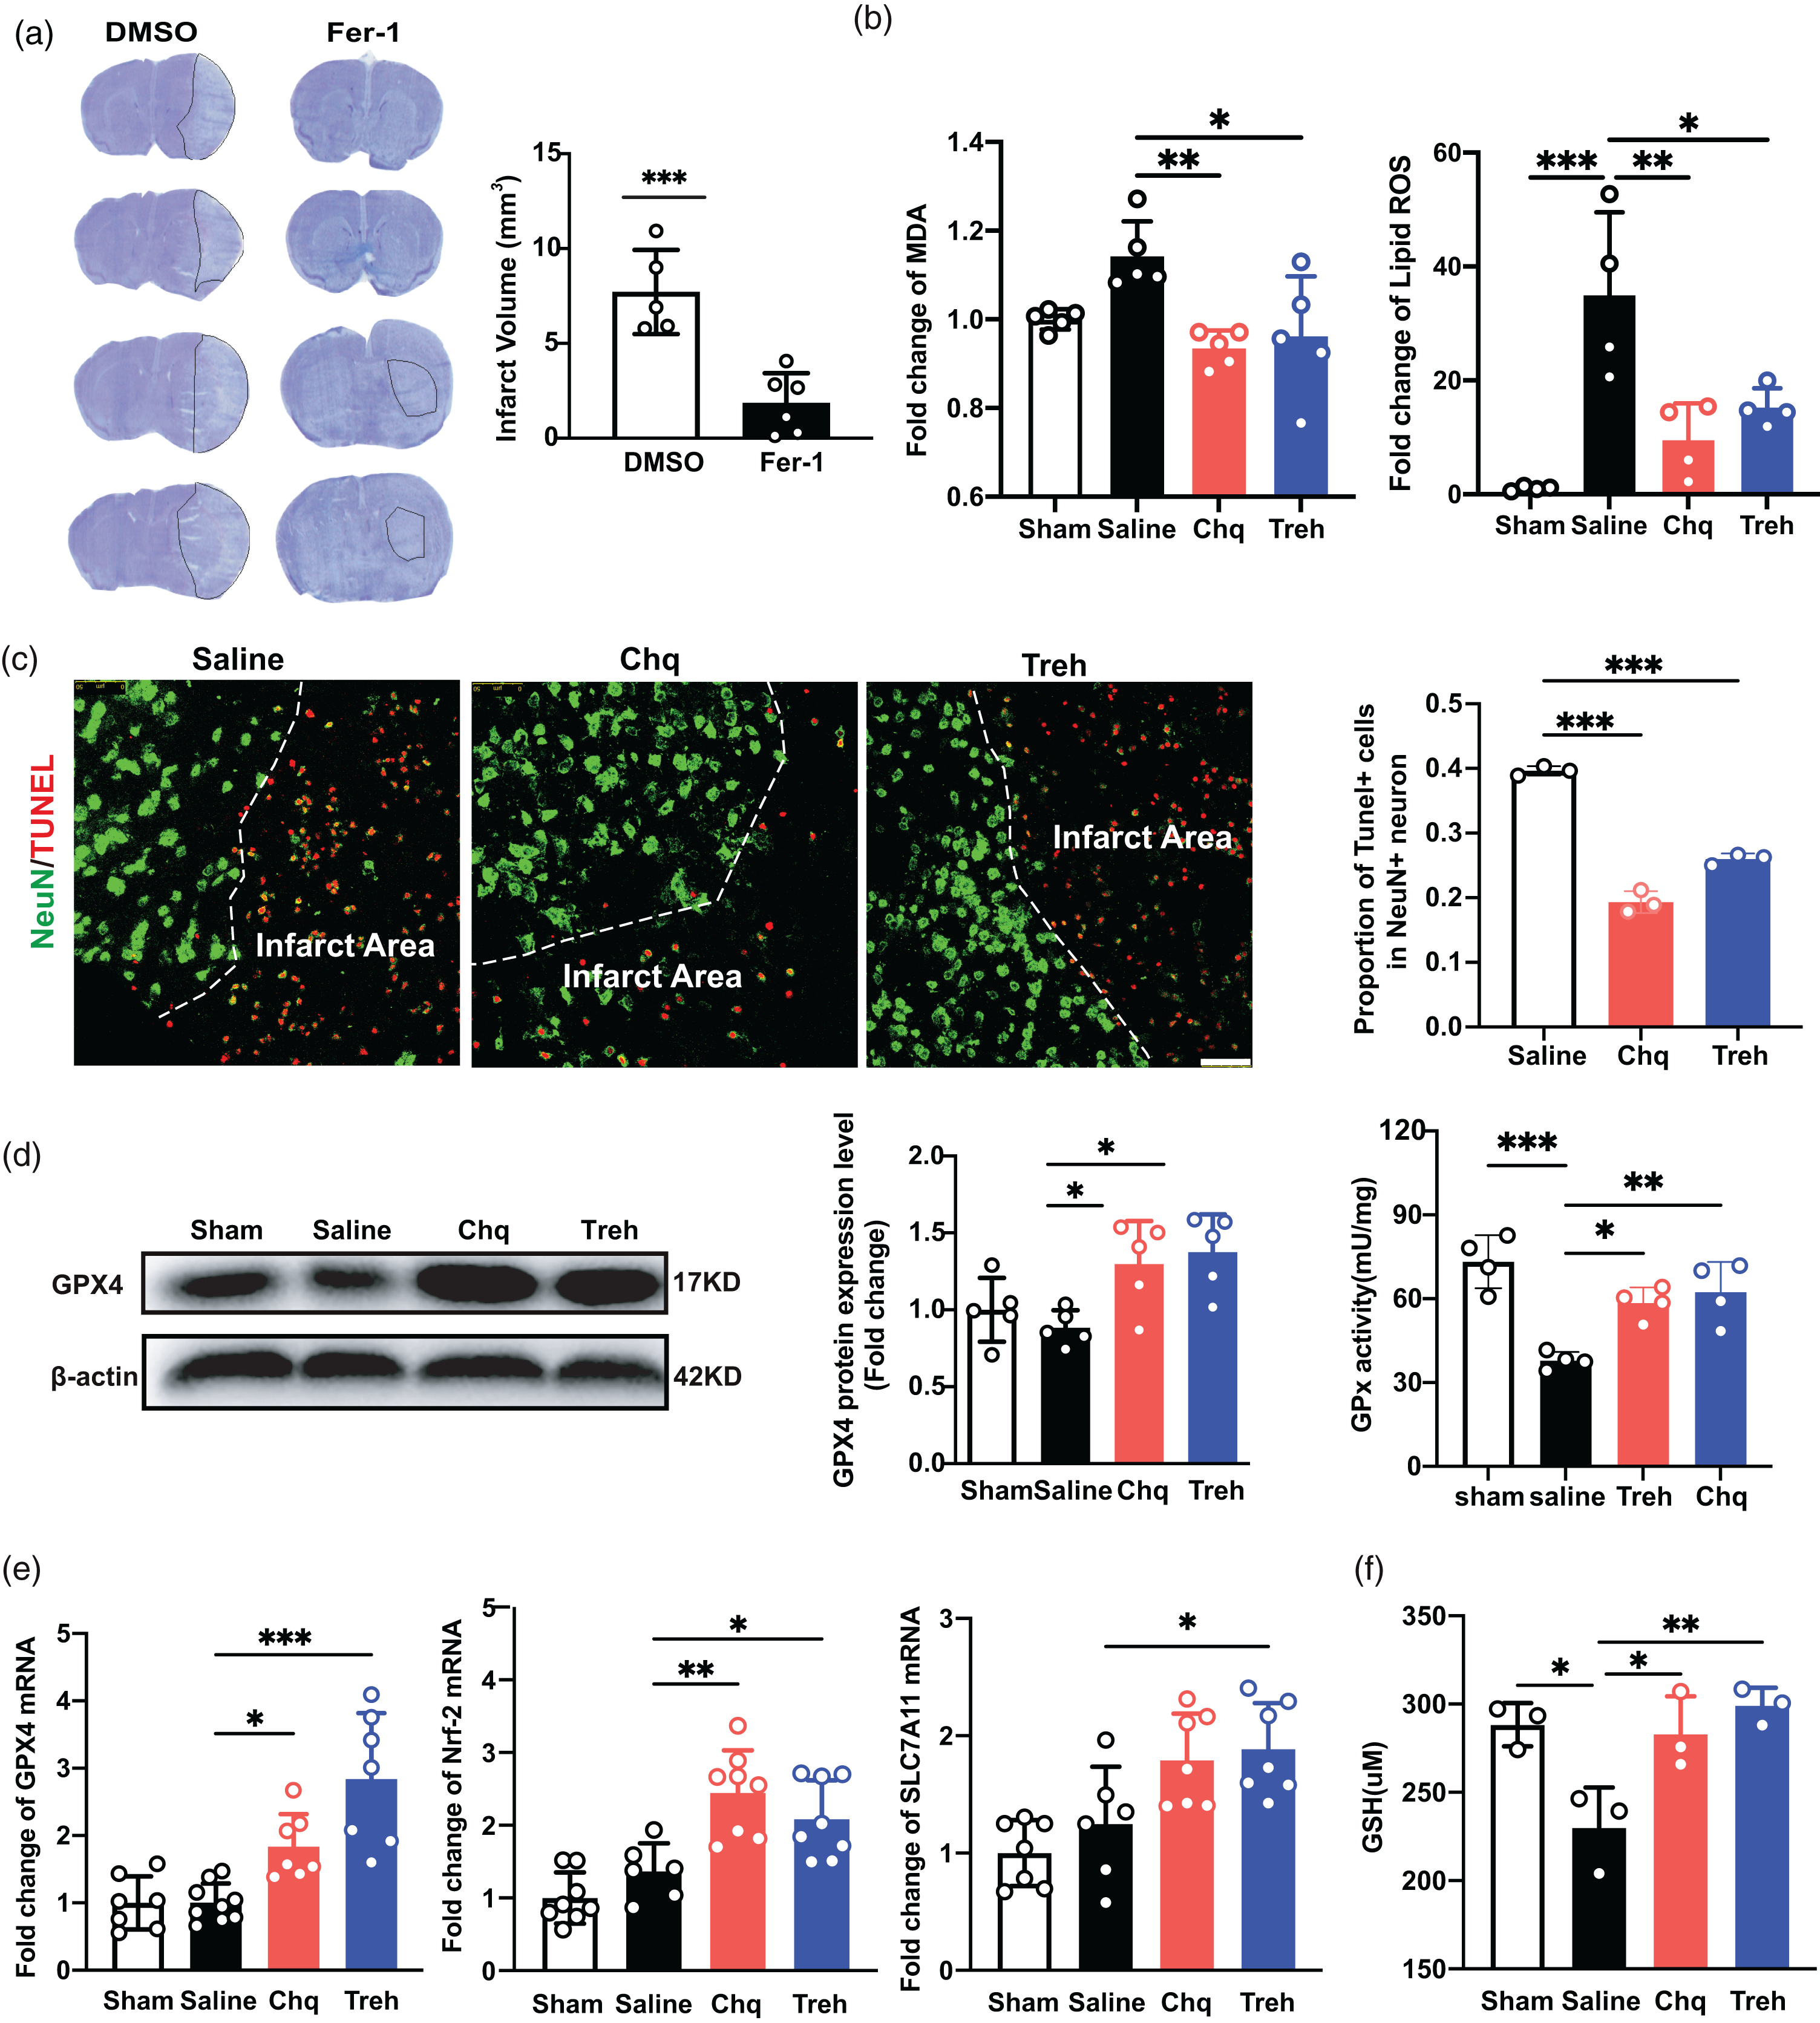
The increase of PGRN reduced ferroptosis after tMCAO. (a) Representative cresyl violet-stained brain sections at 3 days of tMCAO mice treated with DMSO and Fer-1(Sigma, 5 mg/kg), n = 5–6 per group. The brain infarct area was circled by the dashed line, and bar graph showed the quantitative comparison of the infarct volume. (b) The MDA and lipid ROS levels in sham, saline, Chq and Treh group at 3 days after tMCAO. (c) Representative Confocal imaging (left) showed the co-localization of TUNEL (red) with neurons (NeuN, green) in saline, Chq and Treh group at 3 days after tMCAO, Scale bar = 50 μm. Proportion of TUNEL+ cells in neuron (right), n = 3 per group. (d) Western blot and the quantification of GPX4 in sham, saline, Chq and Treh group at 3 days after tMCAO, n = 5 per group. Quantitative of GPx activity in sham, saline, Chq and Treh group at 3 days after tMCAO, n = 4 per group and (e) Quantitative of RT-PCR analysis for the expression of GPX4, Nrf-2 and SLC7A11 in sham, saline, Chq and Treh group at 3 days after tMCAO. n = 6-9 per group and (f) The total GSH levels in sham, saline, Chq and Treh group at 3 days after tMCAO, n = 3 per group. *p < 0.05, **p < 0.01, ***p < 0.001. Data are presented as mean ± SD.
Protein and mRNA levels of GPX4, a key enzyme in the ferroptosis pathway, were significantly increased in the Chq- and Treh-treated groups compared to Saline group (p < 0.05; Figure 4(d) and (e)), suggesting that PGRN attenuates ferroptosis by decreasing lipid ROS. We also detected the levels of Glutathione peroxidase (GPx) activity, and the results showed that increased PGRN could improve GPx activity (p < 0.05; Figure 4(d)). Next, we quantified the key proteins in the lipid peroxide reduction pathway. Cystine transporter Slc7a11 expression was significantly increased in the treatment group (p < 0.05; Figure 4(e)), as did the levels of its downstream product GSH, before returning to levels similar to the saline group (Figure 4(f)). In addition, we found the expression of Nrf2, a key regulator of the oxidative stress defense response, to be increased in the treatment group (p < 0.05, Figure 4(e)). Altogether, these results indicate that increased PGRN expression reduces ferroptosis by decreasing lipid ROS.
PGRN released from microglial lysosomes reduces neuronal ferroptosis
The exocytosis of microglial lysosomes has physiological and pathological functions. 31 In vivo and in vitro immunofluorescence staining showed that PGRN is mainly present in microglial lysosomes (Figure 5(a) and (b)). To determine whether PGRN is released from lysosomes and plays a protective role, we treated primary microglia with lysosomal inhibitor GPN in vitro and quantified secreted PGRN in the cell culture medium by ELISA. We found that secreted PGRN increased after Chq treatment but decreased significantly after GPN inhibition (p < 0.05; Figure 5(c)), suggesting that PGRN was released from lysosomes. Next, to assess the neuroprotective effect of PGRN released from microglia, we treated OGD neurons with the microglia medium, finding that ferroptosis was significantly reduced in the Chq-treated microglia group compared to the control group (p < 0.05; Figure 5(d)).
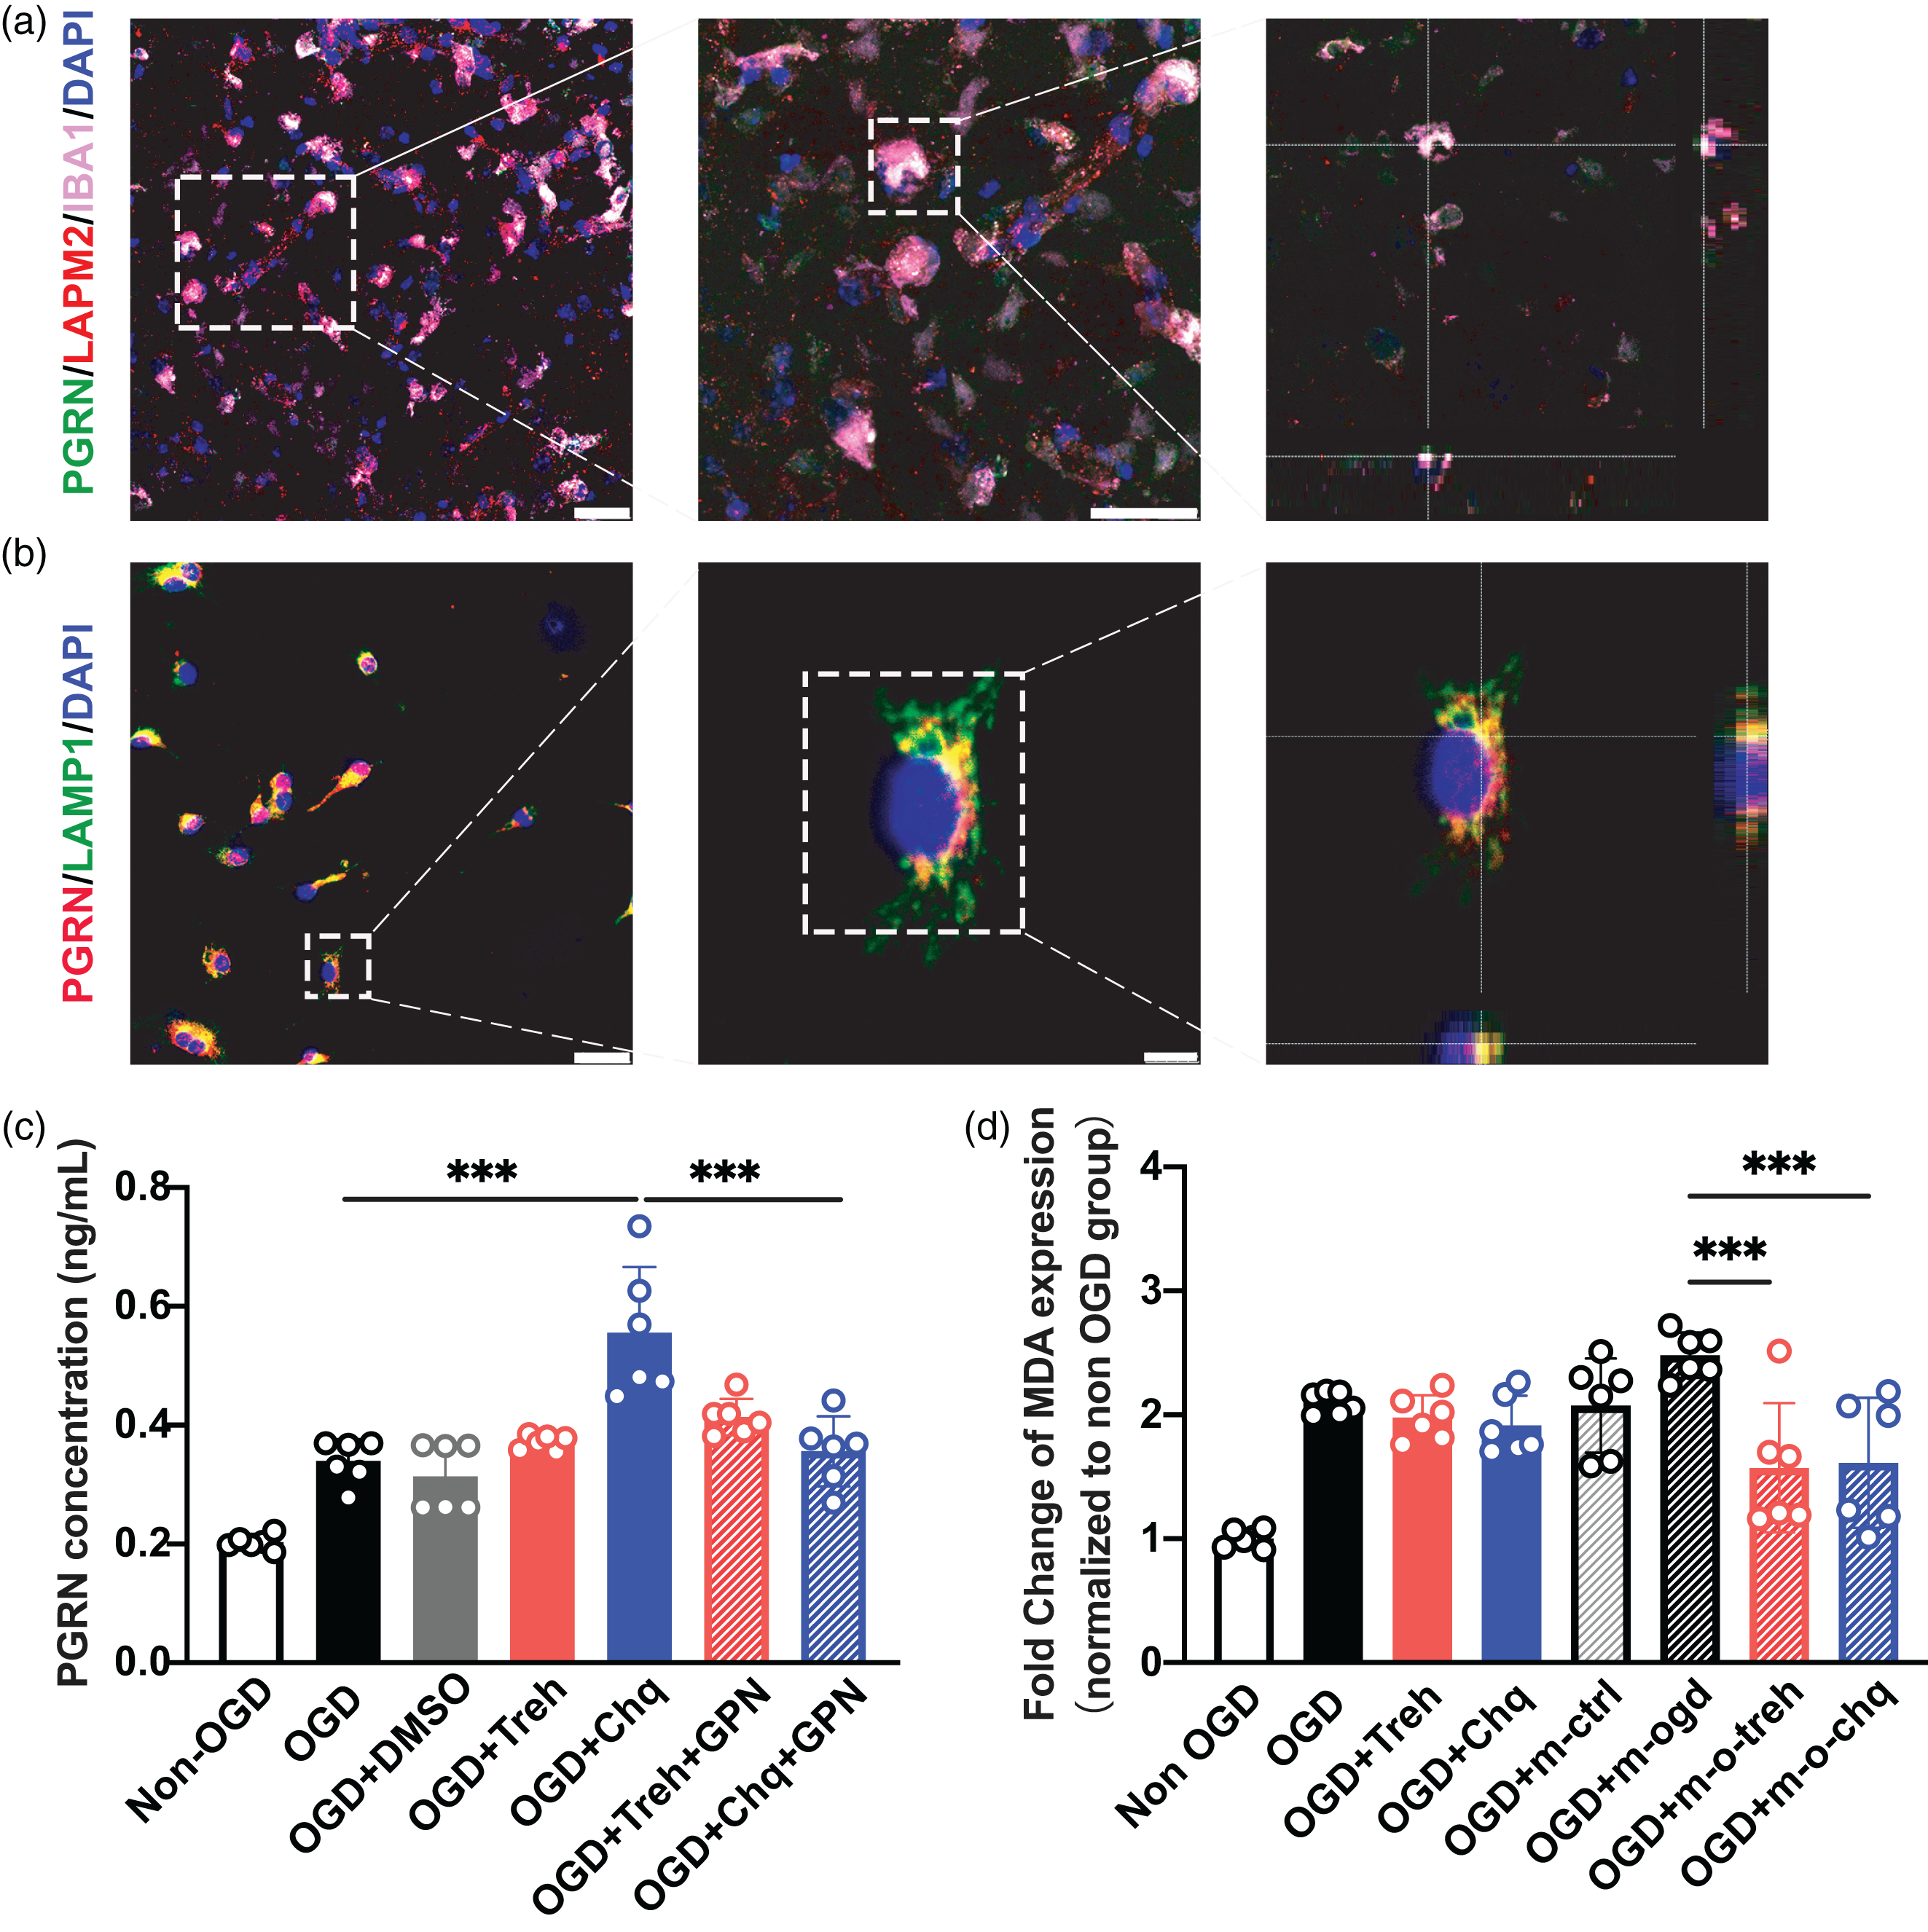
PGRN released from microglial lysosomes to reduce ferroptosis of neurons after OGD. (a) Confocal imaging showing the co-localization of PGRN (green) with microglia (IBA1, red) in lysosome (LAMP2, violet) at 3 days after tMCAO, Scale bar = 25 μm. (b) Confocal imaging showed the co-localization of PGRN (red) with microglia lysosome (LAMP1, green) in primary culture, Scale bar = 25 μm (left) and 5um (right). (c) ELISA quantitative analysis of the content of PGRN in the culture medium of microglia in Non-OGD, OGD, OGD + DMSO, OGD + Treh, OGD + Chq, OGD + Tre + GPN, OGD + Chq + GPN group and (d) The MDA level of neuron in Non-OGD, OGD, OGD + Treh, OGD + Chq group and microglia treated group: Non-OGD (OGD + m-ctrl), OGD (OGD + m-ogd), OGD + Treh (OGD + m-o-treh) and OGD + Chq (OGD + m-o-chq). ***p < 0.001. Data are presented as mean ± SD.
Discussion
This study has shown for the first time that PGRN derived from microglial lysosomes reduces ferroptosis by increasing GSH/GPX4 levels after ischemic stroke. It should be noted that while mRNA and protein PGRN levels were found to decrease in the brain of our mouse tMCAO model, they increased in permanent MCAO and microsphere-induced cerebral embolism (ME) models.1,32–34 Our results indicate that PGRN expression increases in the ischemic perifocal region of tMCAO, possibly due to the different animal species and models. First, western blotting analysis confirmed that PGRN protein levels increase on day 3 and then return to the basal level on days 7 and 14 after tMCAO. Second, while PGRN is expressed in both neurons and microglia, immunostaining indicated that increased PGRN is attributable to microglia, suggesting that increased PGRN expression in microglia plays an important role in the acute phase of ischemic stroke. Notably, previous studies identified that the expression of PGRN in endothelial cells can be detected at the RNA level, 10 while our results show that PGRN is negative at protein level in endothelial cells. This may be due to that translation of PGRN in endothelial cells is hardly activated. 35 Our findings are consistent with other studies that neurons and microglia are major contributors to PGRN in the brain.35–37
Ferroptosis is an important cell death pathway in acute brain injury, including cerebral ischemia and hemorrhage, 38 initiated by GSH depletion or GPX4 activity inhibition,39,40 with GSH essential for GPX4 activity. GPX4 expression decreases during the acute phase of stroke, and increasing GPX4 expression can rescue neurons from ferroptosis and improve neurofunctional outcomes after stroke. 41 Pharmacological Se supplementation effectively inhibited ferroptosis by increasing GPX4 expression after stroke. 5 Our results suggest that increased PGRN prevents ferroptosis by increasing GSH levels and GPX4 expression after tMCAO. Furthermore, MDA and lipid ROS are positively correlated with ferroptosis.42,43 Transcription of NRF2 and SLC7A11 also suppress ferroptosis in tumors.44,45 We found that increased PGRN could reduce MDA and lipid ROS and upregulated Nrf2 and Slc7a11 expression. While we found that MDA levels were unaltered in ischemic mice, lipid ROS levels were significantly increased, which is an upstream event in MDA production. This result indicates that MDA assays may not be sensitive enough to reflect ferroptosis levels in minor lesions.
PGRN deficiency leads to dysregulated microglial activation and contributes to increased neuronal loss with injury. Microglia are the major cellular PGRN source, affecting neuronal survival and repair after traumatic spinal cord injury. 21 PGRN also serves as a neurotrophic factor to promote neuronal survival and enhance neurite outgrowth, 17 attenuating neuronal injury after cerebral ischemia. 33 PGRN-deficient microglia can disrupt the homeostatic balance of glia-neuron interactions and promote neurodegeneration in the aging brain. 20 Our results support the view that PGRN derived from microglia improves neurobehavior recovery by reducing ferroptosis. First, increased PGRN expression reduced brain infarct volume and promoted neurobehavioral recovery. Second, it reduced neuronal ferroptosis. Third, it reduced neuronal ferroptosis by increasing GSH/GPX4. Fourth, PGRN released from microglia in vitro could reduce neuronal ferroptosis after OGD.
In the brain, PGRN is expressed by several cell types. 10 When microglia become active after injury, they produce and secrete high levels of PGRN, which is present in lysosome18,46,47 and regulates their function. PGRN deficiency can induce endolysosome system dysfunction,48,49 in which microglial lysosomes release adenosine triphosphate (ATP) to mediate their migration toward and accumulation at the injury site.31,50 We found that PGRN secreted from microglial lysosomes attenuated ferroptosis after tMCAO, and lysosome damage inhibited the role of PGRN in ferroptosis. While we found that the content of PGRN in the culture medium did not increase after Treh treatment of microglia, the culture medium treated with OGD had a protective effect on the neurons. We hypothesize that Treh induces autophagy, causing cellular proteins to be cleaved. 51 Therefore, PGRN released in the form of GRN peptides, which are neuroprotective, 52 can reduce neuronal ferroptosis.
In conclusion, our findings show that pharmacological increases in PGRN secretion from microglia improve neurological functional recovery by attenuating GSH/GPX4-mediated ferroptosis. Altogether, our results suggest that increased PGRN in microglia is associated with decreased ferroptosis via increased GSH/GPX4, indicating that PGRN is closely related to ferroptosis and represents a potential therapeutical target to reduce neuronal death after ischemic brain injury.
Supplemental Material
sj-jpg-1-jcb-10.1177_0271678X221145090 - Supplemental material for Progranulin released from microglial lysosomes reduces neuronal ferroptosis after cerebral ischemia in mice
Supplemental material, sj-jpg-1-jcb-10.1177_0271678X221145090 for Progranulin released from microglial lysosomes reduces neuronal ferroptosis after cerebral ischemia in mice by Tingting Chen, Rubing Shi, Qian Suo, Shengju Wu, Chang Liu, Shuxian Huang, Khan Haroon, Ze Liu, Yuyan He, Heng-Li Tian, Yongting Wang, Yaohui Tang, Guo-Yuan Yang and Zhijun Zhang in Journal of Cerebral Blood Flow & Metabolism
Supplemental Material
sj-jpg-2-jcb-10.1177_0271678X221145090 - Supplemental material for Progranulin released from microglial lysosomes reduces neuronal ferroptosis after cerebral ischemia in mice
Supplemental material, sj-jpg-2-jcb-10.1177_0271678X221145090 for Progranulin released from microglial lysosomes reduces neuronal ferroptosis after cerebral ischemia in mice by Tingting Chen, Rubing Shi, Qian Suo, Shengju Wu, Chang Liu, Shuxian Huang, Khan Haroon, Ze Liu, Yuyan He, Heng-Li Tian, Yongting Wang, Yaohui Tang, Guo-Yuan Yang and Zhijun Zhang in Journal of Cerebral Blood Flow & Metabolism
Supplemental Material
sj-jpg-3-jcb-10.1177_0271678X221145090 - Supplemental material for Progranulin released from microglial lysosomes reduces neuronal ferroptosis after cerebral ischemia in mice
Supplemental material, sj-jpg-3-jcb-10.1177_0271678X221145090 for Progranulin released from microglial lysosomes reduces neuronal ferroptosis after cerebral ischemia in mice by Tingting Chen, Rubing Shi, Qian Suo, Shengju Wu, Chang Liu, Shuxian Huang, Khan Haroon, Ze Liu, Yuyan He, Heng-Li Tian, Yongting Wang, Yaohui Tang, Guo-Yuan Yang and Zhijun Zhang in Journal of Cerebral Blood Flow & Metabolism
Supplemental Material
sj-jpg-4-jcb-10.1177_0271678X221145090 - Supplemental material for Progranulin released from microglial lysosomes reduces neuronal ferroptosis after cerebral ischemia in mice
Supplemental material, sj-jpg-4-jcb-10.1177_0271678X221145090 for Progranulin released from microglial lysosomes reduces neuronal ferroptosis after cerebral ischemia in mice by Tingting Chen, Rubing Shi, Qian Suo, Shengju Wu, Chang Liu, Shuxian Huang, Khan Haroon, Ze Liu, Yuyan He, Heng-Li Tian, Yongting Wang, Yaohui Tang, Guo-Yuan Yang and Zhijun Zhang in Journal of Cerebral Blood Flow & Metabolism
Footnotes
Funding
The author(s) disclosed receipt of the following financial support for the research, authorship, and/or publication of this article: This study was supported by grants from the National Natural Science Foundation of China (81974179 [ZZ], 81801170 [YT], 82071284 [YT], and 81870921 [YW]), National Key R&D Program of China (2019YFA0112000 [YT]), Scientific Research and Innovation Program of Shanghai Education Commission (2019-01-07-00-02-E00064 [GYY]), Scientific and Technological Innovation Act Program of Shanghai Science and Technology Commission (20JC1411900 [GYY]).
Declaration of conflicting interests
The author(s) declared no potential conflicts of interest with respect to the research, authorship, and/or publication of this article.
Authors’ contributions
ZZ designed and supervised this project. TC and RS were responsible for performing the experiments. QS and SW performed the neurobehavioral tests. TC drafted the manuscript, and ZZ, GYY, HLT, YW and YT monitored and discussed the experiments and revised the manuscript. CL, SH, ZL, KH, and YH assisted with the data analysis and management.
Supplemental material
Supplemental material for this article is available online.
References
Supplementary Material
Please find the following supplemental material available below.
For Open Access articles published under a Creative Commons License, all supplemental material carries the same license as the article it is associated with.
For non-Open Access articles published, all supplemental material carries a non-exclusive license, and permission requests for re-use of supplemental material or any part of supplemental material shall be sent directly to the copyright owner as specified in the copyright notice associated with the article.