
Abstract
One of the most common causes of dementia is cerebral small vessel disease (SVD), which is associated with enlarged perivascular spaces (PVS). Clinically, PVS are visible as hyperintensities on T2-weighted (T2w) magnetic resonance images (MRI). While rodent SVD models exhibit arteriolosclerosis, PVS have not been robustly documented by MRI casting doubts on their clinical relevance. Here we established that the severity of SVD in spontaneously hypertensive stroke prone (SHRSP) rats correlated to ‘moderate’ SVD in human post-mortem tissue. We then developed two approaches for detecting PVS in SHRSP rats: 1) T2w imaging and 2) T1-weighted imaging with administration of gadoteric acid into cerebrospinal fluid. We applied the two protocols to six Wistar-Kyoto (WKY) control rats and thirteen SHRSP rats at ∼12 month of age. The primary endpoint was the number of hyperintense lesions. We found more hyperintensities on T2w MRI in the SHRSP compared to WKY rats (p-value = 0.023). CSF enhancement with gadoteric acid increased the visibility of PVS-like lesions in SHRSP rats. In some of the SHRSP rats, the MRI hyperintensities corresponded to enlarged PVS on histopathology. The finding of PVS-like hyperintensities on T2w MRI support the SHRSP rat’s clinical relevance for studying the underlying pathophysiology of SVD.
Keywords
Introduction
Cerebral small vessel disease
The spontaneously hypertensive stroke prone rat (SHRSP) and spontaneously hypertensive rat (SHR) have been used in studies of SVD pathophysiology as both strains exhibit arteriolosclerosis.12–14 However, classical MRI hallmarks such as PVS have not been robustly documented by in vivo MRI, casting doubts on their clinical relevance.13,15 The objective of this study was to develop MRI methodology to uncover PVS-like hyperintensities in a rat SVD model. Notably, because hydrocephalus is inherent to the SHR rat strain 16 we chose the SHRSP rat for our studies as this strain does not show signs of abnormally enlarged ventricles. To validate SVD disease in SHRSPs we first compared the severity of arteriolosclerosis in SHRSP rats with that of postmortem human brain tissue from subjects diagnosed with varying degree of SVD. Secondly, we developed two different MRI approaches to characterize PVS in 12-month-old chronically hypertensive SHRSP rats and age-matched normotensive WKY controls. Specifically, we implemented a clinically relevant high spatial resolution T2w imaging sequence, and also developed a T1w approach with CSF administration of gadoteric acid to enhance visualization of enlarged fluid-filled PVS by MRI. We hypothesized that 1) PVS-like lesions would be detectable on T2w images and 2) CSF contrast enhancement with gadoteric acid would enhance the visibility of PVS on T1w images of SHRSP rats.
Methods
Animals and study design
All animal experiments were approved by the Institutional Animal Care and Use Committee at Yale University and performed in accordance with the United States Public Health Service’s Policy on Humane Care and Use of Laboratory Animals. The methodology and results of animal studies were reported in accordance with the ARRIVE (Animal Research: Reporting in vivo Experiments) 2.0 guidelines. 17 The researchers implemented efforts to minimize animal suffering during the study (Supplemental Methods). A total of six female WKY rats and thirteen female SHRSP (Charles River Laboratories, Wilmington, MA) between the ages of 10–13 months (M) were used for the experiments (Table 1). Experimenters were blinded to the identity of strains from the time of MRI and/or euthanasia until the end of data collection and analysis. The rats received regular, non-salt loaded normal rat chow and water ad libitum and were housed in standard conditions in a 12 h light/dark cycle. Both groups of rats underwent non-invasive blood pressure measurement in the awake state prior MRI imaging using the tail-cuff method (CODA monitor, Kent Scientific Corporation, USA). Three measurements were taken at 5-min intervals from each rat and the average of systolic and diastolic pressures were used for the analysis.
Summary of MRI sequences used for the study.
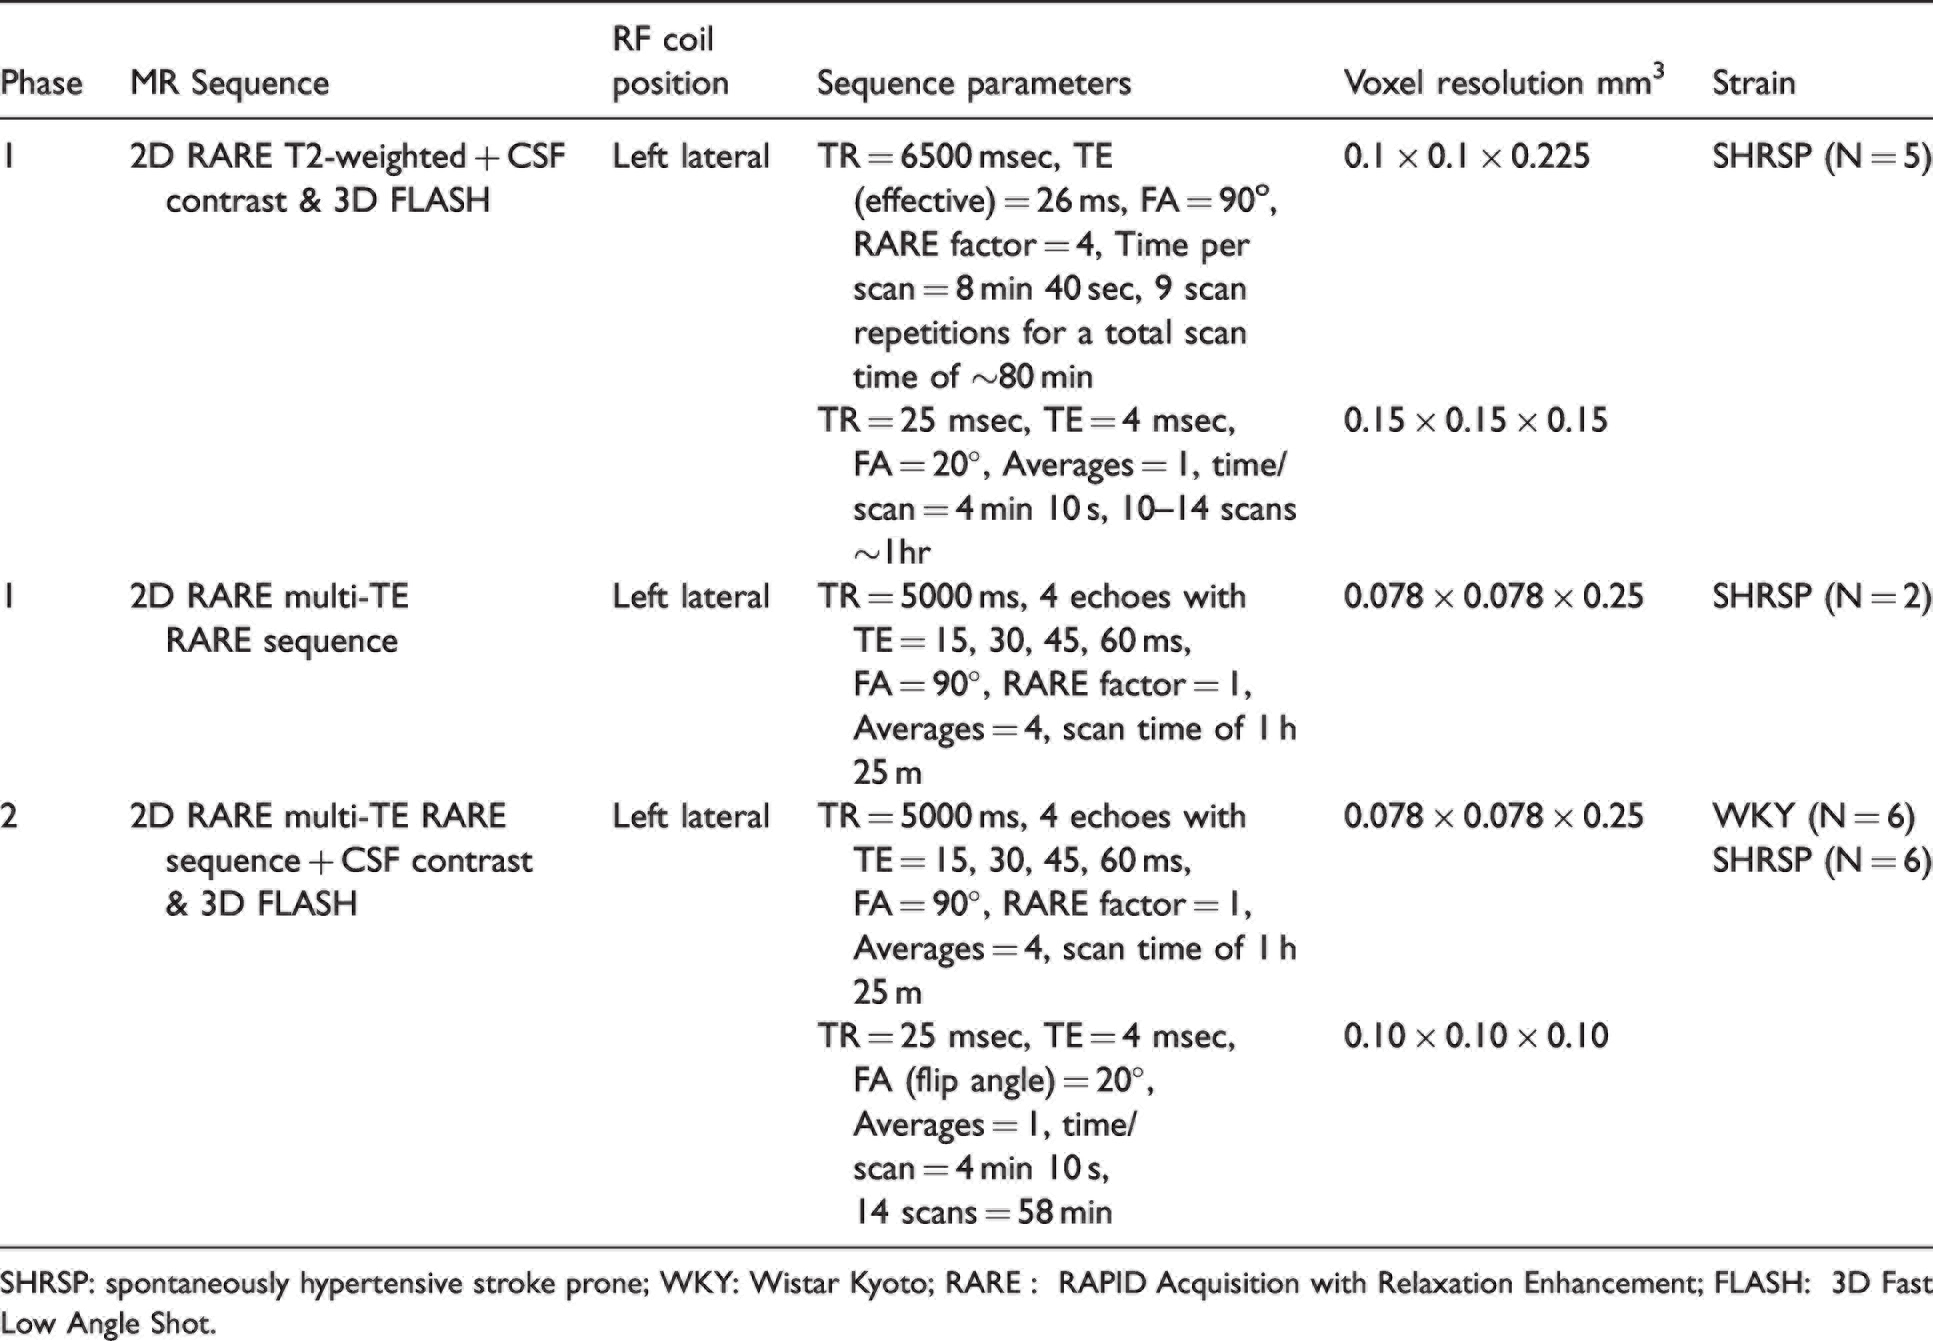
SHRSP: spontaneously hypertensive stroke prone; WKY: Wistar Kyoto; RARE : RAPID Acquisition with Relaxation Enhancement; FLASH: 3D Fast Low Angle Shot.
The primary objective of our study was to uncover if PVS-like hyperintensities were present on T2w in vivo MRI in adult (10–13 M), chronically hypertensive SHRSP rats and if so, to quantify their numbers (total PVS ‘burden’) in comparison to age-matched WKY controls. The secondary objective was to test our second hypothesis that CSF contrast enhancement with gadoteric acid would enhance PVS-like lesion visibility on T1w MRI in SHRSP rats compared to WKY rats. The study design was observational with two phases. Phase 1 focused on developing and optimizing the T2w and CSF contrast enhanced T1w scan protocols as a method to visualize PVS-like lesions in SHRSP hippocampus. The hippocampus region was chosen because it represents a large subcortical structure fed by perforating arterioles in the rat brain with well-defined grey matter and white matter layers. Phase 2 was dedicated to address the main hypotheses by applying the optimized scan protocols to a series of WKY rats (N = 6) and SHRSP rats (N = 6), with two scan sessions occurring 1-week apart.
Human tissue
Brain tissue was obtained during autopsy from Department of Pathology at Yale-New Haven Hospital and Yale Medical Group. The Yale institutional review board (IRB) determined that this research activity was exempt under 45CFR46.104 (4) and granted a waiver of HIPAA authorization. As the hippocampus region was the focus of the rodent MRI studies, this region was also chosen for cross-comparison with human tissue. Notably, in clinical imaging studies enlarged PVS are also observed in the hippocampus.18–20 The neuropathologist (AD) obtained human hippocampal tissue at autopsy from three selected cases of non-amyloidal form of SVD with varying degree of vascular pathology (Supplemental Table 1). The hippocampal sections were prepared at autopsy and stored in 10% buffered formalin phosphate for two weeks. Paraffin embedded sections (7-µM) fixed in 10% formalin were processed in automated tissue-processing units (Sakura® Tissue-Tek VIP tissue processor) followed by routine hematoxylin and eosin staining using a Sakura Prisma slide strainer. Masson’s Trichrome staining was used for detection of collagen fibers (stained blue) in the vascular wall. The severity of SVD was assessed based on the extend of distribution of vascular pathology in white matter, basal ganglia, hippocampus and thalami, intensity of the morphological changes of affected vessels including concentric fibrotic/hyaline small-vessel thickening and concomitant luminal narrowing; Charcot-Bouchard microaneurysms; microbleeds reflecting endothelial dysfunction, loss of blood-brain-barrier integrity and increased permeability. Brightfield micrographs of Masson's Trichrome stained sections of human or rat hippocampus were acquired on a Zeiss Axio Imager.Z2 upright microscope with Zeiss Axiocam 305 color camera. Human tissue and rat tissue was imaged using a Plan-Apochromat 20×/0.8 NA objective (Carl Zeiss, 420650-9902-000) to acquire a tile scan of the ventral (rat)/temporal (human) hippocampus, which was stitched using Zeiss Zen software (version 3.1). Additional higher-magnification images of vasculature in rat ventral hippocampus were acquired using a 40x/1.4 NA objective (Carl Zeiss, 420762-9900-000).
Magnetic-resonance imaging protocols
MRI image acquisitions were performed on a Bruker 9.4 T/16 magnet (Bruker BioSpin, Billerica, MA) controlled by Paravision 6.0.1 software. For MRI scanning, all rats were anesthetized with an i.p. bolus of dexmedetomidine (0.015 mg/kg). Maintenance anesthesia was provided through a subcutaneous infusion of dexmedetomidine (0.009 mg/kg/h) supplemented with low-dose, ∼0.8–1.0% isoflurane delivered in a 1:1 Air:O2 mixture via a nose cone. The rats were allowed to breathe spontaneously.
21
Physiological parameters including body temperature, oxygen saturation and heart rate were monitored continuously during imaging by MRI compatible monitors (SA Instruments, Stony Brook, NY, USA). Body temperature was kept at 36.5–37.5 °C using a heated waterbed system. For imaging, a 1-cm radio-frequency (RF) receive surface coil (Bruker) was positioned close to the left side of the rat’s head with the body in supine position. A volume coil (50-mm i.d.) was used as a transmit RF coil during MRI. The left-hemispheric RF coil positioning was chosen for the following reasons: 1) we previously used left-hemispheric RF surface coil positioning with contrast-enhanced MRI22 and 2) in pilot experiments (results not shown) we achieved superior signal-to-noise ratio (SNR) on T2w image acquisitions with left-hemispheric RF coil placement (SNR ∼50) when compared to RF coil placement underneath the rat’s head (SNR ∼20). The following sequences were used: 1) a 2D coronal T2w sequence acquired via a RARE (
CSF gadoteric acid administration
For CSF gadoteric acid (DOTAREM, Guerbert LLC, Carol Stream, IL, a.k.a.’Gd-DOTA’) administration, all animals were induced using 3% isoflurane delivered in 100% O2 followed by administration of a bolus of dexmedetomidine (0.015 mg/kg i.p.) and glycopyrrolate (0.2 mg/kg i.p.) with 0.9% NaCl (0.4 ml/kg i.p.). With the rat positioned in a stereotaxic frame, a small catheter was inserted into the cisterna magna and glued into place and represent a robust method of Gd-DOTA delivery. 22 Twenty µl of a 1:5 dilution of Gd-DOTA in sterile 0.9% NaCl, was infused at a rate of 1.5 µl/min into CSF which does not perturb intracranial pressure 24 . After the infusion, the CSF catheter was sealed to prevent leakage and the anesthetized rat was transferred to the MRI instrument for scanning. T1w scan acquisitions commenced ∼1hr after CSF Gd-DOTA administration which represent the ‘peak’ of contrast enhancement in the tissue,23,25 and included fourteen 3D FLASH scans acquired over 60 min (Table 1).
MRI data analysis
The CSF Gd-DOTA enhanced 3D T1w images were processed using an in-house pipeline that utilizes SPM12 (https://www.fil.ion.ucl.ac.uk/spm/) followed by rigid head motion correction. The motion corrected T1w images were subsequently summed to increase SNR using the ‘ADD_VOLUME’ operation in PMOD software (PMOD, version 4.2, PMOD Technologies, Switzerland) which sums the signal in each voxel of the frames over time. Similarly, the 2D multi-echo T2w images were summed along the four TE images using PMOD software and used for analysis. Both summed T2w and CSF contrast enhanced T1w images were, respectively, corrected for B1 intensity inhomogeneity caused by the RF surface coil sensitivity using N4 algorithm. 26 The resulting summed and corrected images were used for hippocampal hyperintensity lesion scoring conducted by two blinded raters.
PVS-like hyperintensity scoring
A total of 12 T2w images from WKY (N = 6) and SHRSP (N = 6) rats, and 11 T1w FLASH images from (N = 5) WKY and (N = 6) SHRSP rats were analyzed by two raters (BM and SC) blinded to the animal strains. For the counting of the number of PVS in the rats the MR slices that covered the hippocampus region was evaluated by two raters. For T2w data this involved ∼20 slices (axial slice plane) and for the T1w scans this involved ∼40–45 slices. Counting of the PVS-like hyperintensities was performed using PMOD (PMOD, version 3.8, PMOD Technologies, Switzerland) using the following criteria: hyperintensities were counted if they covered between 2–4 pixels (in plane pixel size = 80 µm) and when present as a greyish or white “dot” with significantly higher signal intensity than the surrounding tissue. Exceptions were made for single voxels with very high signal intensity which were also counted. The intraclass and inter-rater correlation coefficients were calculated as an indicator of PVS-like hyperintensity scoring reliability for each of the MRI sequences.
Histology and immunohistochemistry
Four SHRSP and two WKY rats were used for histological comparison via Masson’s trichrome staining to evaluate the severity of SVD in comparison to post-mortem brain tissue from subjects diagnosed with SVD (Supplemental Table 1). The remaining WKY and SHRSP rats were used for aquaporin-4 (AQP4) immunohistochemistry. Details on the histology and immunohistochemistry methodology can be found in Supplemental Methods.
Histological data analysis
Images were captured using an Axio Imager Z.2 multi-channel scanning fluorescence microscope equipped with a 20X/0.8 Plan-Apochromat objective (Carl Zeiss), a high resolution ORCA-Fusion Digital CMOS camera (Hamamatsu Photonics), sensitive to a broad-spectrum of emission wavelengths, an X-Cite XYLIS broad-spectrum LED excitation source (Excelitas Technologies), and customized excitation/dichroic/emission filter sets (AVR Optics) which were optimized to detect the following fluorophores with minimal spectral crosstalk: Alexa Fluor 594 and Alexa Fluor 647. Image tiles were individually captured at 0.32 μm/pixel spatial resolution and stitched into whole brain images using the ZEN Blue 2.1 image acquisition software (Carl Zeiss). The pseudo-colored stitched images were exported to Photoshop (Adobe, 2020) and overlaid as individual layers to create whole brain merged composites. For quantitative analysis images were exported as TIFF files. We quantified the microvascular AQP4 polarization in the ventral hippocampus, where the PVS-like hyperintensity lesions were most prevalent, using ImageJ software (Image J 1.52i) as previously described. 22 Specifically, for each rat, one slice from the ventral hippocampus that best matched the MRI images with PVS was selected for the analysis. Briefly, the AQP4 digitized images were imported into ImageJ, scaled, and converted to optical density images. In order to process the samples in an unbiassed manner, a grid (120–130 numbered boxes) was overlaid over the ventral hippocampus (each box area = 100 × 100 pixels). Representative line segments (100 µm for capillaries) were used to extract the immuno-intensity across the micro-vessels selected in each grid-box associated with the hippocampal sulcus. An average of ∼9 capillaries in the sulcus were selected for each and the polarization index for each vessel was calculated (peak-to-baseline level) for each rat.
Matching of T2- and post-contrast T1-weighted MRI with histological sections
Statistical analysis
Neither a priori nor a post hoc power analysis was conducted to formally determine or justify sample size due to the unknown effect size of the impact of SVD pathology in SHRSP rats on numbers of PVS-like lesions when planning the current study. No randomization was performed. All T2 imaging data from the rats were included in the analysis. In one of the rats the CSF contrast administration failed, and this rat was excluded from the T1 imaging data analysis. Normality was examined using the Shapiro-Wilk test. A linear mixed-model with a heterogeneous variance covariance matrix for repeated measures over time was used to analyze the impact of MRI scan sequence and strain on the number of dot-shaped PVS-like hyperintensity lesions within the same rat with fixed effects of ‘time’ (MRI sequence), group (strain i.e., WKY vs SHRSP) and the interaction between time and group. Group differences were calculated using a post-hoc pairwise Fisher’s least significant difference (LSD) that was not adjusted for multiple comparisons. Between-strain analyses were performed as Welch’s two tailed t-tests. The intraclass correlation coefficient (ICC) was used to assess the reliability of lesion scoring for each of the MRI sequences across two raters. In addition, we also calculated the ICC for the inter-rater agreements across the two MRI sequences. The analyses were performed using IBM SPSS Statistics, Version 26. All data are presented as mean ± SD. A p-value of less than 0.05 was chosen to indicate statistical significance and no adjustment of multiple testing was considered.
Results
SHRSP rats have ‘moderate’ SVD when compared to post-mortem tissue from human subjects diagnosed with SVD
To get a better understanding of the severity of cerebral SVD in the 12 M old SHRSP rats used in our MRI study in relation to clinical neuropathological criteria, we compared Masson’s trichrome stained hippocampal sections from SHRSP rats with those obtained post-mortem from subjects diagnosed with SVD. The severity of SVD was assessed based on the extend of distribution of vascular pathology in white matter, basal ganglia, hippocampus and thalami, and the intensity of the morphological changes of affected vessels. Figure 1 shows two of these cases: one with moderate and another with moderate-to-severe cerebrovascular arteriolosclerosis. These diagnoses were supported by staining with trichrome which showed fibrosis/hyalinosis of the small arteries. Formation of Charcot-Bouchard microaneurysms were also noted (arrow), which are associated with the loss of integrity of the vessel wall and microbleeds. In the moderate SVD case (Figure 1(a)) an arteriole with collagenous fibrosis surrounded by an enlarged PVS can be noted. The arteriole is tortuous. In the moderate-to-severe case, more extensive collagenous fibrosis is noted at the level of the arteries and arterioles (Figure 1(b)). Figure 1(c) shows a trichome stain from a normotensive WKY rats at the level of the hippocampal sulcus demonstrating minimal collagenous fibrosis associated with arterioles. However, the corresponding trichome stained hippocampal section from different SHRSP rats shows more extensive collagenous fibrosis and associated dilated PVS (Figures 1(d) to (f)). From these data – based on fibrosis/hyalinosis of the small arteries and enlarged PVS - we concluded that the SVD pathology of the SHRSP rats used in our MRI study was mimicking ‘moderate SVD’ as observed in the human brain.
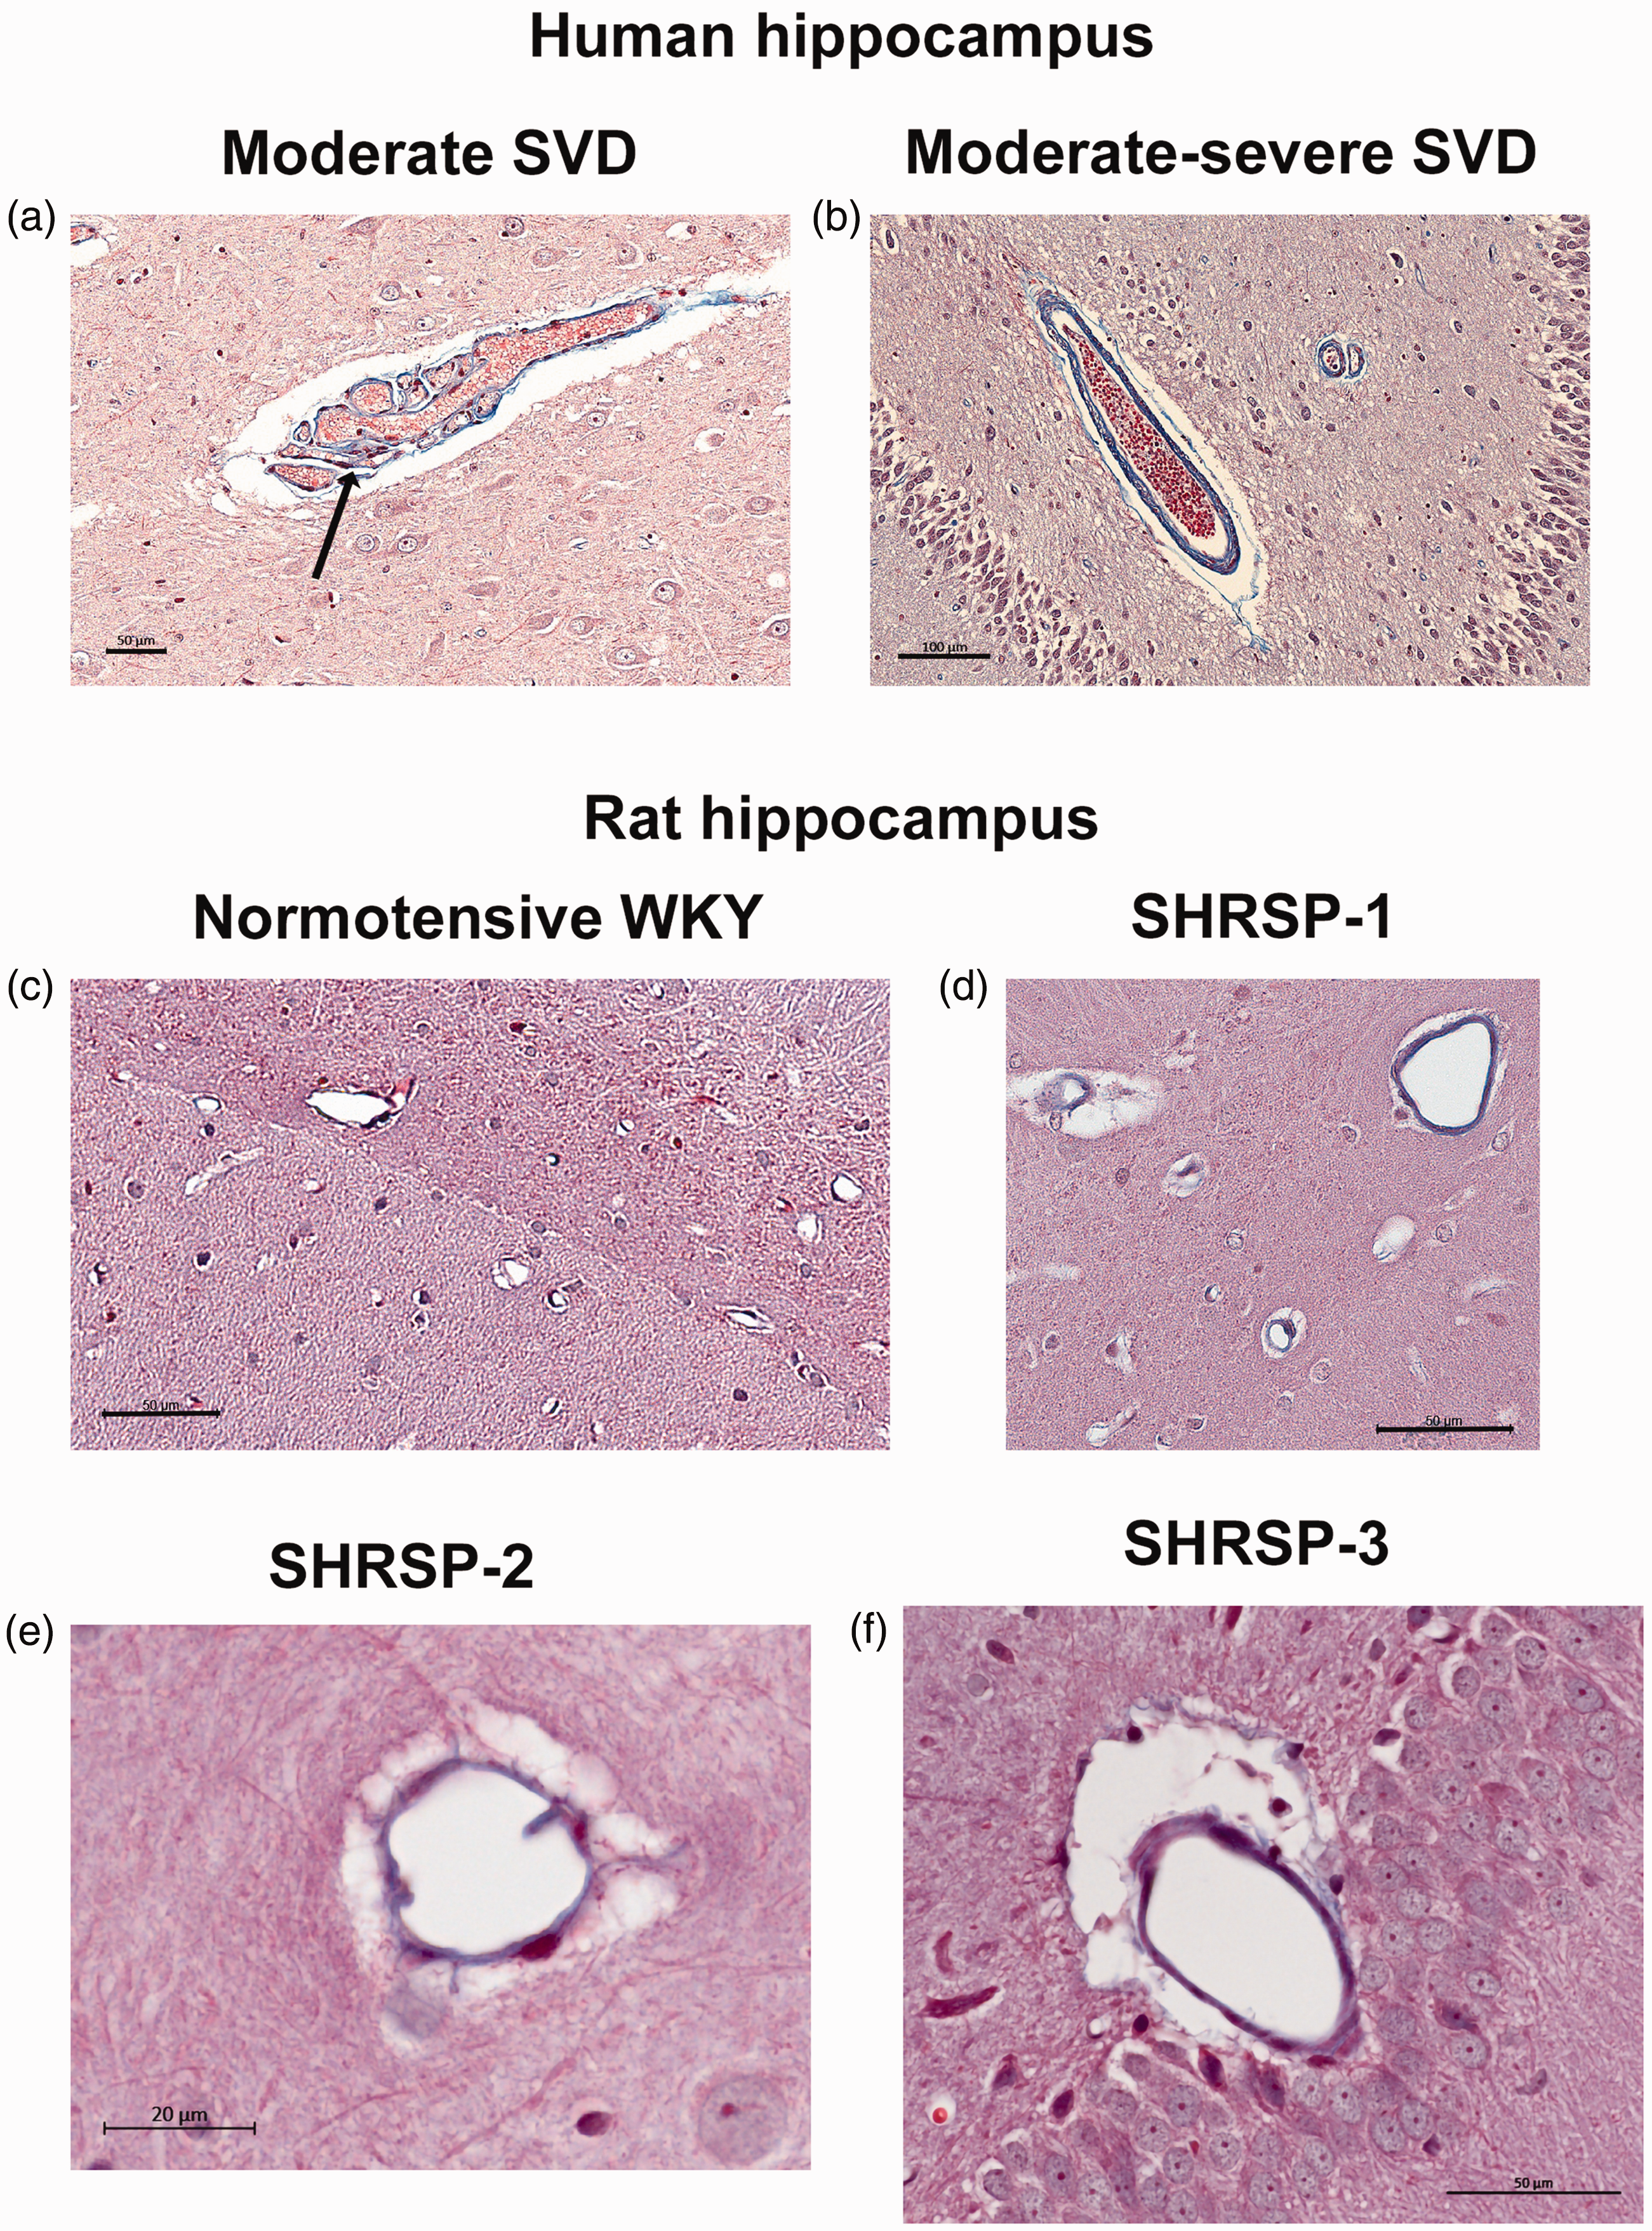
Human post-mortem hippocampal samples compared to SHRSP rat brain (a) Post-mortem Masson’s trichrome stained hippocampal section from a subject diagnosed with moderate cerebral small vessel disease (SVD). This diagnosis was supported by evidence of fibrosis/hyalinosis of the small arteries (blue-color in the vessel wall). The tortuous arteriole with collagenous fibrosis is surrounded by an enlarged PVS. A Charcot-Bouchard microaneurysms can also be noted (arrow). (b) Post-mortem Masson’s trichrome stained hippocampal section from a subject diagnosed with moderate-to-severe case where more extensive collagenous fibrosis is noted at the level of the arteries and arterioles. (c) Trichome-stained section from a normotensive WKY rats at the level of the hippocampal sulcus demonstrating minimal collagenous fibrosis associated with arterioles and (d–f) Masson’s trichrome stained hippocampal sections from three different SHRSP rat showing more extensive collagenous fibrosis and a dilated PVS consistent with ‘moderate’-like SVD. Scale bars: a, c, d, f: 50 µm, b: 100 µm and e: 20 µm.
Blood pressure prior to MRI imaging
To ensure the state of chronic hypertension in the SHRSP rats, we measured the blood pressure prior to MRI imaging. The mean systolic blood pressure (sBP) was significantly elevated in the SHRSP rats compared to WKY rats: (SHRSP (N = 12) sBP = 169 ± 13.5 mmHg vs WKY (N = 6) sBP = 124.5 ± 6.1 mmHg, mean difference = 44.9 mmHg, 95% CI = [35.1, 54.7], p-value <0.0001). Similarly, the mean diastolic blood pressure (dBP) was also significantly increased in the SHRSP compared to WKY rats: (SHRSP (N = 12) dBP = 119.2 ± 11.9 mmHg vs WKY (N = 6) dBP = 71.0 ± 8.8 mmHg, mean difference = 48.2 mmHg, 95% CI = [37.5, 58.8], p-value <0.0001).
Phase 1 MRI imaging results
To optimize the T2w MRI sequence for detecting focal hyperintensities for phase 1 studies, we used a small pilot series of WKY and SHRSP rats. With the RF-coil positioned on the left side of the rat’s head in supine position we acquired T2w images (Figures 2(a) to (c)). In the SHRSP rats, the T2w images revealed subtle hyperintense focal lesions along the sulcus and occasionally in the hilus region of the ventral hippocampus (white arrows, Figures 2(d) and (f)) but not in WKY rats. The hyperintense focal lesions measured ∼100–300 µm across, and in some cases a small vessel (dark spot, red arrow in Figure 2(f)) was noted. On CSF contrast enhanced T1w images acquired on the same rats, focal hyperintensities measuring ∼200–300 µm across were also identified along the sulcus in the CA1/CA2 area of the ventral hippocampus and occasionally in the hilus of dentate gyrus (Figures 2(e) and (g)). A preliminary two-tailed, paired student’s t-test revealed that the CSF contrast enhanced T1w images of SHRSP rats (N = 5) uncovered significantly more focal hyperintensities in both the dorsal and ventral hippocampus compared to corresponding T2w images (T1w lesions = 18.0 ± 10.1 vs T2w lesions =4.9 ± 2.9, p = 0.040). From phase 1 experiments, we concluded that 1) the T2w sequence was sufficiently sensitive to detect PVS-like hyperintensities in the ventral hippocampus of SHRSP rats and 2) CSF contrast enhancement with Gd-DOTA appeared to increase the frequency of lesion detection in the hippocampus on T1w compared to T2w images.
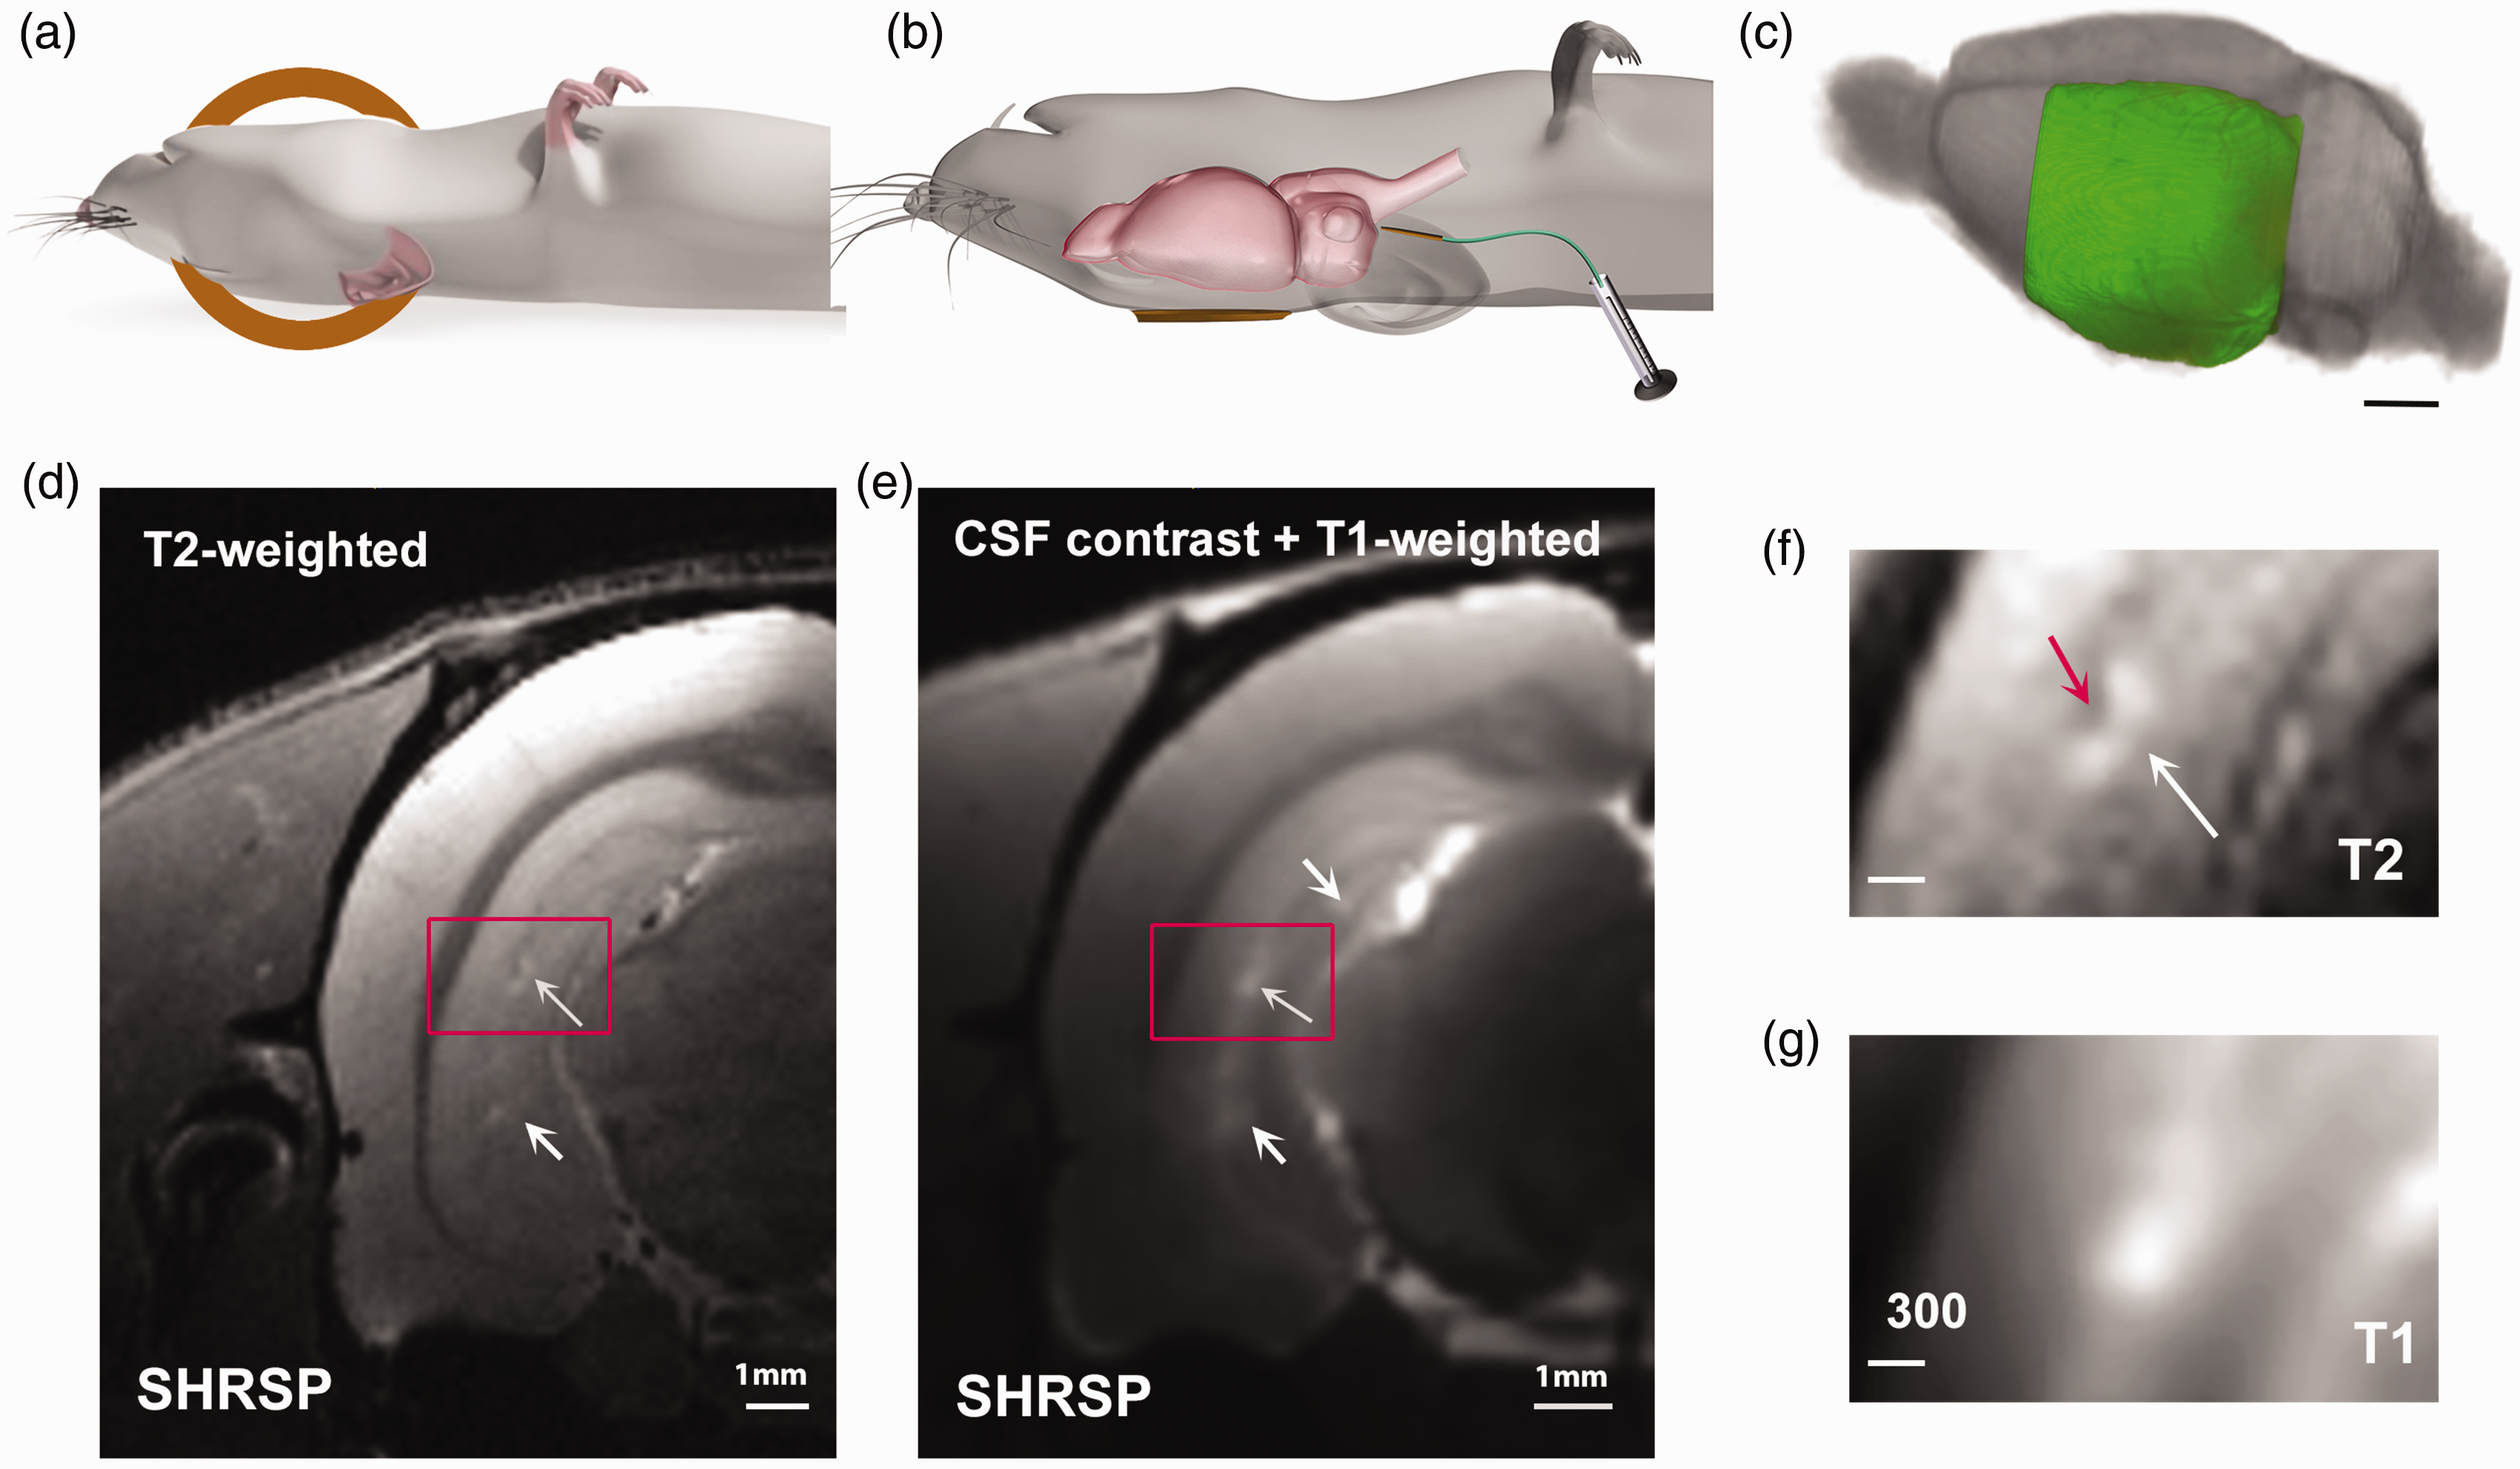
MRI set up for Phase 1 preliminary studies (a) Illustration of rat positioned supine with the 1-cm radio-frequency (RF) surface coil posited at the left side of the rat’s head. (b) Illustration of position of the rat after CSF administration of gadoteric acid. The catheter is left in place after infusion. (c) Illustration of the left-hemispheric field-of-view captured with the RF coil positioning. Scale bar 3 mm. (d) Representative T2-weighted MRI at the level of the ventral hippocampus from a SHRSP rat. The white arrows point to PVS-like hyperintensity lesions in the hippocampus. The red box highlights the area shown in f. (e) Corresponding T1-weighted MRI from the same rat shown in d, after CSF administration of gadoteric acid. The white arrows highlight spot-like hyperintensity areas in the hippocampus. The red box highlights the same hyperintensity area as shown in d and g. Scale bars for d, e = 1 mm and (f) PVS-like hyperintensity lesion from the T2-weighted image magnified, showing the dark vessel (red arrow) and the moon-shaped PVS around it with high signal due to fluid accumulation. (g) the same PVS-like hyperintensity area is shown on the contrast enhanced T1-weighted MRIs acquired at an in-plane resolution of 0.15 mm2. The lesion measures ∼200–300 µm across. Scale bars for f, g = 300 µm.
MRI reveals more PVS-like hyperintensities in SHRSP compared to WKY rats
Having optimized the MRI sequences for the study, we commenced on the observational phase 2 experiments. A series of WKY (N = 6) and SHRSP rats (N = 6) underwent two MRI scan sessions (T2w and CSF contrast enhanced T1w MRI) 1-week apart (Figure 3(a)). Representative appearances of PVS-like hyperintensities on T2w MRI images at the level of the ventral hippocampus (nearest Bregma distance −5.80 mm 27 ) from three different SHRSP rats are shown in Figures 3(b) and (d) (white arrows point to the ovoid-shaped lesions). The majority of the PVS-like hyperintensities were observed in proximity to the sulcus, and typically measured ∼100–300 µm across. Most of the focal hyperintensities were located just medial to the sulcus in the CA2/CA1 areas. Occasionally, smaller, and brighter appearing lesions could also be spotted in the hilus region and further anteriorly in the dorsal hippocampus. Notably, further ventral (Bregma level –6.30 mm 27 ), fluid filled PVS appeared as bright linearly shaped signals along the vasculature in all of the SHRSP rats (Figures 2(e) and (f)) but not in any of the WKY rats (Figure 3(g)). The penetrating vasculature observed in the ventral hippocampus most likely represented branches from the posterior cerebral artery penetrating into the hippocampus. 28 Differences in the appearance of PVS-like hyperintensities on the T2w and corresponding CSF contrast enhanced T1w MRIs from the same SHRSP and WKY rats are shown in Figures 3(h) and (i) and Figures 3(j) and (k), respectively. In the SHRSP rat, three different lesions can be spotted in along the sulcus of the ventral hippocampus on the contrast enhanced T1w image, however, only one is visible on the corresponding T2w image (Figures 3(h) and (i)). In the WKY rat, no lesions were visible on T2w images, but two lesions emerged on the CSF contrast enhanced T1w MRI (Figure 3(k)). Importantly, on the contrast enhanced T1w images, the focal hyperintensities most often appeared brighter implying that Gd-DOTA was contained within the small reservoirs associated with the enlarged PVS. Notably, there was no evidence of contrast enhancement of the larger vasculature (e.g., superior sagittal sinus or large arteries) strongly suggesting that the Gd-DOTA did not transfer across the blood brain barrier to the vascular compartment or at least not in sufficient quantities to increase blood signal. The hippocampus anatomy such as the pyramidal cell layer and granule cell layer of the dentate gyrus was often revealed more clearly on the contrast enhanced T1w images (Figure 3(i)).
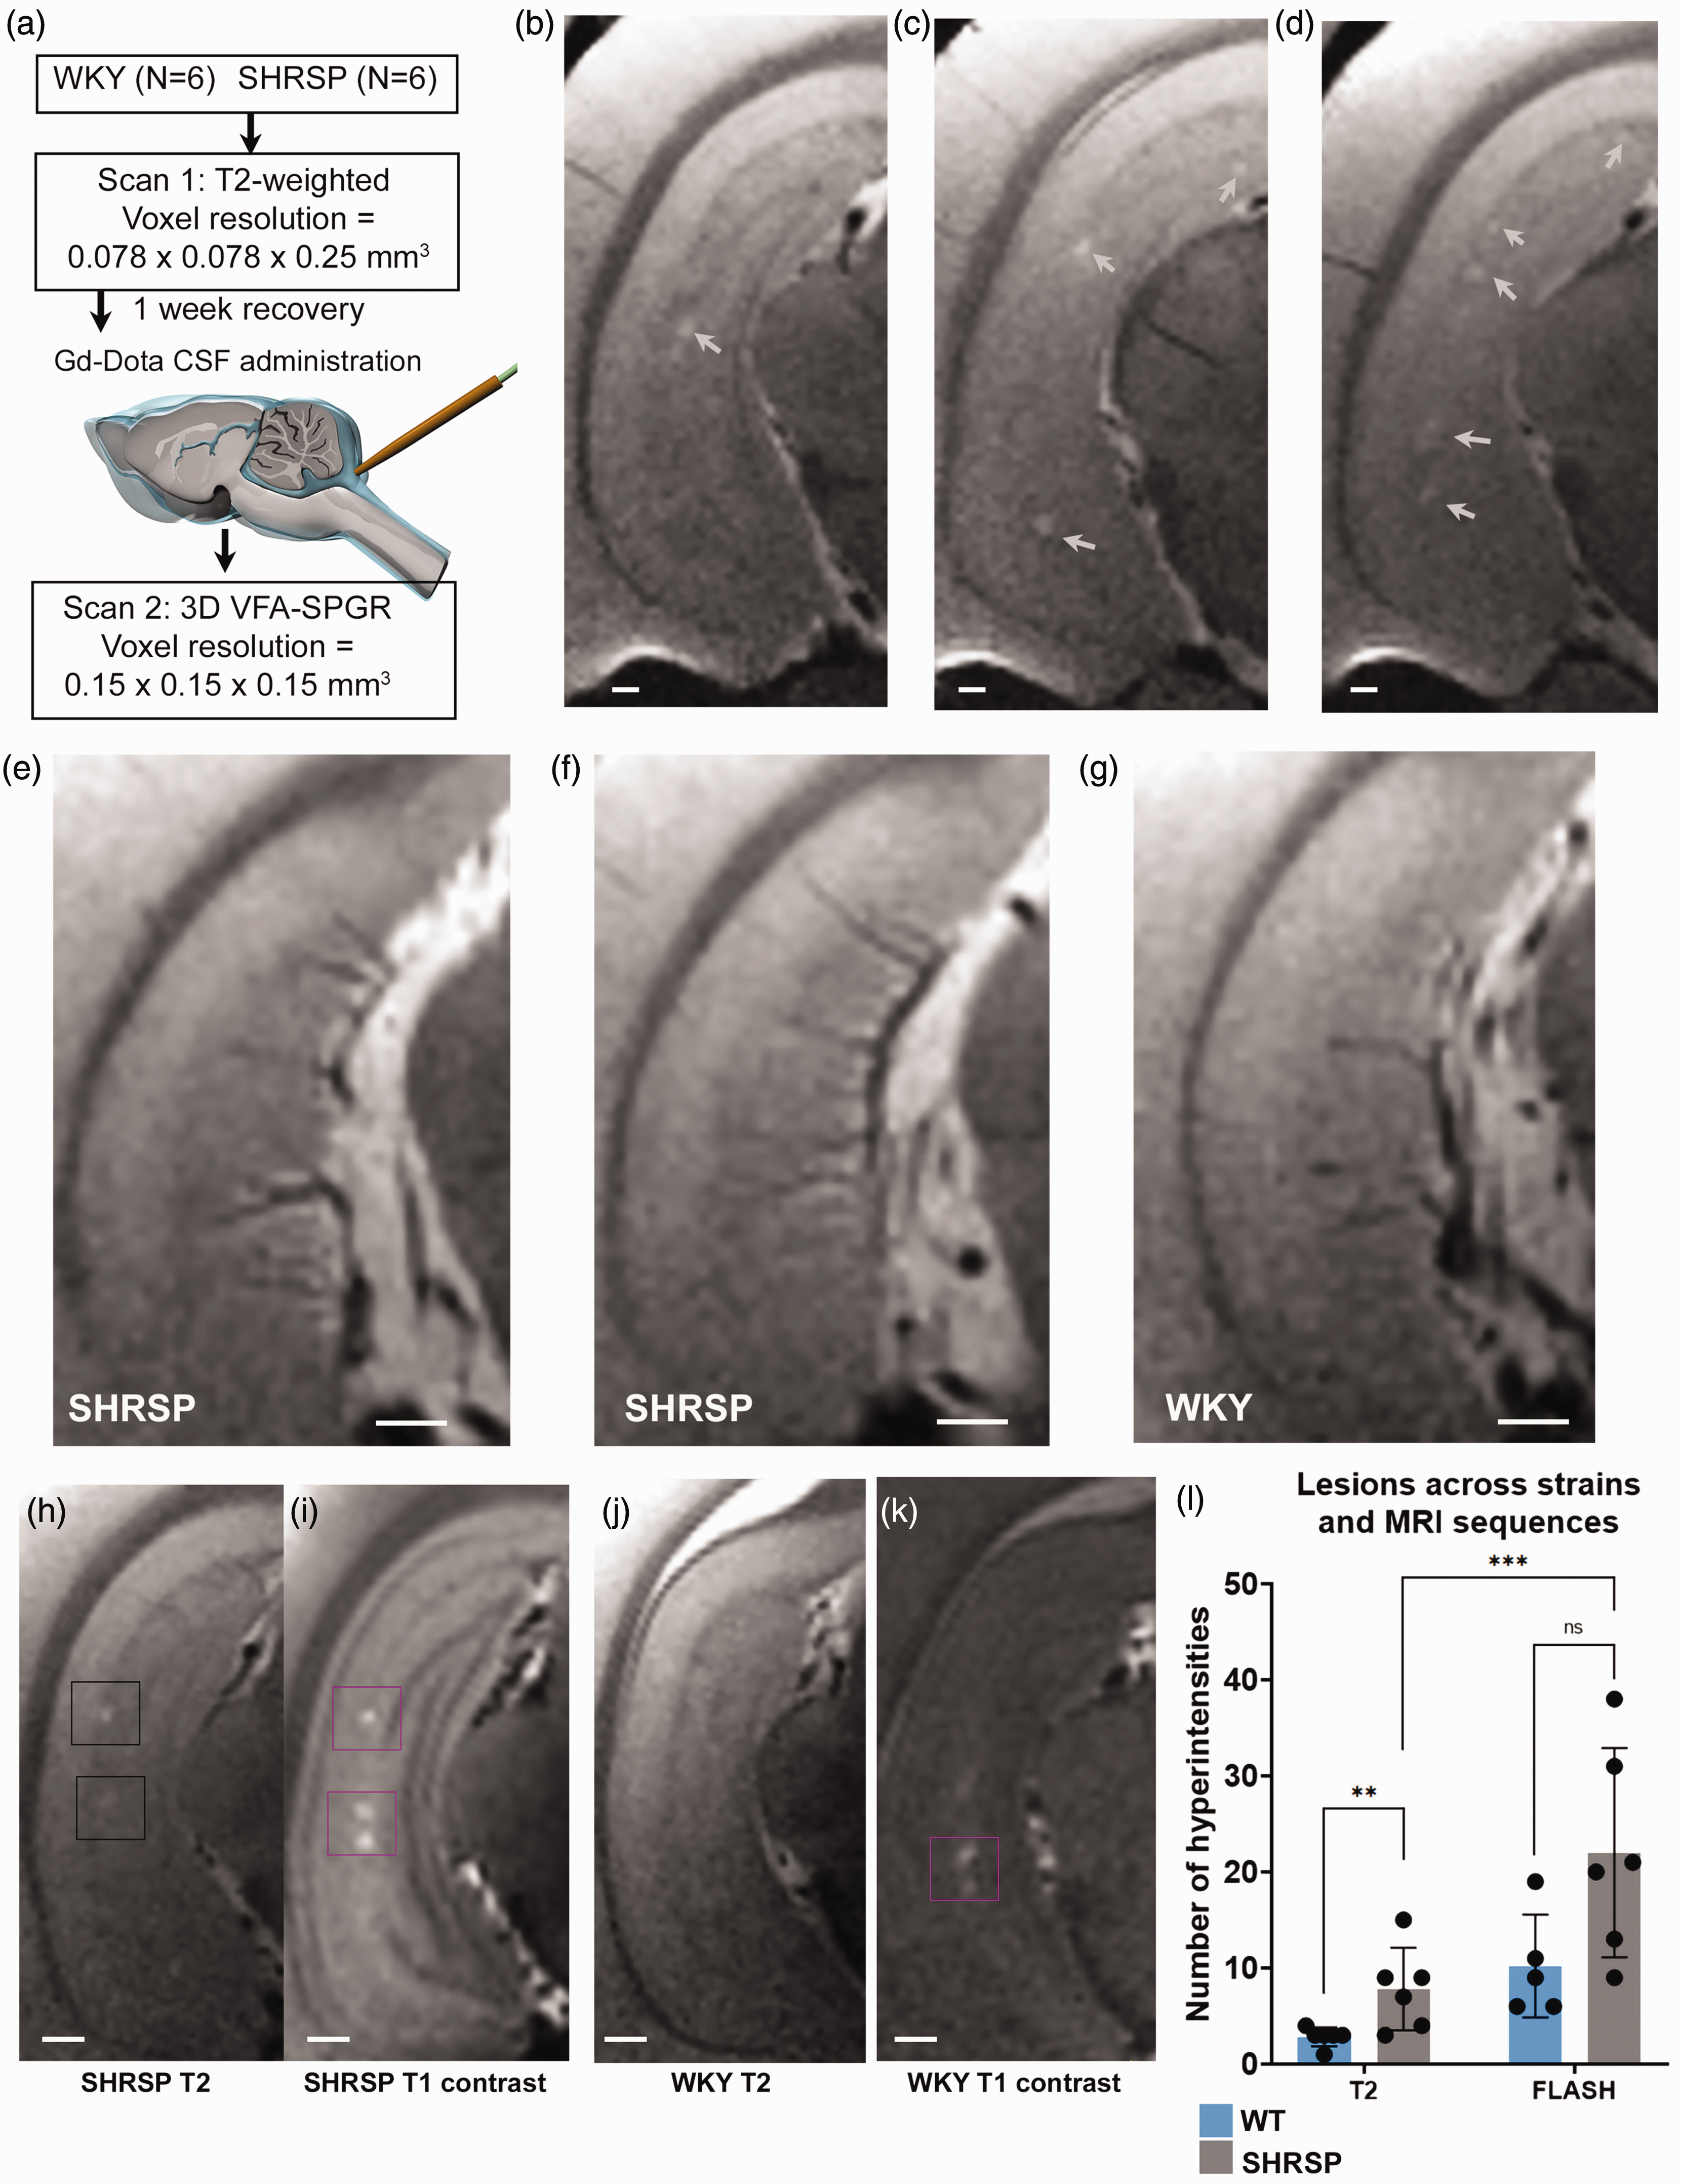
PVS-like hyperintensity lesions are increased in SHRSP compared to WKY rats (a) Overview of experimental study design. (b–d) Representative T2-weighted MRI at the level of the ventral hippocampus from three different SHRSP rats showing PVS-like hyperintensity lesions along the sulcus (white arrows). (e, f) Representative T2-weighted images from two different SHRSP further ventral in the hippocampus showing linearly shaped hyperintensity areas along the penetrating vasculature. (g) Corresponding T2-weighted image from a normal WKY rat showing penetrating vasculature without enlarged PVS. (h, i) T2- and corresponding post-contrast T1-weighted MRI from a SHRSP rats showing more PVS-like hyperintensity lesions on the latter image. (j, k) Corresponding MRI images from a normal WKY rat showing hyperintensity spots (magenta box) on the T1 contrast image but not on the T2-weighted image and (l) graph showing the number of lesions in WKY and SHRSP across the two different MRI sequences. Data are mean ± SD.
The intraclass correlation coefficient (ICC) measuring the reliability of the reported numbers of focal PVS-like hyperintensities in the hippocampus are shown in Supplemental Table 2 and demonstrates that the ICC for each of the raters was robust for both sequences. The average numbers (calculated as the mean of four measurements by two raters) of PVS-like hyperintensities on T2w and corresponding CSF contrast enhanced T1w MRIs are shown in Table 2. The statistical analysis of the T2w images revealed that the total burden of PVS-like hyperintensities was significantly lower in the WKY rats compared to the SHRSP rats (p-value = 0.023, Table 2). In the corresponding analysis of the T1w MRIs, the number of lesions tended to be higher in the SHRSP compared to WKY rats but did not reach statistical significance (p-value = 0.058, Table 2). For each strain, the pairwise analysis of lesion detection across the two MRI sequence modalities revealed no differences for the WKY rats (p-value = 0.100), however, for the SHRSP rats the number of lesions was significantly higher on the T1w compared to T2w (p-value = 0.003, Table 2). We also measured the inter-rater agreements which demonstrate excellent intraclass correlation coefficients for the two sequences (Supplemental Table 3). From these data we concluded that 1) the T2w sequence was sufficiently sensitive to detect PVS-like hyperintensity differences across WKY and SHRSP rats, and 2) CSF contrast enhancement increased the sensitivity for detection of PVS-like lesions in both SHRSP and WKY rats.
(A) Summary of number of hippocampal hyperintensity lesions across strains for each MRI sequence.
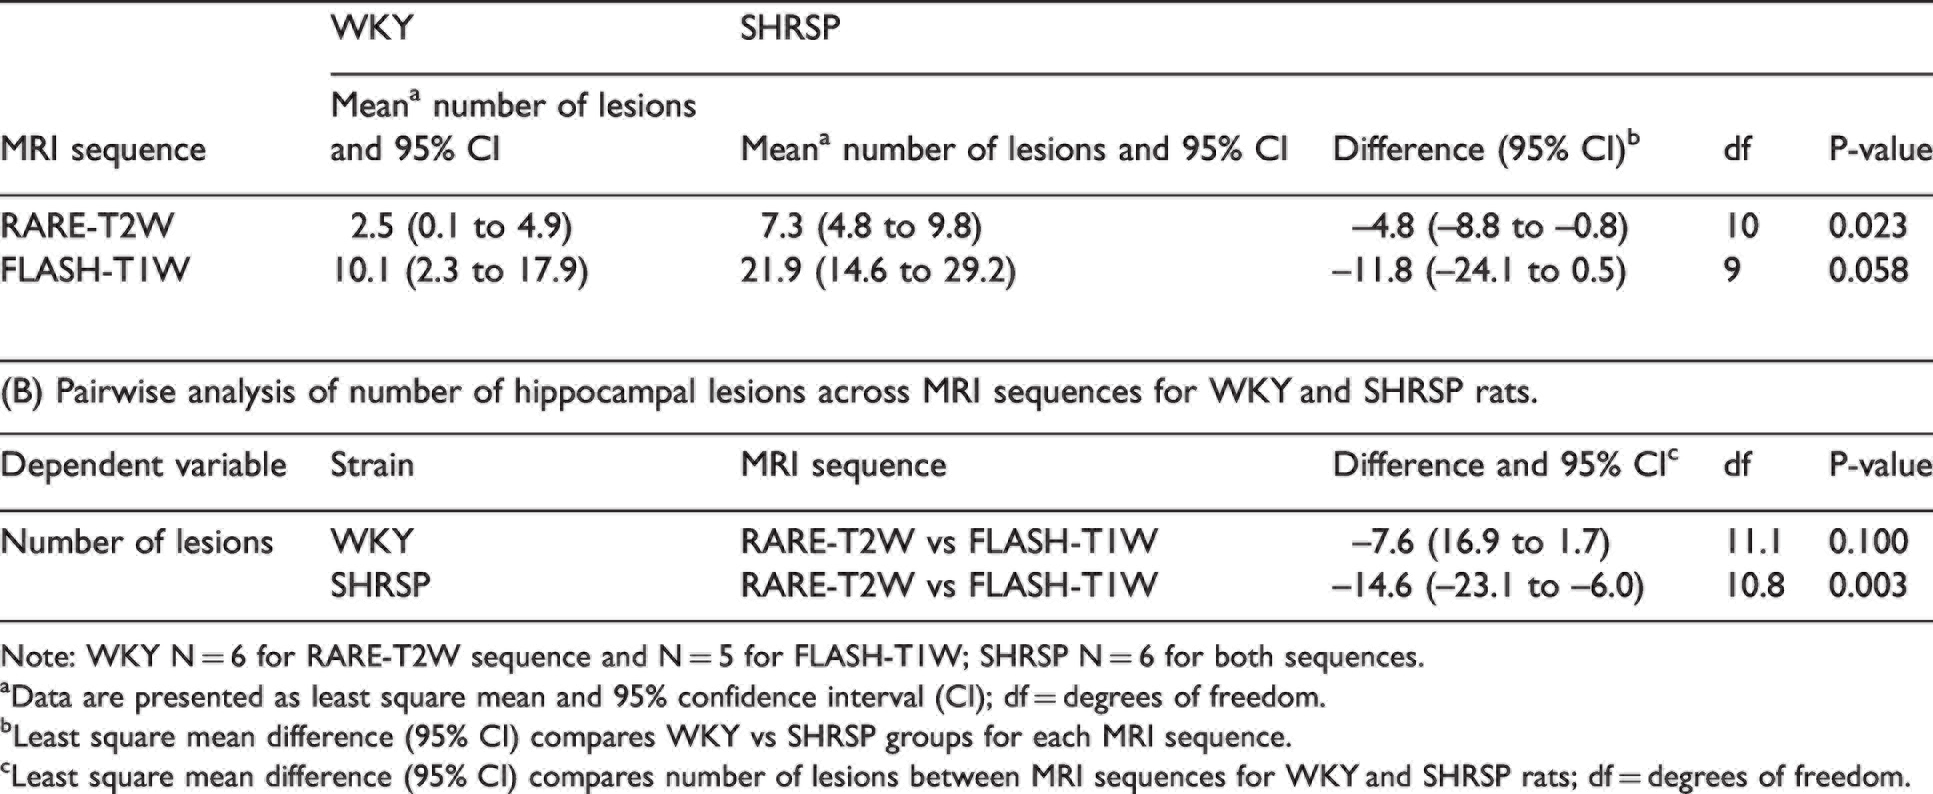
Note: WKY N = 6 for RARE-T2W sequence and N = 5 for FLASH-T1W; SHRSP N = 6 for both sequences.
aData are presented as least square mean and 95% confidence interval (CI); df = degrees of freedom.
bLeast square mean difference (95% CI) compares WKY vs SHRSP groups for each MRI sequence.
cLeast square mean difference (95% CI) compares number of lesions between MRI sequences for WKY and SHRSP rats; df = degrees of freedom.
Histopathology
Our observation of more frequent PVS-like hyperintensities in the hippocampus of SHRSP compared to WKY rats on T2w MRI images implied greater than normal PVS fluid accumulation and possibly changes in AQP4 immunoreactivity similar to what we have previously documented in SHRSP rats. 22 For the ∼12 M old SHRSP and WKY rats used in this study, we assessed the AQP4 immunoreactivity associated with hyperintensity lesions in the ventral hippocampus. Figure 4(a) shows a T2w image from a SHRSP rat highlighting a hyperintensity lesion just medial to the sulcus in the CA1 of the ventral hippocampus. The ovoid-shaped lesion on the T2w image and corresponding T1w image are shown at higher magnification in Figure 4(b) and (c), respectively and measures ∼300–400 µm across. The AQP4 immunoreactivity (merged with RECA-1 immunoreactivity) at the level of the ventral hippocampus from the same SHRSP rat is shown in Figure 4(d) and the area of interest corresponding to the hyperintensity lesion on the MRI images is highlighted (white box, Figure 4(d)). First, from the AQP4 expression pattern in the ventral hippocampus, it is evident that there are multiple localized areas with intense background immunoreactivity surrounding the larger vasculature along the hippocampal sulcus. In other words, if increased AQP4 immunoreactivity is associated with T2w or T1w hyperintensity lesions, we would have expected to see a lot more PVS-like hyperintensities on the MRI images. The appearance of a single hyperintensity lesion on the MRI images implied that there would be other pathology – apart from AQP4 immunoreactivity – associated with the ‘hot spot’. Figure 4(e) shows the area of interest at higher magnification revealing a small arteriole (∼25–30 µm across) surrounded by a large moon-shaped PVS, i.e., empty void which is likely associated with the hyperintensity areas on the in vivo MRI images. We were able to associate ‘empty voids’ or enlarged PVS of smaller arterioles to focal hyperintensities in 5 out of 6 SHRSP rats. To further quantify the AQP4 expression pattern in the SHRSP compared to WKY rats, we quantified the AQP4 immunoreactivity related to microvasculature using the polarization index method previously developed 22 within the sulcus area of ventral hippocampus (Bregma ∼5.80 mm) as defined by the overlaid grid. The mean microvascular AQP4 polarization index in the sulcus was significantly higher in WKY compared to SHRSP rats (WKY N = 5, ∼9 capillaries/rat polarization index = 15.5 ± 2.4 a.u. compared to SHRSP N = 5, ∼9 capillaries/rat polarization index 7.9 ± 3.9 a.u., mean difference = −7.6 a.u., 95% CI = [−12.5, −2.7], p-value = 0.008) as shown in Figure 4(f).
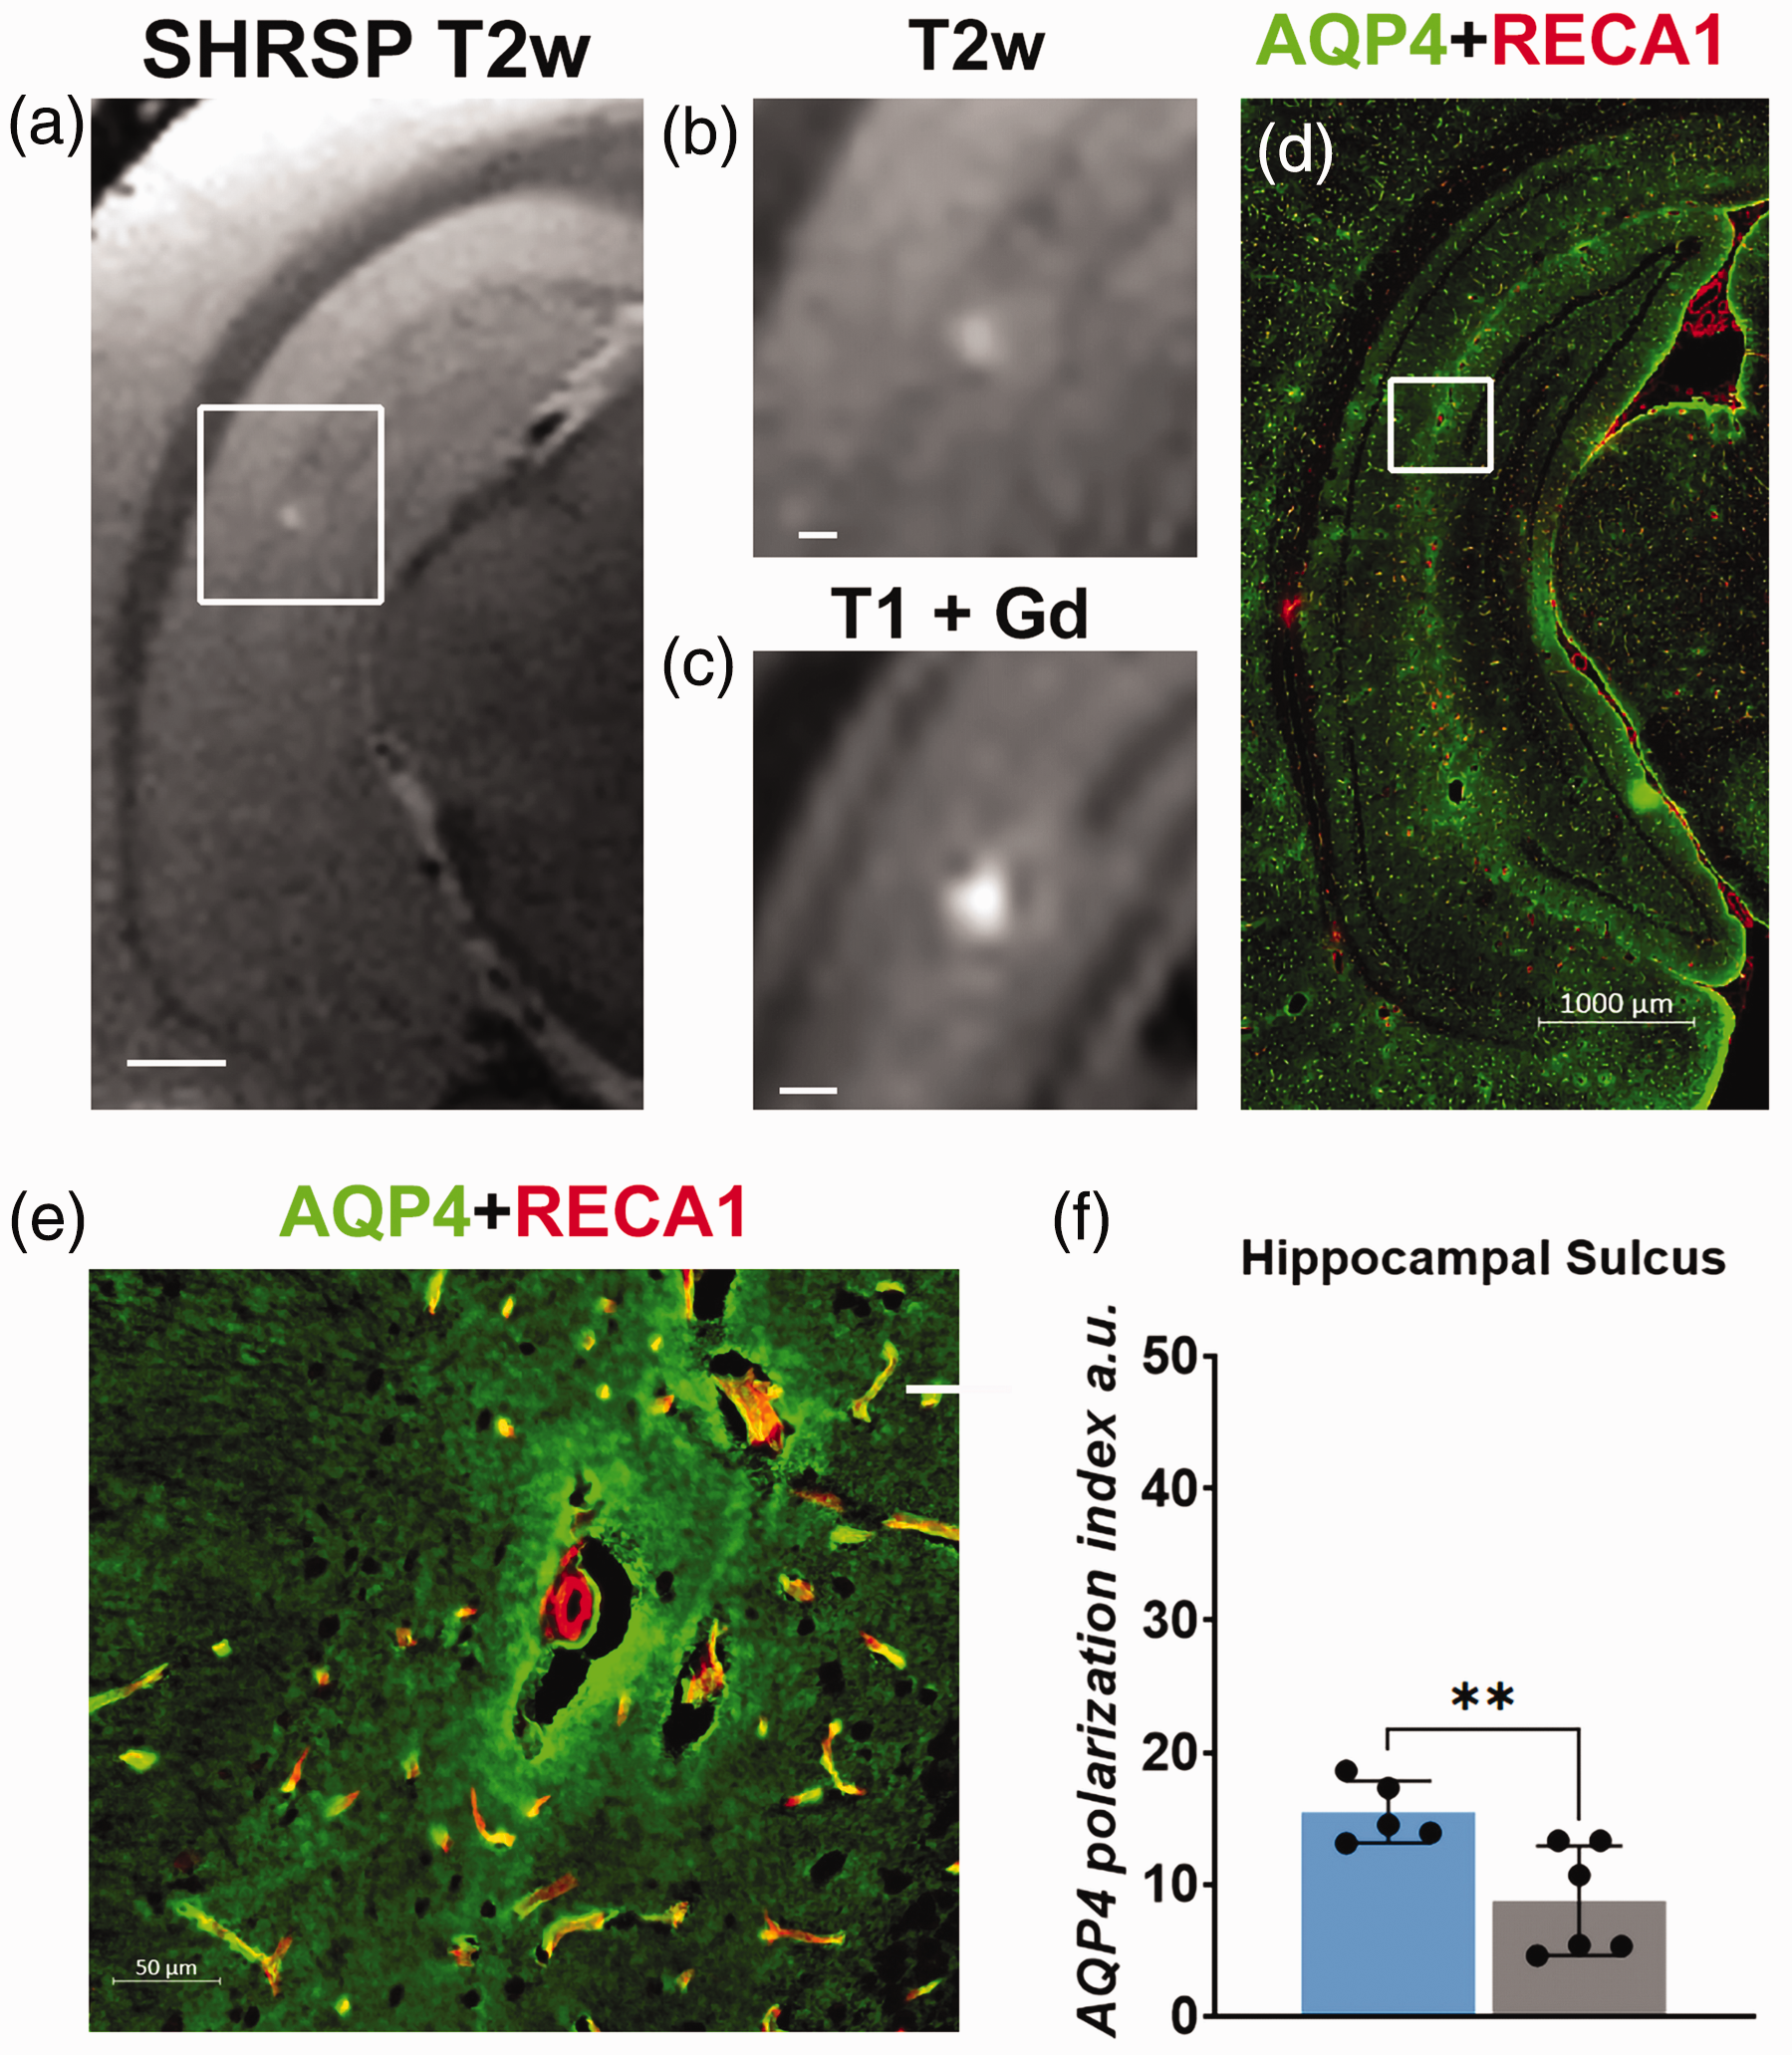
Histopathology associated with a PVS-like hyperintensity lesion (a) T2-weighted MRI from a SHRSP rat at the level of the ventral hippocampus. The white box indicates a prominent PVS-like hyperintensity spot in proximity to the sulcus. Scale bar = 1.5 mm. (b, c) PVS-like hyperintensity lesion magnified. b scale bar = 300 µm and c scale bar = 400 µm. (d) Corresponding histological section of the same rat shown in a, stained for AQP4 immunofluorescence (green) and RECA-1 (red). The white box highlights the area with the PVS-like hyperintensity lesion on the MRI images. (e) Magnification of the area of interest showing a small arteriole surrounded by an enlarged, void PVS. Scale bar = 50 µm and (f) graph showing the difference in the AQP4 polarization index of the microvasculature in the hippocampal sulcus area. Data are mean ± SD.
Discussion
Animal models of SVD such as the SHR and SHRSP rats have helped bridge the gap in knowledge of SVD pathophysiology in the setting of chronic hypertension.13,14,16,22,29,30 In our study, we focused on developing MRI techniques which would enhance detection of PVS-like hyperintensities on T2w images in SHRSP rats similar to PVS observed clinically. 6 The hippocampus region was chosen as the focus of our investigation because it is large in rats and although the majority of PVS on MRI images in human brain are located in the basal ganglia and the white matter they have also been observed in the hippocampus.18–20 Several visual scores rate PVS in the hippocampus and midbrain as well as basal ganglia and hemispheric white matter. 20 We first established that 12 M SHRSP rats in our study had comparable pathology to ‘moderate’ cases of human SVD. Further, in 12 M old SHRSP rats we observed an increased number of PVS-like hyperintensities on the T2w images in the hippocampus – most frequently just medial to the sulcus in the CA1/CA2 area – when compared to age-matched WKY control rats. We did not observe PVS-like hyperintensities in any other brain region in the rats on the T2w images. In the clinical setting PVS on T2w or T1w MRI images are defined as fluid-filled spaces that follow the course of a vessel as it penetrates the brain parenchyma.3,6 Furthermore, because they follow the course of penetrating vessels, they appear linear when imaged parallel to the course of the vessel, and round when imaged at a right angle to the vessel.3,6 In the hippocampus of the SHRSP rats, we noted both types of PVS described clinically on the T2w MRIs: The rounded lesions were visible along the sulcus and within the hilus area, and linearly shaped PVS were observed along the penetrating arteries in the most ventral part of the hippocampus (Figure 3). Notably, the PVS-like lesions were located in proximity to the hippocampal sulcus in the CA1/CA2 or CA3 area and/or hilus region and are therefore representative of actual enlarged PVS along penetrating arteries and unlikely to represent benign ‘hippocampal sulcal cavities’.31–33 Hippocampal sulcal cavities or cysts are commonly observed in humans and thought to develop as the result of folding of the hippocampus during development and not per se considered pathological.31,34
The total number of rounded PVS-like hyperintensities in the left hippocampus averaged ∼7 in SHRSP rats and ∼3 in WKY rats. Our findings of PVS-like hyperintensities in the hippocampus on the T2w images acquired at 0.08 × 0.08 × 0.225 mm3 are complementary to data from a recent study by Hannawi et al. 35 who acquired T2w MRIs at a voxel resolution of 0.117 × 0.117 × 1 mm3. They reported an average number of 3 lesions in the whole hippocampus of SHRSP male rats while only ∼1 lesion in the age-matched WKY rats. 35 Notably, in this study we positioned the RF coil on the left side of the rat’s head which enabled acquisition of T2w images with better SNR – albeit only of the left hemisphere - compared to positioning the surface coil under the rat’s head. Accordingly, if both hemispheres were imaged, an even higher number of hyperintensity lesions in the SHRSP rats would be reported. The RF coil positioning approach might explain why we detected more PVS-like hyperintensities in the SHRSP rats compared to those reported by Hannawi et al., 35 . Alternatively, the older age of the SHRSP rats used in our study might also have contributed to the increased lesion burden as aging augments the visible PVS burden in the human brain. 20 Further, in the study by Hannawi et al., the SHRSP and WKY rats were anesthetized with isoflurane during the MRI scanning 35 whereas we used a balanced anesthesia with dexmedetomidine and low dose isoflurane (DEXM-I). We specifically chose DEXM-I because it is an anesthetic regimen which induce less vasodilation compared to pure isoflurane21,36 which, might have adversely affected the visualization of PVS. Finally, It is well established that the blood pressure in male SHRSP is significantly higher than in female SHRSP. 37 In the current study we used female rats whereas Hannawi et al., used male rats. 35 It is possible that a greater visible PVS burden would have been present in male SHRSP compared and future studies should investigate this in larger cohorts.
It is important to further discuss that PVS outside of the hippocampus was not detected in SHRSP rats which is different from the clinical condition of SVD in humans where PVS are predominantly observed in the basal ganglia and the white matter. Recently, Wardlaw et al. discussed caveats of the experimental SVD models and why the rodent models are different from human pathology. 38 The highlighted differences across human and rodent brain include: i) the larger proportion of white and grey matter in the human compared to the rodent brain, ii) the complexity of cortical folding in human brain and, iii) the different vascular anatomy. 38 Further, sporadic human SVD typically occurs in mid- or late life, and older SHRSP rodents are challenging as a test platform due to co-occurring pathology including stroke. Also, SVD in humans in mid- to late life frequently occur on a background of multiple risk factors such as hypertension, hyperlipidemia, smoking, lifelong poor diet, lack of exercise, or socioeconomic stress, and factoring all of these exposures into the rodents would be impossible. 38
On the T2w images, the fluid filled PVS have a signal intensity similar to that of CSF, and clinically they are also referred to as Virchow Robin spaces which are known to be connected with the subarachnoid space.39–41 We therefore hypothesized that administration of a Gd-based tracer into subarachnoid CSF would enhance PVS visibility on T1w images of the SHRSP rats. Our hypothesis was corroborated as the mean number of PVS-like lesions increased 3-fold on T1w images from the SHRSP rats after CSF contrast administration when compared to the corresponding T2w MRI. In WKY rats, the number of PVS-like lesions also increased 2-fold after CSF contrast administration. These findings have several implications. First, since the WKY control rats also exhibited an increase in PVS-like lesions after CSF contrast administration, the data suggest that this approach might be associated with a false positive outcome. However, in the human brain, visible PVS on T2- or T1w images are often incidental findings even in younger healthy subjects 6 . Therefore, it is likely that the increase in visible PVS-like lesions with CSF contrast is indeed representative of enlarged PVS in both 12 M SHRSP and WKY rats. The full diagnostic and prognostic significance of PVS in human brain still remains unknown although they increase in frequency with advancing age 39 , impaired microvascular health 42 and with worsening cognition.40,43
The observation that the CSF Gd-DOTA signal was most intense in the PVS and did not appear to enhance the vascular compartment suggests that the blood brain barrier (BBB) integrity was intact in the SHRSP rats. However, Schriber et al., previously reported IgG leakage into the walls of small vessels of SHRSP rats which increased with aging. 44 Further, the number of pericytes, which are integral to BBB integrity45,46 have been shown to decline with hypertension. 47 We did not specifically test for BBB integrity in our study, and it is possible that BBB disruption might have contributed to the increased frequency of PVS-like hyperintensities in SHRSP rats observed on the MRI images.
Our data suggest that a large number of PVS-like hyperintensities in SHRSP and WKY went undetectable by T2w imaging. The PVS on the T2w images appeared much more subtle than those uncovered on the T1w images which were very bright and well defined. The lack of PVS ‘brightness’ on the T2w images is likely due to volume averaging effects due to insufficient spatial resolution and data post-processing. However, in spite of the more subtle appearance of PVS on the T2w images, the intraclass correlation coefficients for the two raters indicated excellent reliability of the lesion scoring for both of the MRI sequences.
We included the AQP4 expression analysis in our study for several reasons: 1) the presence of dilated PVS in the human brain has been proposed to be rooted in dysfunctional glymphatic transport6,38,48 and 2) AQP4 water channels are implicated in brain waste clearance49,50 and 3) glymphatic transport has been shown to be decreased in rodent models with chronic hypertension and arteriolosclerosis22,30. However, the corresponding post-mortem histopathology revealed that although AQP4 expression at the level of the capillaries was decreased in the SHRSP compared to WKY rats, there appeared to be no differences in the AQP4 immunofluorescent ‘signature’ associated with the PVS-like hyperintensities in the CA1/CA2 areas of the hippocampus or hilus region. Instead, in SHRSP rats in which we were able to cross-match the histological sections to corresponding T2w or post-contrast enhanced T1 MRI images the histopathological ‘signature’ was enlarged PVS voids. From these data we concluded that AQP4 expression associated with small arterioles were likely not the culprit for the hippocampal PVS hyperintensities observed on the MRI images. However, more robust and comprehensive methods for registering histological data to MRI51,52 will be needed to fully address the importance of AQP4 expression and PVS pathology.
In summary, we documented that the 12 M SHRSP rats had comparable pathology to ‘moderate’ SVD in post-mortem tissue from human subjects. With T2w MRI an increased number of PVS-like hyperintensity lesions in the hippocampus was observed in SHRSP compared to WKY rats and the T1-weighted CSF contrast enhancement approach improved the overall detection rate. Based on our results, we propose that the MRI techniques developed – in particular the non-invasive T2w sequence - are sufficiently robust to be used as a screening technique for investigating relevant pathology in established and new SVD rat models. Such screening tools are important for studies of the pathogenesis of SVD, for identifying potential targets for future mechanistic studies and for prevention of SVD.
Supplemental Material
sj-pdf-1-jcb-10.1177_0271678X221105668 - Supplemental material for Characterization of perivascular space pathology in a rat model of cerebral small vessel disease by in vivo magnetic resonance imaging
Supplemental material, sj-pdf-1-jcb-10.1177_0271678X221105668 for Characterization of perivascular space pathology in a rat model of cerebral small vessel disease by in vivo magnetic resonance imaging by Brittany Monte, Stefan Constantinou, Sunil Koundal, Hedok Lee, Feng Dai, Zachary Gursky, William E Van Nostrand, Armine Darbinyan, Berislav V Zlokovic, Joanna Wardlaw and Helene Benveniste in Journal of Cerebral Blood Flow & Metabolism
Supplemental Material
sj-pdf-2-jcb-10.1177_0271678X221105668 - Supplemental material for Characterization of perivascular space pathology in a rat model of cerebral small vessel disease by in vivo magnetic resonance imaging
Supplemental material, sj-pdf-2-jcb-10.1177_0271678X221105668 for Characterization of perivascular space pathology in a rat model of cerebral small vessel disease by in vivo magnetic resonance imaging by Brittany Monte, Stefan Constantinou, Sunil Koundal, Hedok Lee, Feng Dai, Zachary Gursky, William E Van Nostrand, Armine Darbinyan, Berislav V Zlokovic, Joanna Wardlaw and Helene Benveniste in Journal of Cerebral Blood Flow & Metabolism
Supplemental Material
sj-pdf-3-jcb-10.1177_0271678X221105668 - Supplemental material for Characterization of perivascular space pathology in a rat model of cerebral small vessel disease by in vivo magnetic resonance imaging
Supplemental material, sj-pdf-3-jcb-10.1177_0271678X221105668 for Characterization of perivascular space pathology in a rat model of cerebral small vessel disease by in vivo magnetic resonance imaging by Brittany Monte, Stefan Constantinou, Sunil Koundal, Hedok Lee, Feng Dai, Zachary Gursky, William E Van Nostrand, Armine Darbinyan, Berislav V Zlokovic, Joanna Wardlaw and Helene Benveniste in Journal of Cerebral Blood Flow & Metabolism
Supplemental Material
sj-pdf-4-jcb-10.1177_0271678X221105668 - Supplemental material for Characterization of perivascular space pathology in a rat model of cerebral small vessel disease by in vivo magnetic resonance imaging
Supplemental material, sj-pdf-4-jcb-10.1177_0271678X221105668 for Characterization of perivascular space pathology in a rat model of cerebral small vessel disease by in vivo magnetic resonance imaging by Brittany Monte, Stefan Constantinou, Sunil Koundal, Hedok Lee, Feng Dai, Zachary Gursky, William E Van Nostrand, Armine Darbinyan, Berislav V Zlokovic, Joanna Wardlaw and Helene Benveniste in Journal of Cerebral Blood Flow & Metabolism
Footnotes
Funding
The author(s) disclosed receipt of the following financial support for the research, authorship, and/or publication of this article: This work was supported by a grant from the Foundation Leducq Transatlantic Network of Excellence (16/CVD/05) (J.W, H.B., B.V.Z.).
Acknowledgements
The authors thank Peter Brown of MRRC (Magnetic Resonance Research Center) at Yale University for coil development and support.
Declaration of conflicting interests
The author(s) declared no potential conflicts of interest with respect to the research, authorship, and/or publication of this article.
Authors’ contributions
HB, JW and HL conceived and planned the study. BM and SC performed all histology and quantification of AQP4 polarization. SK, BM, and SC performed in vivo MRI experiments. FD and HB performed the statistical analysis. HB wrote the manuscript. HB and BM created figures. AD with assistance from ZG was responsible for the collection of the human post-mortem tissue, histological processing and neuropathological analysis. BVZ, WVN and JW provided intellectual contribution and interpretation of the data. All authors read and edited the manuscript.
Supplemental material
Supplemental material for this article is available online.
References
Supplementary Material
Please find the following supplemental material available below.
For Open Access articles published under a Creative Commons License, all supplemental material carries the same license as the article it is associated with.
For non-Open Access articles published, all supplemental material carries a non-exclusive license, and permission requests for re-use of supplemental material or any part of supplemental material shall be sent directly to the copyright owner as specified in the copyright notice associated with the article.