
Abstract
Alterations in synaptic vesicle glycoprotein 2 A (SV2A) have been associated with several neuropsychiatric and neurodegenerative disorders. Therefore, SV2A positron emission tomography (PET) imaging may provide a unique tool to investigate synaptic density dynamics during disease progression and after therapeutic intervention. This study aims to extensively characterize the novel radioligand [18F]SynVesT-1 for preclinical applications. In C57Bl/6J mice (n = 39), we assessed the plasma profile of [18F]SynVesT-1, validated the use of a noninvasive image-derived input function (IDIF) compared to an arterial input function (AIF), performed a blocking study with levetiracetam (50 and 200 mg/kg, i.p.) to verify the specificity towards SV2A, examined kinetic models for volume of distribution (VT) quantification, and explored test-retest reproducibility of [18F]SynVesT-1 in the central nervous system (CNS). Plasma availability of [18F]SynVesT-1 decreased rapidly (13.4 ± 1.5% at 30 min post-injection). VT based on AIF and IDIF showed excellent agreement (r2 = 0.95, p < 0.0001) and could be reliably estimated with a 60-min acquisition. The blocking study resulted in a complete blockade with no suitable reference region. Test-retest analysis indicated good reproducibility (mean absolute variability <10%). In conclusion, [18F]SynVesT-1 is selective for SV2A with optimal kinetics representing a candidate tool to quantify CNS synaptic density non-invasively.
Introduction
Synaptic vesicle glycoprotein 2 (SV2) is a highly conserved protein family playing an essential role in neurotransmitter release from the presynaptic terminals following action potential stimulation.1,2 Among the three SV2 (SV2A, SV2B, and SV2C) isoforms, SV2A, the binding target of the antiepileptic drug levetiracetam (LEV), 3 is virtually expressed in all synapses4,5 and displays a homogenous distribution in synaptic vesicles 6 representing an attractive target to probe synaptic density in the living brain.
Since synaptic alterations have been reported in several neuropsychiatric and neurodegenerative disorders, 7 measuring SV2A in vivo using positron emission tomography (PET) imaging may provide a unique tool to investigate synaptic density dynamics non-invasively during aging and in diseases. 8 Among the developed SV2A radioligands, [11C]UCB-J displayed optimal pharmacokinetics and quantification properties for measuring synaptic density in humans.9,10 Additionally, it was demonstrated to offer an excellent clinical marker for the measurement of synaptic alterations in a variety of brain disorders, including Alzheimer’s disease, Parkinson’s disease, epilepsy, and major depression disorder.8,11–14
Given the instrumental role of preclinical models in understanding neuropsychiatric and neurodegenerative disorders in parallel to the broad spectrum of diseases characterized by synaptic dysfunction, we previously described the application of [11C]UCB-J in mice 15 and the utility of [11C]UCB-J PET imaging in preclinical models to significantly advance our understanding of the pathophysiology and diagnosis of neurological disorders, including Huntington’s disease, 16 obsessive-compulsive disorder, 17 and spinal cord injury. 18
Despite the excellent preclinical and clinical properties as a radioligand, applicability of [11C]UCB-J is limited to centers with an on-site cyclotron due to the short half-life of the C-11 radioisotope (20.4 min). In order to overcome this constraint, recent efforts have focused on the generation of a UCB-J analogue ligand incorporating the F-18 radioisotope, thus offering a longer half-life (109.8 min), translating into high research throughput and clinical utility at the majority of PET centers without a cyclotron. Additionally, compared to C-11, F-18 features higher image resolution given the shorter positron range. Among the explored UCB-J analogues, [18F]SynVesT-1 ((R)-4-(3-Fluoro-5-(fluoro-18F)phenyl)-1-((3-methylpyridin-4-yl)methyl)pyrrolidin-2-one)19,20 was reported displaying excellent imaging and binding parameters in non-human primates as well as in humans.19–22
In this study, we extensively characterize this novel radioligand [18F]SynVesT-1 for preclinical application in the central nervous system (CNS). We assessed the plasma profile of [18F]SynVesT-1, validated the use of a noninvasive image-derived input function (IDIF) compared to an arterial input function (AIF), performed a blocking study with LEV to verify the specificity towards SV2A, examined kinetic models for volume of distribution (VT) quantification, and explored the test-retest reproducibility of [18F]SynVesT-1.
Materials and methods
Animals
A total of 39 adult (10-month-old) male mice (C57BL/6J) were obtained from Jackson Laboratories (Bar Harbour, Maine, USA) and included for the in vivo PET imaging and subsequent radiometabolite analysis. Due to sporadic congenital portosystemic shunt occurring in C57BL/6J mice, 23 all animals were screened at Jackson Laboratories before shipment in order to avoid this confounding factor; hence all animals used in this study were shunt-free. Only male mice were included for a better comparison of the performance of [18F]SynVesT-1 to the previously reported [11C]UCB-J. 15 Animals were single-housed in individually ventilated cages under a 12 h light/dark cycle in a temperature- and humidity-controlled environment with food and water ad libitum; a week of acclimatization was guaranteed before the start of any procedure. A schematic experimental overview is shown in Supplemental Figure 1. Animals were randomly allocated to the different experimental studies. Given the within-animal comparisons, the sample sizes were adequate to support the findings. All experiments were performed according to the European Committee Guidelines (decree 2010/63/CEE) and reported in compliance with the ARRIVE guidelines. Experiments were approved by the Ethical Committee for Animal Testing (ECD 2020-59) at the University of Antwerp (Belgium).
Radiotracer synthesis
The radiosynthesis of [18F]SynVesT-1 was based on earlier work by Li et al and Constantinescu et al.20,21 Approximately 19 GBq of [18F]fluoride was produced by cyclotron bombardment (Siemens Eclipse HP, USA) and transferred to a Trasis AllInOne synthesizer (Belgium) with a custom-built cassette. The activity was trapped on a QMA cartridge (preconditioned with 5 mL 90 mg/mL KOTf and 5 mL ultrapure water) and then eluted into a reaction vessel with a mixture of 500 µL acetonitrile, 50 µl 1 mg/mL K2CO3, and 450 µL 10 mg/mL KOTf. After azeotropic drying, the radiolabeling solution was added to the reactor. This freshly-prepared solution consisted of 6 mg trimethyltin precursor (Pharmasynth) dissolved in 650 µL DMA solvent, 210 µL 1 M pyridine in DMA, and 140 µL 0.2 M Cu(OTf)2 in DMA. The mixture was heated at 100 °C for 20 minutes, after which the reaction was quenched with water for injection. Semi-preparative HPLC purification (XBridge C18 column, 10 × 150 mm, 5 µm; mobile phase EtOH/0.05 M NaOAc pH 5.5 35/65 v/v) afforded a purified [18F]SynVesT-1 product peak that was further purified and concentrated on a C18 SPE cartridge (preconditioned with 5 mL ethanol, 5 mL water for injection). Finally, [18F]SynVesT-1 was eluted into the product vial with 1 mL 50% EtOH and diluted to 5 mL with saline solution. All fluids leading to the product vial were sterilized by an in-line sterile filter (0.22 µm Cathivex GV 25 mm filter unit; Merck, Belgium). The radiosynthesis of [18F]SynVesT-1 proceeded with good radiochemical yield (12.37 ± 3.94%; n = 11; n.d.c.) and radiochemical purity (>99%). The molar activity (MA) of the tracer was 218.6 ± 70.5 GBq/µmol (n = 15).
Metabolite analysis and correction
To characterize the blood profile of [18F]SynVesT-1, mice (n = 21; n = 3/5 per time point) were injected via a lateral tail vein with [18F]SynVesT-1 (14.3 ± 2.1 MBq in 200 μl) and blood was withdrawn via cardiac puncture at different times post-injection (namely 2, 5, 15, 30, and 60 min). Only one blood sample was collected per animal since cardiac puncture (an end-of-life procedure) is required to obtain a sufficient amount of blood (>300 µL) for standard analysis of radiometabolites. The procedure for metabolite analysis was performed adapting the previously described protocol15,24 to [18F]SynVesT-1.
Reverse-phase (RP)-HPLC system was equipped with a Waters Xbridge C18 4.6 × 150 mm, 5 µm column, and Phenomenex security guard pre-column. The system was equilibrated with NaOAc 0.05 M pH 5.5 and acetonitrile: (67:37 for 10 min v/v, followed by a gradient to 10:90 and reverse) buffer at a flow rate of 1 mL/min. RP-HPLC fractions were collected at 0.5 min intervals for 10 min and radioactivity was measured in a gamma counter (Wizard, 2 PerkinElmer). The radioactivity was expressed as a percentage of the total area of the peaks based on the radiochromatograms. Plasma extraction efficiency was 92.3 ± 2.5%. Control experiments were performed using blood spiked in vitro with 37 kBq of [18F]SynVesT-1 confirming stability during the analytical procedure (Supplemental Figure 2).
Using PMOD 3.6 software (Pmod Technologies, Zurich, Switzerland), average parent fraction values were fitted with a sigmoid curve and used to create the population-based metabolite correction. Thus, the individual input function was corrected for the population-based parent fraction via the Sigmoid fit as well as for the population-based plasma-to-whole blood ratio to derive the metabolite-corrected plasma arterial or image-derived input functions.
PET acquisition and reconstruction
Dynamic microPET/Computed tomography (CT) images were acquired on Siemens Inveon PET-CT scanners (Siemens Preclinical Solution, Knoxville, USA). Animal preparation was performed as previously described.15,24 At the onset of the dynamic PET scan, a 10.0 ± 3.5 MBq (1.14 ± 0.39 µg/kg) bolus injection was performed using an automated pump (Pump 11 Elite, Harvard Apparatus, USA) over a 12-second interval (1 mL/min). Following the microPET scan, a 10 min 80 kV/500 μA CT scan was performed for attenuation correction as well as for anatomical registration.
In order to measure AIF and validate the use of a non-invasive alternative to allow comparative studies in mice without extensive blood (or plasma) sampling which is not achievable in longitudinal studies, mice (n = 5) underwent surgery to insert an arteriovenous (AV) shunt into the femoral vein and artery.25,26 After positioning the animal onto the scanner, the AV shunt was connected to a peristaltic pump and to a coincidence detector (Twilite, Swisstrace) to measure whole blood AIF at a 1 s resolution without blood loss. The activity measured with the detector was decay- and background-corrected, and cross-calibrated with the PET scanner each experimental day. A three-exponential function was fitted to the decaying part of the input function in order to reduce the noise in the data. During the same scan, we estimated the blood radioactivity non-invasively using a non-invasive IDIF to obtain VT (IDIF) as a surrogate of VT (AIF). The IDIF itself was extracted from the PET images by generating a volume-of-interest on the early time frame exhibiting maximal activity in the heart with a threshold considering 50% of the max as previously described.15,24,26
In order to validate the in vivo specificity of [18F]SynVesT-1 towards SV2A, a pretreatment study was performed using the antiepileptic drug LEV (Merck, Germany), a high-affinity ligand for SV2A, 27 at 2 different doses (50 and 200 mg/kg i.p.; n = 6 per dose) in the same animals scanned at baseline as we previously performed for [11C]UCB-J. 15 LEV was dissolved in saline and injected 30 min before administration of the radioligand. Methodologically, no significant difference between baseline and blocking PET scans was observed (Supplemental Table 1).
To explore the reliability of [18F]SynVesT-1 outcome parameters, animals (n = 12) underwent test and retest PET scans 6 days apart. Methodologically, no difference between test and retest PET scans was observed (Supplemental Table 1).
Acquired PET data were reconstructed into 33 or 45 frames of increasing length (12 × 10s, 3 × 20s, 3 × 30s, 3 × 60s, 3 × 150s, and 9 or 21 × 300s). Images were reconstructed using a list-mode iterative reconstruction with proprietary spatially variant resolution modeling in 8 iterations and 16 subsets of the 3D ordered subset expectation maximization (OSEM 3D) algorithm. 28 Normalization, dead time, and CT-based attenuation corrections were applied. PET image frames were reconstructed on a 128 × 128 × 159 grid with 0.776 × 0.776 × 0.796 mm3 voxels.
Image processing and kinetic modeling
Analysis and processing of the PET data were performed using PMOD 3.6 software. Spatial normalization of the PET images was achieved by adapting the procedures we previously described for [11C]UCB-J15 to [18F]SynVesT-1.
The [18F]SynVesT-1 PET template was generated in the same space of the Waxholm atlas, 29 thus volumes-of-interest (VOIs) from that atlas were used to extract regional time-activity curves (TACs) for the following regions: striatum (STR), thalamus (THAL), hippocampus (HC), and cerebellum (CB). Cervical spinal cord (SC) VOI was manually delineated on the individual CT images.
The fitting of the regional TACs was explored with the one-tissue compartmental model (1TCM), two-tissue compartmental model (2TCM), and Logan plot method. 30 However, 1TCM failed to fit the regional TACs; therefore, 2TCM and Logan plot are presented. For 2TCM, the blood volume fraction (VB) was fixed at 3.6%, 31 while for Logan plot the linear phase (t*) was determined from the curve fitting based on 10% maximal error with t* ranging from 7.5–20 min. VT estimations using AIF and IDIF uncorrected for metabolites were investigated, however, the data could not be fit when using the uncorrected input function (Supplemental Figure 3), thus only the population-based metabolite-corrected arterial and image-derived input functions are reported.
Time stability of the VT (IDIF) was assessed for both 2TCM and Logan plot kinetic models by repeatedly excluding the last 10 min of PET acquisition from 120-min down to 30-min. 15 During the blocking experiment, Lassen plots 32 were applied to determine the extent of SV2A occupancy reached following blocking with LEV.
Parametric images were generated with PMOD software using the pixel-wise modeling tool (PXMOD) through voxel-based graphical analysis (Logan plot, VT (IDIF) images) with plasma activity (metabolite corrected IDIF) as input function, represented as group averages, and overlaid onto a 3D MRI mouse brain template for anatomical reference.
Statistical analysis
One-way ANOVA with Holm-Šidák’s multiple comparison test was applied to the blocking experiment to compare baseline and blocking scans. Correlations between 2 variables were performed with Pearson’s correlation tests and linear regression analyses. In addition, the agreement between test-retest scans was also investigated using Bland-Altman plots, reported as bias and 95% limits of agreement. Inter-subject variability was analyzed as the coefficient of variability (COV). In addition, the reproducibility of the test-retest data was determined by the intraclass correlation coefficient (ICC) using a mixed-model reliability analysis for absolute agreement, relative test-retest variability (TRV), and absolute TRV (aTRV).
TRV was calculated as follows:
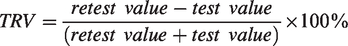
While aTRV was measured as follows:
Statistical analyses were performed using GraphPad Prism (v9.1) statistical software except for ICC values, which were calculated in JMP Pro 14 software (SAS Institute Inc., USA). Investigators were blind to the experimental group during the data analyses. Data are represented as mean ± SD. All tests were two-tailed and significance was set at p < 0.05.
Results
Plasma analysis
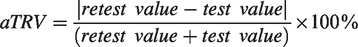
The parent fraction declined rapidly following intravenous injection with only 13.4 � of intact [18F]SynVesT-1 being observed 30 min post-injection (p.i.) (Figure 1(a)), comparable to [11C]UCB-J (13.6 ± 3.7%). 15 The parent fraction was described by a sigmoid fit, while the plasma to whole blood ratio increased linearly over time (Figure 1(b)). These fits were used for the calculation of the radiometabolite corrected of both arterial and image-derived plasma input functions (Supplemental Figure 4). Radiochromatograms from plasma samples obtained at different times displayed the presence of polar radiometabolites as shown in Supplemental Figure 2.
Parent fraction and plasma analysis of [18F]SynVesT-1. (a) Population-based curve of intact radioligand in plasma following intraveneous injection and (b) Plasma to whole blood ratio of [18F]SynVesT-1. WB = whole blood. Data are mean ± SD. n = 3/5 per time point.
Non-invasive quantification of [18F]SynVesT-1
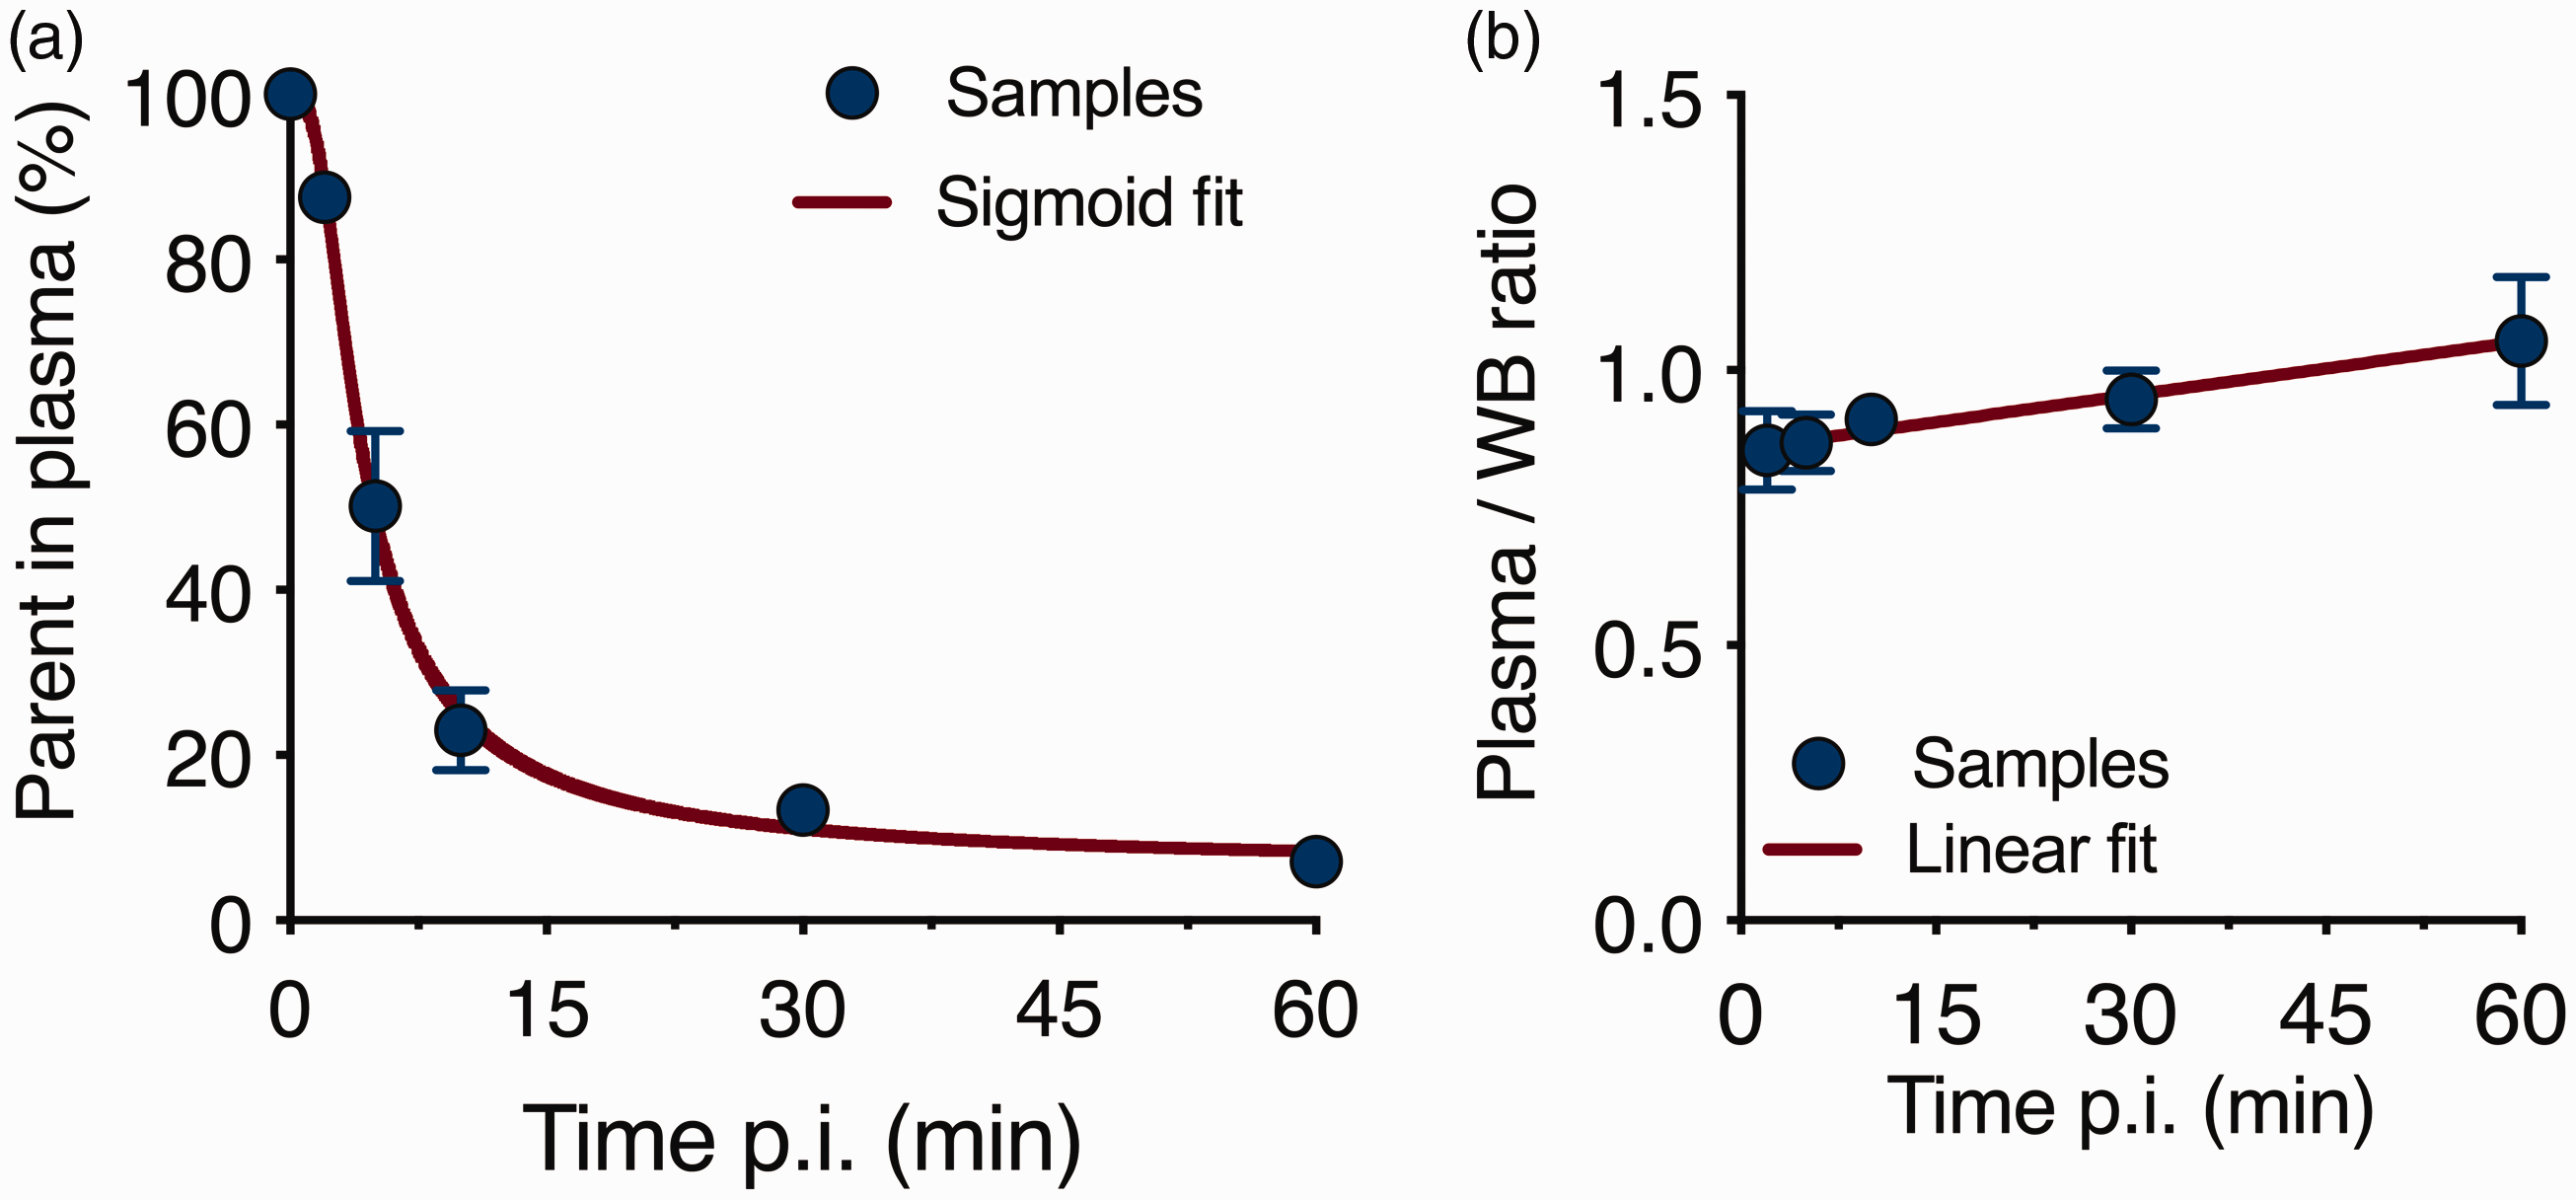
[18F]SynVesT-1 standardized uptake value (SUV) TACs in different brain regions during 120 min acquisition are reported in Figure 2(a). [18F]SynVesT-1 uptake peaked within the first 10 min and was followed by a steady wash-out over time indicating reversible kinetics. Since SV2A is ubiquitously distributed in cerebral grey matter, no suitable reference region was anticipated in the rodent brain. Thus, we explored the use of a non-invasive cardiac metabolite-corrected IDIF by comparison to the metabolite-corrected AIF in the same subjects (n = 5). As shown in Figure 2(b), the shapes of the curves were similar at both peak and tail between the two approaches; however, the IDIF displayed higher values. As a result, 2TCM-based VT (IDIF) values calculated were underestimated compared to VT (AIF); nonetheless, they displayed a strong linear association (r2 = 0.95, p < 0.0001) (Figure 2(c)), indicating VT (IDIF) could be used as a non-invasive alternative to VT (AIF).
Comparison of invasive and non-invasive input functions for [18F]SynVesT-1 quantification. (a) [18F]SynVesT-1 SUV time-activity curves in different brain regions during 120 min acquisition. (b) Comparison between average SUV time-activity curves for invasive (AIF) and noninvasive (IDIF) metabolite-corrected input functions during [18F]SynVesT-1 PET acquisition and (c) Pearson’s correlation between VT (IDIF) estimates based on invasive (AIF) and noninvasive (IDIF) metabolite-corrected input functions displayed excellent agreement (r2 = 0.95). Solid line represents the linear regression. n = 5. SUV = standardized uptake value.
[18F]SynVesT-1 kinetic analysis
Assessment of kinetic models indicated [18F]SynVesT-1 TACs could be described by 2TCM and Logan plot using a metabolite-corrected input function. Time stability of VT (IDIF) estimates based on 2TCM (Figure 3(a)) and Logan plot (Figure 3(b)) indicated high stability of the outcome parameter with a striatal deviation of only 0.5 ± 1.5% and 1.5 ± 1.9% for 2TCM and Logan plot, respectively, when considering 60-min acquisition. This was confirmed by the excellent correlation in VT (IDIF) values obtained considering 120- or 60-min scan acquisition for both 2TCM (slope = 1.01, r2 = 0.99, p < 0.0001) (Figure 3(c)) or Logan plot (slope = 1.05, r2 = 0.98, p < 0.0001) (Figure 3(d)). Finally, Logan plot was a valid alternative to 2TCM for VT (IDIF) estimates when considering both 120- (slope = 0.95, r2 = 0.99, p < 0.0001) (Figure 3(e)) or 60-min scan acquisition (slope = 0.99, r2 = 0.99, p < 0.0001) (Figure 3(f)).
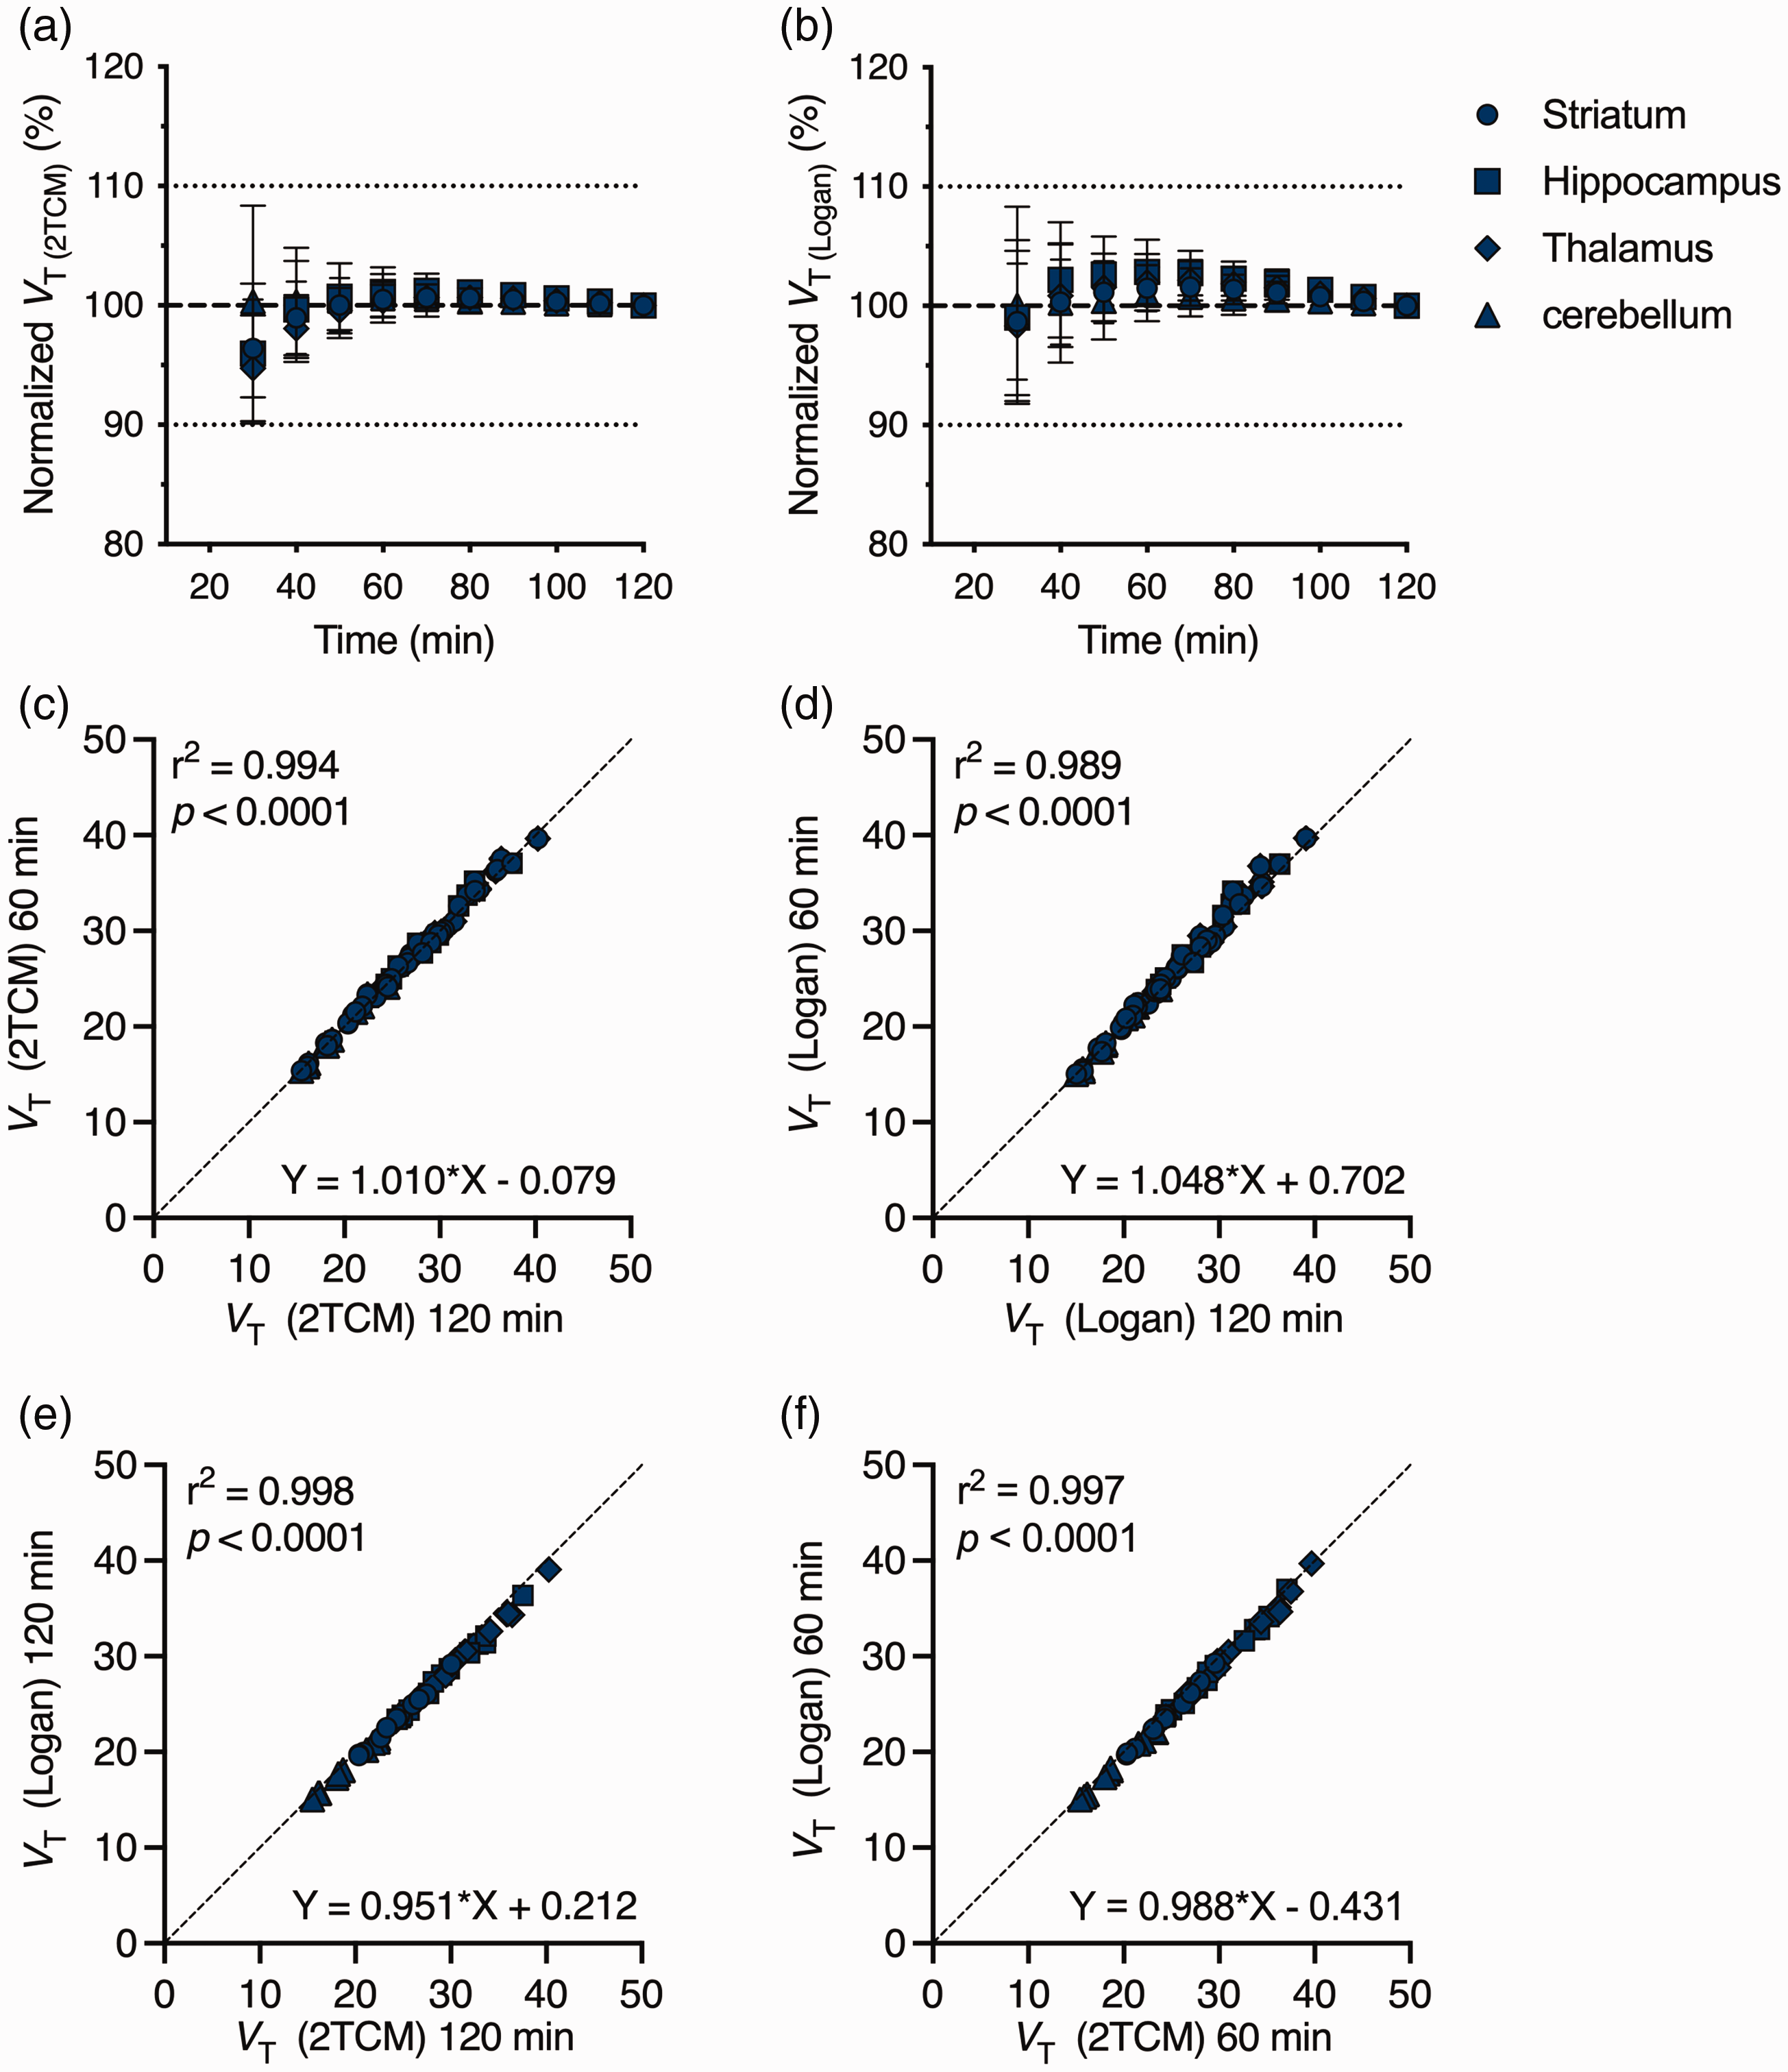
Time stability and model comparison for [18F]SynVesT-1 quantification. VT (IDIF) estimates with different scan durations using 2TCM (a) and Logan plot (b) normalized to the values obtained with the 120 min acquisition. VT (IDIF) values based on 120 min and 60 min scan acquisition did not differ for both 2TCM (c) and Logan plot (d). Pearson’s correlation depicts the excellent agreement between VT (IDIF) based on 2TCM and Logan plot with both 120 min (e) and 60 min (f) scan acquisition. n = 10.
Validation of [18F]SynVesT-1 binding to SV2A
To confirm the lack of any suitable reference region, we pretreated animals with LEV (i.p., 30 min before tracer injection) at either 50 or 200 mg/kg. MR template and mean [18F]SynVesT-1 parametric maps during baseline (n = 12) and following blockade with LEV at different dosages (n = 6 each) are shown in Figure 4(a). Striatal SUV TAC depicted a profound reduction in [18F]SynVesT-1 cerebral uptake following the blockade of SV2A (Figure 4(b)), which reflected in a significant dose-dependent change in VT (IDIF) (F(2,21) = 162.1, p < 0.0001; baseline = 22.1 ± 2.5 mL/cm3; LEV50 =6.1 ± 2.8 mL/cm3, −72.4%; LEV200 = 3.1 ± 1.5 mL/cm3, −85.6%) as shown in Figure 4(c) and described in Supplemental Table 2. Additionally, Lassen plots were used to estimate the SV2A occupancy reached at the 2 doses of LEV. As depicted in Figure 4(d), the estimated SV2A occupancy was 97.4% and 100% for the 50 and 200 mg/kg doses respectively. The estimated VND, as determined by the x-intercept from the Lassen plot, was 3.15 mL/cm3 based on the 200 mg/kg dose.
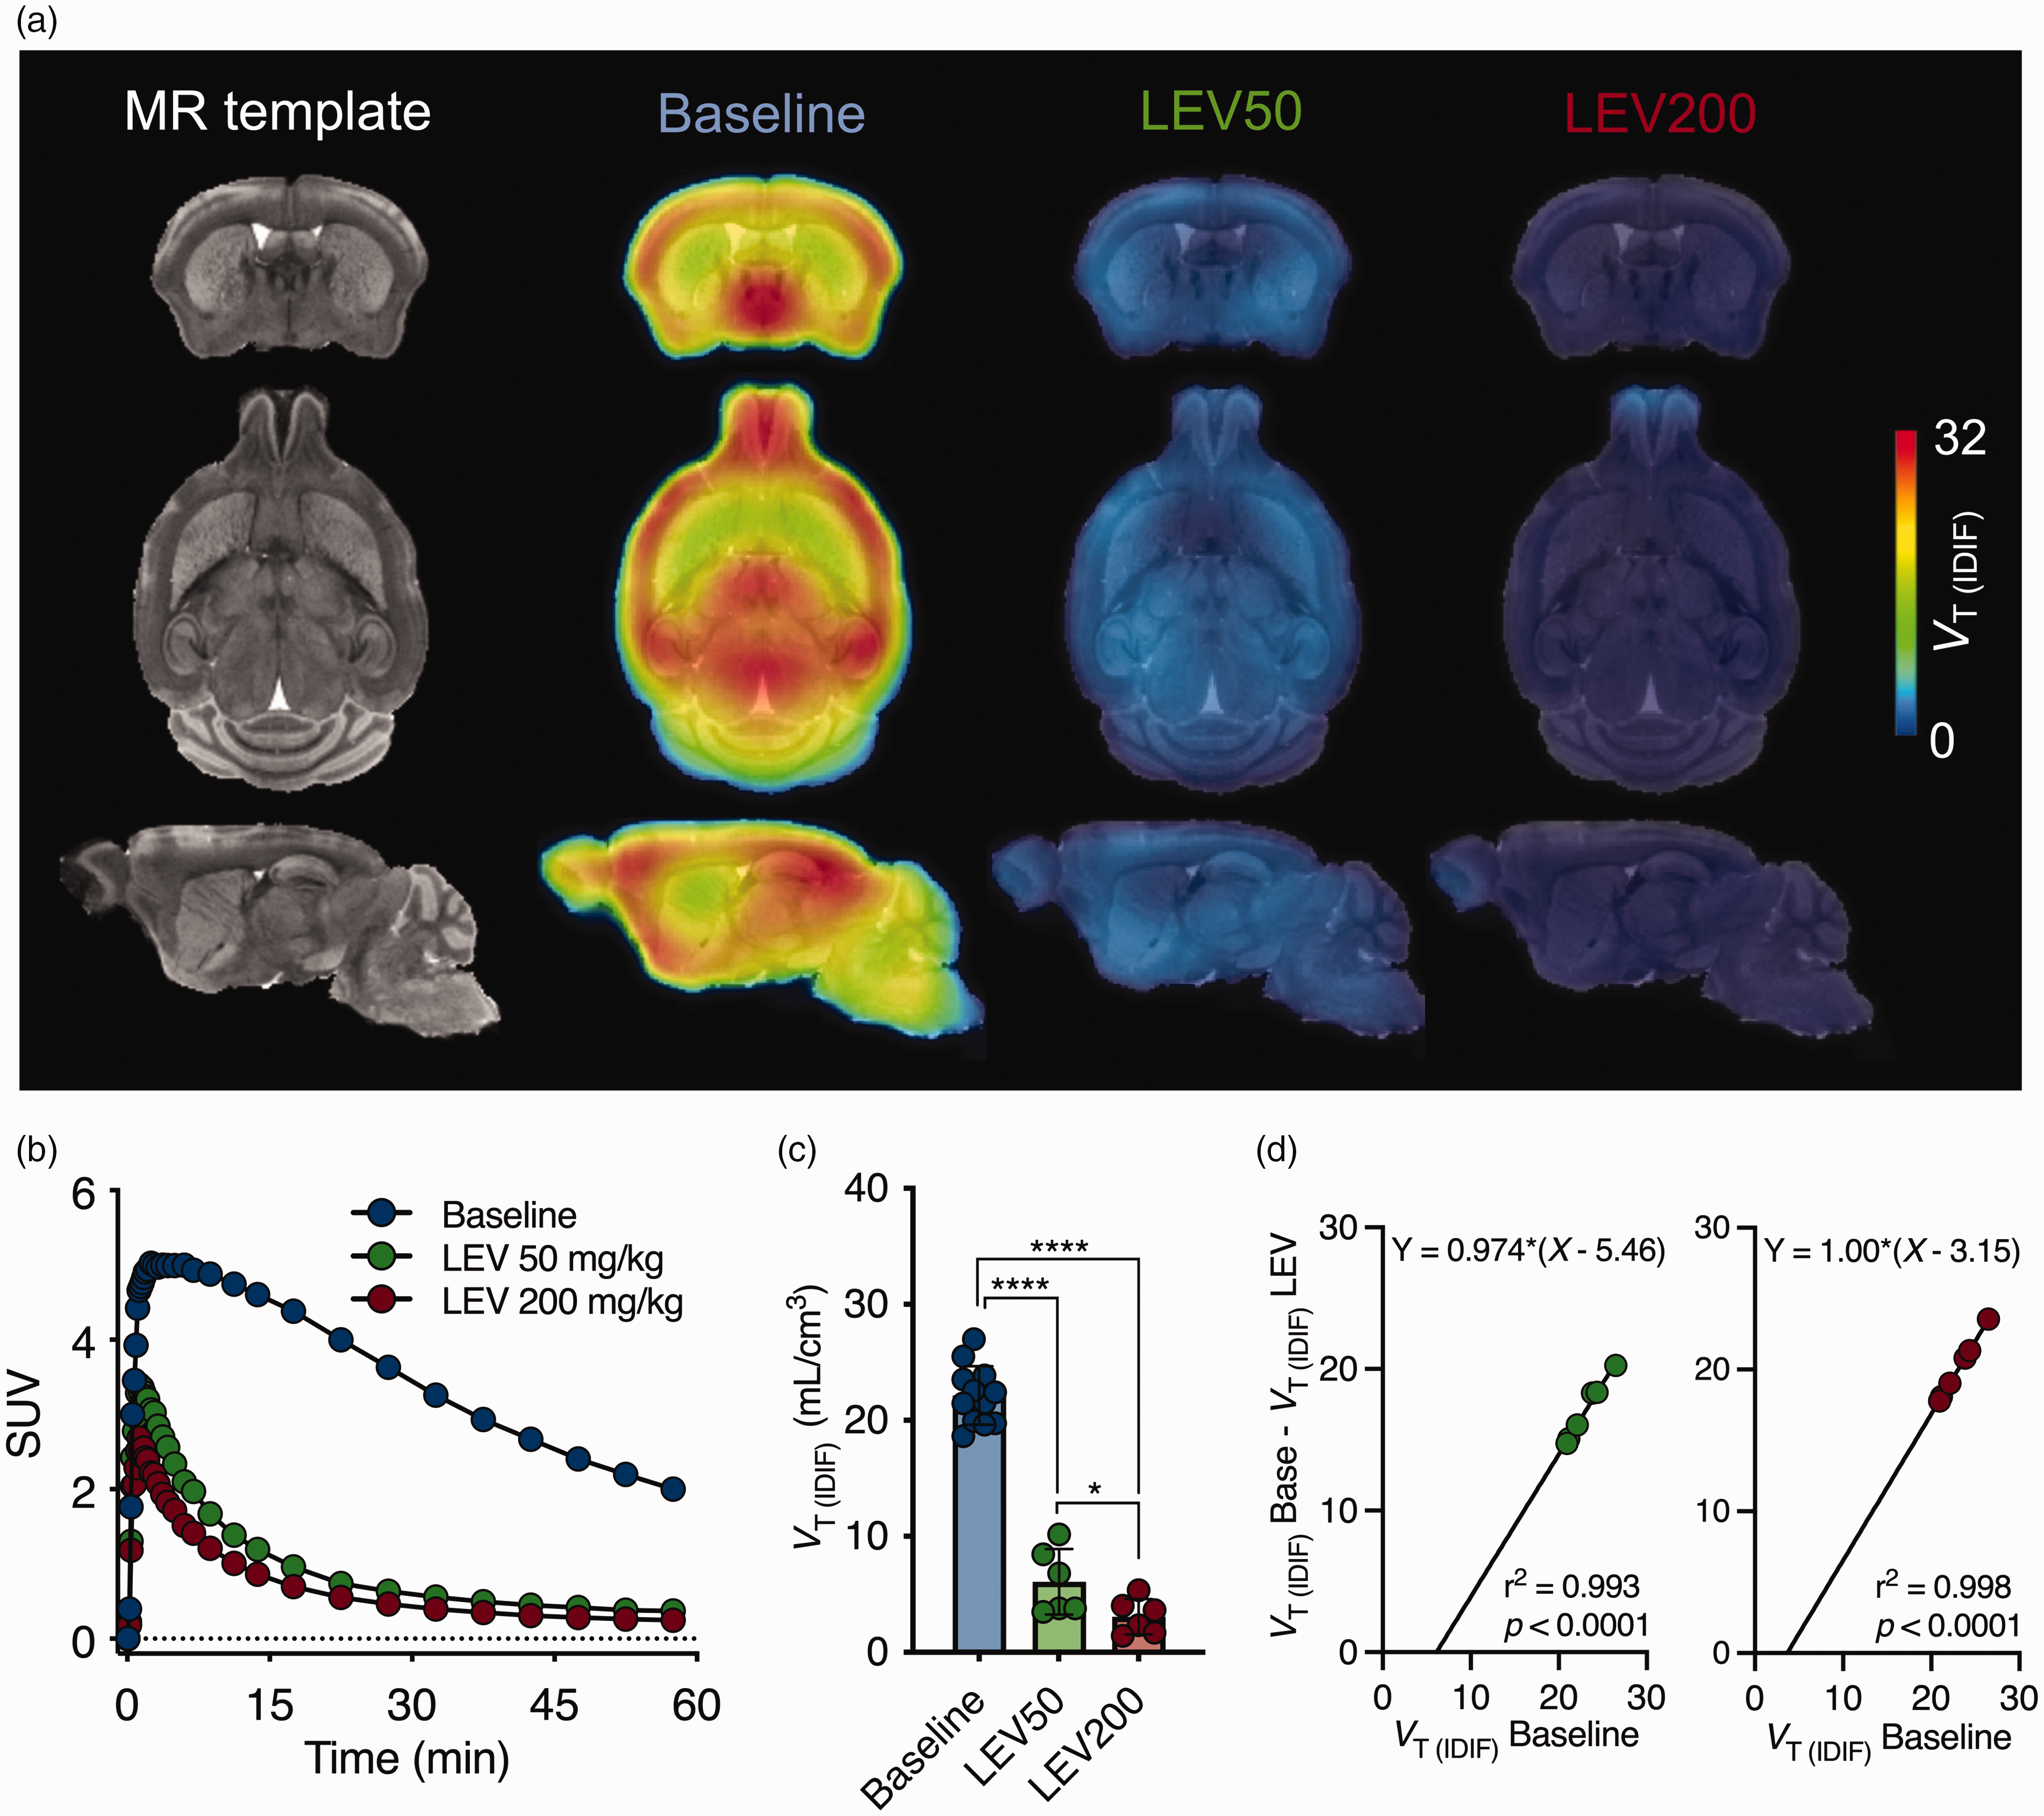
[18F]SynVesT-1 binds specifically to SV2A in the mouse brain. (a) MR template and mean [18F]SynVesT-1 parametric maps during baseline and following blockade with levetiracetam (LEV) (i.p., 30 min before radioligand injection) overlaid onto an MRI mouse brain template for anatomical localization. (b) Average striatal SUV time-activity curve during baseline and pretreatment with levetiracetam for a 60-min acquisition. (c) Striatal [18F]SynVesT-1 VT (IDIF) (Logan) during baseline and following blockade with LEV. ****p < 0.0001 and (d) Lassen plots for target occupancy at different doses of LEV show an estimated SV2A occupancy of 97% and 100%. Baseline: n = 12. Blocking: n = 6 per dose. SUV = standardized uptake value.
We recently described the feasibility of SV2A PET in spinal cord using the radioligand [11C]UCB-J, 16 hence we validated the specificity of [18F]SynVesT-1 PET imaging to quantify SV2A in the spinal cord. SUV TACs were reduced following LEV pretreatment as in Figure 5(a). A significant dose-dependent change in VT (IDIF) (F(2,21) = 291.3, p < 0.0001; baseline = 13.6 ± 0.8 mL/cm3; LEV50 = 5.3 ± 1.3 mL/cm3, −61.0%; LEV200 = 3.3 ± 0.8 mL/cm3, −75.7%) is demonstrated in Figure 5(b) and Supplemental Table 2. The spinal binding was highly correlated to the cerebral [18F]SynVesT-1 binding as exemplified for the striatum (r2 = 0.82, p < 0.0001) (Figure 5(c)).
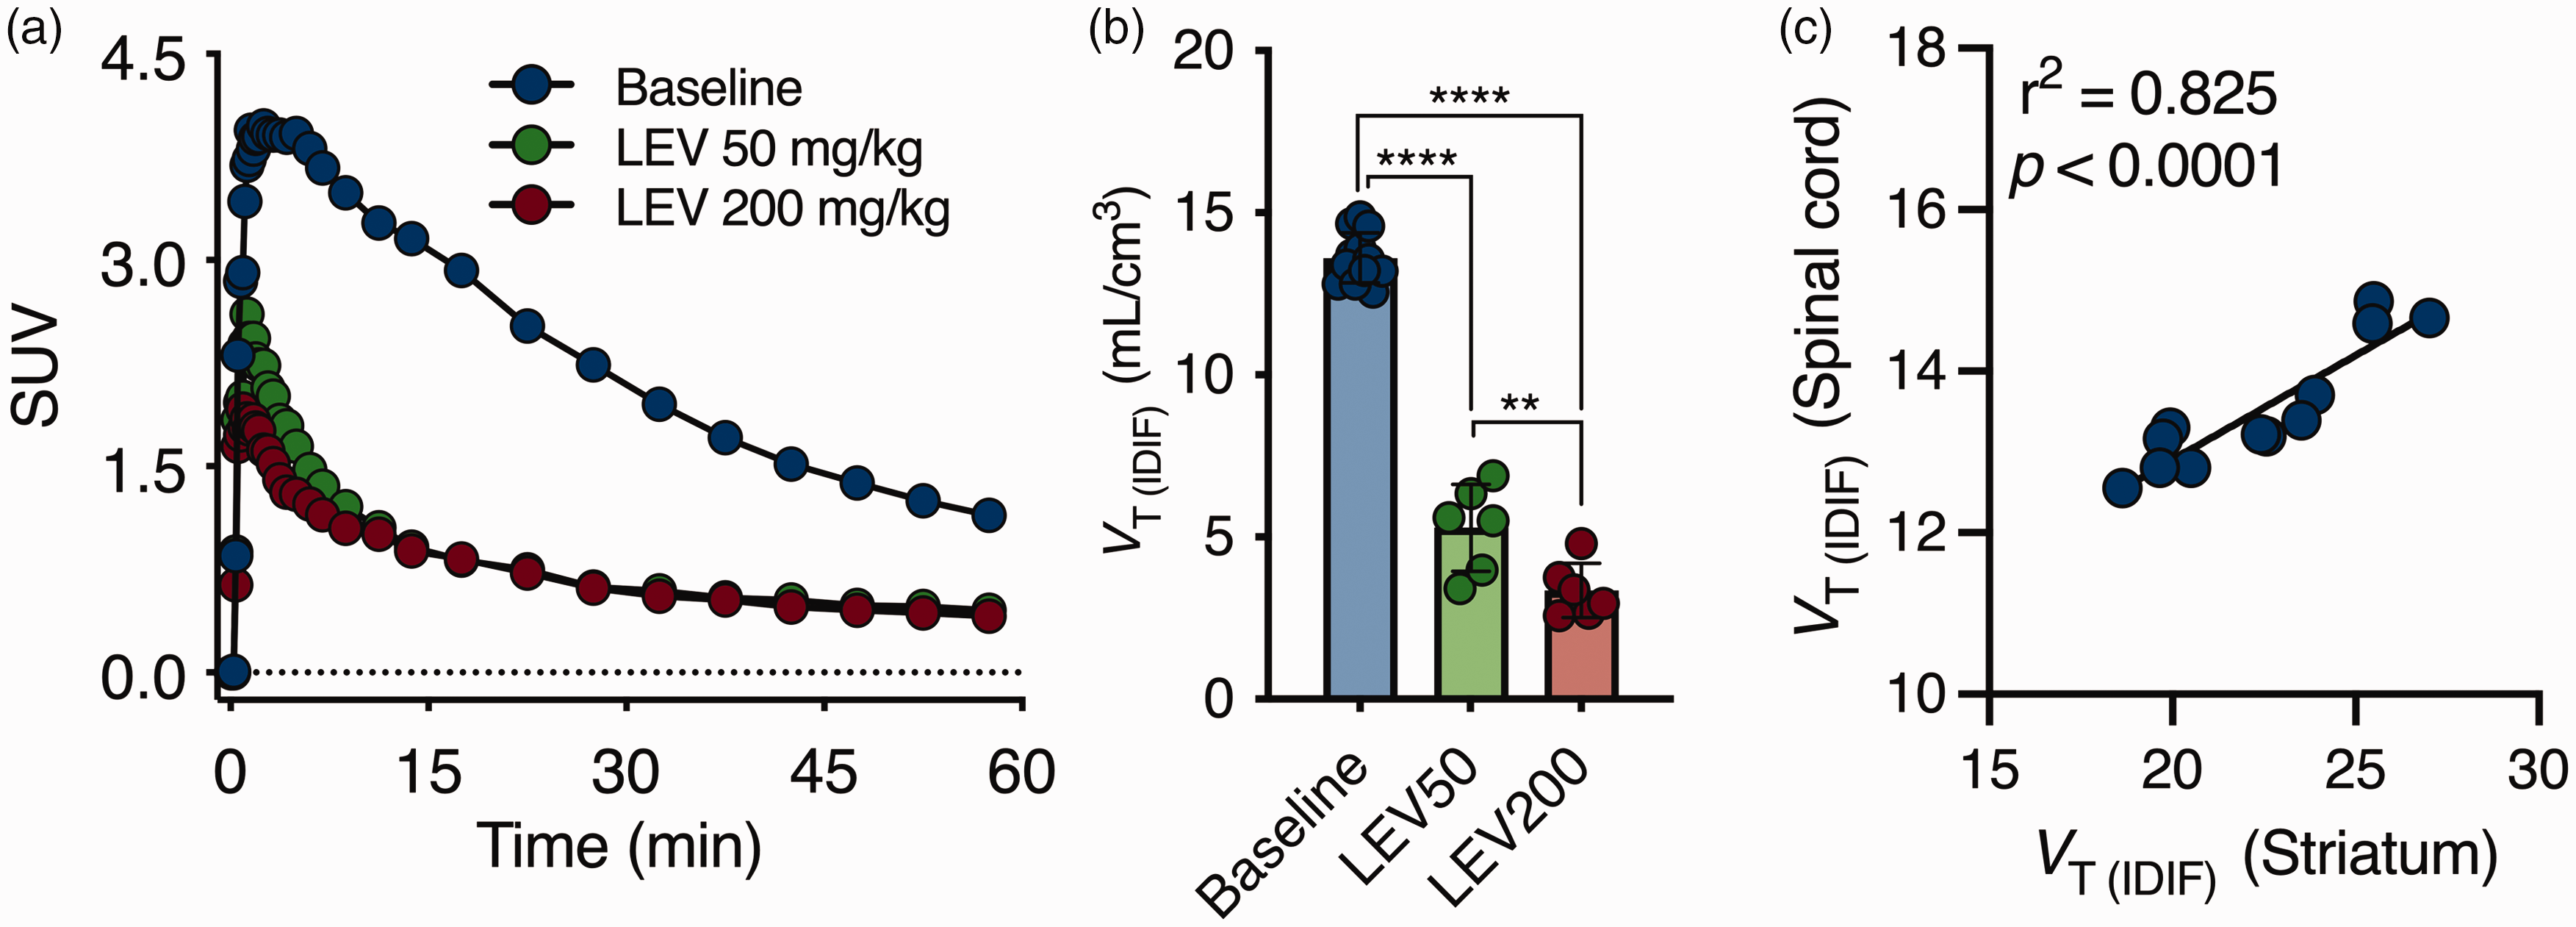
[18F]SynVesT-1 binding in the spinal cord. (a) Average spinal cord SUV time-activity curve during baseline and pretreatment with levetiracetam for a 60-min acquisition. (b) [18F]SynVesT-1 VT (IDIF) (Logan) during baseline and following blockade with LEV. ****p < 0.0001 and (c) Pearson’s correlation depicts the excellent agreement between striatal and spinal quantification. Baseline: n = 12. Blocking: n = 6 per dose. SUV = standardized uptake value.
[18F]SynVesT-1 test-retest reproducibility
Test-retest variability and reproducibility of [18F]SynVesT-1 VT (IDIF) estimates based on both 2TCM and Logan plot are reported in Table 1 and the mean [18F]SynVesT-1 parametric maps during test and retest as shown in Figure 6. When considering 2TCM, the largest TRV variation between test-retest was observed in SC (−2.9 ± 14.6%), while the mean aTRV was 9.2%. Similarly, the Logan plot displayed the largest TRV variation in SC (−1.6 ± 15.7%) and a mean aTRV of 9.6%. ICC values indicated the good reproducibility of [18F]SynVesT-1 estimates with both 2TCM and Logan plot (range ICC = 0.58–0.77). Bland-Altman plot showed only negligible bias (1.67%), although the 95% limits of agreement were relatively large (−26.5% and 29.8%) (Figure 6(b)). Accordingly, the overall Pearson’s correlation plot comparing test-retest VT (IDIF) estimates displayed good agreement (r2 = 0.829, p < 0.0001) (Figure 6(c)). Overall, [18F]SynVesT-1 displayed reliable and reproducible estimates between test and retest scans.
Test-retest variability and reproducibility of [18F]SynVesT-1 VT (IDIF) estimates based on 60-min acquisition.
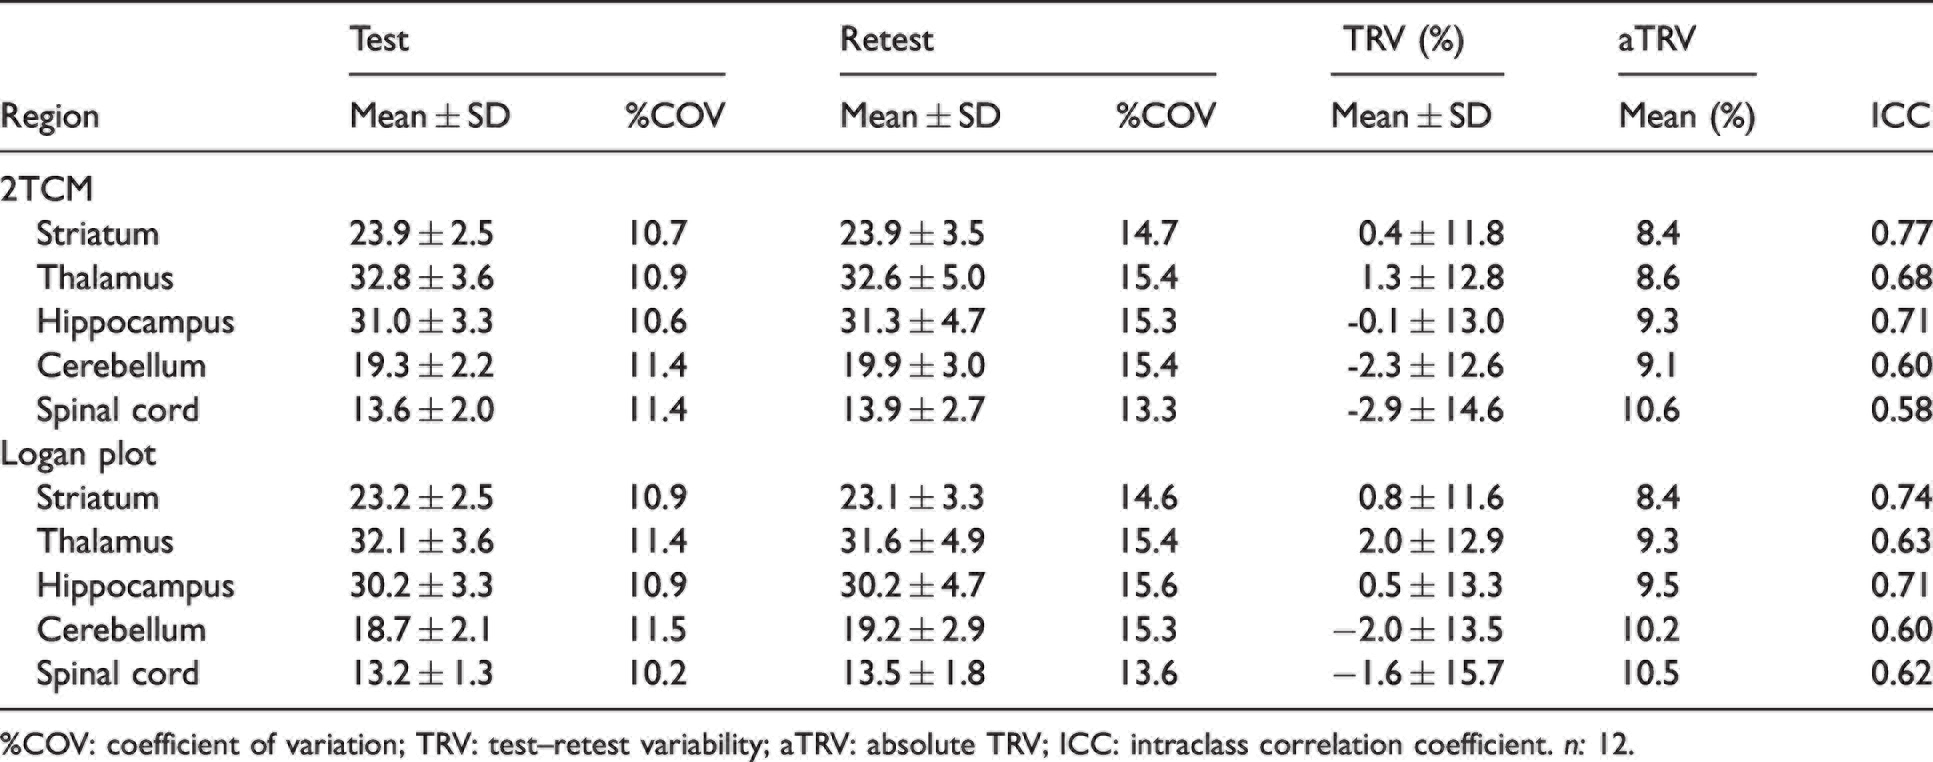
%COV: coefficient of variation; TRV: test–retest variability; aTRV: absolute TRV; ICC: intraclass correlation coefficient. n: 12.
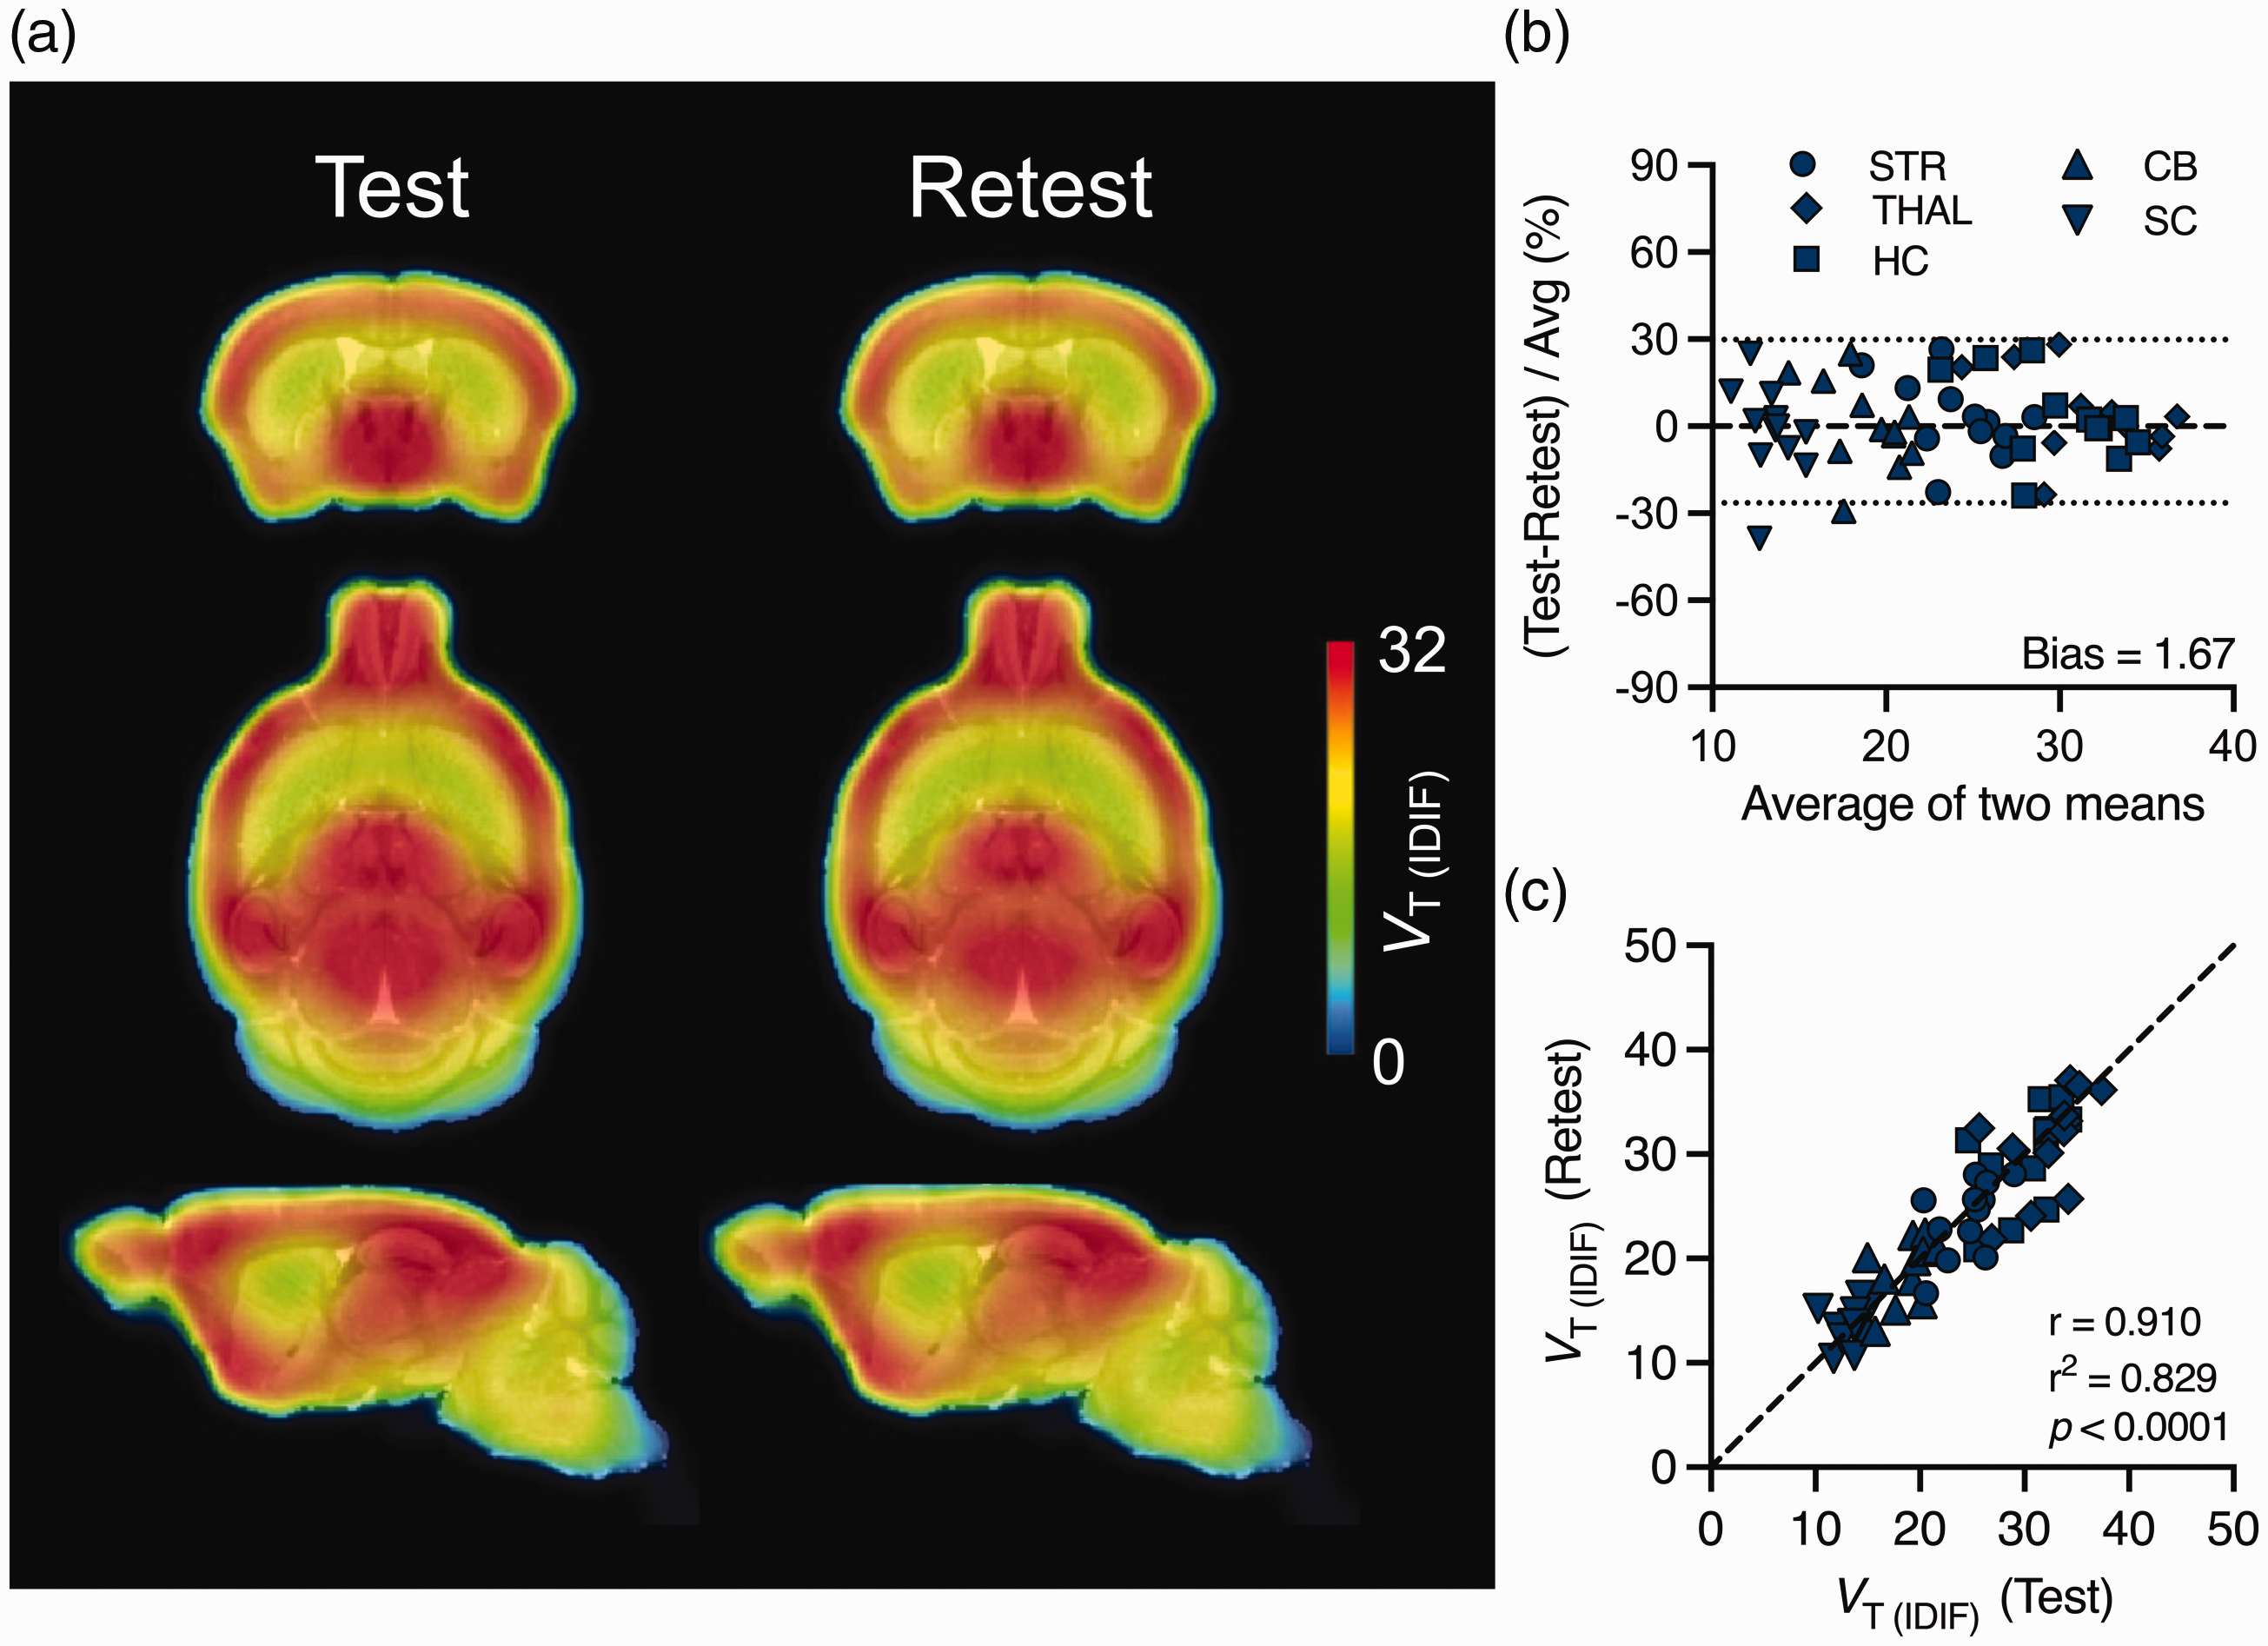
Test-retest variability and reproducibility of [18F]SynVesT-1 VT (IDIF) based on 60-min acquisition. (a) Mean [18F]SynVesT-1 parametric maps during test and retest overlaid onto an MRI mouse brain template for anatomical localization. (b) Bland-Altman plot comparing test-retest VT (IDIF) estimates. The dotted lines represent the 95% limits of agreement and (c) Pearson’s correlation plot comparing test-retest VT (IDIF) estimates. The dashed line denotes the identity line. STR = striatum, THAL = thalamus, HC = hippocampus, CB = cerebellum, SC = spinal cord; n = 12.
Discussion
Preclinical rodent models play an instrumental role in understanding pathophysiology, identifying novel biomarkers, and testing candidate therapies for neuropsychiatric and neurodegenerative disorders. Given the broad spectrum of diseases characterized by synaptic dysfunction, 7 we extensively characterized the novel radioligand [18F]SynVesT-1 for preclinical application in the CNS of mice.
The plasma profile of intact [18F]SynVesT-1 following intravenous injection was comparable to that of [11C]UCB-J we previously reported. 15 This is in agreement with the human observations describing similar values between the two radioligands. 19 The parent fraction was appropriately fitted by a sigmoid curve and presented extremely low variability across animals, especially at 30 and 60 min. Radiometabolite analysis identified a total of 3 radiometabolite peaks, all more polar than [18F]SynVesT-1 (Supplemental Figure 4); thus, unlikely to penetrate the blood-brain barrier as also supported by the lack of signal in the blocking study (Figure 4).
Since SV2A is virtually expressed in all synapses,4,5 the broad distribution of the target precludes the use of a reference region-based for kinetic models 33 as also suggested for [11C]UCB-J PET imaging. 15 Nonetheless, a recent study by Sadasivam and colleagues quantified [18F]SynVesT-1 using the simplified reference tissue model with either cerebellum or brain stem as a reference region. 34 However, we here provide clear evidence for a profound reduction in [18F]SynVesT-1 binding following pretreatment with LEV in any brain structure, thus no reference region exists.
In addition, although white matter structures (such as the centrum semiovale) have been validated as reference regions in humans, this is not possible in rodents given the significantly smaller size of such structures (e.g. corpus callosum) and the spill-in signal from neighboring grey matter. For these reasons, we set out to validate a non-invasive approach for the measurement of the arterial input function. Since discrete blood sampling for AIF measurement cannot be achieved in mice, we used an arteriovenous shunt, peristaltic pump, and an external coincidence detector to measure arterial blood activity continuously with good accuracy 25 and compared it to the cardiac IDIF for full kinetic modeling. The strong linear association (r2 = 0.95, p < 0.0001) between the 2 approaches suggested VT (IDIF) could be used as a non-invasive alternative to VT (AIF) for comparative studies.24,26
A caveat related to the need for a population-based profile for the calculation of the plasma metabolite-corrected IDIF is the requirement of a comparable radiometabolite profile among experimental groups. This could represent a particular point of attention in the case of systemic pharmacological interventions or neurological disorders affecting the enzymes involved in the peripheral degradation of the radioligand. Nonetheless, it is worth mentioning the extremely low inter-animal variability in radioligand plasma stability (e. g. at 30 min p.i was 13.4 ± 1.5%). Given this high reproducibility, a single sample collection at 30 or 60 min p.i. could be used to scale the metabolite profile according to the study group.
We investigated the best kinetic method for [18F]SynVesT-1 quantification. We focused on 1TCM and 2TCM based on the previous observation that [11C]UCB-J TACs could be described with both models; 15 however, in rodents, [18F]SynVesT-1 could be described only with a 2TCM and not 1TCM. In contrast, reports in non-human primates and humans19,22 indicated both 1TCM and 2TCM to be suited for [18F]SynVesT-1 quantification, with the 2TCM favoured by model selection criteria such as the F test. 22 [18F]SynVesT-1 quantification displayed high stability in the outcome parameter estimation, reflecting the possibility of reducing scan acquisition down to 60 min, with <3% of deviation from the 120-min acquisition and consistent with the observation in humans. 19 Comparison of 2TCM to Logan plot demonstrated the validity of the latter for VT (IDIF) estimation regardless of the scan duration (both 60-min and 120-min: r2 = 0.99). Finally, using the Logan plot, reliable VT (IDIF) parametric images could be generated for each subject, allowing for voxel-wise statistics in comparative studies.
The blocking study indicated [18F]SynVesT-1 is characterized by a low non-displaceable binding (VND) similar to [11C]UCB-J in both brain10,15,22, and spinal cord. 16 In particular, blocking with LEV at 200 mg/kg resulted in an 85.6% reduction in [18F]SynVesT-1 binding, and we previously showed a 86% decline in [11C]UCB-J binding with the same experimental protocol. However, estimated SV2A occupancy using Lassen plots showed that the same 200 mg/kg dose of LEV resulted in 100% target occupancy for [18F]SynVesT-1 while it was 97% occupancy with [11C]UCB-J. 15 Notably, this aligns with the observation reported by Naganawa and colleagues where a 20 mg/kg dose of LEV resulted in an 85.3% occupancy as estimated with [18F]SynVesT-1 and 82.5% occupancy with [11C]UCB-J in the same subjects. 22 Overall, [11C]UCB-J appears to display a higher in vivo affinity than [18F]SynVesT-1 towards SV2A, consistent with the average reported in vitro Ki values of 3.3 nM for SynVesT-1 and 2.7 nM for UCB-J.22,35
Test-retest reproducibility of a radioligand is a desired feature to allow adequately powered therapeutic studies in a moderate number (n < 20–30) of subjects. [18F]SynVesT-1 VT (IDIF) estimates were stable and displayed moderate variability in the rodent CNS with an aTRV below 10%. Reproducibility of [18F]SynVesT-1 was also supported by good ICC values (range ICC = 0.58–0.77) for preclinical settings in a population of animals with low variability. Concordantly, excellent test-retest reproducibility has been reported for [18F]SynVesT-1 in humans, with an aTRV below 9%. 19
Collectively, [18F]SynVesT-1 displays the same attractive properties as previously reported for [11C]UCB-J15,19,22 with the benefit of a radioisotope with longer half-life translating into high research throughput per radiosynthesis and utilization of the radioligand at PET centers without a cyclotron. However, it still has to be explored how [18F]SynVesT-1 performs compared to [11C]UCB-J in detecting a synaptic loss in neurological and neuropsychiatric disorders. Head-to-head experiments employing both radioligands in the same subjects will help elucidate this.
In conclusion, [18F]SynVesT-1 selectively binds to SV2A with no suitable reference region in the rodent brain. By applying 2TCM or Logan plot with metabolite-corrected plasma IDIF, SV2A density could be reliably estimated noninvasively. [18F]SynVesT-1 PET imaging offers a reproducible high-throughput tool to quantify CNS synaptic density non-invasively in healthy mice. Further investigation is needed to explore its potential to assist in drug discovery, disease monitoring, and assessment of therapeutic response in neuropsychiatric and neurodegenerative disorders.
Supplemental Material
sj-pdf-1-jcb-10.1177_0271678X221101648 - Supplemental material for Validation, kinetic modeling, and test-retest reproducibility of [18F]SynVesT-1 for PET imaging of synaptic vesicle glycoprotein 2A in mice
Supplemental material, sj-pdf-1-jcb-10.1177_0271678X221101648 for Validation, kinetic modeling, and test-retest reproducibility of [18F]SynVesT-1 for PET imaging of synaptic vesicle glycoprotein 2A in mice by Daniele Bertoglio, Franziska Zajicek, Stef De Lombaerde, Alan Miranda, Sigrid Stroobants, Yuchuan Wang, Celia Dominguez, Ignacio Munoz-Sanjuan, Jonathan Bard, Longbin Liu, Jeroen Verhaeghe and Steven Staelens in Journal of Cerebral Blood Flow & Metabolism
Footnotes
Funding
The author(s) disclosed receipt of the following financial support for the research, authorship, and/or publication of this article: Antwerp University, Belgium founded the work through a partial assistant professor position for JV and a full professor position for SStr and SSta. DB is supported by a post-doctoral fellowship (ID: 1229721N) and funding (ID: K201222N) from the Research Foundation Flanders (FWO) and the University of Antwerp (BOF KP, FFB210050). This work was funded by CHDI Foundation, Inc., a nonprofit biomedical research organization exclusively dedicated to developing therapeutics that will substantially improve the lives of HD-affected individuals.
Acknowledgements
The authors thank Philippe Joye, Romy Raeymakers, and Eleni Van der Hallen of the Molecular Imaging Center Antwerp (MICA) for their valuable assistance. DB, JV, SStr, and SSta are members of the mNeuro Research Centre of Excellence at the University of Antwerp.
Declaration of conflicting interests
The author(s) declared the following potential conflicts of interest with respect to the research, authorship, and/or publication of this article: CD, YW, IMS, JB, and LL are employed by CHDI Management, Inc. as advisors to the CHDI Foundation, Inc.
Authors’ contributions
DB, JB, LL, JV, and SSta contributed to the conception and design of the study. SDL synthetized the radioligand. DB, FZ, and AM contributed to the acquisition and processing of data. DB performed data analysis and visualization. DB, SStr, CD, YW, IMS, JB, LL, JV, and SSta contributed to the interpretation of the results. DB wrote the original draft. JV and SSta contributed to writing, review, and editing. All authors assisted in reviewing the manuscript and approved the final version of this manuscript.
Material availability
All data associated with this study are presented in the paper or the Supplementary Materials. Any request for material reported in this study will be available through a material and/or data transfer agreement.
Supplemental material
Supplemental material for this article is available online.
References
Supplementary Material
Please find the following supplemental material available below.
For Open Access articles published under a Creative Commons License, all supplemental material carries the same license as the article it is associated with.
For non-Open Access articles published, all supplemental material carries a non-exclusive license, and permission requests for re-use of supplemental material or any part of supplemental material shall be sent directly to the copyright owner as specified in the copyright notice associated with the article.