
Abstract
Proper regulation and patency of cerebral microcirculation are crucial for maintaining a healthy brain. Capillary stalling, i.e., the brief interruption of microcirculation has been observed in the normal brain and several diseases related to microcirculation. We hypothesized that endothelial glycocalyx, which is located on the luminal side of the vascular endothelium and involved in cell-to-cell interaction regulation in peripheral organs, is also related to cerebral capillary stalling. We measured capillary stalling and the cerebral endothelial glycocalyx (cEG) in male mice using in vivo optical coherence tomography angiography (OCT-A) and two-photon microscopy. Our findings revealed that some capillary segments were prone to capillary stalling and had less cEG. In addition, we demonstrated that the enzymatic degradation of the cEG increased the capillary stalling, mainly by leukocyte plugging. Further, we noted decreased cEG along with increased capillary stalling in a mouse model of subcortical vascular dementia (SVaD) with impaired cortical microcirculation. Moreover, gene expression related to cEG production or degradation changed in the SVaD model. These results indicate that cEG mediates capillary stalling and impacts cerebral blood flow and is involved in the pathogenesis of SVaD.
Keywords
Introduction
Appropriate regulation of cerebral microcirculation is critical for proper brain function. Previous studies have revealed that cerebral capillary flow velocities are heterogeneous, and some segments of capillaries are frequently stalled.1,2 Recent studies have found that capillary stalling occurs naturally and not randomly in multiple capillaries,3,4 while another study reported that increased capillary stalling heavily impacts cerebral blood flow. 5 Capillary stalling plays a role in aging, stroke, Alzheimer’s disease, polycythemia, and thrombocythemia.2–9 While previous studies have shown that capillary stalling is induced by leukocyte plugging, its underlying mechanism needs to be corroborated.5,10
The endothelial glycocalyx (EG), a layer of proteoglycans and glycoproteins on the luminal side of the vessels, plays an important role in the maintenance of proper microcirculation. 11 For example, it involves in regulation of vessel permeability, prevention of inflammation, and regulation of blood and endothelial cell interactions. 11 EG as a regulator for blood and endothelial cell interaction had been studied at multiple levels. Using cultured cells, EG degradation leads to increased NB4 cell adhesion. 12 In an isolated heart of guinea pig, the EG was damaged by ischemia and reperfusion, and preventing EG degradation reduced neutrophil adhesion.13,14 Furthermore, in vivo experiments revealed that leukocyte adhesion increased after EG degradation in the cremaster muscle and pulmonary microvessels.15–17 However, whether the EG in the brain is similarly involved in the regulation of blood and endothelial cell interactions remains unclear. Considering its roles and location, cEG is a possible mediator in the mechanism of capillary stalling.
Subcortical vascular dementia (SVaD) is the most frequently occurring type of vascular dementia, with impaired microcirculation and white matter hyperintensity seen on magnetic resonance imaging.18,19 SVaD patients reportedly have reduced blood perfusion in both cortical and subcortical regions. Using functional imaging modalities, positron emission tomography, single-photon emission computed tomography, or near-infrared spectroscopy, decreased cerebral blood flow, cerebral metabolic rate of oxygen, and structural degradation were observed in the cortex of SVaD patients.20–25 The reduced cortical cerebral blood flow is correlated with white matter hyperintensities in human meta-anaylsis. 26 Moreover, the number of microbleeds that are profoundly located in the cortex are correlated with cognitive impairments in SVaD patients. 27 Although the changes in the cortical cerebral blood flow are related to the pathological outcomes of SVaD, detailed studies on cortical microcirculation are lacking. Furthermore, since the deficits in SVaD develop over time, a longitudinal investigation is required for a better understanding of the disease.
We aimed to investigate whether cEG is associated with capillary stalling and determine the association between cEG and SVaD pathogenesis. Accordingly, we measured microcirculation, such as capillary stalling and vessel density after cEG degradation, using longitudinal optical coherence tomography angiography (OCTA), which enables label-free visualization of the three-dimensional microvasculature and blood flow.28,29 We also measured the extent of the cEG using two-photon microscopy (TPM). Additionally, mRNA sequencing was performed to identify changes in the cEG-related gene expression in the cerebral endothelium of the SVaD model.
Material and methods
Animals
All animal preparations and experiments were conducted with permission from the Institutional Animal Care and Use Committee of Korea Advanced Institute of Science and Technology (KA2018-04) in accordance with the Animal Protection Act of Korea (Act No.15278). All experiments were reported in accordance with the ARRIVE (Animal Research: Reporting in vivo Experiments) guidelines (https://www.nc3rs.org.uk/arrive-guidelines). 30 A total of 108 male C57BL/6J mice aged 10–12 weeks (25–29 g) were used in this study.
Injection of the cEG degrading enzyme
Hyaluronidase was used to degrade the hyaluronan of the cEG and heparinase I and III were used to effectively degrade heparan sulfate regardless of its sulfation. Heparinase I (H2519, Merck, 0.1 unit/μL, 140 unit/kg), heparinase III (H8891, Merck, 0.05 unit/μL, 1.5 unit per mouse), and hyaluronidase (H3884, Merck, 50 mg dissolved in 750 μL saline, 5 mg per mouse) were dissolved in saline and mixed before injection.17,31,32 Sterile saline was used for experiment control. To deliver the mixed enzymes effectively to the brain, the enzymes were infused intra-arterially under urethane anesthesia (1.5 mg/kg, intraperitoneally (i.p.)). 33 Details of the intra-arterial injection are in the Supplementary Information. Enzyme or saline was circulated for an hour. Body temperature, SO2, heart rate, and respiratory rate were measured (75-1501, Harvard Apparatus).
Ex vivo and in vivo capillary stalling observation
To quantify capillary stalling ex vivo, 4 μm diameter polystyrene microspheres (S37225, ThermoFisher) coated with DiI dye were injected through the tail vein under urethane anesthesia (1.5 mg/kg, i.p.) as previously described. 4 The microspheres were circulated for an hour after which 20 mL of phosphate-buffered saline was perfused followed by 20 mL of 4% paraformaldehyde. The harvested brain was sliced at 30 μm thickness. The remaining DiI-coated microspheres were counted and defined as the number of capillary stalls.
To quantify capillary stalling in vivo, DiI-coated microsphere or rhodamine 6G (R6G) (83697, Merck) dye was utilized. DiI-coated microspheres were circulated for an hour before image acquisition by TPM with an 800 nm laser. Images were acquired from pial surface to 300 μm depth with 10 μm step size with a 420 × 420 μm2-field of view (FOV). To identify the cause of capillary stalling in vivo, R6G, which labels leukocytes and platelets, was utilized. 34 Texas red conjugated dextran 70 kDa (D1830, ThermoFisher) was used to label blood plasma. The emission bandpass filter for Texas red conjugated dextran was 605–625 nm. R6G was injected 20 minutes before imaging by TPM with an 850 nm excitation laser. The emission bandpass filter for R6G was 506–534 nm. Repeated volume imaging was performed from pial surface to 200 μm depth with 5 μm step size with 280.56 × 280.56 μm 2 FOV for an hour. R6G dye accumulates in the mitochondria of cells. 35 Therefore, leukocytes and platelets were labeled with R6G dye but not red blood cells (RBCs). To identify cell types of R6G-positive cells, 50 µl of Hoechst 33342 (62249, ThermoFisher) was infused intravenously with R6G dye. The emission bandpass filter for Hoeschst 33342 was 455–500 nm. Only the leukocytes were co-labeled with Hoechst 33342 and R6G. Therefore, it was possible to classify the cause of capillary stalling. The time for one volume of angiogram was 351.4 seconds. Stalled capillaries were classified by their cause (stalled capillary by leukocyte plugging or RBCs plugging).
Cranial window surgery
To acquire cEG images 8 weeks after SVaD induction, mice were anesthetized by intraperitoneal injection of urethane (1.5 mg/kg) and their left somatosensory cortex was exposed and sealed with 1.5% agarose solution as previously described. 36 For capillary stalling observation in SVaD, a chronic cranial window was implanted for which the mice were anesthetized with a mixture of Zoletil (30 mg/kg) and Xylazine (10 mg/kg) via intraperitoneal injection. After left somatosensory cortex exposure, sandwich cover glass (stacked 5 mm and 3 mm diameter glass) and head-plate were implanted at 2 weeks before imaging as previously described. 37
SVaD induction
To induce SVaD, mice were anesthetized with a mixture of Zoletil (30 mg/kg) and xylazine (10 mg/kg) via intraperitoneal injection and placed on a heat blanket to maintain body temperature at 37 °C. A spiral microcoil with an internal diameter of 0.18 mm (Sawane Spring Co.) was placed at the right common carotid artery (CCA), and an ameroid constrictor with an inner diameter of 0.5 mm (Research Instrument SW) was placed at the left CCA (Supplementary Figure 1A). 38 Sham surgery was performed for the control mice.
Capillary isolation and mRNA sequencing
Capillaries in the cerebral cortex were isolated using dextran solution. 39 After anesthesia with urethane (1.5 mg/kg. i.p.), mice were decapitated without blood washout, and the brains were stored in ice-cold MCDB131 media (10372019, ThermoFisher). The cortexes from two mice were pooled and were dissected for capillary isolation; further details for capillary isolation can be found in the Supplementary Information. RNA was isolated from the isolated capillary pellet and high-throughput sequencing was performed using NovaSeq 6000 (Illumina); further details for mRNA sequencing can be found in Supplementary Information.
OCTA and D-OCT imaging
A swept-source OCT system with a center wavelength of 1.3
OCTA and TPM imaging
A temporal series of OCT angiograms of the mouse cortex was obtained before TPM imaging. Stalled segments located 150–200
Data analysis
Changes in capillary stalling and vessel density were measured using en face OCT angiograms. A time-averaged OCT angiogram was generated by averaging all angiograms acquired. The overall contrast of the averaged OCT angiogram was adjusted by contrast limited histogram equalization. After equalization, vessels were segmented using the Weka trainable segmentation plugin in Fiji software (Supplementary Figure 1 C).43–46 Shadows from large pial vessels were manually removed from the image. The vascular areas of the large pial vessels were measured. Subsequently, a binary mask of the capillary network was obtained, which was then skeletonized. Skeletonized segments smaller than 4 pixels were removed. Vessel density was defined as the total number of skeleton segments divided by the area excluding the area occupied by the large pial vessels. Capillary stalling was evaluated using a temporal series of OCT angiograms. Each angiogram was multiplied by the binary mask to clearly identify the vessels. Capillaries that showed a sudden drop in the signal in at least one frame of the OCT angiograms (<7 seconds) during the entire acquisition were defined as stalled segments and were identified automatically using MATLAB (Mathworks) and double-checked by manual inspection. The density of the stalled segments was defined as the number of stalled segments divided by the vessel density to correct for the possibly high stalled segment numbers due to the high vessel density. A time course of changes in the vessel density and the density of stalled segments during the 9 weeks of imaging were obtained for each animal. Each time course was normalized to the baseline course (W0), and the area under the curve of the time course of the density of the stalled segments was defined as the severity of capillary stalling. Some portions of the stalled segments at baseline (W0) were stalled again during the 9 weeks of imaging; these capillaries were defined as re-stalled segments. Alterations in vessel density and the density of stalled segments were investigated using six sham and nine SVaD mice. Two of the eight sham mice were excluded from analysis due to regrowth of the thick dura mater, which affected the quality of the OCT angiograms.
cEG images by TPM were analyzed using Fiji software. The intensity profiles of WGA-lectin FITC and dextran-TMR in the direction perpendicular to the vessel wall were measured, as previously described. 42 We measured the extent of cEG covering rather than the thickness because cEG thickness does not reflect the cEG density. The boundary between the cEG layer and blood plasma was defined as the inflection point of the minimum-maximum normalized intensity profile of dextran-TMR, while the boundary between the endothelial cells and cEG layer was defined as the location where the intensity of WGA-lectin exceeded the mean plus five times the standard deviation of background noise (Supplementary Figure 1D). The area under the curve of the relative intensity profile of WGA-lectin FITC between the boundaries was defined as the extent of the cEG.
Capillary stalling quantification and classification of the capillary stalling causes were analyzed using TPM images after R6G injection. Capillaries with blood flow blocked by leukocytes and RBCs were measured. To measure long capillary stalling (>700 seconds), we measured the stalling period for each mouse, which was calculated by multiplying the number of long capillary stalling (>700 seconds) by the duration of each stalling. Leukocytes were identified by the Hoechst 33342-positive and R6G-positive pixels. Platelets were identified by the Hoechst 33342-negative and R6G-positive pixels. RBCs were identified by unstained blood plasma.
Arterial hemodynamic parameters, such as vessel diameter and flow speed were measured using D-OCT imaging. 40 Among the 9 SVaD mice, one was excluded from analysis as the flow speed of the pial artery decreased below the minimum detectable limit of the D-OCT measurements before W8.
For IHC data analysis, all confocal images were analyzed using Fiji software. To evaluate gliosis, the percentage of GFAP-positive pixels among all pixels within the region of interest was measured. Blood-brain barrier (BBB) disruption was evaluated as the mean fluorescence intensity of the anti-IgG antibody signal in the image. IHC analysis was performed using the five sham and nine SVaD mice that were used for the OCTA analysis. One of the six sham mice was excluded from the IHC analysis because of severe brain damage that occurred during brain harvesting.
For RNA sequencing data, quality was controlled with FastQC. Adaptor and low-quality reads (<20) were removed using FASTX-Trimmer and BBMap. After trimming, reads were mapped to the reference genome using TopHat. 47 Fragments per kb per million reads (FPKM) values were used to approximate gene expression level. 48 The FPKM values were normalized based on a quantile normalization method using EdgeR.
Statistical analysis
Statistical analysis was performed using GraphPad Prism 8 (GraphPad Software) and SPSS 25 (IBM). All data are presented as mean ± standard deviation, median and interquartile range, or 95% confidence interval of the mean. Data were tested for normality using Kolmogorov−Smirnov and Shapiro−Wilk tests. All statistical analysis results and number of animals are summarized in Supplementary Tables 1–4. Differences between groups were tested using parametric or non-parametric statistics depending on the distribution of data. For comparing two groups, Student’s t-test, Welch’s t-test, or Mann−Whitney test were used. All longitudinal data from OCT imaging were tested using two-way repeated measure analysis of variance, followed by Bonferroni’s correction. A log-transformation (natural logarithm) was performed to satisfy normality. Pearson correlation coefficient was calculated to measure correlation. Details regarding the number of samples, p values, and other notes for each group are included in the figure legends.
Results
Less extent of cEG observed in the stalled capillary segment
A capillary bed at 150–300 μm depth was imaged with OCTA. Capillary stalling was observed with serial OCTA angiograms. Because of sudden blockage of blood flow, a steep decrease of decorrelation signal occurred in some of capillary segments (Figure 1(a) and Supplementary Video 1). These segments were classified as stalled capillary segments and demarcated by blue color. There were re-stalled capillary segments among the stalled capillary segments. Approximately 38.4% of segments were stalled more than twice during 9 weeks of OCTA imaging (six mice used, mean = 38.41 ± 11.17; Figure 1(b)). Stalled capillary segments found with OCTA were searched using TPM. The cEG of the stalled capillary segments and adjacent non-stalled capillary segments was imaged (Figure 1(c)). Visible WGA-lectin signal along the capillary wall was detected in non-stalled capillary segments but not in stalled capillary segments. The quantified extent of the cEG was significantly smaller in the stalled capillary segments than in the non-stalled capillary segments (Figure 1(c); nine mice used, n = 38 for non-stalled capillary segments, 0.54 ± 0.42, n = 24 for stalled capillary segments, 0.21 ± 0.13, p < 0.0001). There was no difference in the diameter of the stalled and non-stalled capillary segments (4.262 ± 1.301 μm, n = 38 and 4.376 ± 1.532 μm, n = 24 for non-stalled and stalled capillary segments, respectively; p = 0.7543).
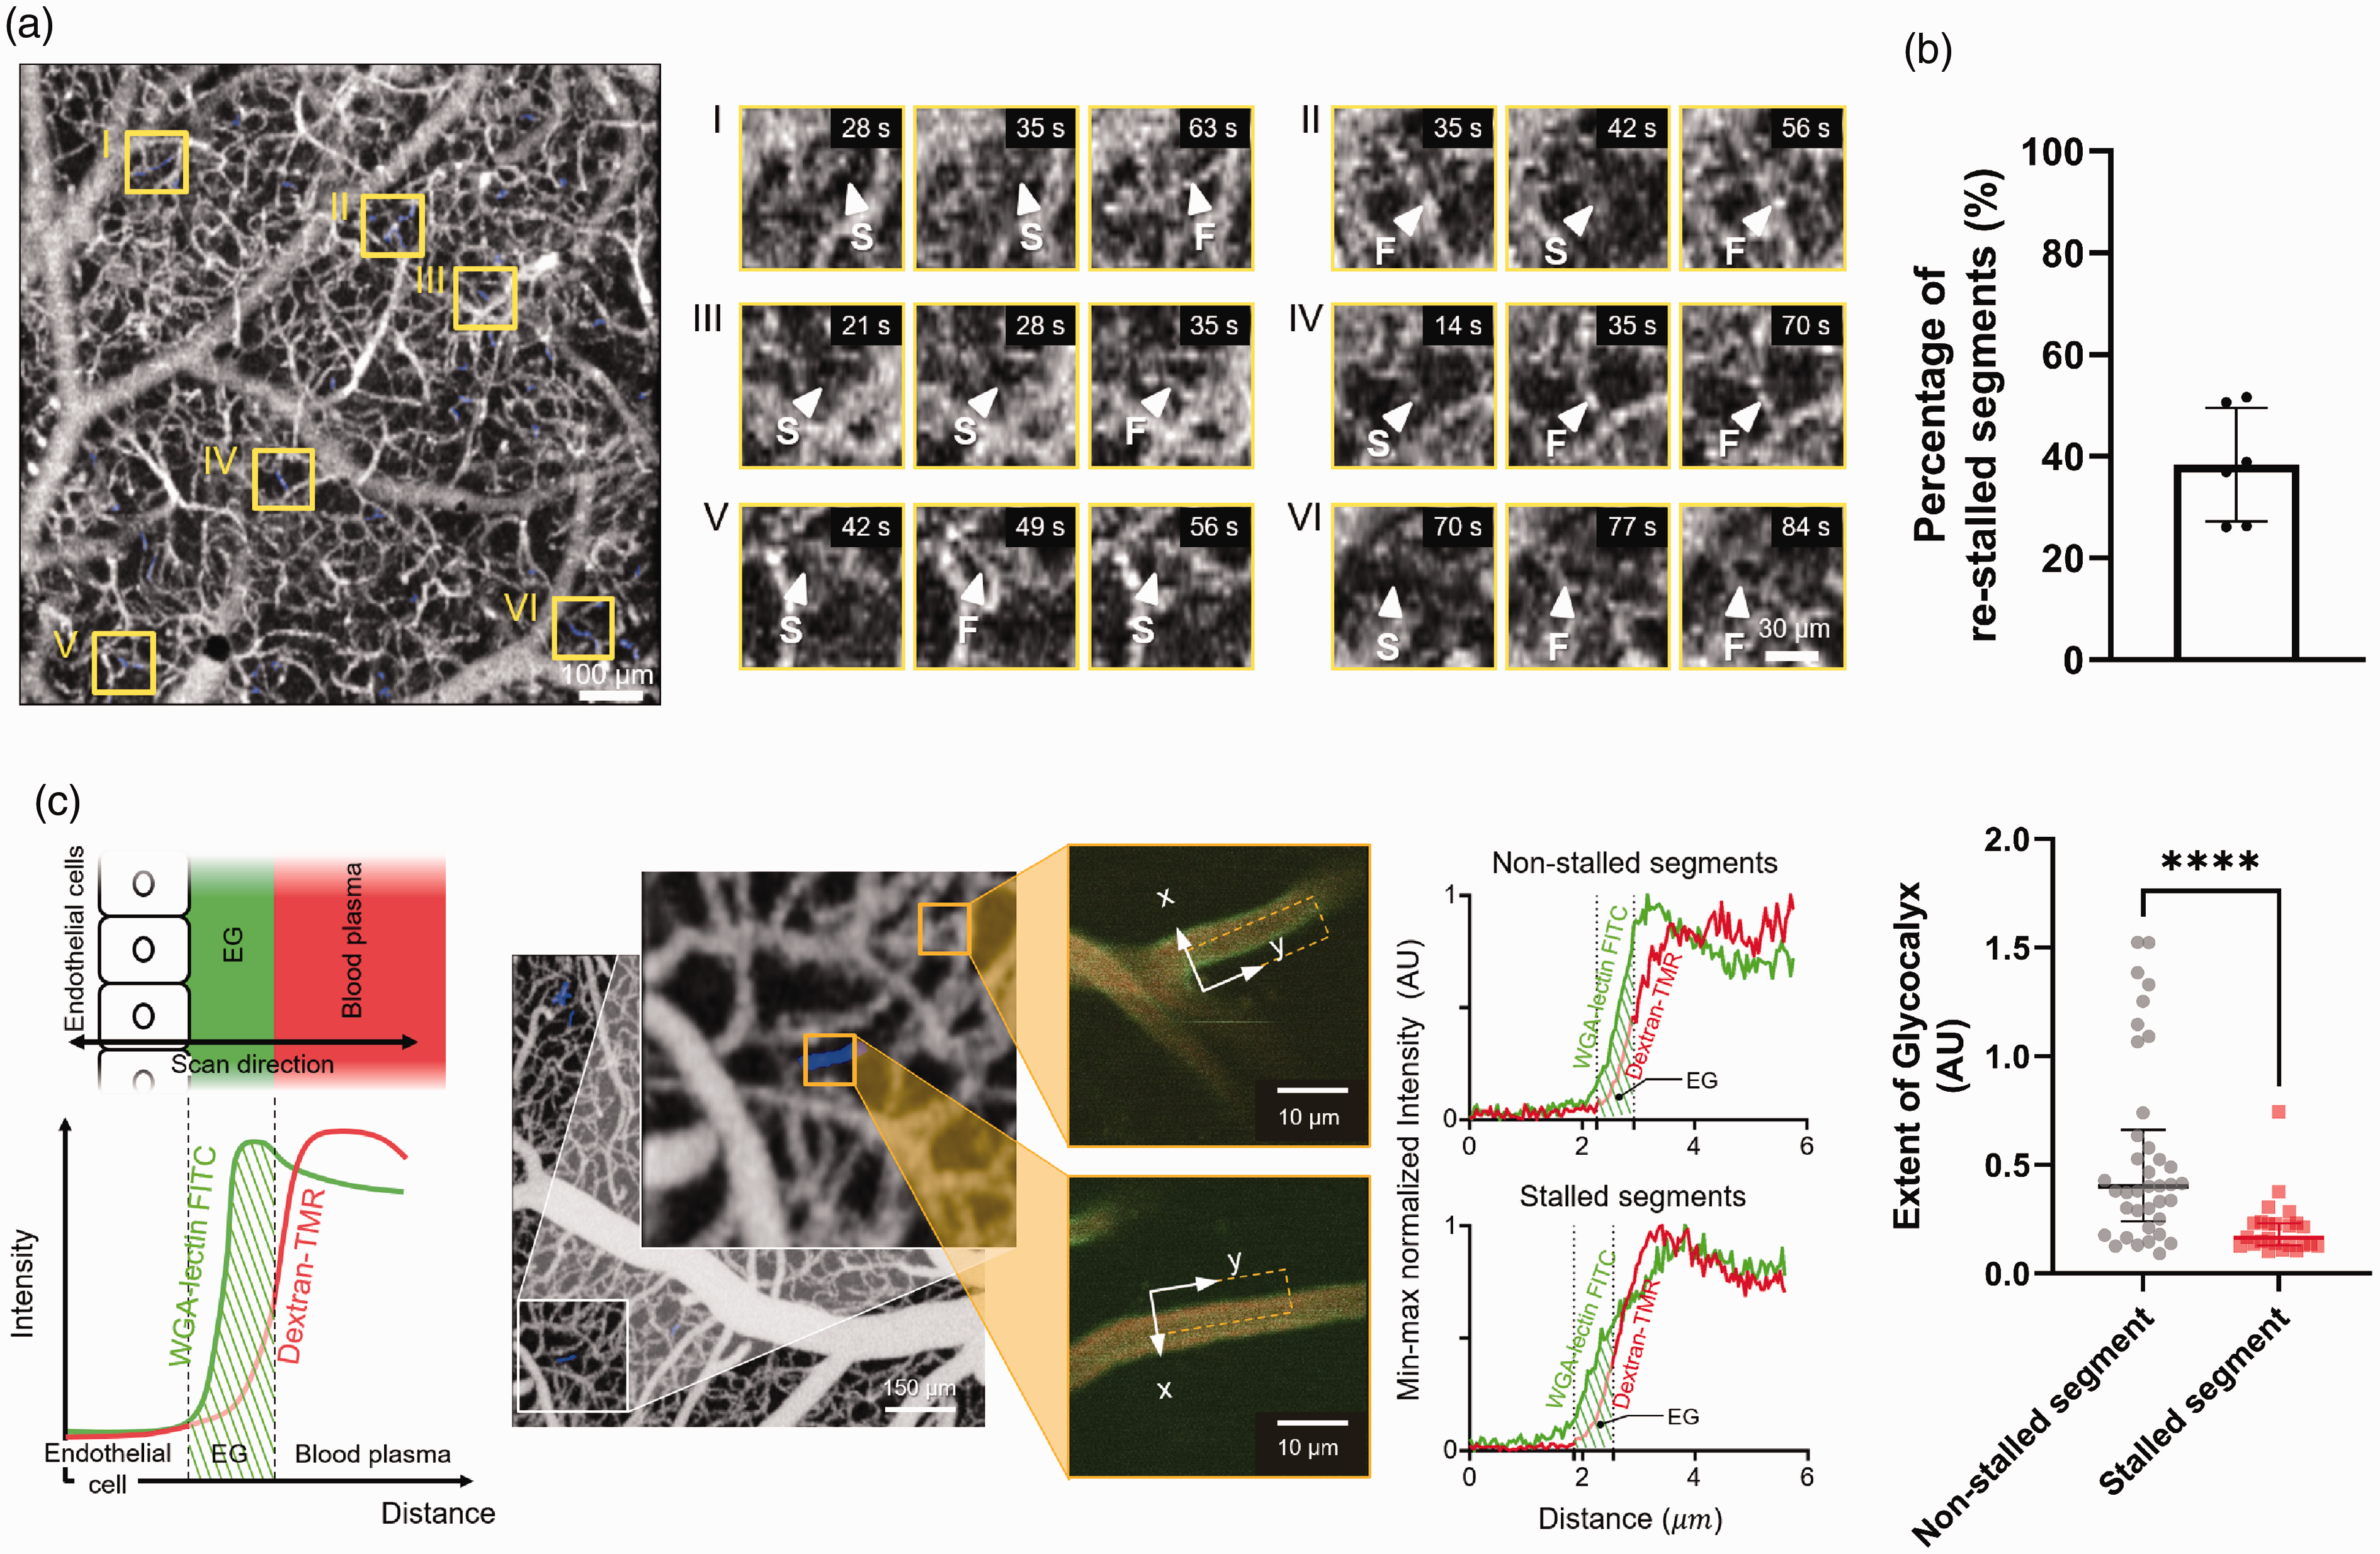
Stalled capillary segment has less extent of cerebral endothelial glycocalyx. (a) (left) Representative high-quality angiogram acquired by optical coherence tomography angiography (OCTA). OCTA provides temporal dynamics of blood flow at a single capillary level. Capillary stalling occurs in certain capillary segments as demarcated by blue color. (right) Capillary stalling occurs in magnified images of capillaries from yellow boxes in the left angiogram. At a certain time, a sharp drop of signal inside the capillary occurs because of blocking of capillary blood flow. The letter F indicates flowing frames and the letter S indicates stalled frames. (b) In sham mice, 38.4% of the stalled capillary segments are re-stalled capillary segments (n = 6). (c) (left) The schematic figure demonstrates cEG in capillaries. The intensity profiles of WGA-lectin-FITC and dextran-TMR are overlaid along the scan direction. Two dotted lines indicate the cEG boundaries. The extent of cEG is defined as the region marked by the diagonal line. (middle) TPM images of the blue-colored stalled capillary segment and neighboring non-stalled capillary segment demonstrates the different distribution of cEG. Averaged WGA-lectin-FITC and dextran-TMR intensity profile across the dotted square in TPM images reflects the different distribution of cEG. WGA-lectin-FITC and dextran-TMR profiles are minimum-maximum normalized for better presentation. (right) A smaller extent of cEG is measured in stalled capillary segments (9 mice were used, n = 38 for non-stalled capillary segments, n = 24 for stalled capillary segments). Data are presented as mean ± standard deviation or median and interquartile range. The Mann–Whitney test is used (****: p < 0.0001). Scale bar: 100 μm for Figure 1(a) (left), 30 μm for Figure 1(a) (right), 10 μm for Figure 1(c) (middle).
Increased capillary stalling after cEG degradation
A mixture of heparinase and hyaluronidase was infused through the left CCA an hour before microsphere injection. The enzyme treatment degraded the WGA signal in the cerebral vessels (Supplementary Figure 2). We measured the number of microspheres after 1 hour. We confirmed that the microspheres were located inside the capillaries (Figure 2(b)). Increased number of microspheres, i.e. increased capillary stalling, in the cortex, hippocampus, and subcortex after 1 hour of enzymatic degradation of cEG was observed (Figure 2(c); n = 8 for each group; 2.0 ± 0.4 and 3.4 ± 1.1 for cortex treated with saline and enzyme, respectively, p = 0.01; 1.9 ± 0.3 and 3.5 ± 1.3 for hippocampus treated with saline and enzyme, respectively, p = 0.13; and 1.6 ± 0.4 and 2.4 ± 0.9 for subcortex treated with saline and enzyme, respectively, p = 0.04). Additionally, the number of microspheres increased after the separate injection of heparinase or hyaluronidase (Supplementary Figure 3). Furthermore, the number of microspheres increased both in the ipsilateral and contralateral hemispheres (Supplementary Figure 4). After enzyme administration, the animal physiology was altered over time and a difference in respiratory rate was found with a post-hoc test, 1 hour after enzyme treatment (Supplementary Figure 5). Additionally, there was no significant correlation between the number of microspheres and altered physiology parameters.
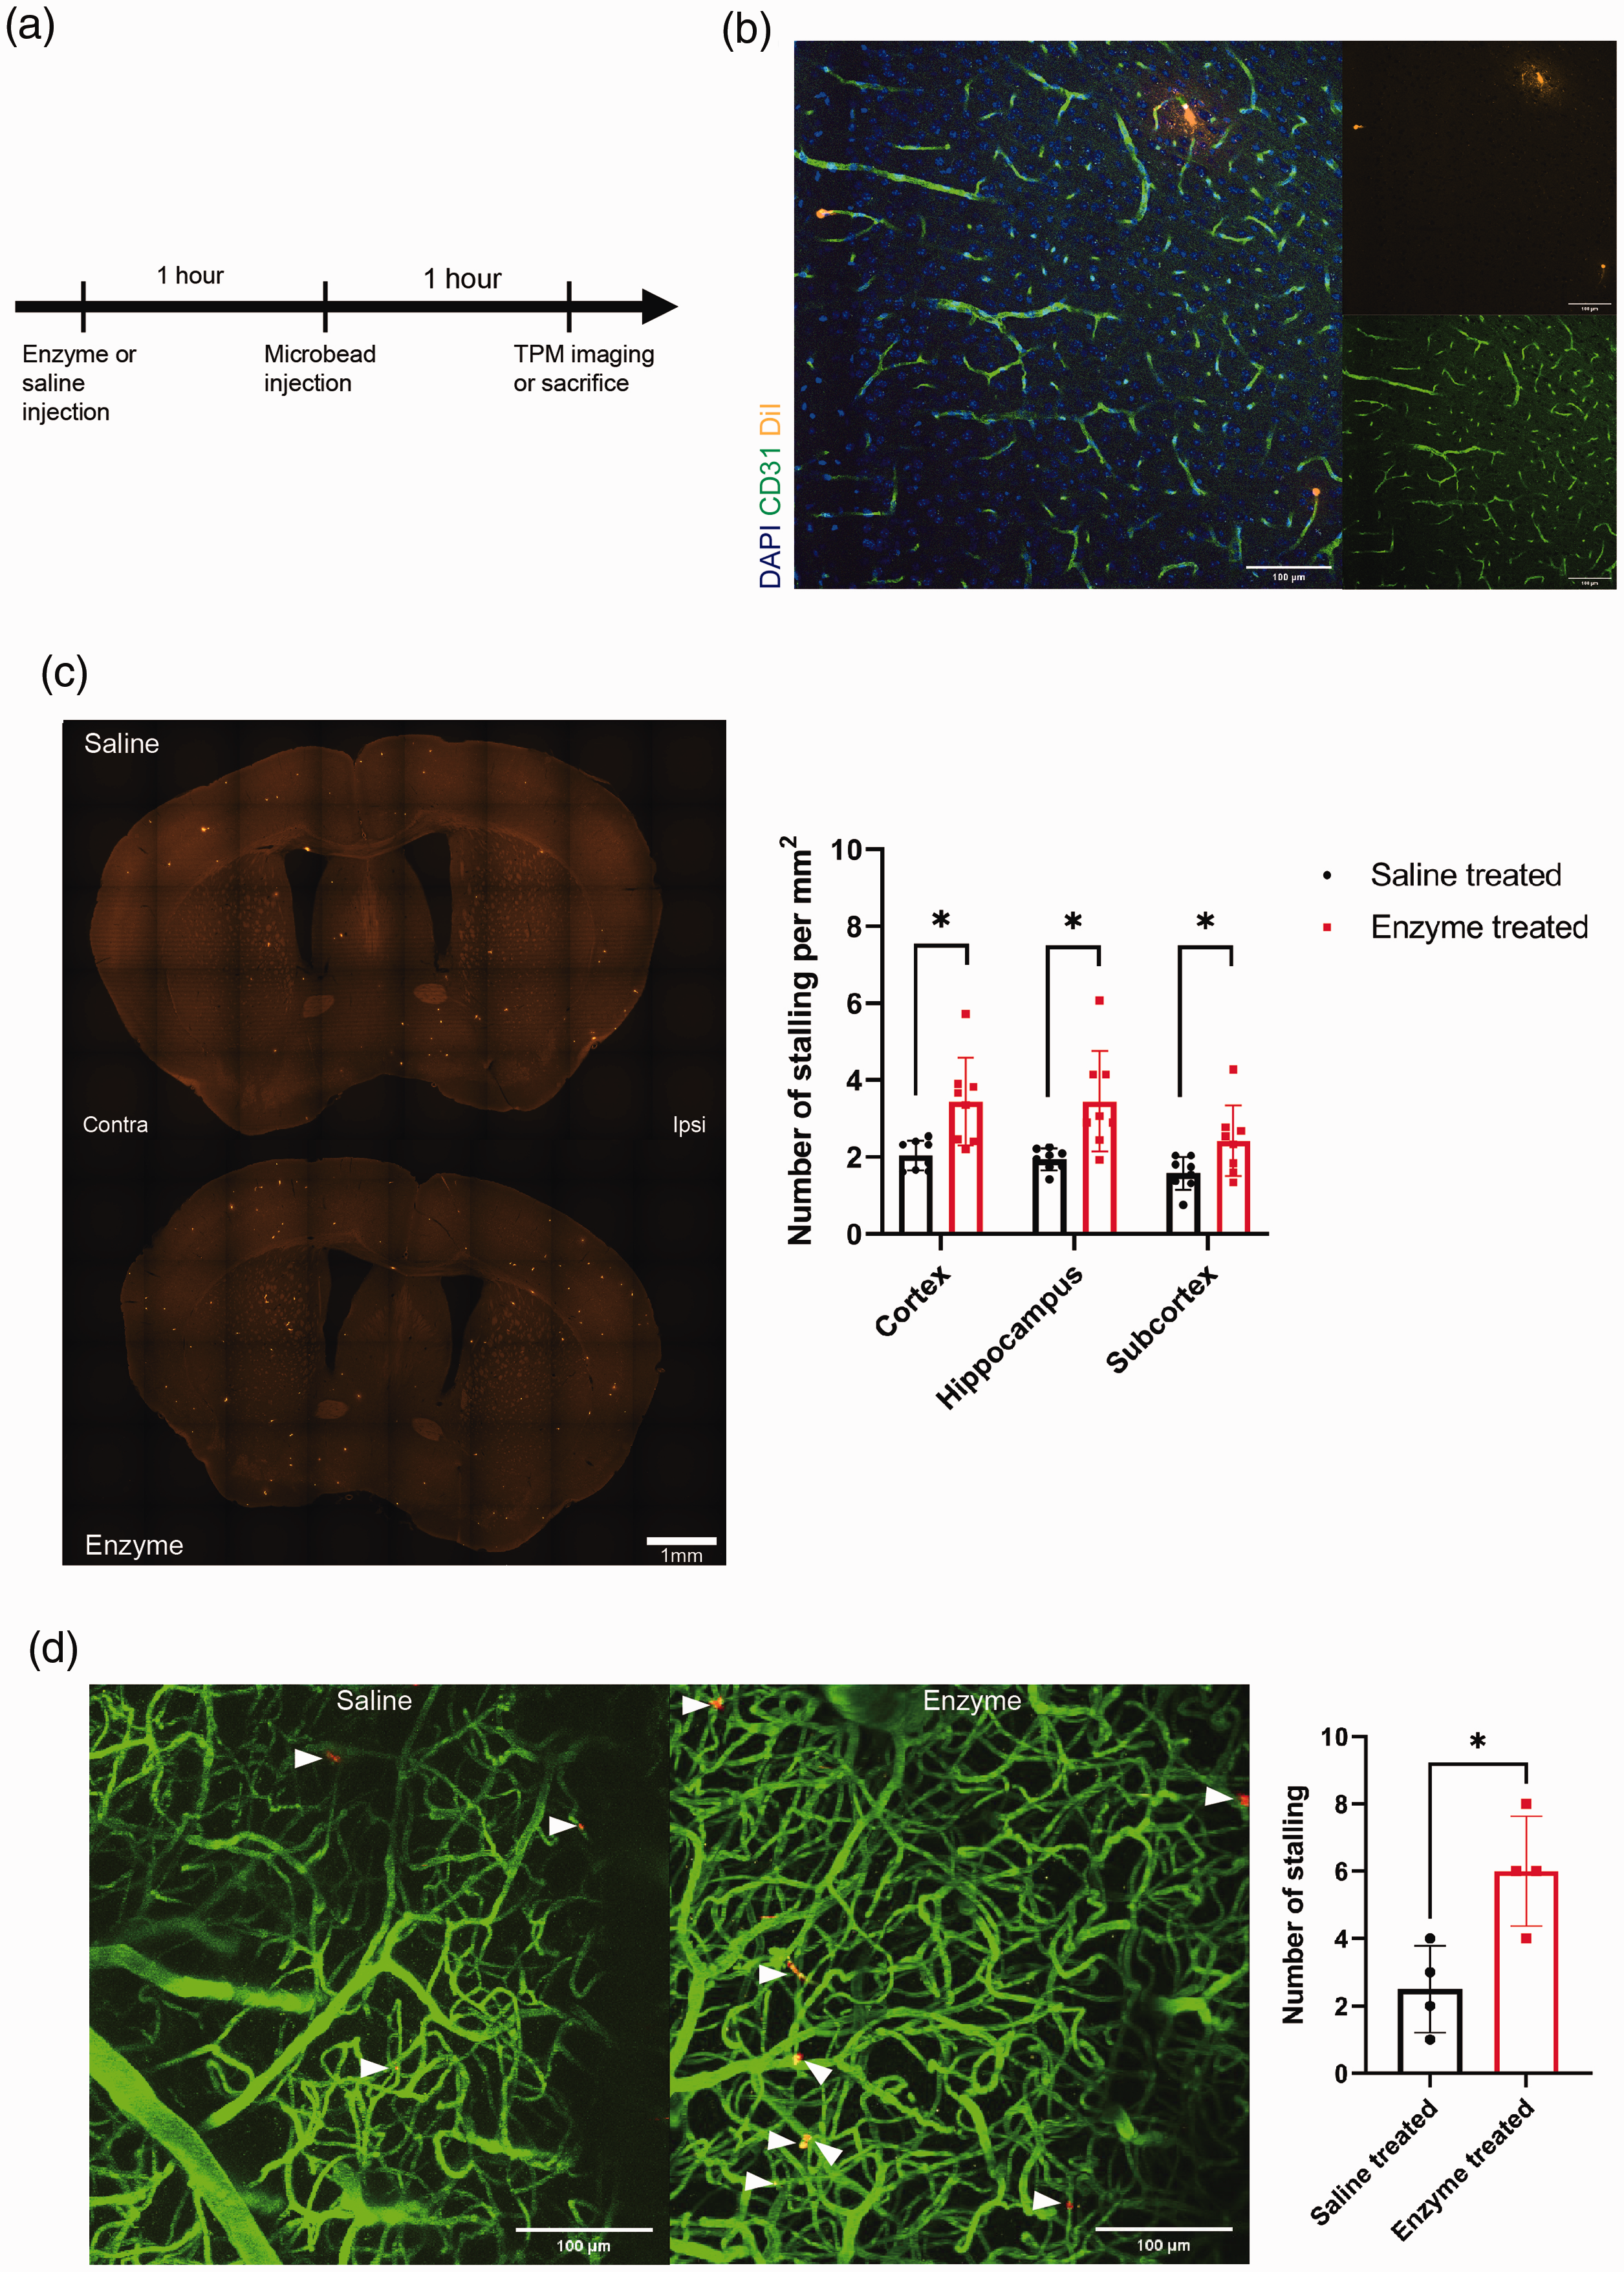
Capillary stalling increases after cerebral endothelial glycocalyx (cEG) degradation. (a) The experimental timeline to explore the effect of cEG on capillary stalling is shown. (b) Immunohistological staining of cerebral vessels shows DiI dye-coated microspheres located inside capillaries and marked capillary stalling. (c) The number of DiI dye-coated microspheres increases after cEG degradation in the cortex, hippocampus, and subcortex (n = 8 for saline and enzyme-treated group). (d) In vivo two-photon microscopy imaging confirms an increased number of DiI-coated beads after enzymatic degradation of cEG (n = 4 for saline and enzyme-treated group). Data are presented as mean ± standard deviation. The unpaired t-test with Welch correction (Figure 2(c), *: p < 0.05) and unpaired t-test (Figure 2(d), *: p < 0.05) are used. Scale bar: 100 μm (Figure 2(b)), 1 mm (Figure 2(c)), 100 μm (Figure 2(d)).
In vivo imaging was also performed as the number of microspheres may be affected during ex vivo sample preparation. The number of microspheres increased after cEG degradation (Figure 2(d); n = 4 for each group, 2.5 ± 1.3 for saline-treated, 6 ± 1.6 for enzyme-treated, p = 0.015). Additionally, there was no significant difference in pial artery blood flow after saline or enzyme treatment (Supplementary Figure 6).
Increased leukocyte plugging after cEG degradation
To reveal the cause of increased capillary stalling, in vivo TPM imaging was performed after leukocyte labeling. Stalled capillary segments were identified by R6G-positive cells or by RBCs. As expected, the total number of capillary stalls over an hour increased (Figure 3(a); n = 5, 25.8 ± 14.8 and n = 4, 72.3 ± 32.1 for the saline- and enzyme-treated groups, respectively, p = 0.023) and also the total number of capillary stalls over an hour by plugged R6G-positive cells increased (Figure 3(b); n = 5, 19.8 ± 13.6 and n = 4, 57 ± 24.7 for the saline- and enzyme-treated groups, respectively, p = 0.023) after enzymatic cEG degradation. However, the total number of capillary stalls over an hour by cells other than R6G-positive cells did not significantly increase after cEG degradation (n = 5, 6 [0.5–11.5] and n = 4, 16.0 [7.8–22.0] for the saline- and enzyme-treated group, respectively, p = 0.127). Additionally, stalling period >700 seconds was quantified through serial TPM imaging. The stalling period was increased after enzyme treatment (n = 5, 2460 [351.4–9488] and n = 4, 13705 [11596–31099] seconds for saline- and enzyme-treated groups, respectively, p = 0.016). Stalling period by plugged R6G-positive cells was increased after cEG degradation (n = 5, 2460 [351.4–6501] seconds and n = 4, 9312 [8434–20996] seconds for the saline- and enzyme-treated groups, respectively, p = 0.016). In contrast, the period of stalling by cells other than plugged R6G-positive cells had not increased (n = 5, 0 [0–2987] seconds and n = 4, 4393 [2723–10542] seconds for the saline- and enzyme-treated group, respectively, p = 0.056). In particular, in the three mice treated with saline, capillary stalling by the RBCs was not observed for >700 seconds. Although it did not reach statistical significance, maybe due to statistical power, the period of stalling by cells other than plugged R6G-positive cells showed an increasing trend. To identify increased plugged R6G-positive cells after enzyme treatment, we labeled leukocytes with Hoechst 33342 and R6G (Figure 3(d)). 34 Most of the capillary stalling was caused by plugged leukocytes (Figure 3(e); p = 0.0079, 11.20 ± 5.119 for the number of plugged leukocytes and 1 ± 1.414 for the number of plugged platelets; five mice were analyzed). There was no difference in capillary diameter after saline or enzyme treatment (median = 3.288 μm, n = 75 for saline and median = 3.562 μm, n = 60 for enzyme-treated capillaries, p = 0.097).
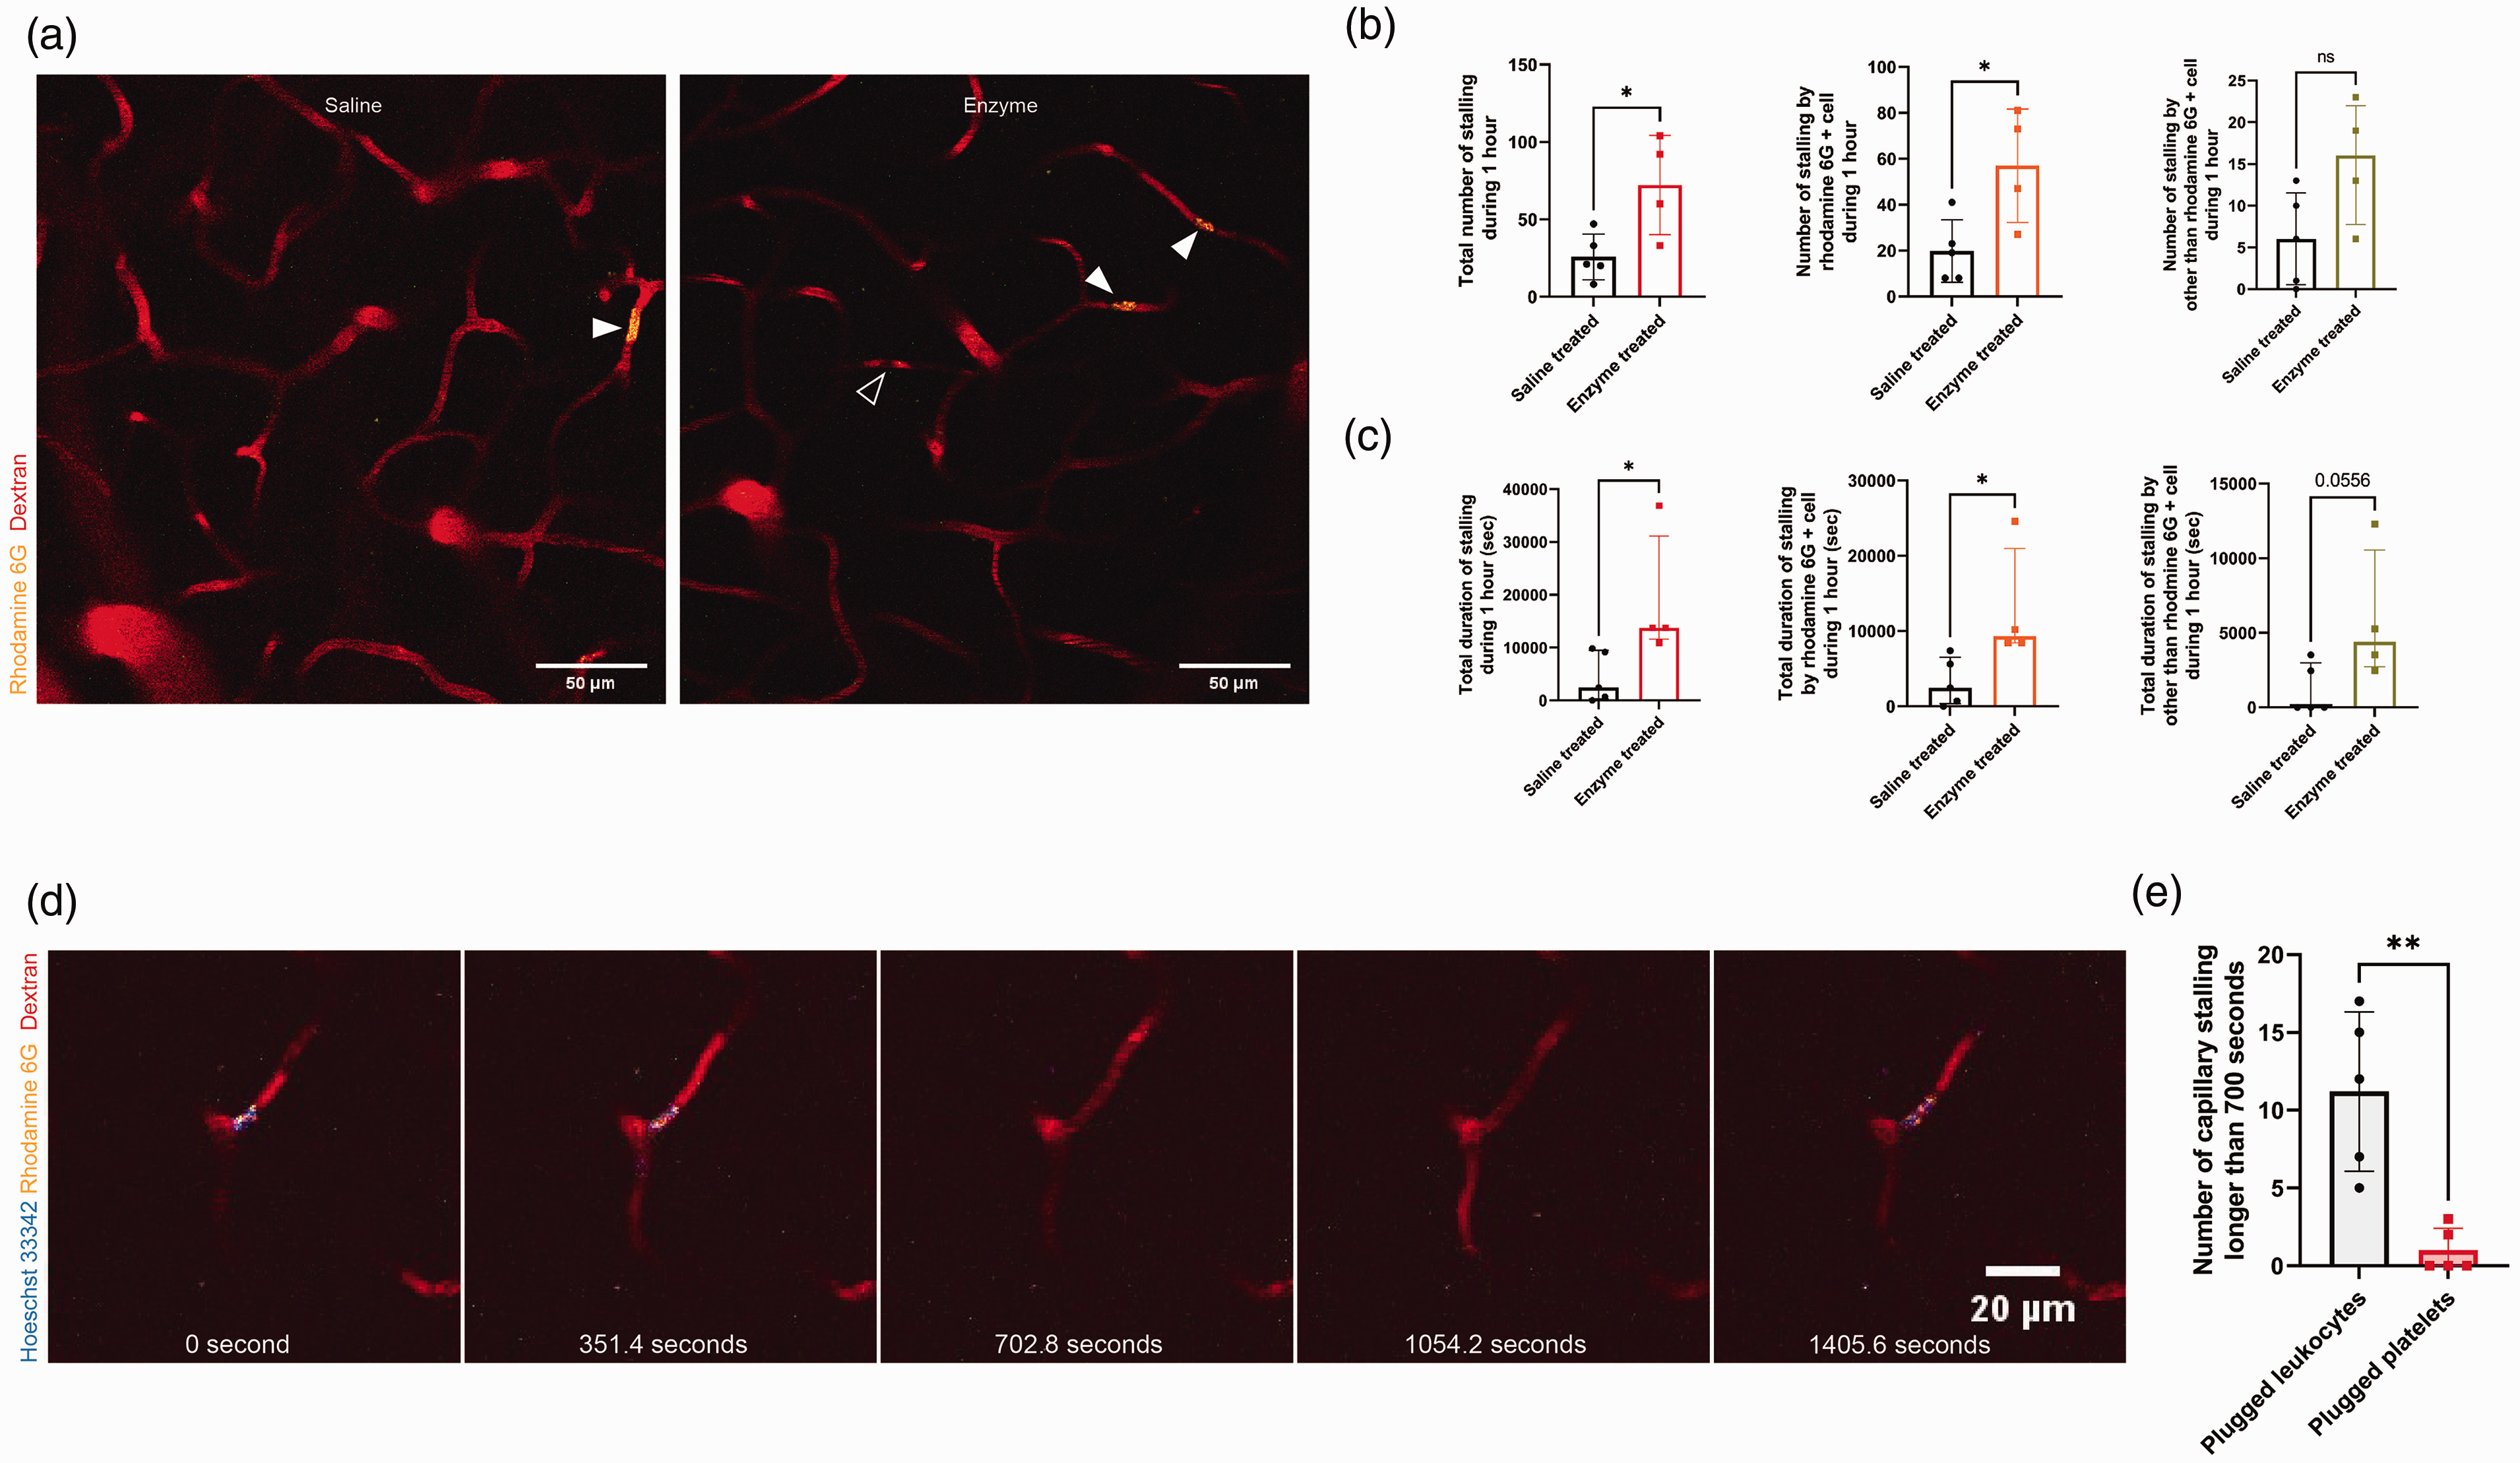
Leukocyte plugging increases after enzymatic degradation of cerebral endothelial glycocalyx (cEG). (a) Representative angiogram of saline- or enzyme-treated mouse. Arrowheads indicate capillary stalling by R6G-positive cells or by RBCs (R6G negative). (b) The total number of capillary stalls during 1 hour increases after cEG degradation. Capillary stalling by R6G-positive cells during 1 hour increases after cEG degradation. Capillary stalling by cells other than R6G-positive cells is not increased (n = 5 for the saline-treated group, n = 4 for the enzyme-treated group). (c) Total period of capillary stalling more than 700 seconds increases after cEG removal. The total period of capillary stalling by R6G-positive cells is increased. The total period of capillary stalling by cells other than R6G-positive cells has an increasing trend (n = 5 for the saline-treated group, n = 4 for the enzyme-treated group). (d) Representative angiogram of enzyme-treated capillaries with leukocyte plugging. Leukocytes are identified with colocalized Hoecht 33342 and R6G signal. (e) The quantified number of capillary stalls indicates the main cause of capillary stalling as leukocyte plugging (p = 0.0079, 11.20 ± 5.119 for the number of plugged leukocytes, 1 ± 1.414 for the number of plugged platelets, five mice are analyzed, Mann−Whiney test). Data are presented as mean ± standard deviation or median and interquartile range. The unpaired t-test and Mann−Whitney test are used (*: p < 0.05, **: p < 0.01). Scale bar: 50 μm (Figure 3(a)), 20 μm (Figure 3(d)).
Capillary stalling increases with SVaD progression
Before microcirculation imaging in SVaD, we validated decreased arterial blood flow in the SVaD model with D-OCT. After inducing SVaD, rapid decrease in arterial flow was measured (Supplementary Figure 7). Alterations in vessel density and the density of stalled segments were measured. Charge-coupled device (CCD) images in Figure 4(a) show the regions where OCTA was performed in sham and SVaD mice. Alterations in microcirculation were hardly detectable in the CCD images because of insufficient spatial resolution. Time-averaged OCT angiograms acquired at the same regions during the 9 weeks of imaging showed an apparent capillary loss in SVaD mice, while no apparent changes were observed in sham mice (Figure 4(b)). Vessel density (normalized to the baseline value acquired at W0) decreased in SVaD mice (Figure 4(c)), but not to a significant level (n = 6 for sham and n = 9 for SVaD mice, F(8,104)=1.12, p = 0.3274 for interaction; F(1,13)=2.06, p = 0.1751 for group factor). The density of the stalled segments were significantly higher in the SVaD than in the sham mice (Figure 4(d); n = 6 for sham and n = 9 for SVaD mice; F (8,104)=4.23, p = 0.0002 for interaction; F(1,13)=7.54, p = 0.0166 for group factor). The number of stalled segments were increased in the SVaD mice (Supplementary Figure 8). At W8, the density of stalled segments in SVaD mice was 2.61 times higher than that in the sham mice (n = 6 for sham and n = 9 for SVaD mice, sham: 1.24-fold change, SVaD: 3.24-fold change, p = 0.024). The number of stalled segments for only one frame (<7 seconds) was significantly increased in the SVaD mice (F(8,104)=2.289, p = 0.027, n = 6 for sham, n = 9 for SVaD) (Supplementary Figure 9). The number of stalled segments for more than two frames (>14 seconds) or more than three frames (>21 seconds) was not different in both groups. The averaged stall duration showed a decreasing trend in the SVaD mice (F(8,104)=2.007, p = 0.0526, n = 6 for sham, n = 9 for SVaD). The number of stalled segments at W0 (n = 6 for sham and n = 9 for SVaD mice, sham: 23.6 ± 6.4, SVaD: 20.9 ± 7.8, p = 0.4939) was much smaller than the total number of capillaries in both the sham and SVaD mice (n = 6 for sham and n = 9 for SVaD mice, sham: 4367 ± 929.3, SVaD: 4972 ± 1033.0, p = 0.2688). Approximately 40% of the stalled segments identified at W0 stalled again at least once during the 9 weeks of imaging in both the sham and SVaD mice (n = 6 for sham and n = 9 for SVaD mice, Figure 4(e); sham: 38.41 ± 11.2, SVaD: 40.77 ± 13.6, p = 0.7298). This result indicates that stalling did not occur randomly but that certain segments have a higher susceptibility to stalling. It is noteworthy that more than 40% of the re-stalled segments were lost at W8 in SVaD mice, which is twice the rate of capillary segments loss compared to that in sham mice (n = 6 for sham and n = 9 for SVaD mice, Figure 4(f); sham: 19.96 (15.42–30.00), SVaD: 36.84 (27.88–53.26), p = 0.0042). Additionally, astrogliosis and BBB leakage were correlated with capillary stalling (Supplementary Figures 10). During the 9 weeks of imaging, there were no differences in physiological signals between the sham and SVaD mice (Supplementary Figure 11).
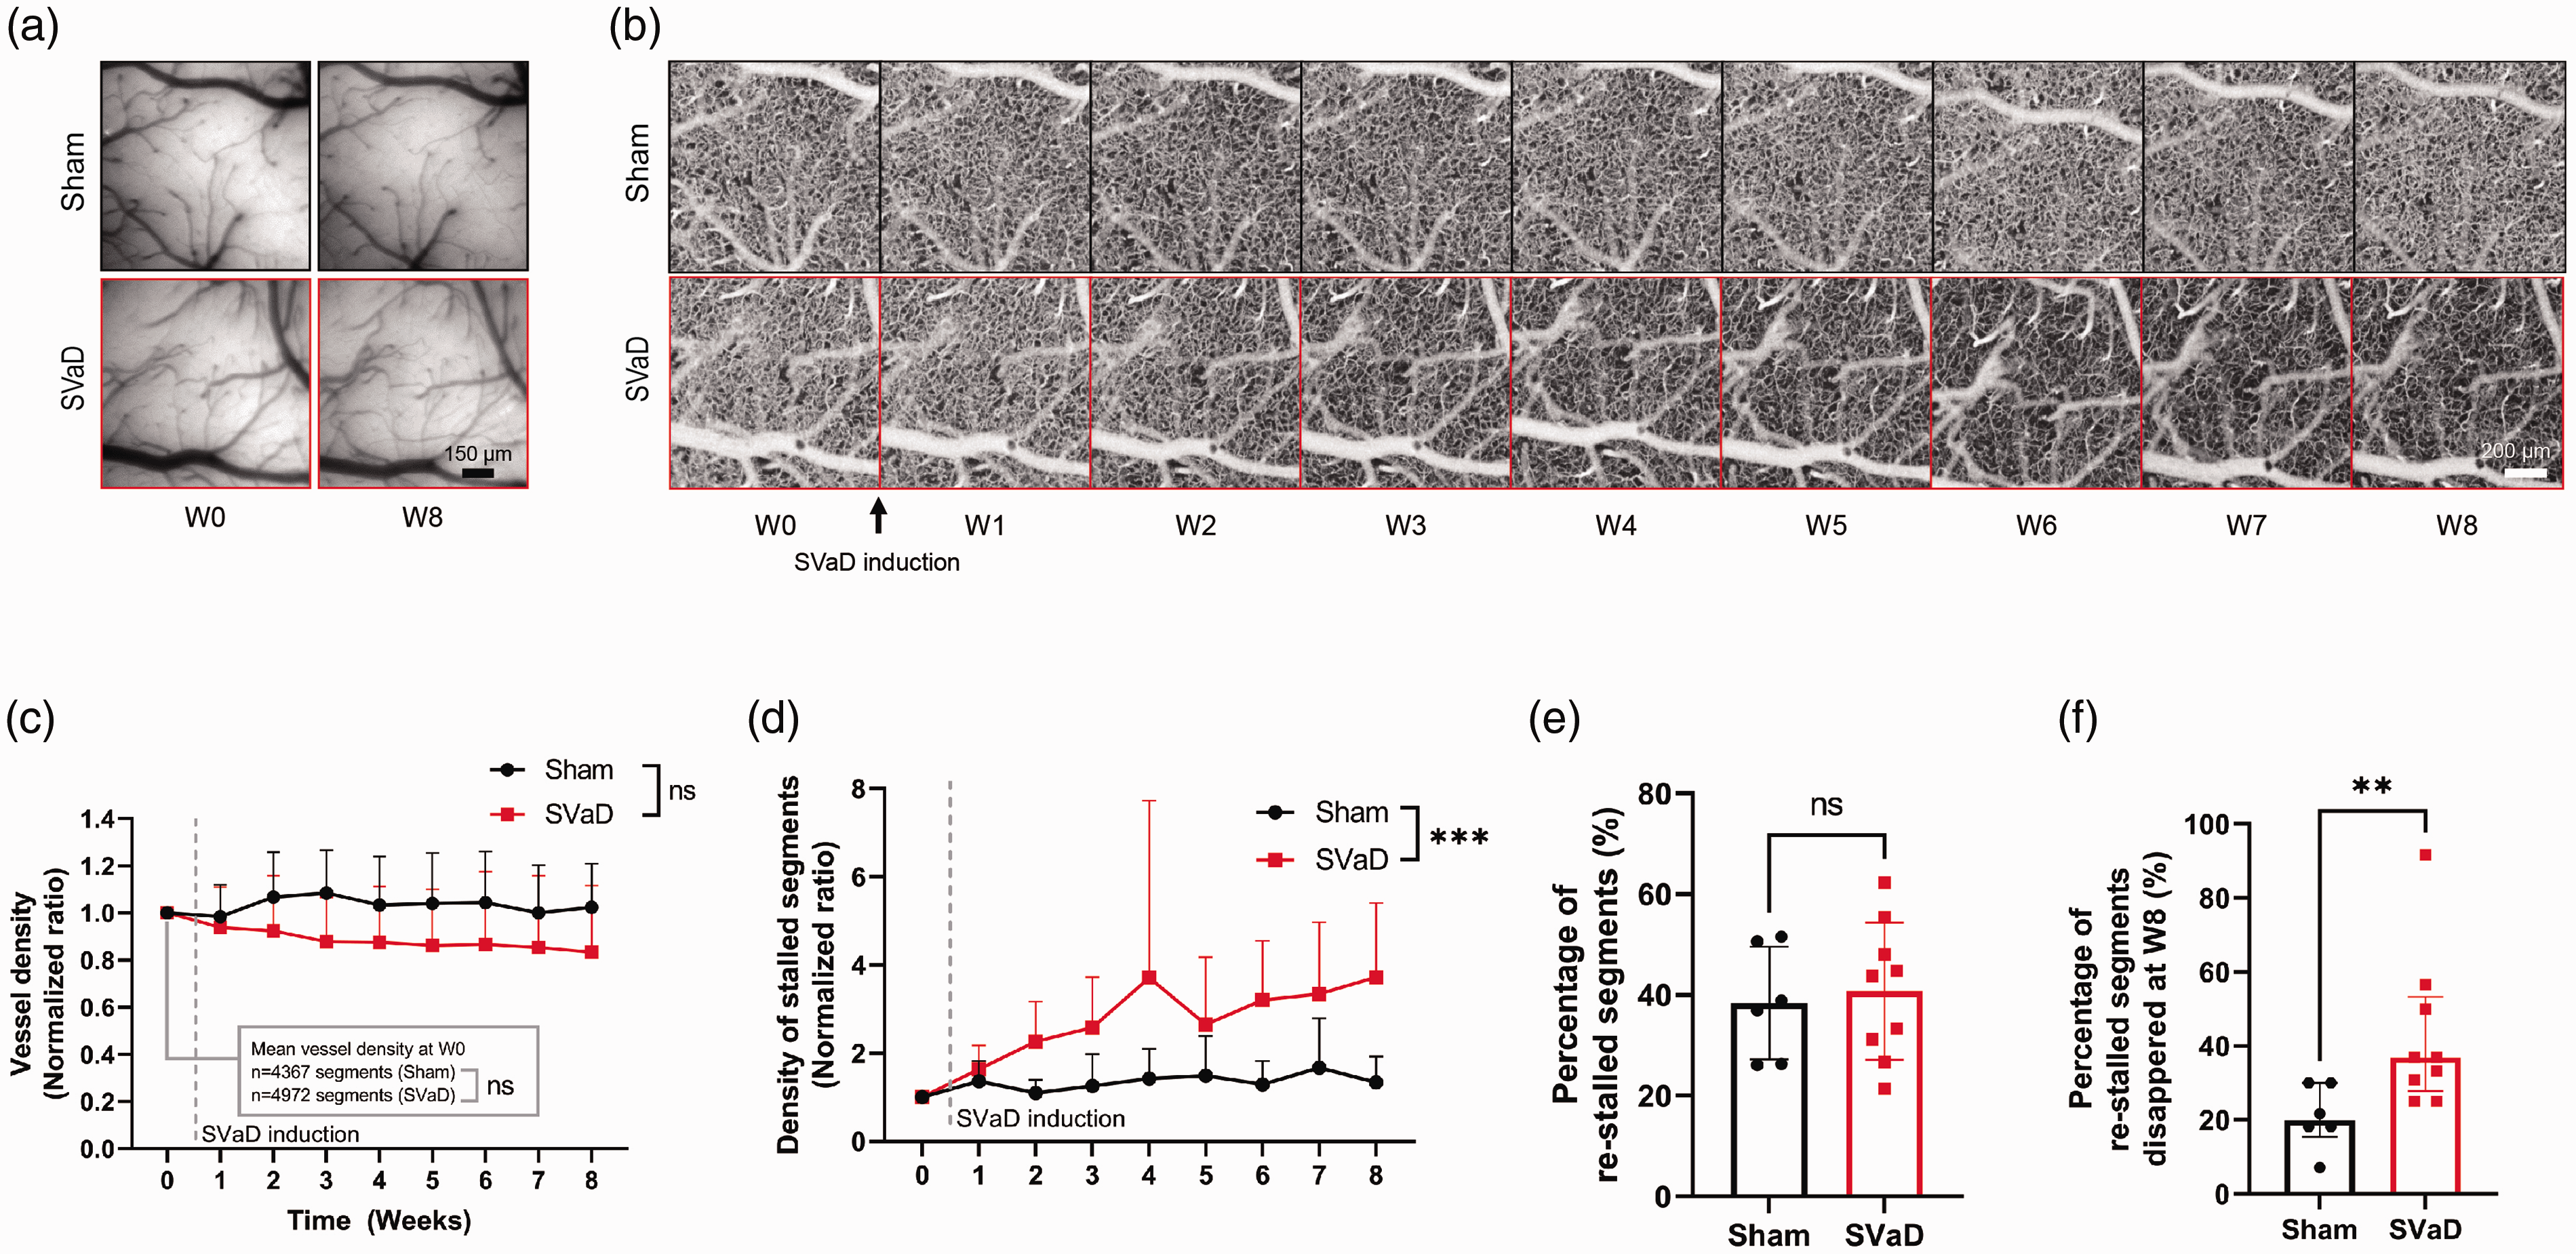
Cerebral microcirculation is altered in subcortical vascular dementia (SVaD). a. No detectable changes with CCD images both in sham and SVaD mice. b. Longitudinal imaging with OCTA demonstrates cerebral microcirculation changes during 9 weeks of imaging. Reduced vessel density is detected in this representative SVaD mouse. c. Even though some SVaD mice show apparent vessel density reduction, it does not significantly reduce in SVaD mice (F (8,104)=1.165 for interaction, p = 0.3274, F(1,13)=2.058 for group factor, p = 0.1751). d. Density of stalled capillary segments increases in SVaD mice (F (8,104)=4.232 for interaction, p = 0.0002, F(1,13)=7.544 for group factor, p = 0.0166). e. Proportion of re-stalled capillary segments is not different between the two groups (38.41 ± 11.2 for sham, 40.77 ± 13.6 for SVaD mice, p = 0.7298). F. Percentage of re-stalled segments disappearing at 8 weeks after surgery significantly increases (19.96 (15.42–30.00) for sham, 36.84 (27.88–53.26) for SVaD mice, p = 0.0042). Data are present as mean ± standard deviation. (c, e), median and interquartile range (F), or 95% confidence of interval of the mean (d). n = 6 for sham and n = 9 for SVaD mice. Log transformation is performed for the density of stalled segments. A two-way analysis of variance followed by Bonferroni’s post-hoc test, unpaired t-test, and Mann−Whitney test is used (**: p < 0.01, ***: p < 0.001). Scale bar: 150 μm (Figure 4(a)), 200 μm (Figure 4(b)).
Degraded cEG in SVaD
Capillary segments from the pial surface to 200 μm in depth were randomly imaged using TPM. There was a clear distribution of WGA-lectin signal on the luminal side of the capillaries in the sham mice (Figure 5(a)). However, there was no clear distribution of WGA-lectin signal at capillaries of the SVaD mice even when leukocytes were labeled with WGA-lectin. The quantified extent of cEG was significantly reduced in SVaD (Figure 5(b); four mice for each group, n = 79, 0.51 [0.37–0.78] for sham mice, n = 74, 0.2 [0.16–0.40] for SVaD mice, p < 0.0001). The extent of cEG was reduced after one week of SVaD induction (Supplementary Figure 12).
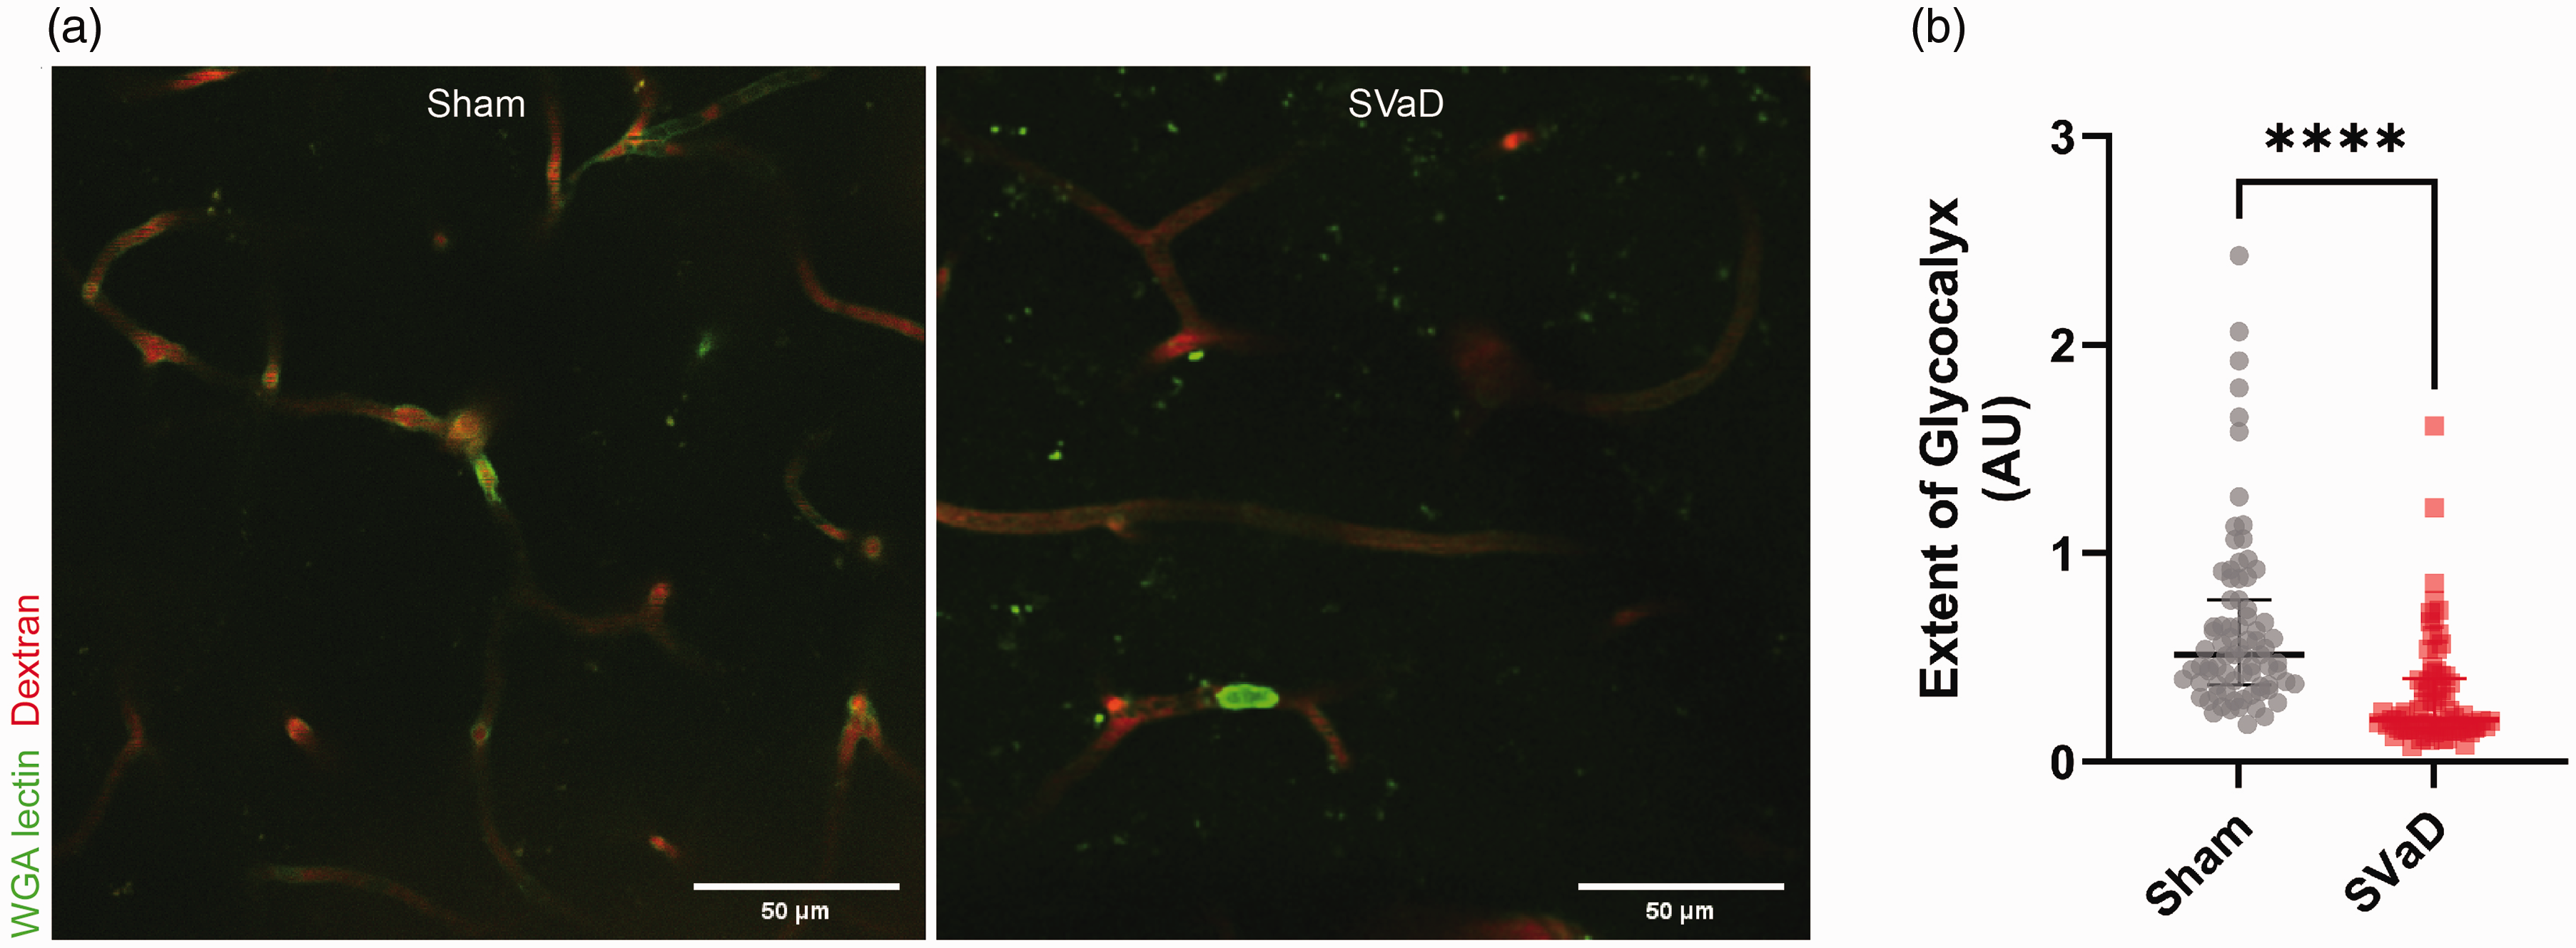
Extent of cerebral endothelial glycocalyx (cEG) is reduced in subcortical vascular dementia (SVaD). (a) A representative two-photon microscopy image of the capillary bed from sham and SVaD mice shows cEG and blood plasma. In the sham mice, cEG is clearly distributed on the luminal side of capillaries but not in SVaD capillaries. (b) The extent of cEG is significantly reduced in the SVaD model mice (n = 79, 0.51 (0.37–0.78) for sham mice, n = 74, 0.2 (0.16–0.40) for SVaD mice). Four mice are used for each group. Data are presented as median and interquartile range. The Mann−Whitney test was used (****: p < 0.0001). Scale bar: 50 μm.
Glycocalyx-related gene expression changes in SVaD
Isolated cortical capillaries were collected for RNA sequencing. We purified mRNA at 1 week and 8 weeks after SVaD induction (Figure 6(a)). Among the total mRNA, genes with >1.3-fold up/down change with statistical significance (p < 0.05) were classified as upregulated and downregulated genes. A week after SVaD induction, 427 genes were upregulated and 208 genes were downregulated (Figure 6(b); N = 3 for each group). Eight weeks after SVaD induction, 756 genes were upregulated and 386 genes were downregulated (N = 4 for the sham group, N = 3 for the SVaD group). Gene set enrichment analysis revealed that genes involved in extracellular matrix (ECM)-related biological pathways had changed expression after SVaD induction. More changes in ECM-related pathways were detected at 8 weeks after SVaD induction (Figure 6(c)). Endothelial cell-specific genes and glycocalyx-related genes were identified based on a previous study. 49 More modified gene expression was measured at 8 weeks than 1 week after SVaD induction (Figure 6(d) and Supplementary Table 5). It should be emphasized that angiopoietin2 (Angpt2) expression was upregulated at only 8 weeks after SVaD induction. Glycocalyx-related gene expression was also modified after SVaD induction. At 1 week after SVaD induction, dermatan sulfate epimerase (Dse), heparan sulfate 6-O-sulfotransferase 1, matrix metalloproteinase 9 (MMP9), and hyaluronan mediated motility receptor had modified gene expression. There were more modified glycocalyx-related gene expressions 8 weeks after SVaD induction. Decorin, galectin 1, galectin 9, a disintegrin and metalloproteinase with thrombospondin motifs type 1 motif 9, Dse, heparanase (Hpse), hyaluronidase 3, MMP14, and hyaluronan and proteoglycan link protein 3 (Hapln3) were upregulated. Beta-1,4-galactosyltransferase 6 (B4galt6), hyaluronan and proteoglycan link protein 2 (Hapln2), hyaluronan and proteoglycan link protein 4 (Hapln4), and exostosin-like glycosyltransferase1 (Extl1) were downregulated. Furthermore, since protein kinase A (PKA) and protein kinase C (PKC) signaling pathways are involved in the secretion of heparanase 50 we performed gene ontology analysis for PKA, PKC, and lysosome secretion involved gene set and found that seven genes were significantly changed (Supplementary Figure 13). These results suggest that the PKA, PKC, and lysosome secretion signaling pathways are involved in heparanase secretion and increased when Angpt2 increased. mRNA expression for leukocyte adhesion molecules such as Icam-2 and Pecam-1 was changed after 8 weeks of SVaD induction (Figure 6(e)).
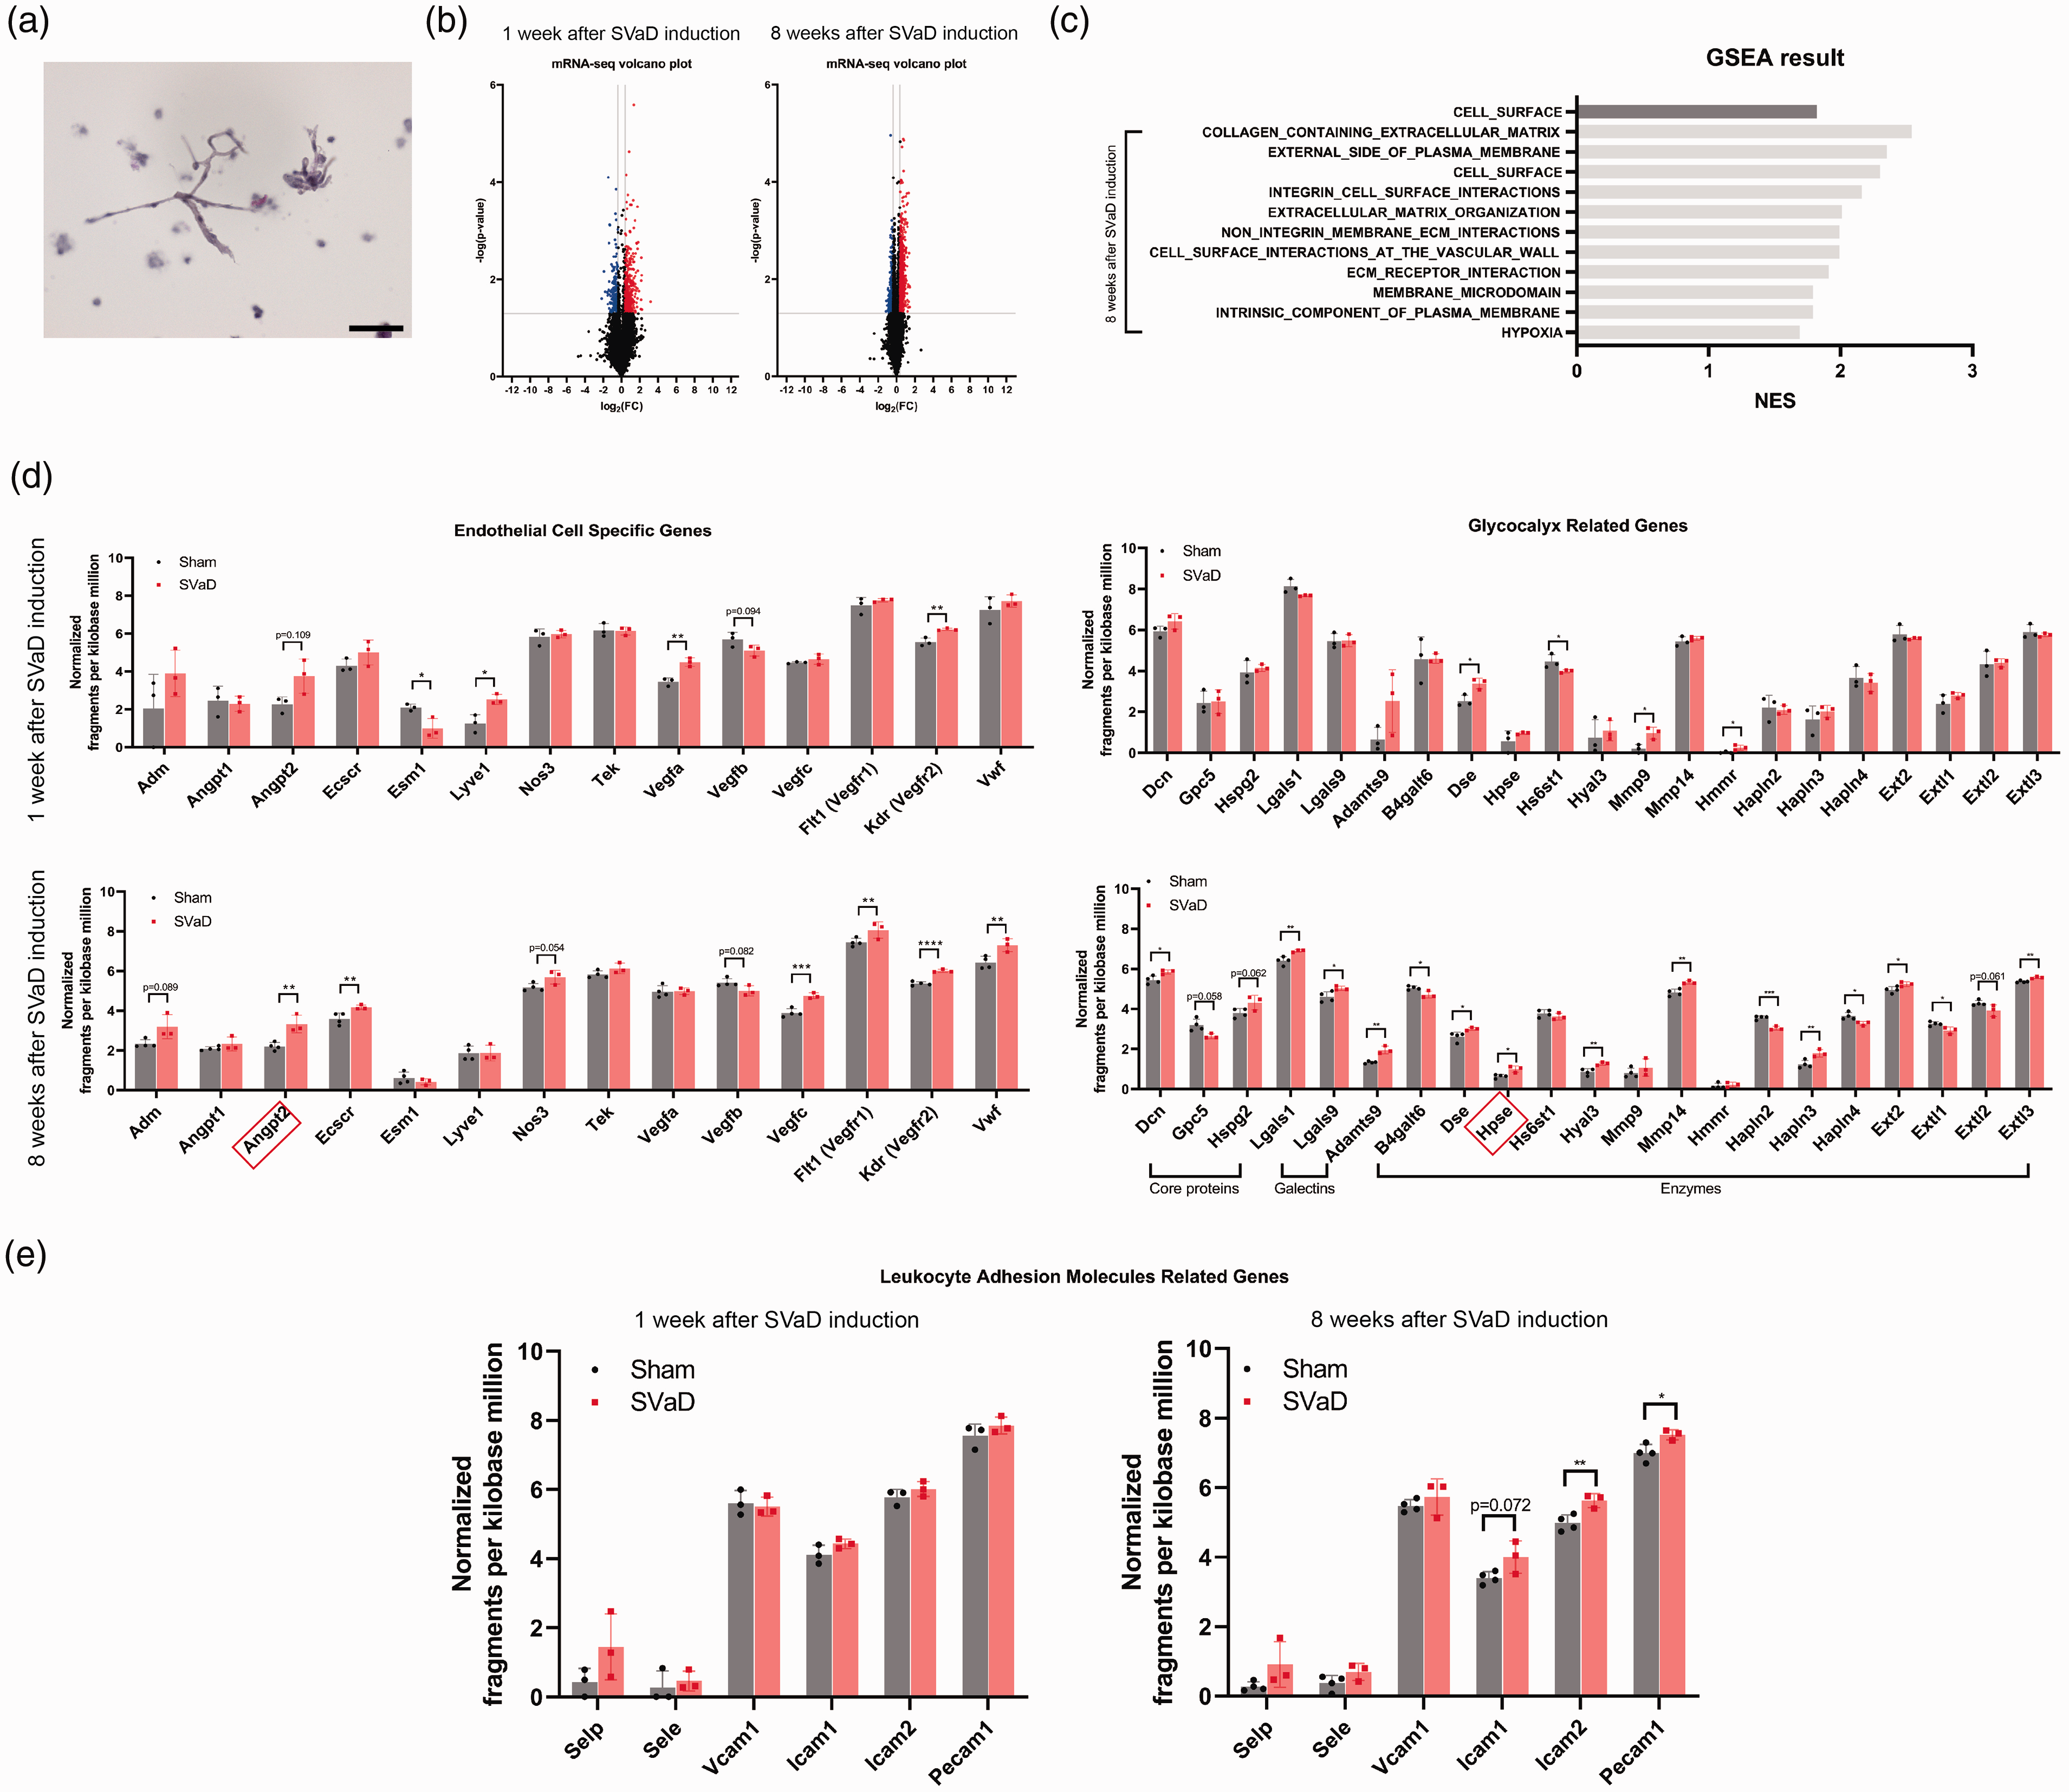
Glycocalyx-related gene expression is modified in subcortical vascular dementia (SVaD). (a) Isolated capillaries from the cerebral cortex are collected from both groups. RNA is isolated and sequenced. (b) At different time points, different mRNA expression patterns between sham and SVaD mice are observed (N = 3 for each group at 1 week after SVaD induction, N = 4 for sham, N = 3 for SVaD model at 8 weeks after SVaD induction). (c) Changes in gene-enriched profile are detected with gene set enrichment analysis. The ECM-related biological processes are changed. (d) The endothelial cell and glycocalyx-related gene expression changes are shown. Relative expressions are shown. Upregulated and downregulated genes are marked red and blue, respectively. (e) Leukocyte adhesion molecule gene expression is shown. Two mice are pooled for one sample of cortical capillaries. The unpaired t-test is used (*: p < 0.05, **: p < 0.01, ***: p < 0.001, ****: p < 0.0001). Scale bar: 50 μm.
Discussion
We investigated longitudinal alterations in microcirculation with the perspective of capillary stalling in a SVaD model using OCTA and TPM. A high spatiotemporal angiogram revealed capillary blood flow stalled in some capillary segments. Notably, a smaller extent of cEG was observed in stalled capillary segments. We found that 38.4% of stalled capillary segments were vulnerable to stalling, defined as re-stalled capillary segments. Capillary stalling was increased after cEG degradation. The underlying cause of increased capillary stalling was increased leukocyte plugging. Besides, cEG degradation increased the period of capillary stalling by leukocyte plugging. Capillary stalling more than doubled in the SVaD mouse model. The same portion of re-stalled capillary segments among stalled capillary segments was observed in both sham and SVaD mice. These re-stalled capillary segments in SVaD were prone to disappear after 8 weeks. Pathological outcomes, gliosis, and BBB leakage were correlated with the severity of capillary stalling. Additionally, we observed decreased cEG and modified cEG-related gene expressions in SVaD capillaries.
In accordance with previous reports, we found that certain capillary segments preferentially stalled.3,4 We conducted longitudinal in vivo imaging with OCTA. Approximately 40% of stalled capillary segments were stalled more than twice during 9 weeks of imaging sessions, both in sham and SVaD mice. It is unclear why capillary stalling is prevalent in certain capillary segments. Interestingly, capillary length and tortuosity are not associated with the incidence of capillary stalling in normal physiology. 3 Importantly, a smaller quantity of cEG was found in stalled capillary segments and it may support the role of the cEG as a capillary stalling regulator. Circulating components of blood, such as RBCs, platelets, and leukocytes, may cause capillary stalling. In this regard, the EG in other organs is known to regulate immune cell and endothelial cell interaction.11,51–53 As expected, cEG degradation with enzyme treatment induced an increase in the number and period of capillary stalling by leukocyte plugging. Several hypotheses were proposed to explain how EG regulates the interaction between leukocyte and endothelial cell. 52 First, cEG may prevent unintended interaction by covering leukocyte adhesion molecules (LAM). The cEG in the capillaries has sufficient thickness to cover LAM. 42 Furthermore, the negatively charged glycocalyx of endothelial cells and neutrophils repulse each other, which restricts their interaction. 11 Additionally, cEG may regulate leukocyte interaction by modulating chemokine binding to heparan sulfate.11,54 Heparan sulfate regulates leukocyte interaction in other organs. Inactivation of uronyl-2-O-sulfotransferase increased neutrophil rolling in cremaster muscle and interleukin-8 binding in lung endothelial cells. 55 Accordingly, we speculate that the presence of a small quantity of cEG in the stalled capillary is not accidental. Additionally, slow RBC speed and plasma velocity in stalling susceptible capillaries may affect the quantity of cEG.3,53,56,57
Using D-OCT, we noticed that blood flow in the pial arteries was reduced in the SVaD model. 38 Notably, the density of stalled segments began to increase with the induction of SVaD and became 2.61 times higher than that in the sham mice after 8 weeks. Furthermore, cEG was decreased in SVaD. Reduced blood flow supply, as well as reduced quantity of cEG, may increase capillary stalling in SVaD, as described above. cEG can be damaged by several causes, such as altered blood flow, reactive oxygen species (ROS), reactive nitrogen species (RNS), and secreted enzymes. 58 Fragmentation induced by ROS or RNS activates MMP, which cleaves the core protein syndecan. Additionally, inflammatory cytokine expression and recruitment of inflammatory cells can be induced by fragmented hyaluronan, such as low molecular weight hyaluronan oligosaccharides, which may enhance capillary stalling. 59 Additionally, among the re-stalled segments, the proportion of segments that disappeared at the final week of the imaging (W8) was approximately twice as large in the SVaD mice, suggesting that the induction of SVaD promotes a more rapid loss of cerebral microvasculature. Moreover, pathological features of SVaD were correlated with the severity of capillary stalling. Increased capillary stalling may lead to hypoxia that could affect gliosis and BBB leakage or vice versa.60–65 Furthermore, cognitive functions can be improved by suppressing capillary stalling in Alzheimer’s disease.5,66
Transcriptome analysis of isolated cortical capillaries revealed candidates involved in the cEG degradation mechanism in the SVaD. Eight weeks after SVaD induction, Vegfr2 and Angpt2 expression was increased. The inhibition of Vegfr2 signaling reduces capillary stalling; 4 however, the mechanism behind this is unknown. Angpt2 is an antagonist of the Tie2 signaling pathway. An in vitro study revealed that Angpt2 degrades EG by secretion of heparanase. 67 Moreover, an in vivo study showed that inhibition of Angpt2 by Angpt2-binding and Tie2 activating antibody increased EG in pulmonary microvessels. 68 To secrete heparanase in lysosomes, PKA and PKC signaling pathways are required. 50 These signaling pathways may be altered because of the modified expression of several genes involved (Supplementary Figure 13); however, further investigations are required. Additionally, the heparanase-encoding gene, Hpse, was also upregulated. Another EG degrading enzyme encoding gene, MMP14, was upregulated. Therefore, cEG may be degraded by these enzymes in response to the changed microenvironment of SVaD. Impaired cEG synthesis also contributes to decreased cEG in SVaD. Extl1 was downregulated. Exostosin-like glycosyltransferase1 is considered to be involved in heparan sulfate chain elongation. 69 Expression of hyaluronan and proteoglycan-like protein-encoding genes, Hapln2, Hapln3, and Hapln4, were modified. These proteins have been studied in the ECM but not in EG. Therefore, further studies on EG synthesis and modification are required in cerebral capillaries. Overall, cEG degradation in SVaD resulted from impaired cEG synthesis and increased cEG degradation by enzymes.
The results of the study should be viewed considering some limitations. OCTA and TPM imaging were performed in the cortex of mice because of the relatively shallow imaging depth of these modalities. Additionally, we did not assess the relationship between cEG and capillary stalling by vessel branch order. Further studies using a faster TPM system may provide some insight into the nature of cEG. Notably, the effect of isoflurane should also be considered as it may induce capillary stalling.3,70 Considering the limited acquisition time, the presence of undetected portions of stalled segments is possible. Furthermore, capillary segments that stalled for a shorter time than the temporal resolution of the imaging modality (7 seconds) would also have been missed. Despite the likelihood of underestimating the number of stalled segments, our results clearly show the rapid progression of capillary stalling in SVaD. Increased capillary stalling by leukocyte plugging in SVaD could be explained not only by damaged cEG but also by reduced cerebral blood flow or increased LAM. Furthermore, the decreased extent of cEG in SVaD mice is also due to the increased number of stalled segments; however, it is considered to be decreased in most capillary segments. Additionally, involvement of the cEG in the SVaD pathogenesis should be confirmed with cEG-restoring drugs in the future.
In conclusion, cEG plays a critical role in the mechanism of capillary stalling by leukocyte plugging. Reduced cEG quantity may lead to increased capillary stalling in SVaD. Changes in cEG-related gene expression indicate that Angpt2 and heparanase secretion participate in the destruction mechanism of cEG in SVaD. We expect that this study will lead to a deeper understanding of the alterations in microcirculation in SVaD.
Supplemental Material
sj-pdf-1-jcb-10.1177_0271678X221076568 - Supplemental material for Increased capillary stalling is associated with endothelial glycocalyx loss in subcortical vascular dementia
Supplemental material, sj-pdf-1-jcb-10.1177_0271678X221076568 for Increased capillary stalling is associated with endothelial glycocalyx loss in subcortical vascular dementia by Jin-Hui Yoon, Paul Shin, Jongyoon Joo, Gaon S Kim, Wang-Yuhl Oh and Yong Jeong in Journal of Cerebral Blood Flow & Metabolism
Supplemental Material
sj-pdf-2-jcb-10.1177_0271678X221076568 - Supplemental material for Increased capillary stalling is associated with endothelial glycocalyx loss in subcortical vascular dementia
Supplemental material, sj-pdf-2-jcb-10.1177_0271678X221076568 for Increased capillary stalling is associated with endothelial glycocalyx loss in subcortical vascular dementia by Jin-Hui Yoon, Paul Shin, Jongyoon Joo, Gaon S Kim, Wang-Yuhl Oh and Yong Jeong in Journal of Cerebral Blood Flow & Metabolism
Supplemental Material
sj-pdf-3-jcb-10.1177_0271678X221076568 - Supplemental material for Increased capillary stalling is associated with endothelial glycocalyx loss in subcortical vascular dementia
Supplemental material, sj-pdf-3-jcb-10.1177_0271678X221076568 for Increased capillary stalling is associated with endothelial glycocalyx loss in subcortical vascular dementia by Jin-Hui Yoon, Paul Shin, Jongyoon Joo, Gaon S Kim, Wang-Yuhl Oh and Yong Jeong in Journal of Cerebral Blood Flow & Metabolism
Supplemental Material
sj-pdf-4-jcb-10.1177_0271678X221076568 - Supplemental material for Increased capillary stalling is associated with endothelial glycocalyx loss in subcortical vascular dementia
Supplemental material, sj-pdf-4-jcb-10.1177_0271678X221076568 for Increased capillary stalling is associated with endothelial glycocalyx loss in subcortical vascular dementia by Jin-Hui Yoon, Paul Shin, Jongyoon Joo, Gaon S Kim, Wang-Yuhl Oh and Yong Jeong in Journal of Cerebral Blood Flow & Metabolism
Supplemental Material
sj-pdf-5-jcb-10.1177_0271678X221076568 - Supplemental material for Increased capillary stalling is associated with endothelial glycocalyx loss in subcortical vascular dementia
Supplemental material, sj-pdf-5-jcb-10.1177_0271678X221076568 for Increased capillary stalling is associated with endothelial glycocalyx loss in subcortical vascular dementia by Jin-Hui Yoon, Paul Shin, Jongyoon Joo, Gaon S Kim, Wang-Yuhl Oh and Yong Jeong in Journal of Cerebral Blood Flow & Metabolism
Supplemental Material
sj-pdf-6-jcb-10.1177_0271678X221076568 - Supplemental material for Increased capillary stalling is associated with endothelial glycocalyx loss in subcortical vascular dementia
Supplemental material, sj-pdf-6-jcb-10.1177_0271678X221076568 for Increased capillary stalling is associated with endothelial glycocalyx loss in subcortical vascular dementia by Jin-Hui Yoon, Paul Shin, Jongyoon Joo, Gaon S Kim, Wang-Yuhl Oh and Yong Jeong in Journal of Cerebral Blood Flow & Metabolism
Footnotes
Funding
The author(s) disclosed receipt of the following financial support for the research, authorship, and/or publication of this article: This research was supported by the Brain Research Program through the National Research Foundation of Korea and funded by the Ministry of Science and ICT (2016M3C7A1913844) (W-Y. O. and Y. J.).
Declaration of conflicting interests
The author(s) declared no potential conflicts of interest with respect to the research, authorship, and/or publication of this article.
Authors’ contributions
J.-H.Y. and P.S. designed the study; J.-H. Y., P.S., J.J, and G.S.K. performed the experiments and analyzed the data; W.-Y.O and Y.J. supervised the study; J.-H.Y., P.S., W.-Y.O, and Y.J. wrote the paper.
Supplemental material
Supplemental material for this article is available online.
References
Supplementary Material
Please find the following supplemental material available below.
For Open Access articles published under a Creative Commons License, all supplemental material carries the same license as the article it is associated with.
For non-Open Access articles published, all supplemental material carries a non-exclusive license, and permission requests for re-use of supplemental material or any part of supplemental material shall be sent directly to the copyright owner as specified in the copyright notice associated with the article.