
Abstract
Cilia dysfunction in autosomal-dominant polycystic kidney disease (ADPKD) may impair the integrity of glymphatic system and be implicated in the progression of cerebral small vessel disease (SVD), although the link between the two diseases has not been investigated. We evaluated the association of ADPKD pathology with SVD pattern and severity. Overall, 304 individuals in an ADPKD (chronic kidney disease stage ≤4 and age ≥50 years) cohort and their age, sex, and estimated glomerular filtration rate (eGFR)-matched controls were retrospectively included. ADPKD severity was classified into 1 A-B, 1 C, and 1 D-E, according to age and height-adjusted total kidney volume. SVD parameters included white-matter hyperintensity (WMH) severity scale, enlarged perivascular space (ePVS) score, and degree of lacunes or cerebral microbleeds (CMBs). After adjustments for age, sex, eGFR, and cerebrovascular risk factor parameters, ADPKD was associated with higher ePVS scores (P < 0.001), but not with the WMH severity or degree of lacunes or CMBs. In the ADPKD subgroup, higher ADPKD severity class was associated with higher ePVS scores (P < 0.001), WMH severity (P = 0.003), and degree of lacunes (P = 0.002). ADPKD associated cilia dysfunction may induce chronic cerebral glymphatic system dysfunction, which may contribute to the specific progression of ePVS compared with other SVD markers.
Keywords
Introduction
Autosomal dominant polycystic kidney disease (ADPKD) is a prevalent genetic multisystem disorder caused by mutations in PKD1 and PKD2 genes, which encode polycystin-1/-2 (PC1/PC2) proteins, respectively. The central nervous system (CNS) manifestations of ADPKD include increased frequencies of intracranial aneurysm and dolichoectasia.1,2 However, several pathophysiological characteristics of ADPKD suggest that this disease may also be associated with the pathogenesis of cerebral small vessel disease (SVD). First, PC1 and PC2 deficiencies in the vascular endothelium are associated with impaired vessel relaxation and secondary activation of the renin-angiotensin-aldosterone system, which are the main mechanisms of aging-related progression of SVD.3–5 Second, as PC1 and PC2 proteins are strongly expressed in motile cilia along the ependymal cell lines and are a major mediator of cerebrospinal fluid (CSF) circulation, ADPKD pathology may also provoke disturbances in CSF circulation.6–10 Third, PC1 and PC2 proteins may also be involved in maintaining the blood-brain barrier (BBB) integrity and glymphatic system function.11–13 PC1 and PC2 are expressed in astrocytes and vascular endothelium, 9 which constitute BBB and perivascular space, and the PC1/PC2 polycystin complex senses chemical and mechanical stimuli and maintains the structural and functional integrities of endothelial cells and astrocytes.8,10,14 As cerebral waste clearance via the glymphatic system relies on the convective movement of perivascular CSF into parenchymal interstitial fluid (ISF) space and adequate drainage into the perivenular space,6,12,15 ADPKD can mediate the development of SVD through mechanisms involving the glymphatic system and microvascular function. However, the link between the two diseases has not been fully investigated.
Each of the major magnetic resonance image (MRI) parameters of SVD, such as white matter hyperintensity (WMH), enlarged perivascular space (ePVS), cerebral microbleeds (CMBs), and lacunar infarction, may reflect different underlying pathomechanisms of SVD.5,16 Especially, ePVS may be a particularly sensitive marker for the glymphatic system dysfunction, as the dilated perivascular space reflects flow stagnation owing to the chronically impaired exchange between CSF and ISF or more downstream flow of the glymphatic system.16,17 In our study, we hypothesized that ADPKD pathology may contribute to a distinct pattern of SVD and evaluated the SVD profile in a cohort of patients with ADPKD, and compared it with the age and sex-matched control subjects.
Materials and methods
Study participants
This study was a retrospective cohort cross-sectional study of patients with ADPKD. From all consecutive patients enrolled in a tertiary hospital cohort with ADPKD, patients aged ≥50 years, who underwent brain MRI/MR angiography (MRA) evaluations from January 2007 to August 2020, were initially included. Among the initially included 385 patients, the ADPKD group was defined according to the following criteria: (1) no significant (≥50%) stenosis in the cerebral arteries, (2) without a documented history of chronic disease involving the CNS such as stroke other than an old (≥90 days) lacunar infarction or dementia, (3) with kidney computed tomography (CT) evaluations, (4) with kidney CT findings compatible with the criteria for typical ADPKD, 18 and (5) without a severe kidney dysfunction (chronic kidney disease [CKD] stage 1–3, estimated glomerular filtration rate [eGFR] ≥30 mg/dL). The criteria of 50 years of age was decided based on published reports that observed a progression of SVD initiating from the age of 50 years onward, as well as our previous studies regarding WMH and other SVD parameters.19–23 According to this criteria, 13 patients with significant stenosis in the internal carotid arteries (ICAs) or middle cerebral arteries (MCAs), 11 with a documented chronic disease involving the CNS, nine without kidney CT evaluation or with an atypical PKD feature in the kidney CT, and 25 with end-stage renal disease were sequentially excluded, and the remaining 327 patients were included in the ADPKD group. The indications for MRI/MRA evaluations were for the surveillance of concomitant intracranial aneurysm or atherosclerotic brain lesion in every patient.
The control group was selected from the Seoul National University Hospital (SNUH) healthcare program database, which included subjects whose indications for MRI/MRA and laboratory evaluations were from a regular health check-up program. The same inclusion criteria were applied except for the availability of a kidney CT evaluation. From the initially included 5,248 patients, propensity score matching for age, sex, and eGFR was performed using a logistic regression model. The ADPKD group was matched with controls in a 1:1 ratio using a greedy nearest neighbor method. The quality and balance of the matching were evaluated by comparing the standardized mean difference and ratio of variances between the propensity scores of the two groups. The sample size of the study was not calculated due to the retrospective cohort-based design of the current study. As a result, 23 patients in the ADPKD group were unmatched to the controls, and the remaining 304 patients matched with 304 controls were included in the analysis (Figure 1). The design of this study was approved by the SNUH institutional review board (IRB no. 1804-054-936) and adheres to the STROBE guideline for a retrospective cohort study and Helsinki Declaration of 1975 (and as revised in 2013). Informed consent was waived by the IRB, as this study did not intervene with the evaluation or treatment process of the patients, and the patients were anonymized during the study process.
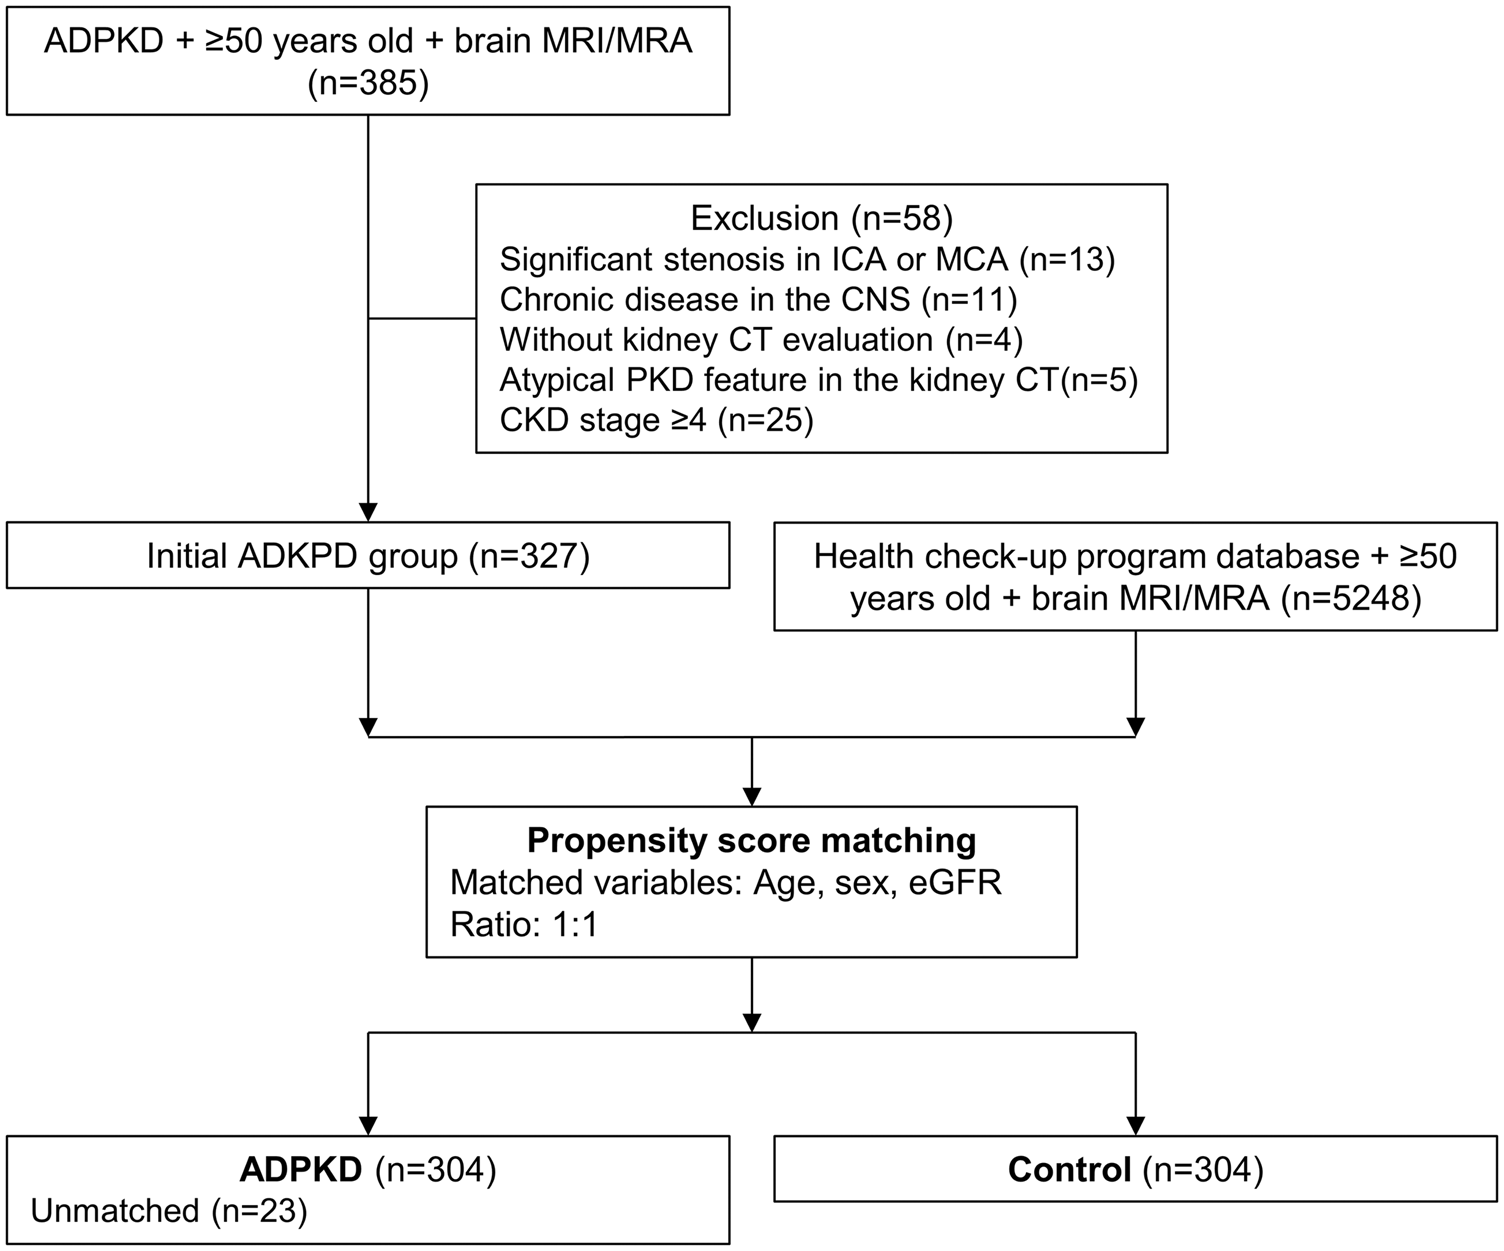
A flow chart illustrating the study participants.
Clinical and laboratory data
Clinical profiles, including demographics and presence of hypertension, diabetes mellitus, and hyperlipidemia, were obtained from patients’ medical records. Mean blood pressure (MBP, mmHg), pulse pressure (PP, mmHg), eGFR (mg/dL) measured using the CKD Epidemiology Collaboration (CKD-EPI) equation, total cholesterol level (mg/dL), LDL cholesterol level (mg/dL), and hemoglobin A1c (HbA1c) (percent) measured within three months from the MRI evaluation were obtained.21,23–26
Kidney CT-based classification of ADPKD
Each kidney volume was measured using the ellipsoid equation and summated to obtain the total kidney volume (TKV, mL). 18 Using TKV and patient’s height and age during CT evaluation, height adjusted TKV (HtTKV, mL/m) was measured using an online calculator provided by the Mayo Foundation and Medical Education and Research (mayo.edu/research/documents/pkd-center-adpkd-classification/doc-20094754), and was classified into five subgroups of severity (1 A–1E) according to age and HtTKV. 18
Magnetic resonance imaging analysis
MRI was performed using 1.5 T or 3.0 T units with the protocols that included T1-weighted, T2-weighted, T2-fluid-attenuated inversion recovery (FLAIR), gradient echo/susceptibility-weighted images (GRE/SWI), and MRA. T1/T2-weighted and FLAIR images were obtained with the parameters as follows: slice number = 24–32, slice thickness/gap = 4.0–5.0/0.0–1.0 mm, field-of-view = 220–256 × 220–256 mm, and matrix = 320–352 × 192–256. Repetition time/echo time was 466–2,822/7.8–26 ms for T1-weighted images and 9,000–9,900/97–163 ms for T2-weighted and FLAIR images.
WMH severity was semi-quantitatively measured according to the Age-Related White Matter Changes (ARWMC) scale, which showed excellent reliability and high correlation with WMH volumes. 27 ARWMC scores WMH severities in the frontal, parieto-occipital, temporal, basal ganglia (BG), and infratentorial areas with scores ranging from 0 to 3 for each side of the brain, with a total score range of 0–30. 28 Fazekas scale for WMH severity was also measured in periventricular and deep white matter regions (score range 0–3 for each region and 0–6 for the total score). 29 ePVS was defined as ovoid or linear-shaped small and sharply bordered lesions with T2-hyperintensity and T1-hypointensity. ePVS score was rated at the BG and centrum semiovale (CS) regions using the Wardlaw scale with a score range of 0–4 (0 for no, 1 for 1–10, 2 for 11–20, 3 for 21–40, and 4 for >40 ePVS) for each region and 0–8 for the total score. 30 CMB was defined as 2–10 millimeter punctate hypointensity in GRE/SWI images and evaluated separately in the lobar, deep, and infratentorial areas. Lacune was demonstrated as a hyperintense lesion with central hypo-intensity in FLAIR images. 5 The degree of CMBs and lacunes were categorized as none, one, and multiple (≥2). Two neurologists (WJL, nine years of experience, and KHJ, 20 years of experience) reviewed the images blinded to the clinical data, and consensus was achieved by joint review for the cases with discrepant scores.
Statistical analyses
SPSS 25.0 (SPSS Inc., Chicago, IL, USA) was used for all statistical analyses and propensity score matching. Spearman’s Rho was used for evaluating correlations between continuous variables and SVD scores. Paired t-test, chi-square test, and analysis of variance were used for comparing the parameters among the groups. Shapiro-Wilk test was performed to test the normal distribution of variables. Mann-whitney test, Fisher’s exact test, and Kruskal-Wallis test were used in cases that a variable is not normally distributed or a group of comparison contains less than 10 subjects. Age, sex, eGFR, MBP, PP, and variables with P values <0.15 in univariate analyses were included in regression analyses. However, total cholesterol level, the presence of hypertension, and the presence of diabetes mellitus were discarded from the multivariate analyses, due to the high co-linearity with the other parameters included, such as LDL cholesterol, MBP, and HbA2c respectively, and the redundancy of variables.
Linear regression analyses were performed to quantitatively evaluate the association of ADPKD and its severity class with the severity of WMH measured using ARWMC scores. WMC scores were log-transformed to obtain a normal distribution, and regression was performed separately for the total, lobar, and deep (BG and infratentorial) areas. Multi-collinearity between variables was estimated using the variance inflation factor (VIF). A scatterplot of standardized predicted values and standardized residuals was used to check for the linearity of the regression model. To examine the assumption for the normal distribution, a histogram of the standardized residuals and a normal probability (P-P) plot of the standardized residuals were drawn. Ordinal regression analyses were performed for the semi-quantitative evaluation of the association between ADPKD and its severity class with ePVS scores, for total, CS, and BG regions separately, and the degrees of CMBs and lacunes. To investigate the association between ADPKD severity and SVD parameters, all regression analyses were repeated for the ADPKD group, including the trichotomized ADPKD severity class (1 A–B, 1 C, and 1 D–E). The standardized coefficient for linear regression analyses and odds ratio for ordinal logistic regression analysis, with their 95-percentile confidence interval, were used to determine a statistically significant association. For all analyses, a P-value of <0.05 was considered statistically significant.
Data availability
The datasets generated and/or analyzed during the study are available from the corresponding author upon request.
Results
Overall, 608 patients (304 [50.0%] patients in the ADPKD group and 304 [50.0%] in the control group, 292 [48.0%] men, mean age of 63.3 ± 8.4 years [range, 50–88 years]) were included in this study. Measurements of balance of the propensity score matching indicated that the ADPKD and control groups were adequately matched, with standardized mean differences of the propensity scores between groups of 0.00 (good balance <0.25) and a ratio of variances of propensity scores of 0.97 (good balance between 0.5–2, Supplemental Table 1 and Supplemental Figure 1). In the ADPKD group, the mean HtTKV was 1662.0 ± 1,343.5 mL. According to the HtTKV and age, 44 (14.5%) patients were classified as group 1 A, 63 (20.7%) as group 1B, 100 (32.9%) as group 1 C, 78 (25.7%) as group 1 D, and 19 (6.3%) as group 1E. The median interval of the obtained laboratory data was 0.3 days (range, −16 to 14 days) from the MRI evaluation.
Compared with the control, the ADPKD group exhibited a higher frequency of hypertension, lower frequency of diabetes mellitus, and lower levels of MBP, total cholesterol, LDL cholesterol, and HbA1c. For the SVD parameters, the ADPKD group was associated with higher ePVS scores for the total, CS, and BG areas (all, P < 0.001), and higher frequency of lacunes (P = 0.019, Table 1). However, WMH severity and the degrees of CMBs were comparable between the two groups.
Clinical, laboratory, and white matter hyperintensity profiles of the study population.
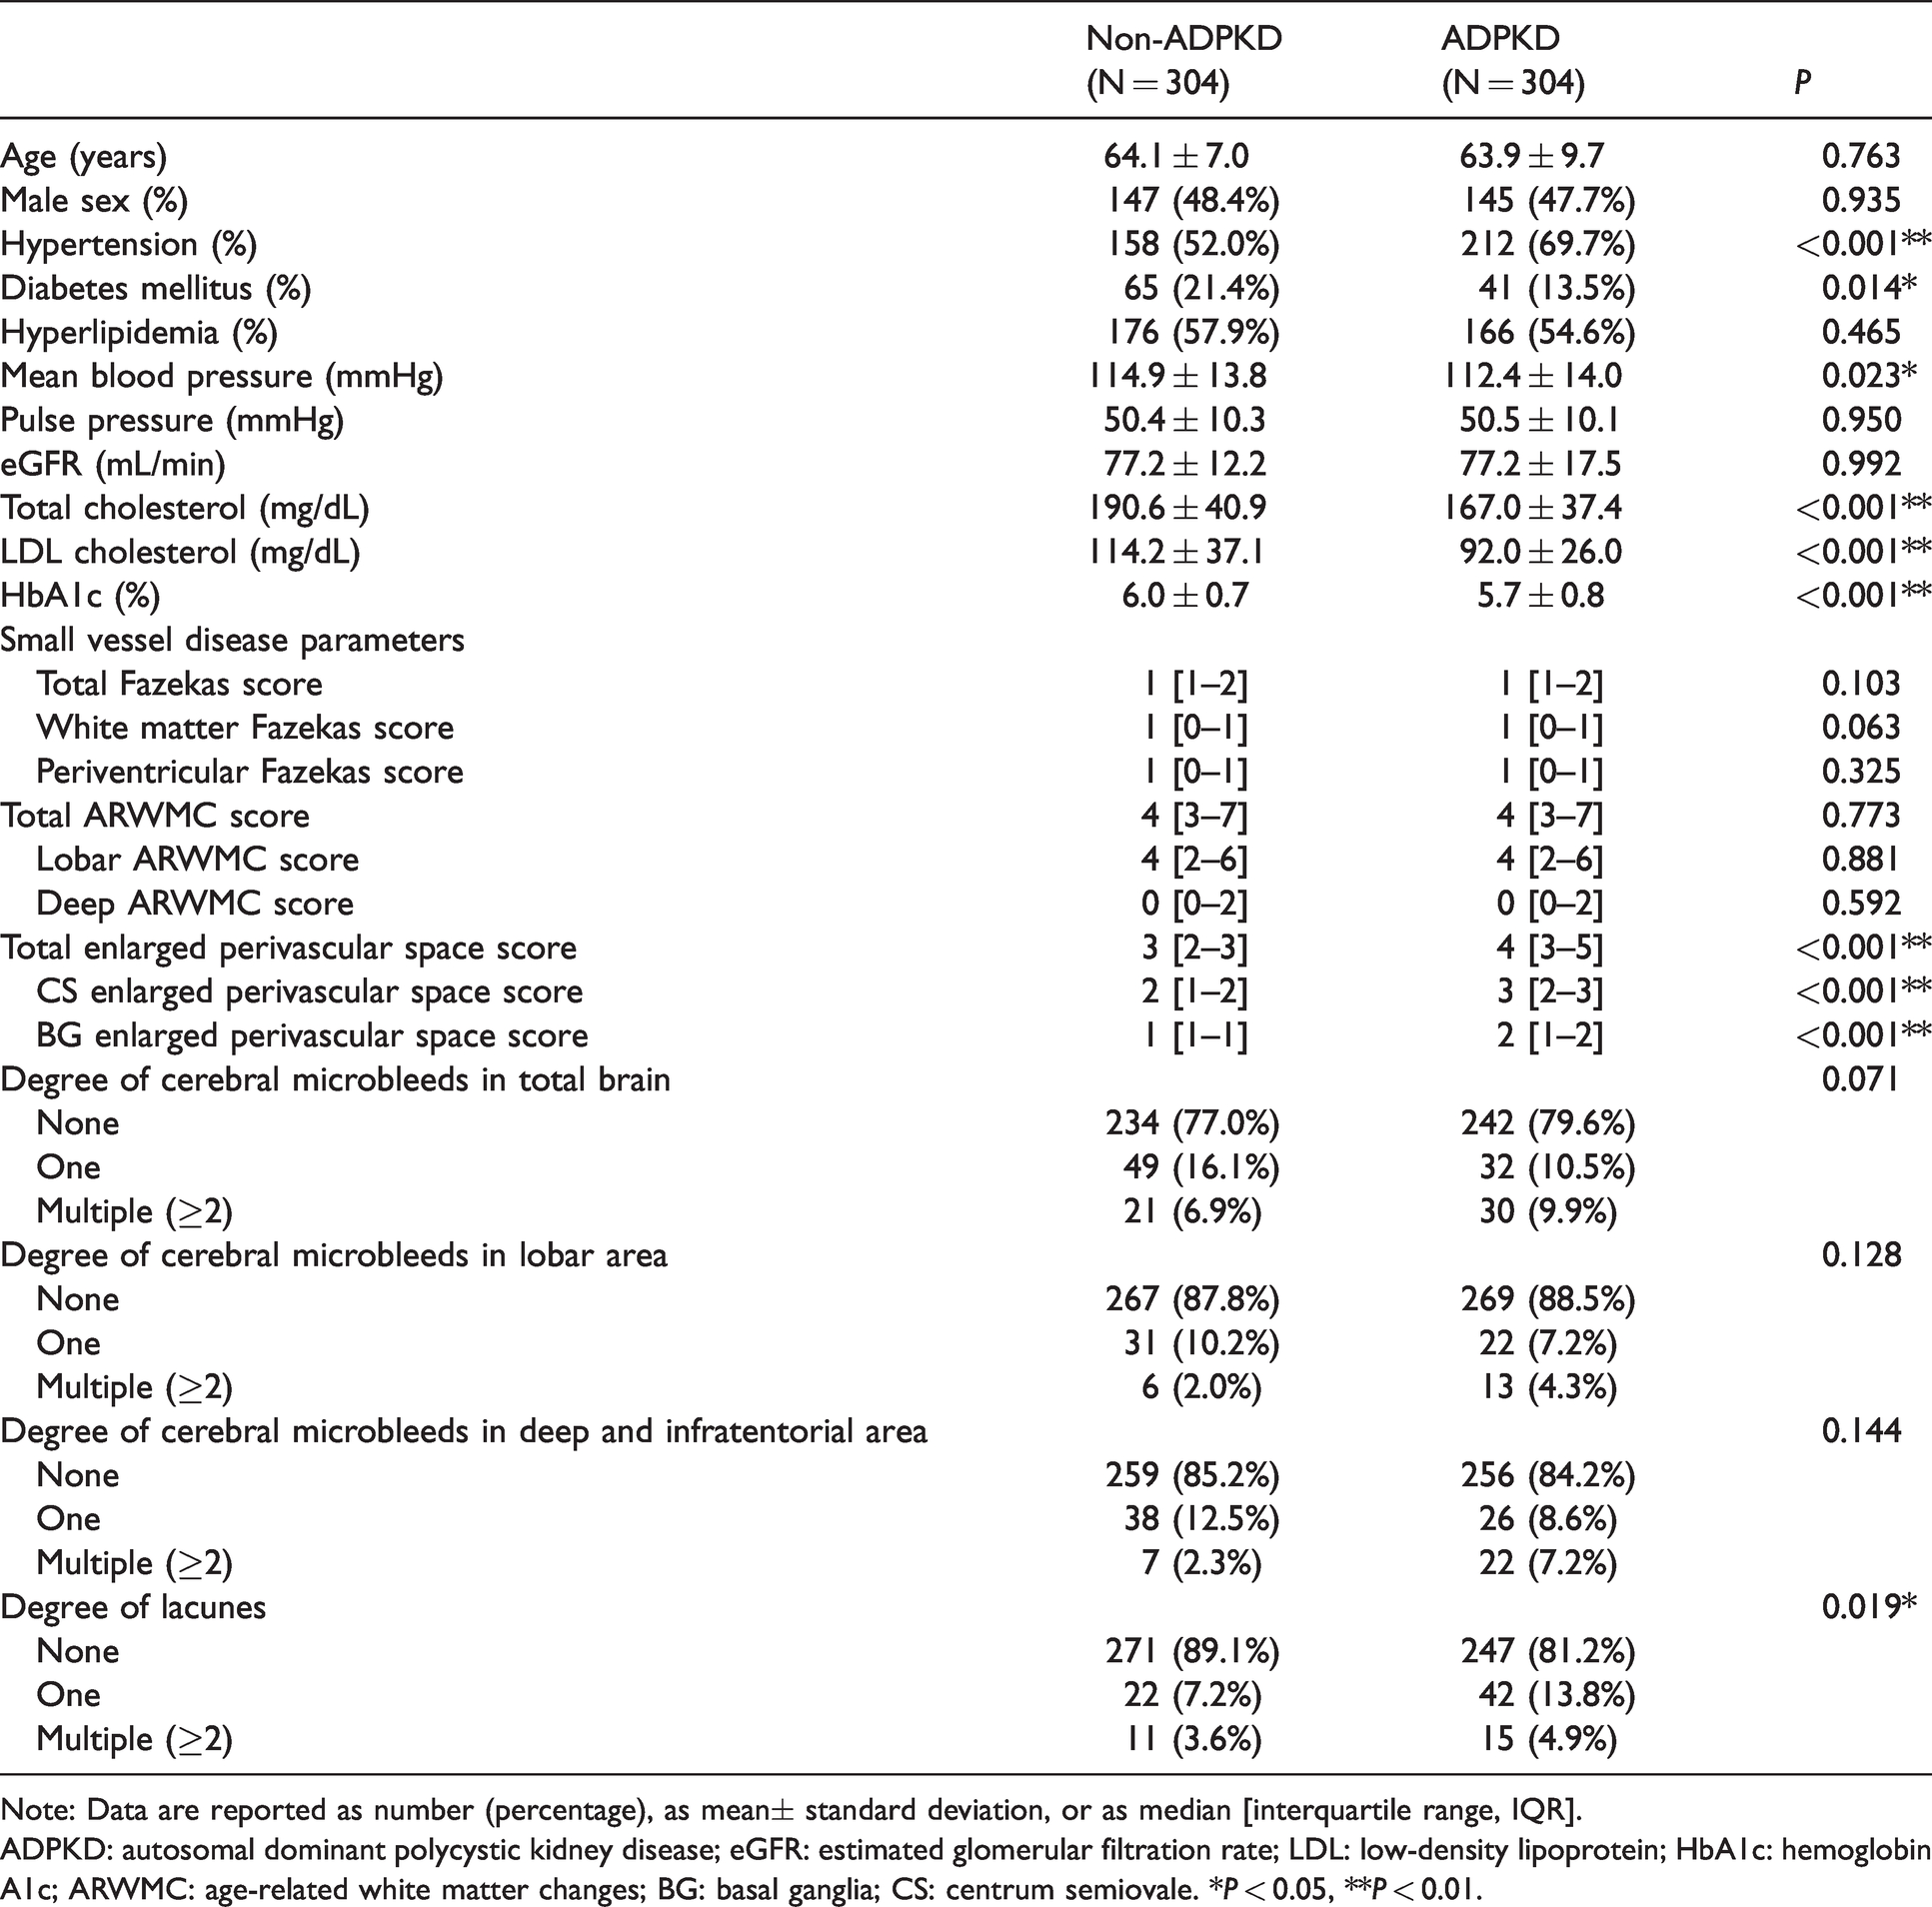
Note: Data are reported as number (percentage), as mean± standard deviation, or as median [interquartile range, IQR].
ADPKD: autosomal dominant polycystic kidney disease; eGFR: estimated glomerular filtration rate; LDL: low-density lipoprotein; HbA1c: hemoglobin A1c; ARWMC: age-related white matter changes; BG: basal ganglia; CS: centrum semiovale. *P < 0.05, **P < 0.01.
Among the ADPKD subgroups, the higher severity classes were associated with lower eGFR (P < 0.001), higher ARWMC scores for the total and lobar areas (P = 0.049 and P = 0.036, respectively), higher ePVS scores for the total, CS, and BG areas (P < 0.001, P = 0.002, and P = 0.025, respectively), and higher frequency of lacunes (P = 0.003, Supplemental Table 2).
Association of ADPKD with cerebral WMH severity
In the regression analysis for the WMH severity, the log-transformed ARWMC score was associated with age (B coefficient 0.029; 95% confidence interval [CI] 0.024–0.035; P < 0.001), eGFR (B − 0.004; 95% CI −0.007–−0.002; P = 0.001), and MBP (B 0.006; 95% CI 0.003–0.010; P = 0.001), but not with ADPKD (P = 0.143, Table 2 and Figure 2(a), Supplemental Tables 3 and 4 for univariate analyses). When ARWMC was stratified by its location, ADPKD still did not exhibit a significant association with log-transformed lobar or deep ARWMC scores (P = 0.215 and 0.368, respectively, Supplemental Table 5, Supplemental Tables 3 and 4 for univariate analyses).
Regression analyses for factors associated with white-matter hyperintensity severity, enlarged perivascular space scores, the presence of cerebral microbleeds, and the presence of lacunes.
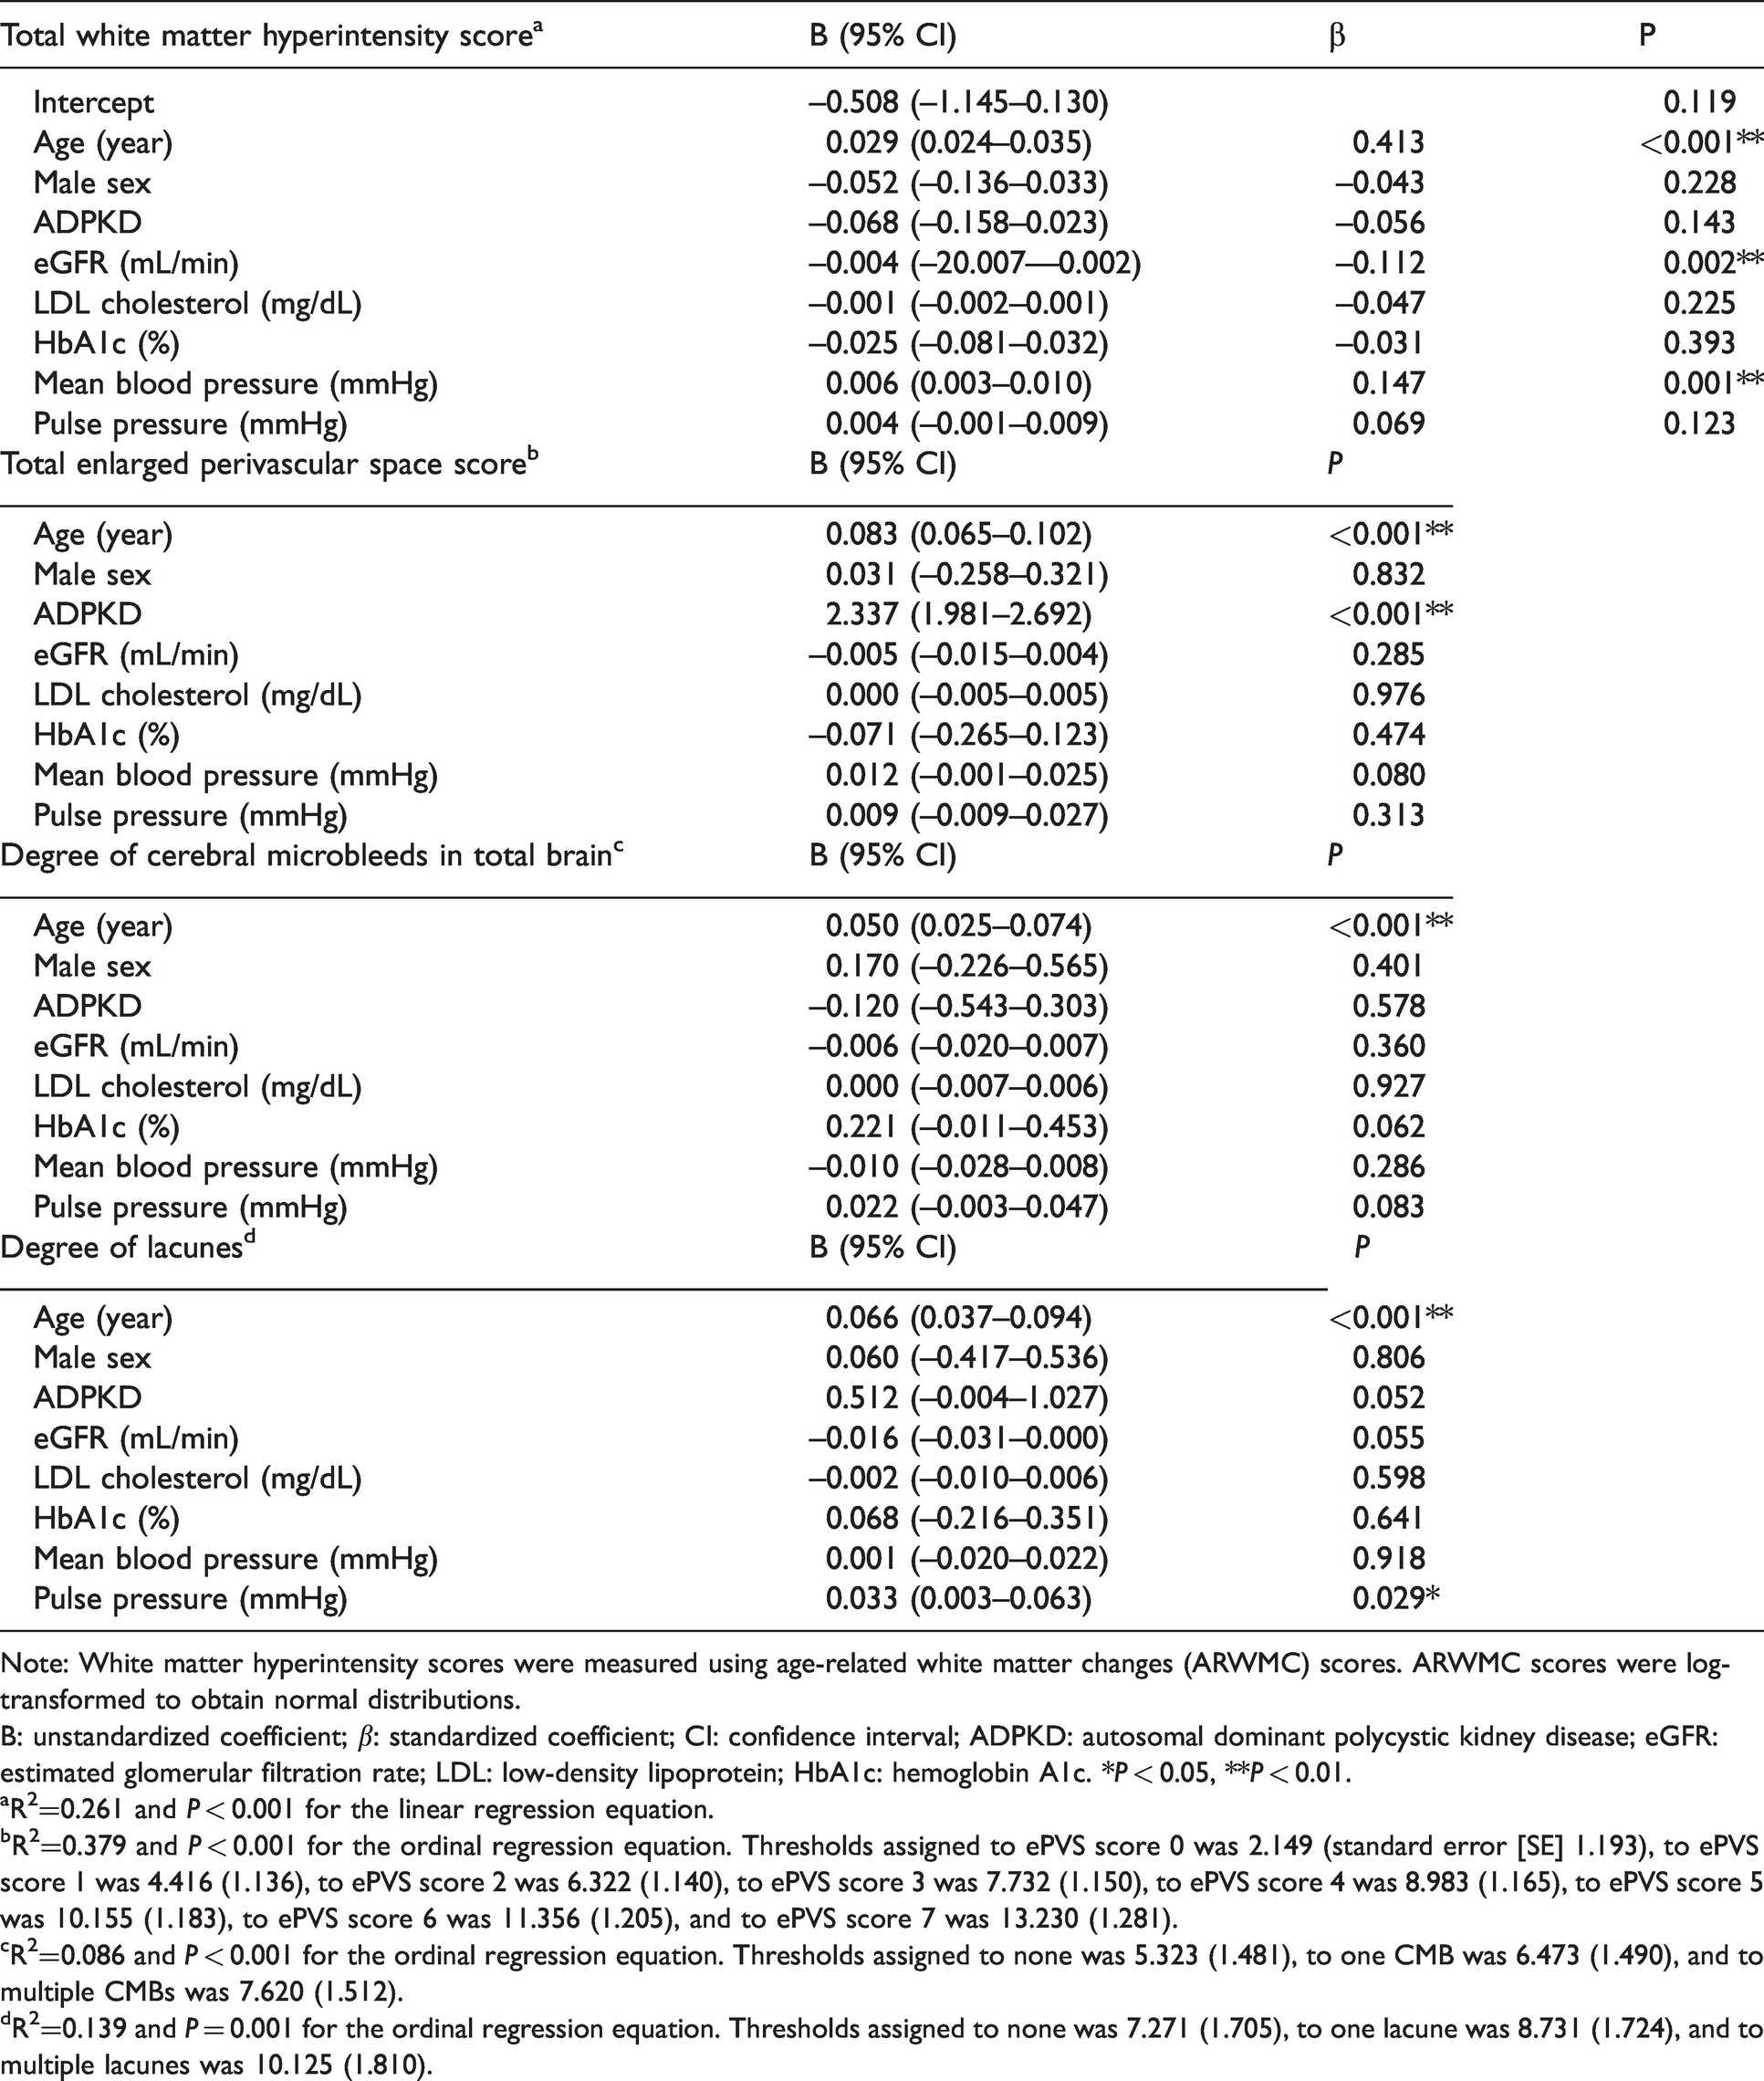
Note: White matter hyperintensity scores were measured using age-related white matter changes (ARWMC) scores. ARWMC scores were log-transformed to obtain normal distributions.
B: unstandardized coefficient; β: standardized coefficient; CI: confidence interval; ADPKD: autosomal dominant polycystic kidney disease; eGFR: estimated glomerular filtration rate; LDL: low-density lipoprotein; HbA1c: hemoglobin A1c. *P < 0.05, **P < 0.01.
aR2=0.261 and P < 0.001 for the linear regression equation.
bR2=0.379 and P < 0.001 for the ordinal regression equation. Thresholds assigned to ePVS score 0 was 2.149 (standard error [SE] 1.193), to ePVS score 1 was 4.416 (1.136), to ePVS score 2 was 6.322 (1.140), to ePVS score 3 was 7.732 (1.150), to ePVS score 4 was 8.983 (1.165), to ePVS score 5 was 10.155 (1.183), to ePVS score 6 was 11.356 (1.205), and to ePVS score 7 was 13.230 (1.281).
cR2=0.086 and P < 0.001 for the ordinal regression equation. Thresholds assigned to none was 5.323 (1.481), to one CMB was 6.473 (1.490), and to multiple CMBs was 7.620 (1.512).
dR2=0.139 and P = 0.001 for the ordinal regression equation. Thresholds assigned to none was 7.271 (1.705), to one lacune was 8.731 (1.724), and to multiple lacunes was 10.125 (1.810).
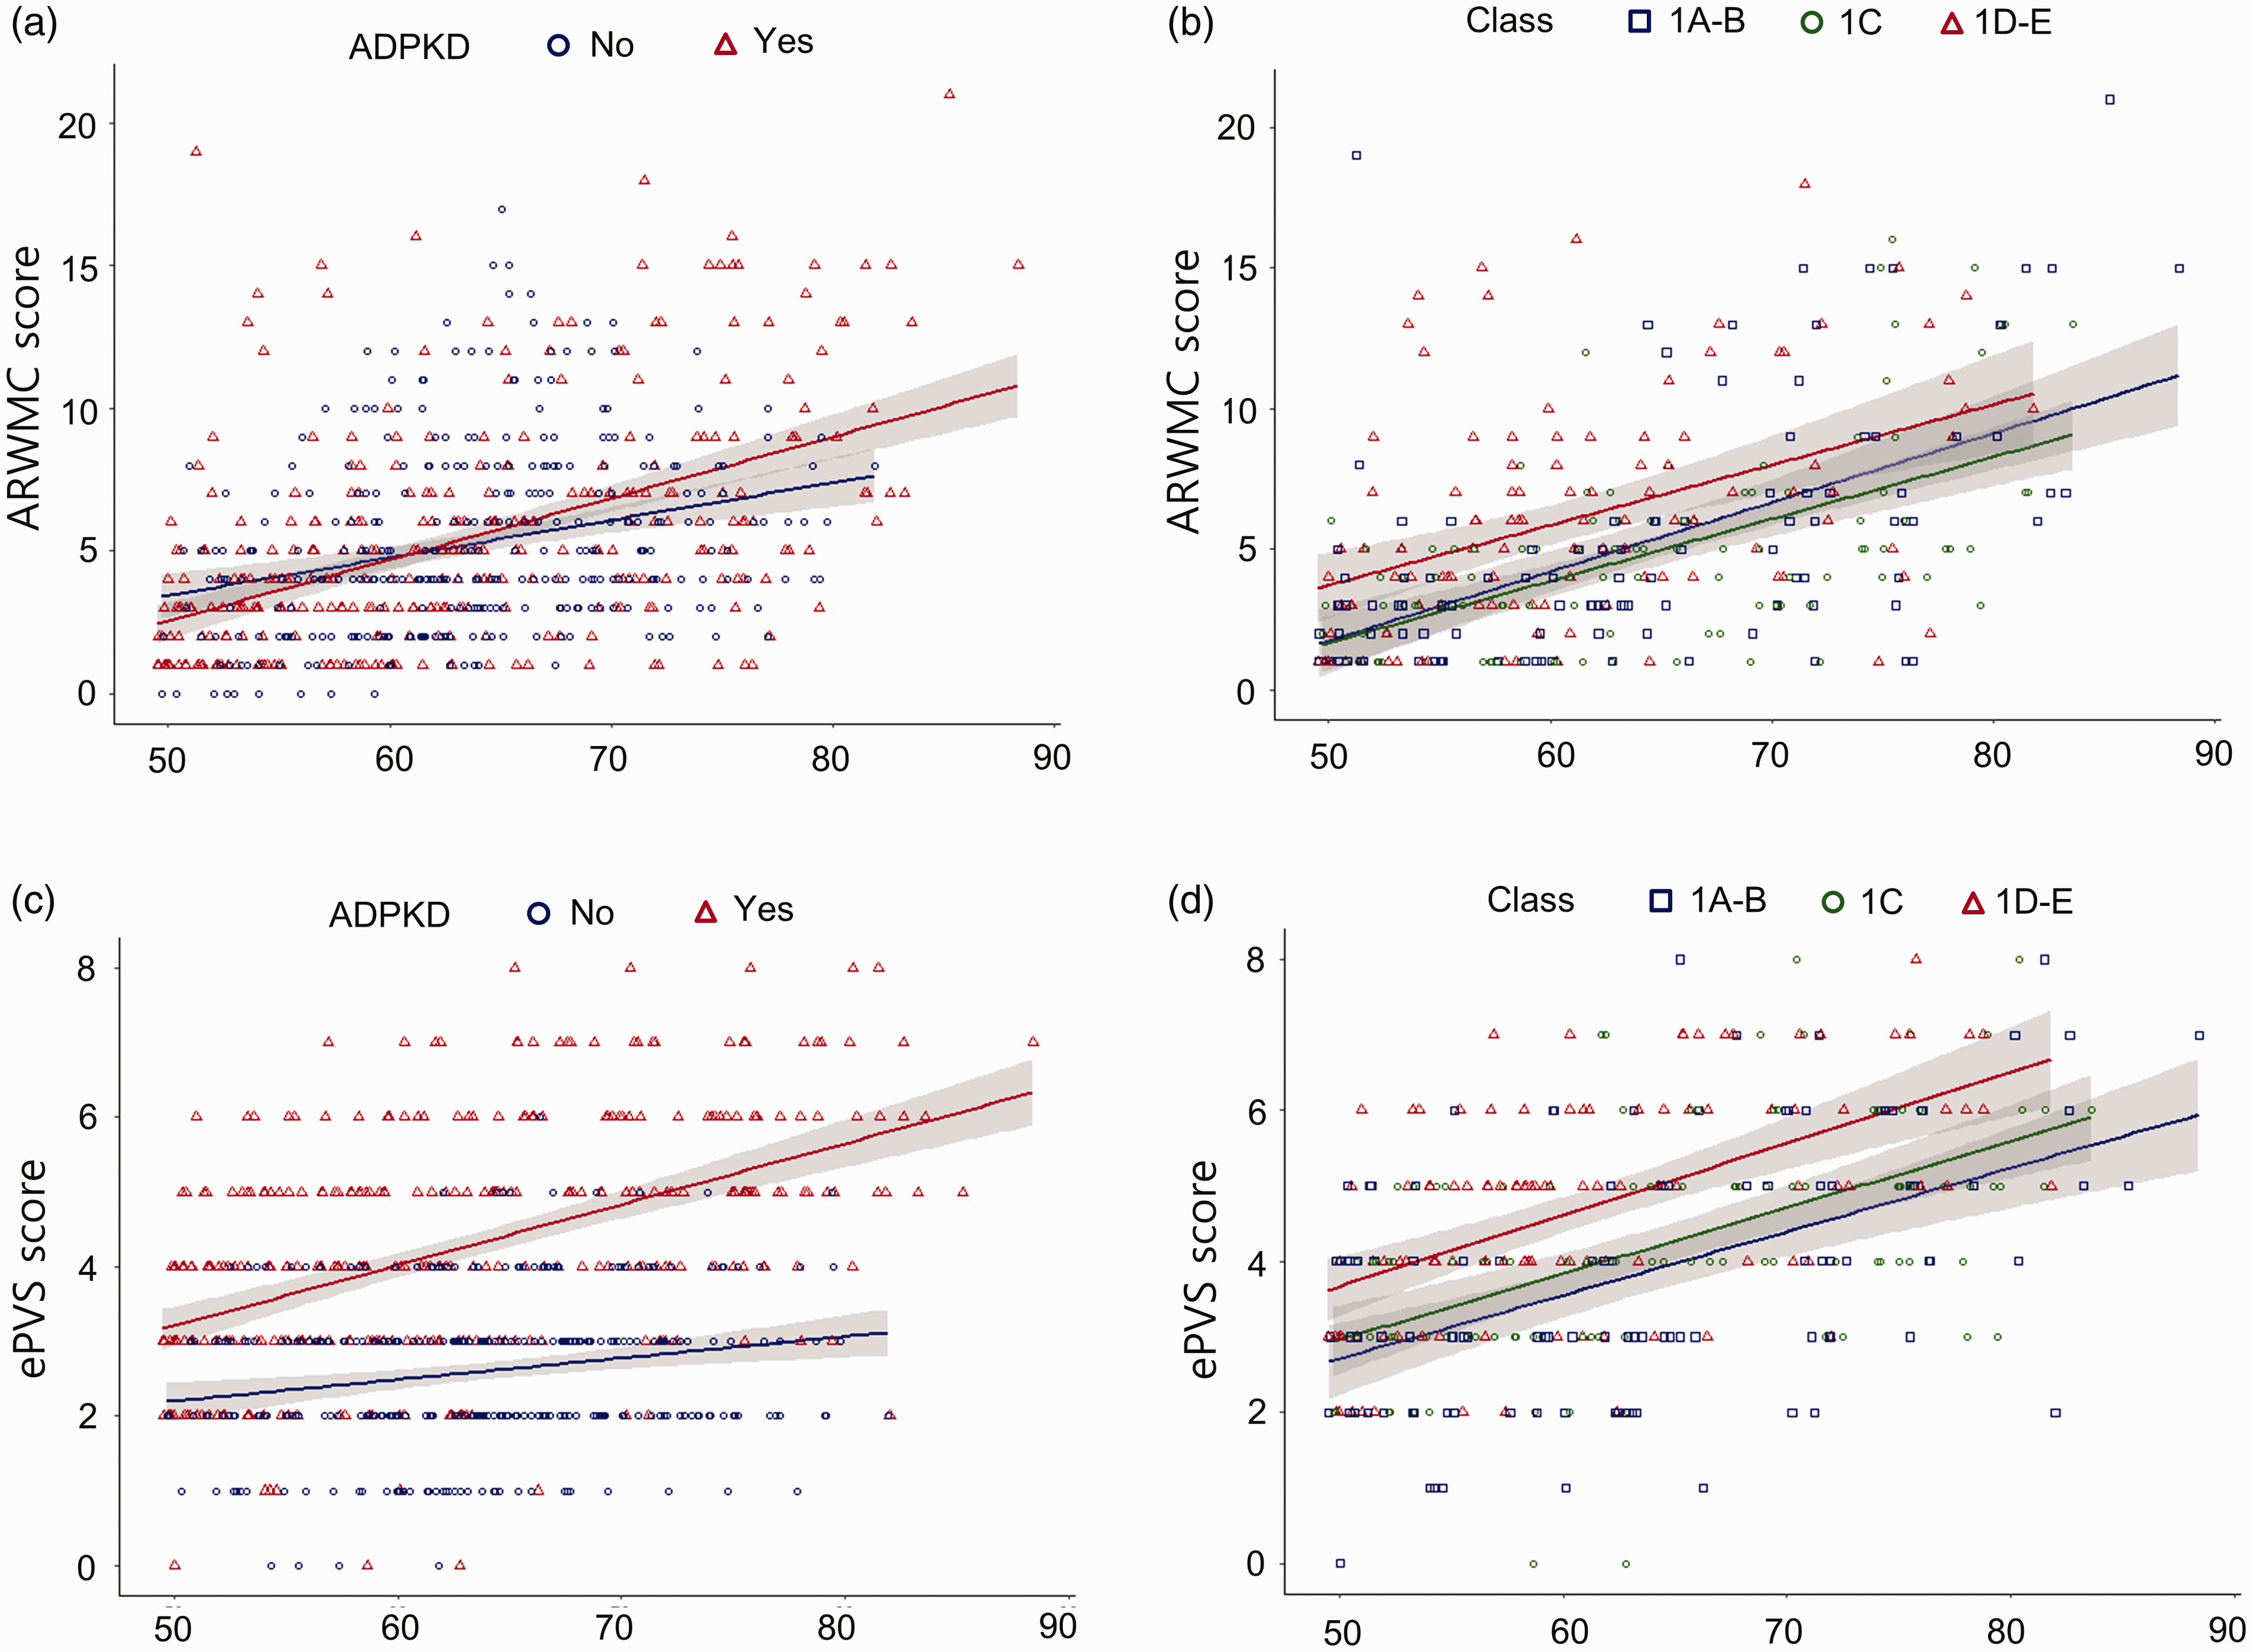
Plots for the age and small vessel disease parameters in the whole study population and in the autosomal dominant polycystic kidney disease (ADPKD) group. In
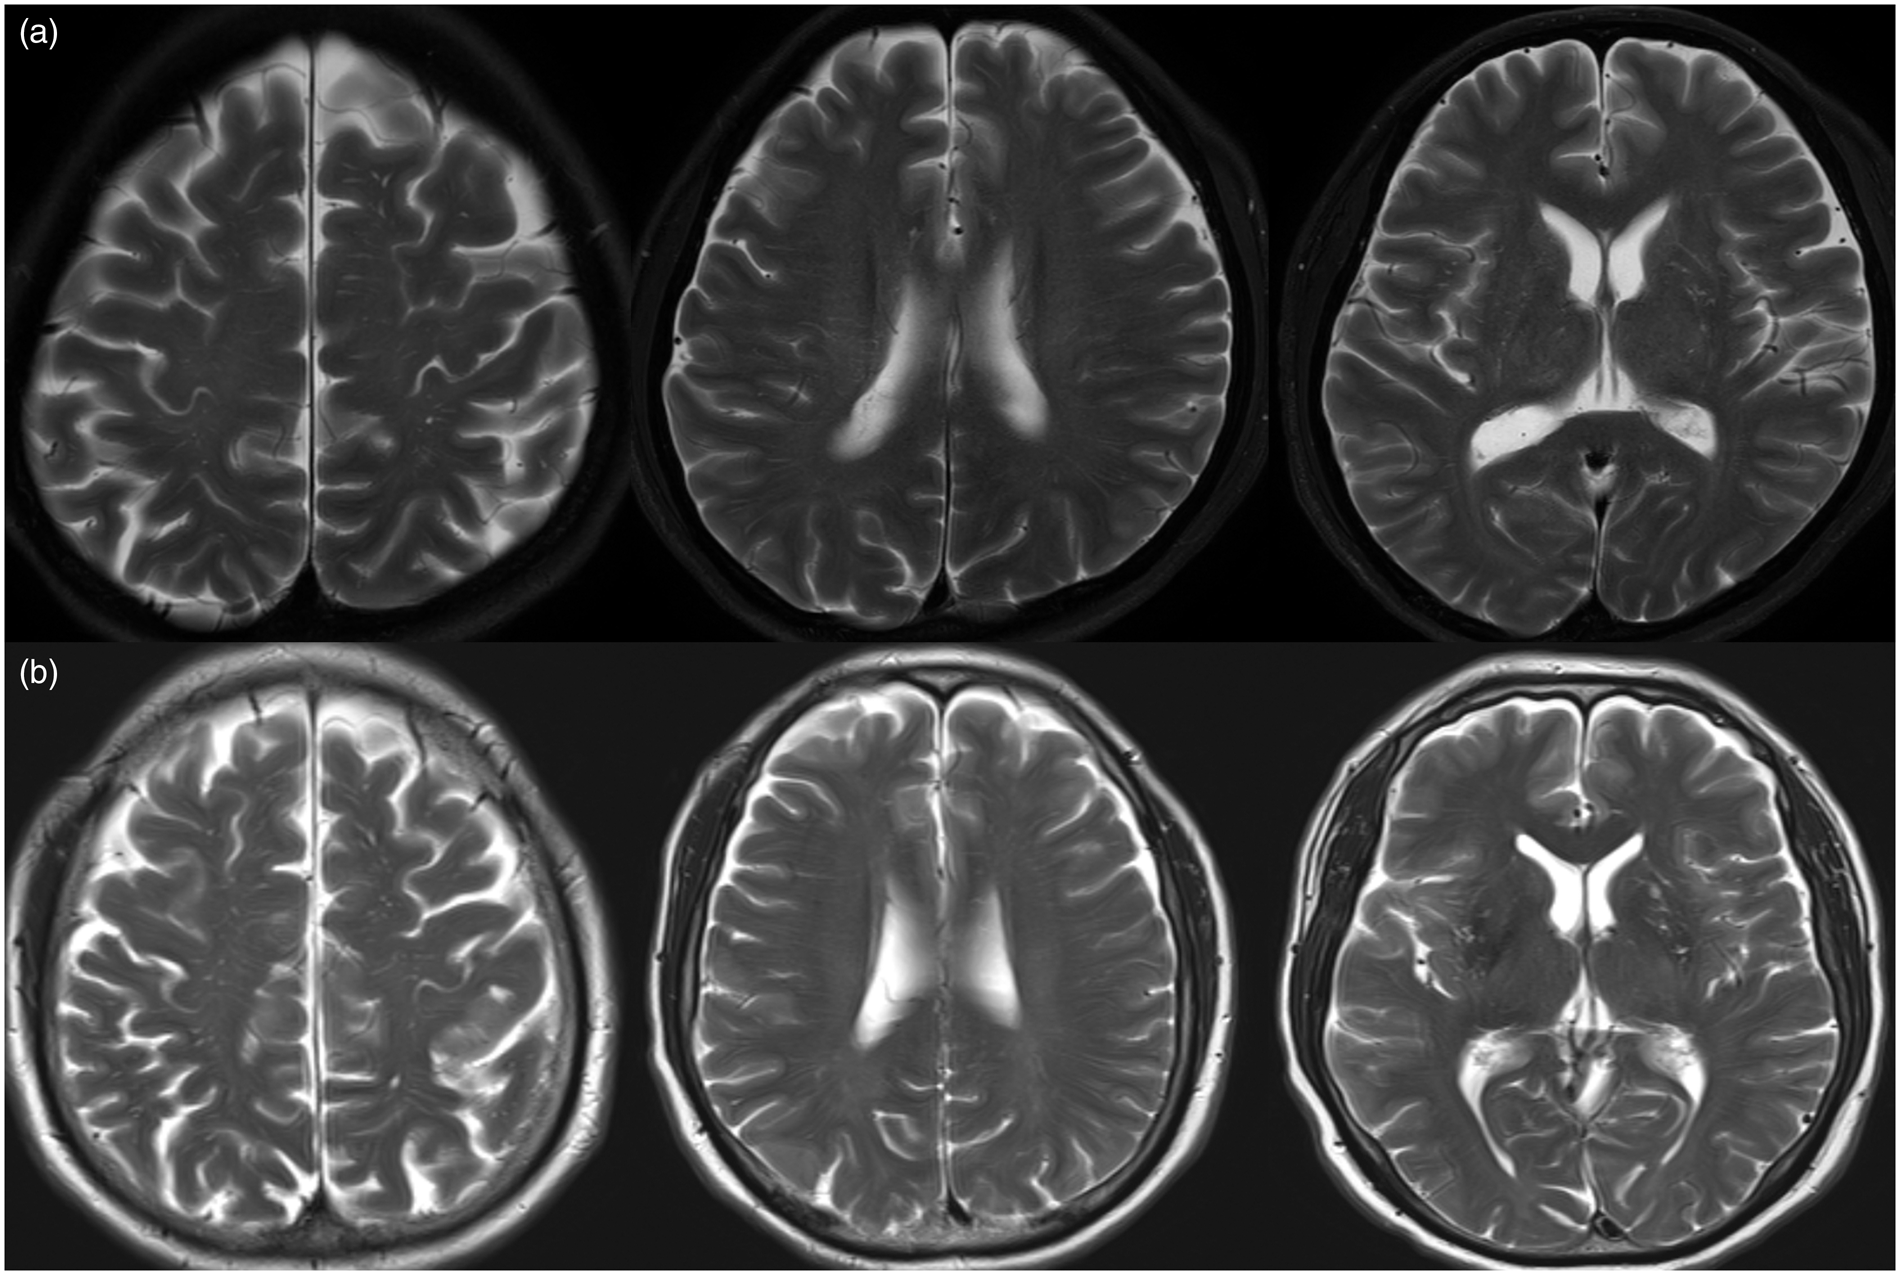
Representative cases.
In following regression analyses to evaluate the association of the ADPKD severity with the ADPKD subgroup, higher ADPKD severity class was associated with higher log-transformed total ARWMC score (B 0.115 [for one level change in the classes]; 95% CI 0.041–0.189; P = 0.003, Table 3 and Figure 2(b)). In the analyses for the brain subregions, ADPKD severity class was associated with higher log-transformed lobar ARWMC scores (B 0.109; 95% CI 0.041–0.178; P = 0.002, Supplemental Table 6) but not with deep ARWMC score (P = 0.069). In every analysis, the standardized residuals were normally distributed in a histogram, and the P-P plot distribution was near the comparison line. VIF values for each variable were <1.7.
Regression analyses for the association of ADPKD severity class with white-matter hyperintensity severity, the presence of cerebral microbleeds, and the presence of lacunes in the subgroup with ADPKD.
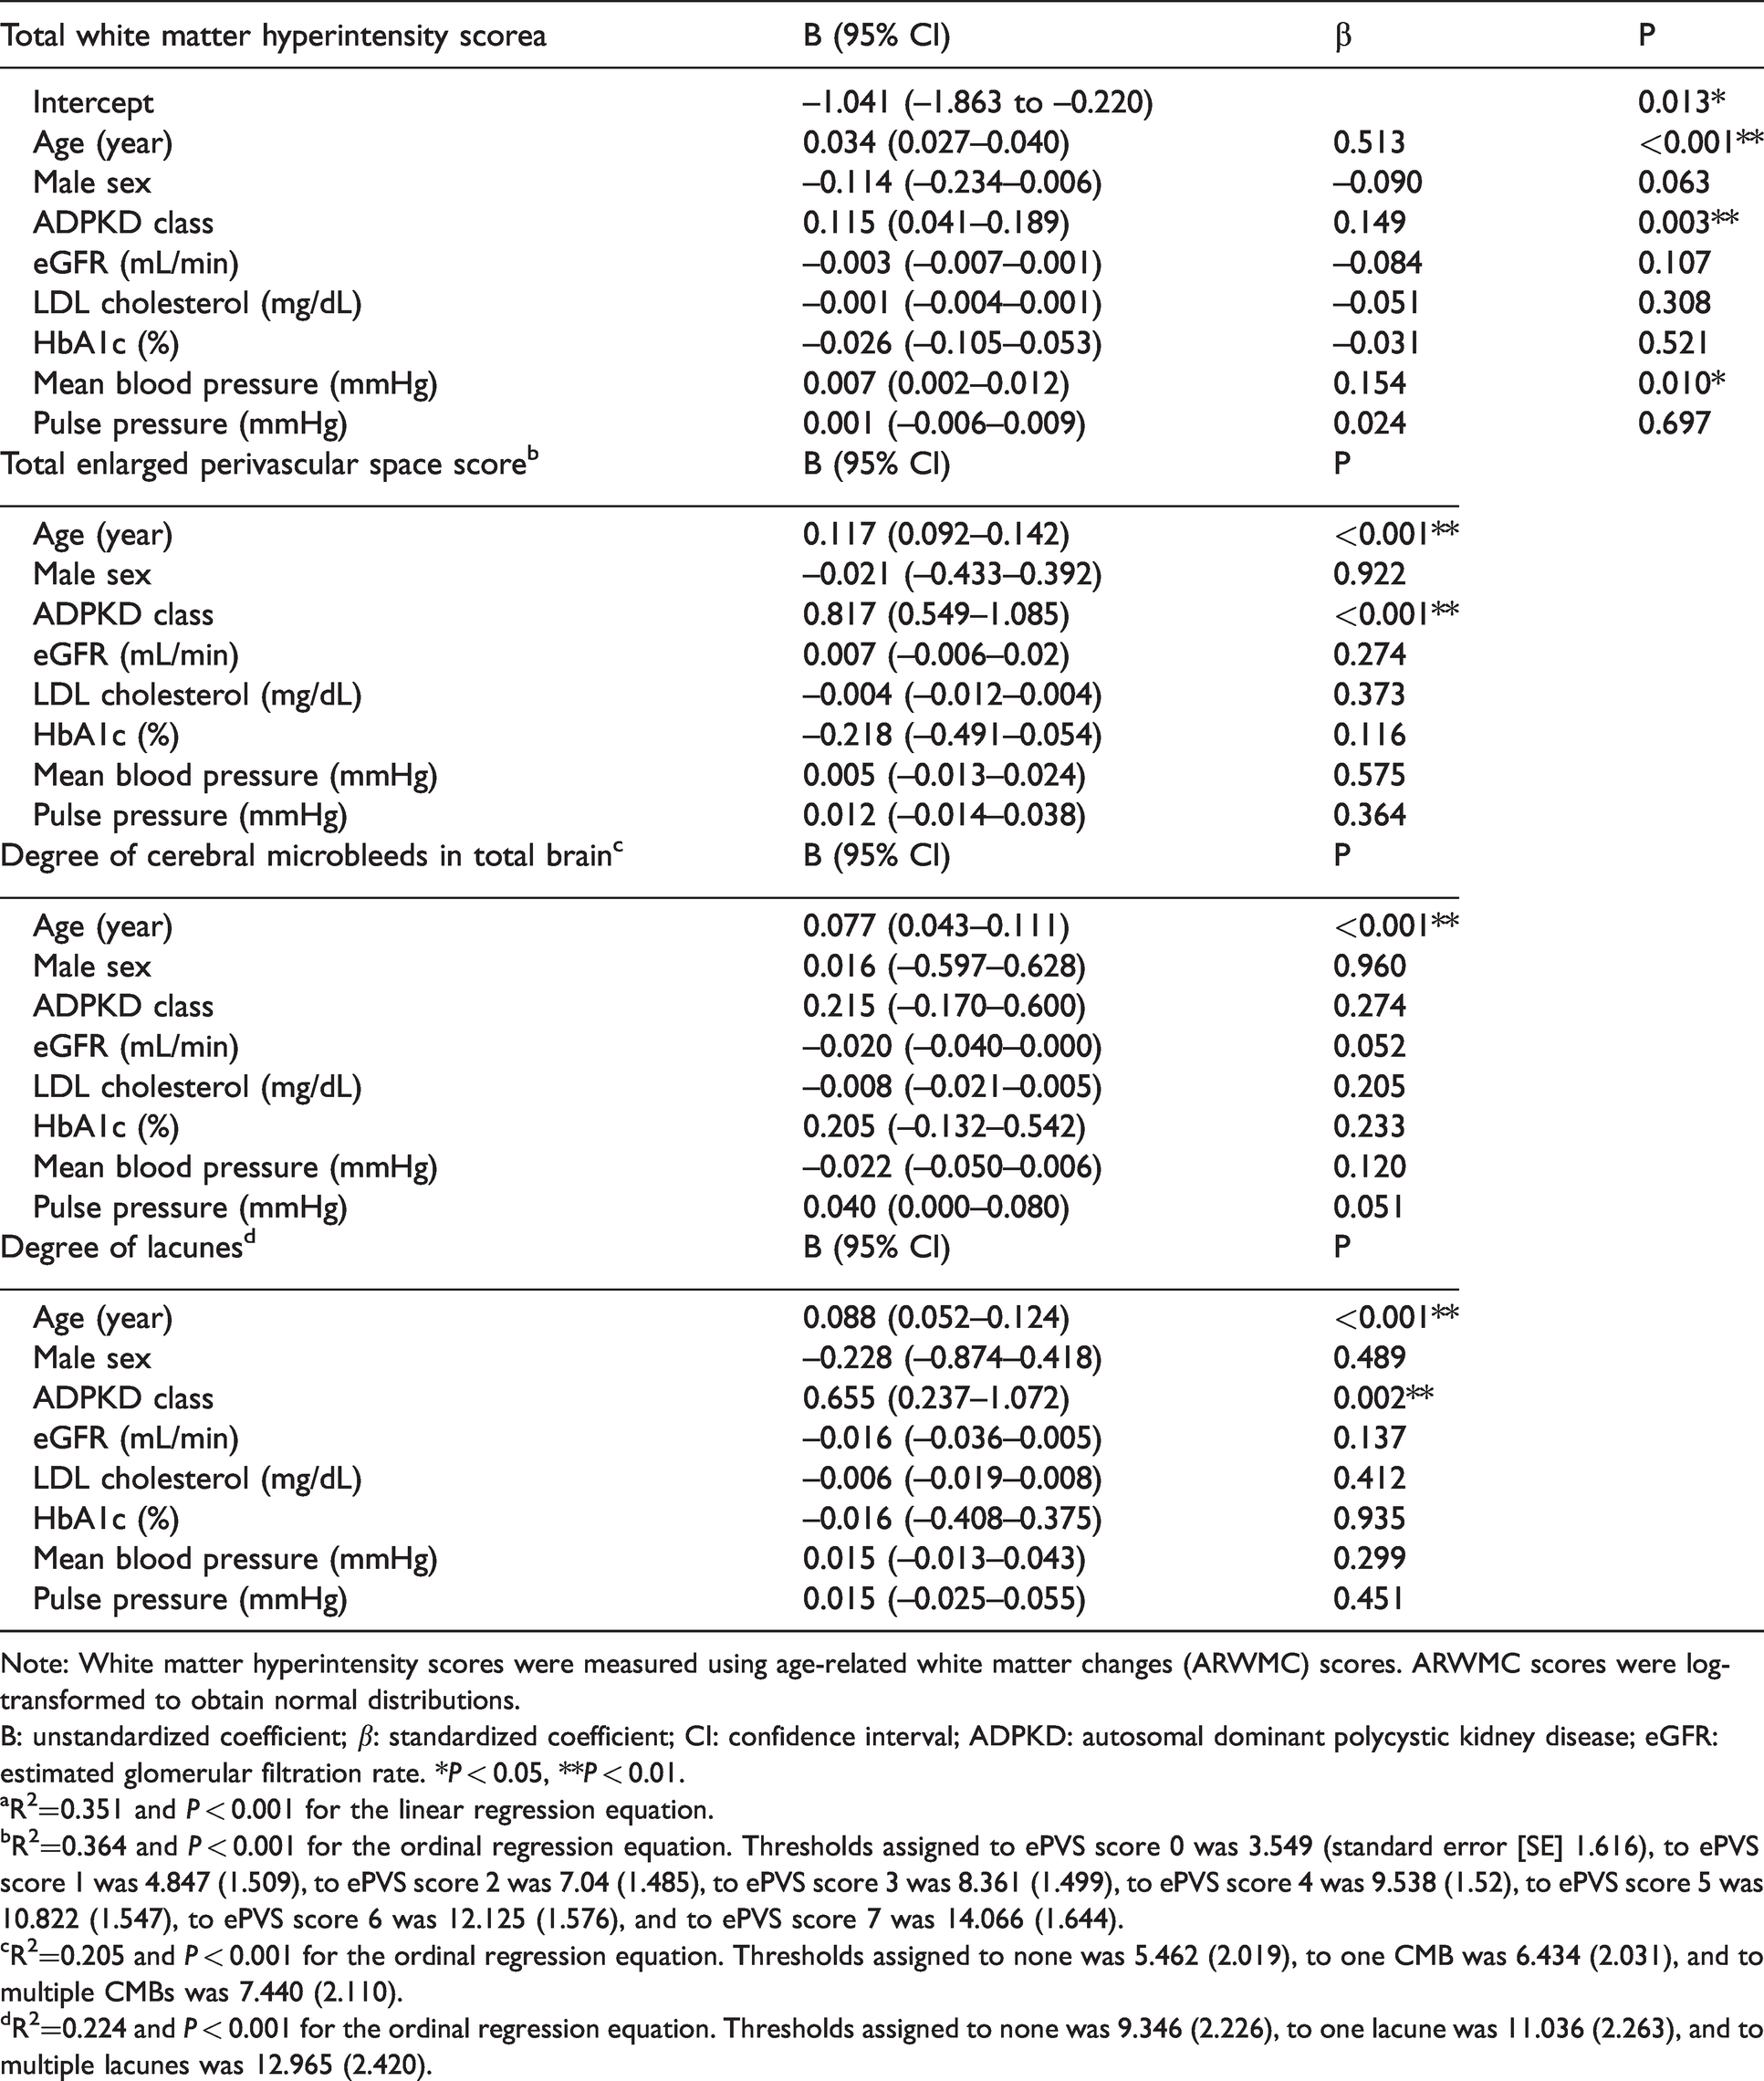
Note: White matter hyperintensity scores were measured using age-related white matter changes (ARWMC) scores. ARWMC scores were log-transformed to obtain normal distributions.
B: unstandardized coefficient; β: standardized coefficient; CI: confidence interval; ADPKD: autosomal dominant polycystic kidney disease; eGFR: estimated glomerular filtration rate. *P < 0.05, **P < 0.01.
aR2=0.351 and P < 0.001 for the linear regression equation.
bR2=0.364 and P < 0.001 for the ordinal regression equation. Thresholds assigned to ePVS score 0 was 3.549 (standard error [SE] 1.616), to ePVS score 1 was 4.847 (1.509), to ePVS score 2 was 7.04 (1.485), to ePVS score 3 was 8.361 (1.499), to ePVS score 4 was 9.538 (1.52), to ePVS score 5 was 10.822 (1.547), to ePVS score 6 was 12.125 (1.576), and to ePVS score 7 was 14.066 (1.644).
cR2=0.205 and P < 0.001 for the ordinal regression equation. Thresholds assigned to none was 5.462 (2.019), to one CMB was 6.434 (2.031), and to multiple CMBs was 7.440 (2.110).
dR2=0.224 and P < 0.001 for the ordinal regression equation. Thresholds assigned to none was 9.346 (2.226), to one lacune was 11.036 (2.263), and to multiple lacunes was 12.965 (2.420).
Association of ADPKD with ePVS severity
In the whole study population, ADPKD was significantly associated with a higher ePVS score (B 2.337; 95% CI 1.981–2.692; P < 0.001), along with age (B 0.083; 95% CI 0.065–0.102; P < 0.001, Table 2 and Figure 2(c), Supplemental Tables 3 and 4 for univariate analyses). When ePVS was stratified by its location, ADPKD was also significantly associated with a higher ePVS score in both CS and BG regions (B 2.015; 95% CI 1.661–2.370; P < 0.001 and B 2.179; 95% CI 1.768–2.591; P < 0.001, respectively, Supplemental Table 7, Supplemental Tables 3 and 4 for univariate analyses).
In the following analyses for the ADPKD subgroup, a higher ADPKD severity class was associated with a higher total ePVS score (B 0.817; 95% CI 0.549–1.085; P < 0.001, Table 3, Figures 2(d), and 3 for representative cases). For the brain subregions, ADPKD severity class was also associated with a higher ePVS score for the CS and BG areas (B 0.692; 95% CI 0.415–0.968; P < 0.001 and B 0.790; 95% CI 0.492–1.087; P < 0.001, respectively, Supplemental Table 8).
Association of ADPKD with CMBs or lacunes
In the ordinal regression analyses for the whole study population, ADPKD was not significantly associated with the degree of CMBs (P = 0.578) or degree of lacunes (P = 0.052, Table 2, Supplemental Table 9 for univariate analyses). In the analyses for the ADPKD subgroup, a higher ADPKD severity class was associated with a higher degree of lacunes (B 0.655; 95% CI 0.237–1.072; P = 0.002) but not with the degree of CMB (P = 0.274, Table 3).
Association of ADPKD with SVD parameters in males and females
We performed regression analyses to evaluate the association of ADPKD with SVD parameters separately for male and female patients. For male patients, ADPKD was significantly associated with a higher ePVS score (B 2.353; 95% CI 1.843–2.863; P < 0.001), but not with the log-transformed ARWMC scores (P = 0.179), degree of CMBs (P = 0.994), or degree of lacunes (P = 0.453, Supplemental Table 10). For female patients, ADPKD was also associated with a higher ePVS score (B 2.522; 95% CI 2.010–3.034; P < 0.001), but not with the log-transformed ARWMC scores (P = 0.921), degree of CMBs (P = 0.428), or degree of lacunes (P = 0.053, Supplemental Table 11).
Discussion
The current study observed that ADPKD is more strongly associated with ePVS than other SVD markers, and its severity also correlated with the severity of SVD markers. ADPKD was particularly associated with a higher degree of ePVS scores for the total, CS, and BG areas after adjustments for age, sex, eGFR, and blood pressure markers, although no significant association was found with other SVD markers, such as WMH severity, presence of CMB, or presence of lacunes. Additionally, in the ADPKD subgroup, the severity class of ADPKD, measured using HtTKV, was associated with higher ePVS scores for all areas, total and lobar ARWMC scores, and higher frequency of lacunes. Although a previous study has reported a higher frequency of CMBs in patients with ADPKD, 31 this study is the first to evaluate the association of ADPKD pathology and its severity with various SVD markers using age and sex-matched controls and the kidney volume measurements, respectively.
Although complex mechanisms contribute to the progression of SVD, each parameter of SVD may represent different underlying disease mechanisms.5,11,13,16,32 Arteriolosclerosis-related reduction of microvascular pulsation and endothelial dysfunction at an early stage of the disease induces diffuse parenchymal hypoperfusion, BBB dysfunction, oxidative stress and inflammation, and glymphatic system dysfunction, which may present as WMH and ePVS. Meanwhile, lipohyalinosis and fibroid necrosis at later disease stages provoke occlusion or rupture of microvessels, presenting as lacunes or CMBs.21–26,32–34
However, given that the glymphatic system feeds and drains the brain via CSF transmission, factors involved in the regulation of the CSF circulation might provide a non-microvascular pathomechanistic contribution to the SVD progression.6,12,13,15 Additionally, given that ePVS represents the fluid accumulation within the perivascular space, ePVS may be a particularly sensitive marker for the glymphatic system dysfunction. 35 In this regard, disproportionally enhanced ePVS in ADPKD provides evidence of a novel pathomechanism of glymphatic dysfunction resulting from ADPKD pathology that may contribute to SVD progression.16,17 Additionally, the association of ADPKD severity with the degrees of WMH and lacunes suggests that the ADPKD related glymphatic dysfunction in higher severity may also affect the development of those markers that share common pathomechanisms with SVD.21–26,32–34 However, ADPKD or its severity degree was not associated with the degree of CMBs in this study, which is discordant to a previous report. 31 The reason for this negative association may be that CMBs mainly represent a late stage with progressed vascular remodeling resulting in the rupture of microvessels. 34
Although not directly demonstrated by the present study, several pathophysiological characteristics of ADPKD might offer hypotheses to explain its particular association with ePVS (Figure 4). First, PC1 and PC2 proteins are strongly expressed in motile cilia along the ependymal cell lines, and the finely regulated movement of the ependymal motile cilia is a major mediator of CSF circulation, which is crucial for supplying CSF into the periarteriolar space and draining waste-containing CSF from the perivenular space.6–10 Second, choroid plexus epithelial cells express primary cilia that inhibit CSF production via neuropeptide FF receptor 2. 36 Defects in the primary cilia disinhibit the fluid transcytosis through the choroid plexus epithelial cells resulting in the overproduction of CSF, and possibly, the subsequent development of ePVS.10,36 Third, PC1 and PC2 proteins might affect the structural and functional integrity of the perivascular space. PC1 and PC2 are expressed in astrocytes and vascular endothelium, 9 and the PC1-PC2 complex responds to chemical and mechanical stimuli by regulating intracellular calcium concentration and mediating cell-to-cell adhesion,14,37 which are fundamental for maintaining the BBB integrity and glymphatic system function.11–13 Fourth, astrocytes are abundant within the primary cilium, which contains lysophosphatidic acid receptor 1 (LPAR1). 38 Defects in the primary cilium may result in a dysregulated proliferation of astrocytes via the translocalization of LPAR1 from the primary cilium to the plasma membrane and its subsequent overactivation. 38 This may lead to structural deformation of the astrocyte lining and enlargement of the perivascular space. Fifth, PC1 or PC2 deficiency in the microvascular endothelium results in decreased nitric oxide production and impaired endothelium-dependent relaxation of small-sized resistance vessels. 3 This mechanism is similar to the primary mechanism of SVD progression related to hypertension or diabetes mellitus and may explain the correlation of ADPKD severity with other SVD markers, such as WMH score and frequency of lacunes.5,21,32
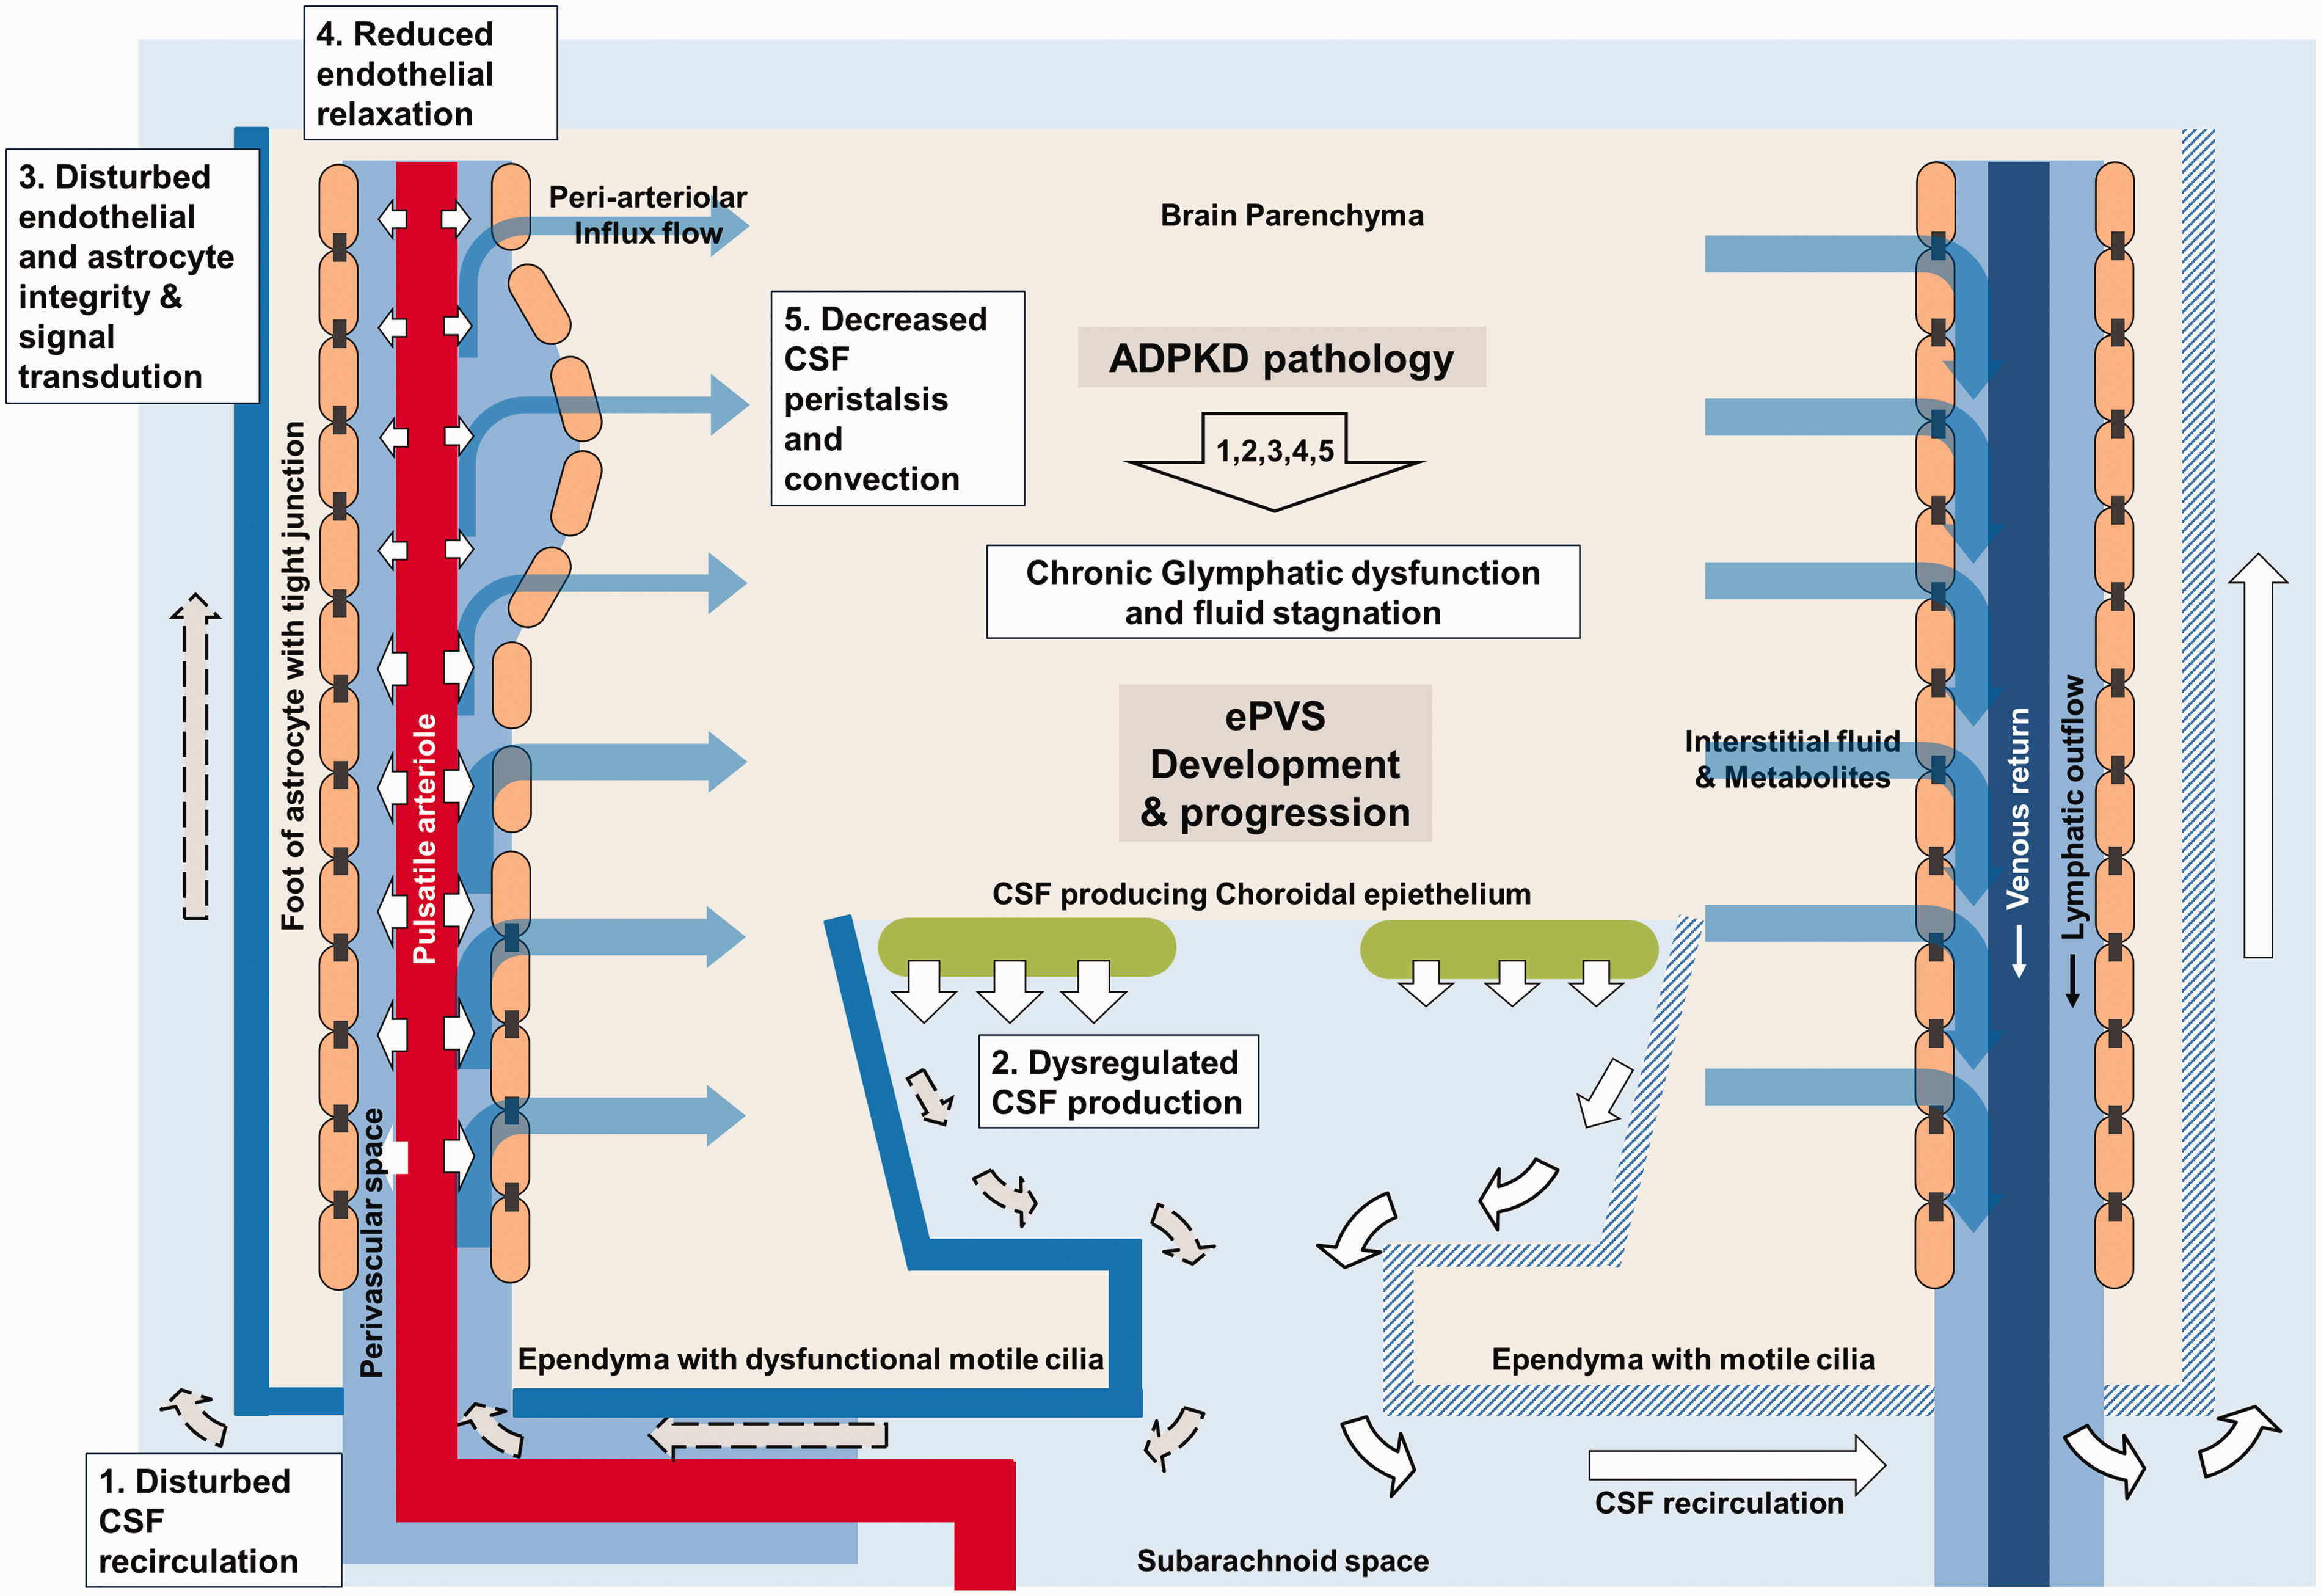
Schematic explanation of the pathophysiologic link between ADPKD and progression of enlarged perivascular space.
ADPKD severity was associated with ARWMC scores for the total and lobar areas, although the association was not significant for the BG and infratentorial areas, which can be explained by the different primary pathology underlying WMH in lobar and deep brain structures. The lobar gray matter produces larger amounts of cerebral wastes when compared with the deep brain structures, which means that SVD in this area may be more dependent on the glymphatic waste clearance system dysfunction. In contrast, deep brain structures are supplied by the penetrating arterioles ramifying directly and perpendicularly from the basal large feeding arteries, making SVD in this area dependent on conventional cerebrovascular risk factors, thus contributing to the chronic reduction of microvascular compliance.5,15,22,39,40
Our study has some limitations. First, owing to the retrospective cross-sectional study design, a causal relationship between ADPKD pathology and the long-term changes in the ePVS and other SVD markers was not demonstrated. Second, this study did not directly evaluate the alteration in the glymphatic system function, which may be the key to determining ADPKD-associated mechanisms. Prospective studies with longitudinal follow-up of patients to more precisely investigate the association between ADPKD and the cerebral SVD progression are warranted.21,23,41 Additionally, further studies may evaluate the impact of ADPKD on the glymphatic system function and other SVD pathomechanisms, using more advanced investigation modalities such as glymphatic MRI, dual-echo arterial spin labeling MRI, diffusion-weighted image-based brain connectivity maps, and cortical thickness measurement.42–46
In conclusion, ADPKD is more strongly associated with ePVS than other SVD markers, and its severity also correlated with the severity of SVD. Multiple pathomechanisms of ADPKD-associated cilia dysfunction may induce chronic dysfunction of the cerebral glymphatic system, resulting in the ePVS augmented pattern of SVD.
Supplemental Material
sj-pdf-1-jcb-10.1177_0271678X211037869 - Supplemental material for Association of autosomal dominant polycystic kidney disease with cerebral small vessel disease
Supplemental material, sj-pdf-1-jcb-10.1177_0271678X211037869 for Association of autosomal dominant polycystic kidney disease with cerebral small vessel disease by Woo-Jin Lee, Keun-Hwa Jung, Hyunjin Ryu, Kook-Hwan Oh, Jeong-Min Kim, Soon-Tae Lee, Kyung-Il Park, Kon Chu, Ki-Young Jung, Manho Kim and Sang Kun Lee in Journal of Cerebral Blood Flow & Metabolism
Footnotes
Funding
The author(s) disclosed receipt of the following financial support for the research, authorship, and/or publication of this article: This research was supported by the Brain Research Program through the National Research Foundation of Korea (NRF) funded by the Ministry of Science and ICT (Information and Communications Technology) (2018M3C7A1056889).
Declaration of conflicting interests
The author(s) declared no potential conflicts of interest with respect to the research, authorship, and/or publication of this article.
Authors’ contributions
WJL contributed in study data acquisition, data analysis and interpretation, and drafting manuscript. KHJ contributed in initial conceptualization and design of the study, manuscript revision, and supervision of the entire procedures in this study. HJR participated in patient management, study design, manuscript revision. KHO provided study resource and participated in patient management and manuscript revision. JMK contributed in MR image acquisition and analysis. STL contributed in conception and design of the study. KIP contributed in patient management, and manuscript revision. KC participated in MR image management and analysis. KYJ contributed in initial conceptualization and design of the study. MHK participated in manuscript review and editing. SKL participated in data analysis and management of data.
Supplemental material
Supplemental material for this article is available online.
References
Supplementary Material
Please find the following supplemental material available below.
For Open Access articles published under a Creative Commons License, all supplemental material carries the same license as the article it is associated with.
For non-Open Access articles published, all supplemental material carries a non-exclusive license, and permission requests for re-use of supplemental material or any part of supplemental material shall be sent directly to the copyright owner as specified in the copyright notice associated with the article.