
Abstract
A variety of brain cells participates in neurovascular coupling by transmitting and modulating vasoactive signals. The present study aimed to probe cell type-dependent cerebrovascular (i.e., pial and penetrating arterial) responses with optogenetics in the cortex of anesthetized mice. Two lines of the transgenic mice expressing a step function type of light-gated cation channel (channelrhodopsine-2; ChR2) in either cortical neurons (muscarinic acetylcholine receptors) or astrocytes (Mlc1-positive) were used in the experiments. Photo-activation of ChR2-expressing astrocytes resulted in a widespread increase in cerebral blood flow (CBF), extending to the nonstimulated periphery. In contrast, photo-activation of ChR2-expressing neurons led to a relatively localized increase in CBF. The differences in the spatial extent of the CBF responses are potentially explained by differences in the involvement of the vascular compartments. In vivo imaging of the cerebrovascular responses revealed that ChR2-expressing astrocyte activation led to the dilation of both pial and penetrating arteries, whereas ChR2-expressing neuron activation predominantly caused dilation of the penetrating arterioles. Pharmacological studies showed that cell type-specific signaling mechanisms participate in the optogenetically induced cerebrovascular responses. In conclusion, pial and penetrating arterial vasodilation were differentially evoked by ChR2-expressing astrocytes and neurons.
Keywords
Introduction
Cerebrovascular responses to neural activity (i.e., neurovascular coupling) are required to maintain brain health. A variety of brain cells (neurons and glia) participates in the signaling mechanism of neurovascular coupling. 1 , 2 Depending on neural circuits evoked, excitatory and inhibitory neurons differently induce energy consumption and changes in cerebrovascular tones.3–6 Glial cells also contribute to the release and uptake of vasoactive substances,7–10 and are loosely associated with neural activity. 11 In response to vasoactive signals, mural and vascular cells change their vascular tone to a variable degree, depending on the vascular compartments (e.g., capillary, pre-capillary arteriole, penetrating arteriole, and pial artery 12 ) and orchestrate the moment-to-moment adjustment of the spatial distribution of cerebral blood flow (CBF). 13
Accumulating evidence suggests that astrocytic dysfunction contributes to pathogenesis of neurodegenerative disorders, which is potentially driven by concomitant changes in neurovascular coupling. 14 , 15 Preclinical studies of Alzheimer’s disease models showed malformation of the cerebral microvasculature before or concomitant with the progression of neural dysfunction.16–18 Vascular amyloid deposits render vasodilation produced by vasoactive substances released by astrocytes. 19 Age-related loss of astrocytic end-feet contact to the vessels is correlated with the impaired neurovascular coupling, but not by a loss of pericytes. 20 Following subarachnoid hemorrhage, changes in astrocytic calcium signaling determines the polarity of the neurovascular coupling responses (i.e., vasodilation or vasoconstriction). 21 Likewise, cerebral hypoxia/ischemia lead to the uncoupling of cerebrovascular responses to neural activity.22–24 Reduced neurovascular coupling was accompanied by impaired vasodilation of the penetrating arterioles, but not vasodilation of the pial arteries which appeared to be preserved. 24 According to these findings, vasoactive pathways, specifically in the gliovascular interfaces, are selectively impaired, depending on the disease states.
The previous studies showed that photo-activation of light-gated channels (e.g., channelrhodopsin-2; ChR225,26)-expressing astrocytes induced robust increases in cortical blood flow independent of neural electrophysiological activity. 27 , 28 However, it remains unclear which vascular compartments have responsibility to drive the photo-activation induced hemodynamic responses. Optogenetic tools that manipulate membrane potentials via ChR2 allow us to selectively activate brain cells in the intact cellular environment of the brains of living animals. Other studies with optogenetic manipulation of various types of cortical neurons showed that photo-activation of specific populations of cortical excitatory or inhibitory neurons elicit both robust increases in CBF and vasodilatory and vasoconstrictive responses, depending on types of the cells activated, 3 , 29 and that photo-activation of different subtypes of interneurons provoked variable spatiotemporal changes in cortical hemodynamics. 5 , 6 Altogether, these previous studies show that optogenetic manipulation of the ChR2-expressing brain cells is a promising approach to characterize cell type-dependent cerebrovascular responses (i.e., pial and penetrating arterial responses) and thus further explore the neurovascular/gliovascular signaling mechanisms.
The aim of the preset study was to probe cell type-dependent cerebrovascular responses with optogenetics in the cortex of anesthetized mice. Two lines of transgenic mice expressing a step function type of ChR2 30 in either cortical neurons (muscarinic acetylcholine receptors; ChR2-neuron) or astrocytes (Mlc1-positive; ChR2-astrocytes) were used. First, dynamic spatiotemporal changes in CBF induced by photo-activation were compared using laser speckle flowgraphy (LSFG). We observed differences in the spatial extent of the CBF responses, which were then examined by measuring the vascular diameter responses to photo-activation with two-photon microscopy in vivo. Additionally, pharmacological inhibition of the CBF responses to photo-activation was conducted to further determine the underlying mechanisms.
Material and methods
Animals
Animal use and experimental protocols were approved by the institutional Animal Ethics Committee of Keio University, School of Medicine (No. 09058) and all experimental procedures were performed in accordance with guidelines established by the Institute for the Humane Care and Use of Laboratory Animals in compliance with ARRIVE guidelines (i.e., ARRIVE Essential 1031) Both male and female double transgenic mice that expressed a step function mutant ChR2(C128S) in cholinergic receptor muscarinic 4 (Chrm4)-expressing neurons (Chrm4-tTA::tetO-ChR2(C128S)-EFYP mice, 3–8 months, 29 ± 5 g, N = 30) or in Mlc1-expressing astrocytes (Mlc1-tTA::tetO-ChR2(C128S)-EFYP mice, 2–12 months, 29 ± 7 g, N = 33) were used in the experiments. A previously published study identified high expression levels of ChR2 at neuronal soma in cortical layer IV and at dendrites in layer II/III of ChR2-neuron mice. 28 In ChR2-astrocyte mice, uniform expression of ChR2 throughout the cortical layers was confirmed. 28 Detailed descriptions of the methods used to generate those animal lines are provided elsewhere. 28
For all experiments, the animals were anesthetized with urethane (an initial dose of 1.1 g/kg i.p. and a half of the initial dose for supplementary anesthesia, as needed), and their head was fixed within a stereotactic frame (SG-4N custom-modified, Narishige Scientific Instrument Laboratory, Tokyo, Japan). During surgery and the experiments, the body temperature of the animals was maintained 37 °C with a feed-back thermal controller through a heating pad (BWT-100, Bioresearch Center Co. Ltd., Nagoya, Japan). The arterial blood pressure and heart rate were monitored with a noninvasive blood pressure monitor (MK-2000ST, Muromachi Kikai Co. Ltd., Tokyo, Japan), and normal physiologic conditions (i.e., about 100 mmHg and 600 bpm for mean arterial blood pressure and heart rate, respectively) were ensured throughout the experiments. Approximately 3–5% of the end-tidal carbon dioxide concentration was also ensured using a gas analyzer (microCapStar, CWE Inc., PA, USA).
Photo-stimulation protocols
For experiments in which the CBF was measured, including pharmacological experiments, focal illumination with a 460-nm blue LED (Dual-Optogenetics-LED, Pritzmatix, Israel) was applied for 3-sec duration through a collimator (FCM1-05, Pritzmatix, Israel) with a spot size of 0.5 mm in diameter to open the channel, and subsequently a 595-nm yellow LED (Dual-Optogenetics-LED) was applied for 3-sec duration over the skull to close the channel. To capture spatiotemporal dynamic changes in evoked CBF, the activation site (i.e., a core of photo-stimulation) was set at near the center of the parietal bone, avoiding the areas of large surface vessels. The output intensity of the blue LED was adjusted over 0.001–0.5 mW (0.005–2.5 mW/mm2) using an optical power meter (8230 ADCMT, ADC Corporation, Tokyo, Japan), while output of the yellow LED was fixed at 0.04 mW/mm2. For pharmacological tests, the power of the blue LED ranged from 0.3 to 1.3 mW/mm2. The delivery and sequence of the photo-stimulation was controlled with a TTL signal using a pulse generator (Master-8, AMPI, Israel), and one to three trials were randomly induced for each photo-stimulation power with an onset-to-onset interval of approximately 5 min.
An image of the location of the spot illuminated with the blue LED (set at 0.05 mW) was captured with a high-speed digital camera (EX-F1, CASIO COMPUTER Co., Ltd., Tokyo, Japan) with a diaphragm of 9.3 and a shutter speed of 2 ms through an eye piece of the microscope that was used for the CBF measurements with LSFG (Figure 1(a) and Supplementary Figure S1). The image (1600 × 1200 pixels, with a pixel resolution of 4.7 µm/pixel) was analyzed with a custom-written MATLAB code (Mathworks, Inc., Natick, MA, USA) to estimate intensity profiles of the blue LED on the surface of the skull.
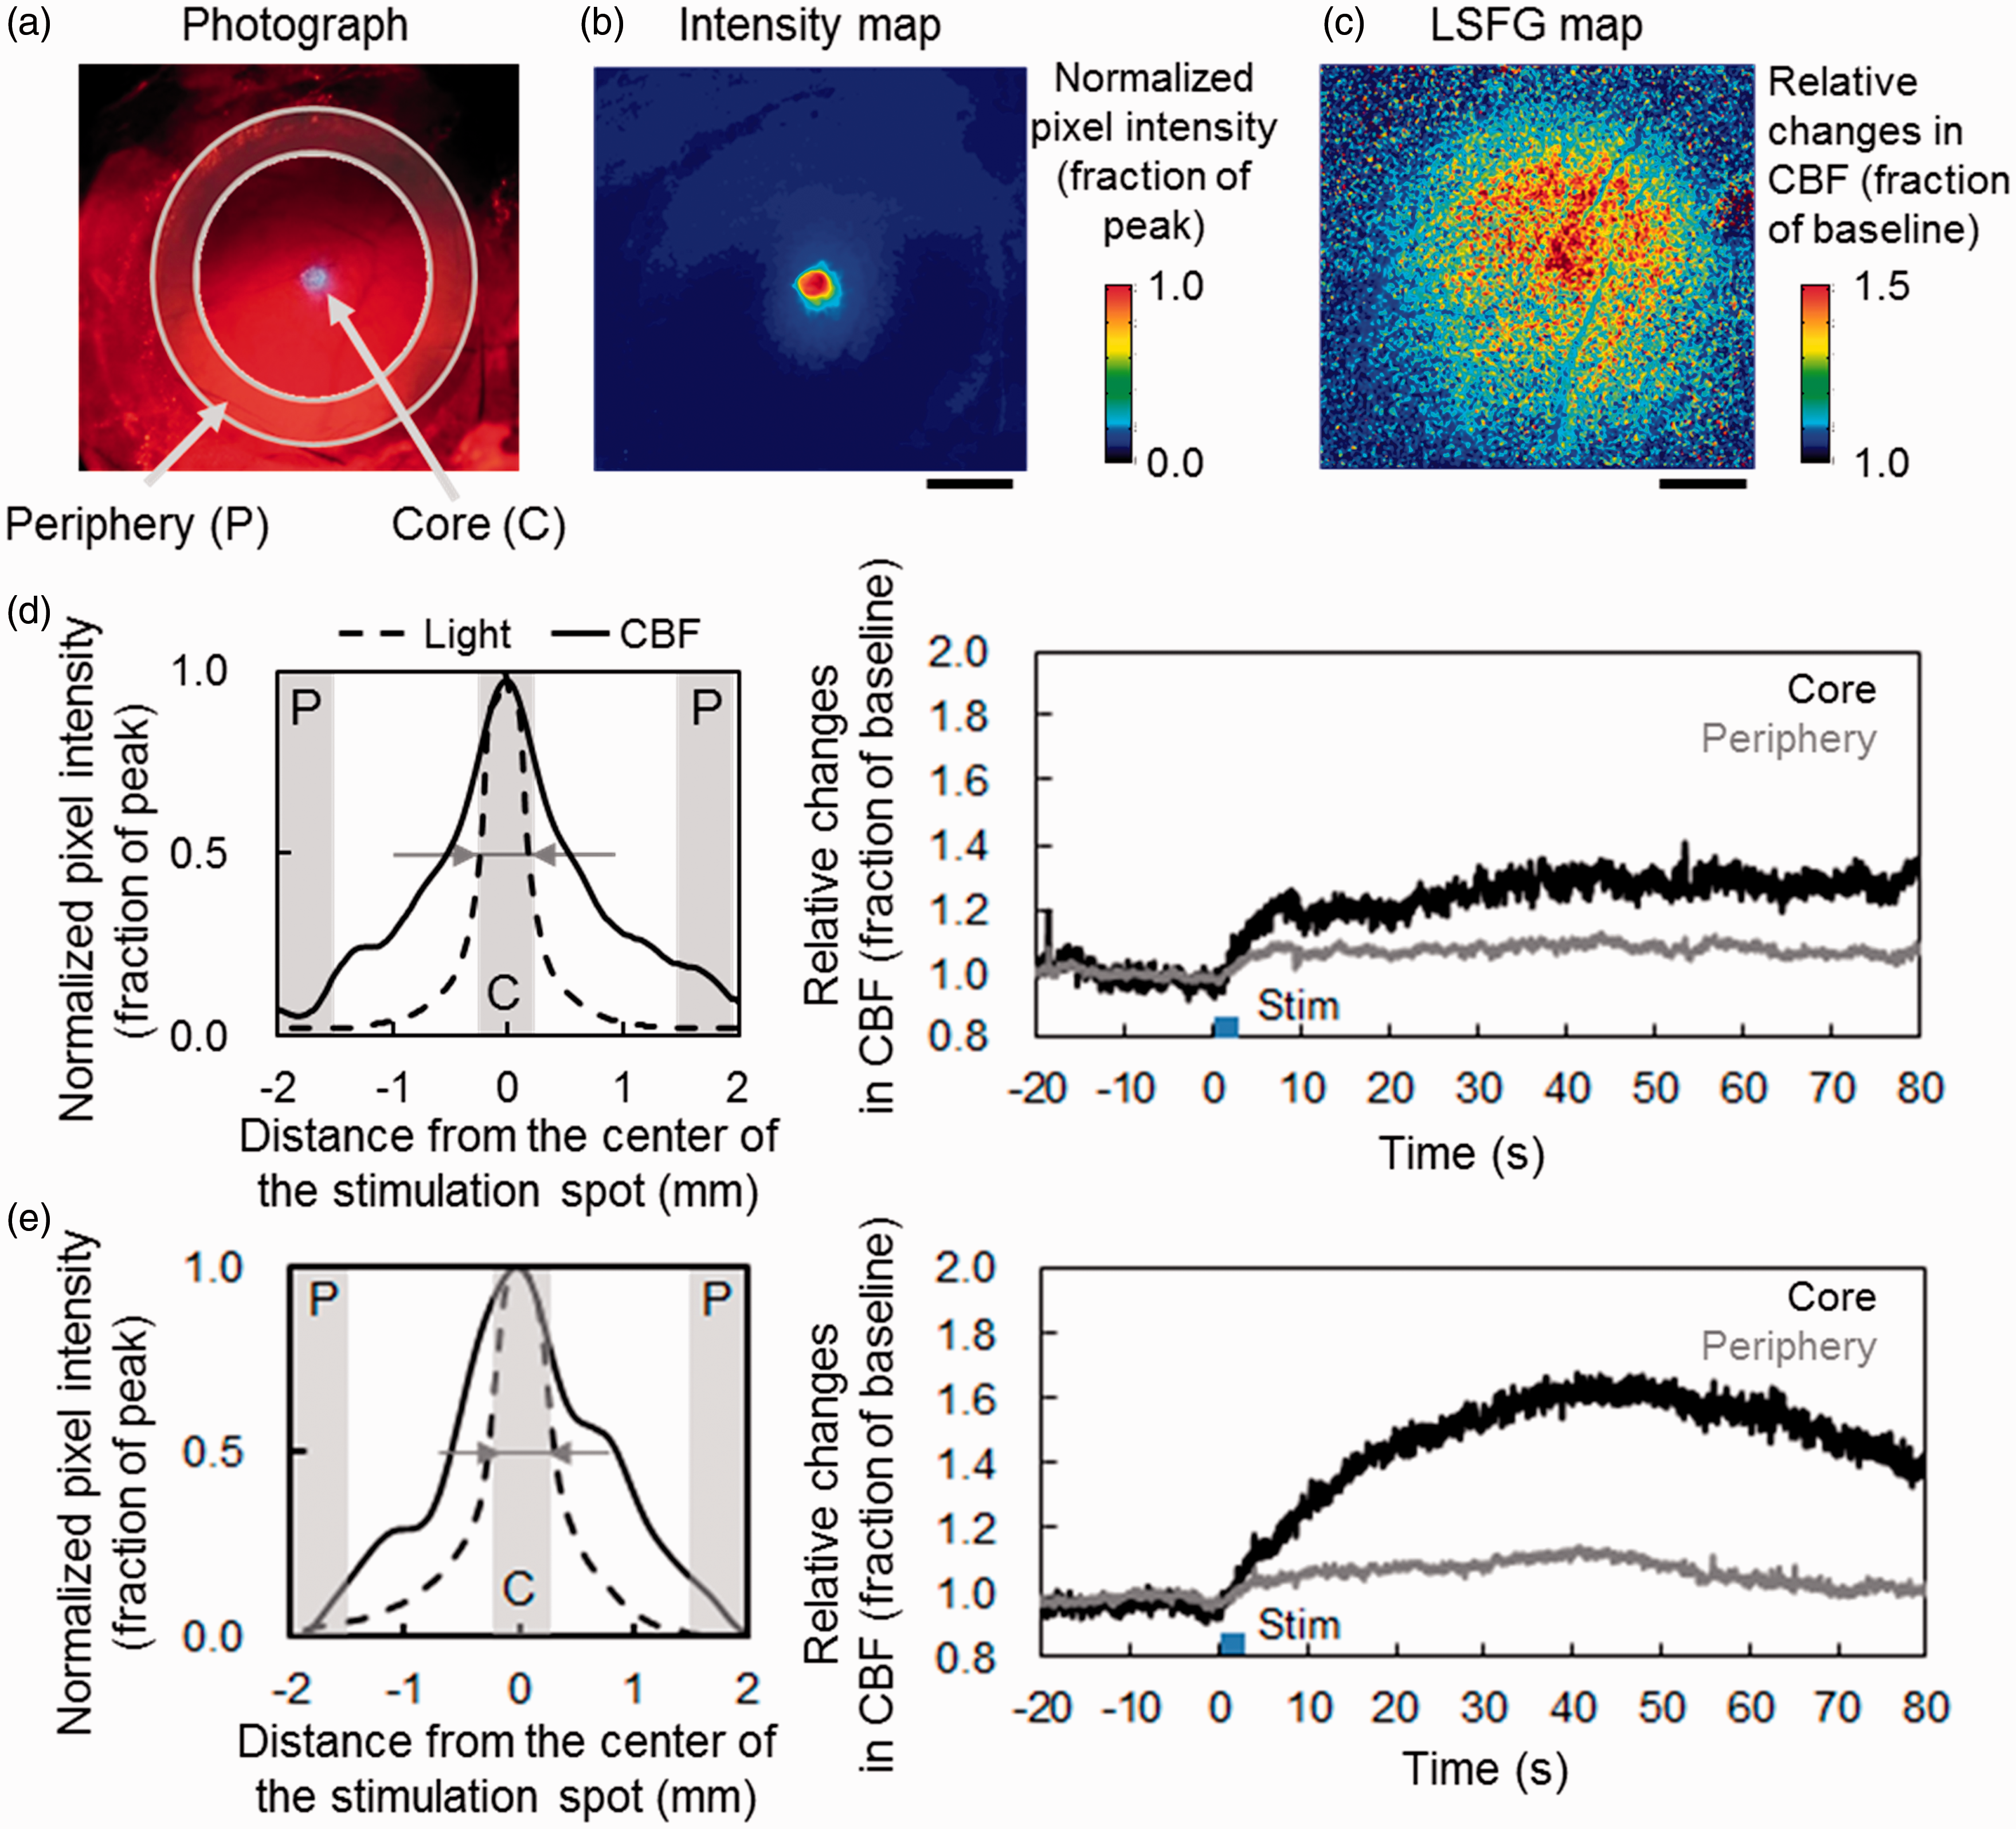
Laser speckle flowgraphy (LSFG) measurements of CBF responses to transcranially delivered photo-activation of ChR2 in the cortex of anesthetized mice. (a) A representative raw image of photograph that captured collimated blue LED stimulation on the skull of the mouse (ChR2-astrocyte). Two circular ROIs (region of interest) were defined for the LSFG measurements at the stimulated core (0.5 mm in diameter) and periphery (1.5–2.0 mm away from the center of the stimulated spot). A map of normalized intensity of blue LED illumination (b) was reconstructed from the photograph (a). Scale bar: 1 mm. (c) A representative map of LSFG in the same animal shown in (a). A relative change in CBF from the pre-stimulation baseline represents a widespread increase in evoked CBF, while the blue LED illumination (0.26 mW/mm2) was focally delivered. (d, e) Spatial extent of light intensity of blue LED illumination (black dot) and CBF responses (black line; averaged from 30 to 40 sec after the onset of stimulation) relative to the stimulated spot were compared in ChR2-astrocyte (d) and ChR2-neuron (e) mice. Dark gray areas represent the locations of two ROIs: the core (C) and periphery (P). The spot size of the blue LED illumination measured at full-width at half maximum (arrows) was 0.5 mm. The temporal dynamics of average changes in evoked CBF measured at the core (black) and periphery (gray) were compared. Photo-activation with 3 sec of blue LED illumination followed by 3 sec of yellow LED illumination was applied at time 0.
For experiments in which the vascular diameter was measured with two-photon microscopy, an instrumental mercury lamp (U-HGLGPS, Olympus Corporation, Tokyo, Japan) installed in the microscope was used to activate ChR2 for 3-sec duration within a field of view (1024 × 300 pixels at a pixel resolution of 0.5 µm/pixel) through a band-pass filter of 470–490 nm with an average power of 0.26 mW/mm2 (under the objective lens). Those blue light stimuli were assumed to reach mostly upper cortical layers, because transmission of blue light was reduced 50% and 90% at 0.1 mm and 1 mm, respectively, through the mouse cortex. 32
Laser speckle flowgraphy
Dynamic spatiotemporal changes in CBF were monitored with LSFG (LSFG-micro, Softcare, Fukuoka, Japan) over the left hemisphere of the cortex (field of view: 600 × 560 pixels) as described previously. 27 For this experiment, the skin on the head of the animals was cut along the midline to expose the both right and left sides of the frontal and parietal bones. The emission light was an 830-nm LED (a mean output power of 12.4 mW), and a diffuse reflection of the speckle pattern was captured by focusing the light on the cortical surface vasculature with a CCD camera at a rate of 30 frames per sec.
The raw image was converted to an image of a mean blur rate (MBR) using LSFG Analyzer (Version 3.1.18.0, Softcare). 33 The MBR images were then resized to 300 × 280 pixels, and a map of the CBF response was created by calculating average changes in MBR for 10 sec, including the peak time where the response reached a plateau level (i.e., typically observed 10–40 sec after the photo-stimulation; Figure 1(d) and (e)), divided by pre-stimulus baseline (a mean of 20 sec before onset of the stimulation). For visualization purposes, a Gaussian filter (a kernel size of 7 × 7) was applied to the map of the evoked CBF, and a line profile of the pixel intensity along the cross-section over the center of the stimulated spot was measured from 0 to 180 degrees with a rotation of 1 degree. The intensity profiles were then averaged to generate a single line profile for comparison with intensity profiles of the blue LED illumination. A spatial extent of CBF response was defined as a full width at half maximum of the averaged line profile. Temporal dynamics of the CBF response were compared by calculating the mean values of relative changes in MBR signals for a circular ROI (region of interest) at the core (0.5 mm in diameter around the center of the stimulation spot, n = 735 pixels) and at the periphery (a distance ranging from 1.5 to 2.0 mm from the center of the stimulation spot, n = 21025 pixels; see Figure 1(a)). The magnitudes of CBF responses were quantified by averaging the relative changes in MBR values for 10-sec post-stimulus periods over the pixels within each ROIs.
Two-photon microscopy
Diameter responses of the cerebrovasculature were measured with a two-photon laser scanning fluorescence microscope (FV1200 MPE, Olympus Corporation) equipped with a Ti:sapphire laser (80 MHz, Mai Tai HP, Spectra-Physics, Santa Clara, CA, USA) set at 910 nm. A portion of the animal’s skull (approximately 3 mm in diameter) above the left hemisphere at the parietal bone was removed. Before the initiation of the imaging experiments, 50 µL of sulforhodamine 101 (10 mM in saline; Sigma, Japan) were intraperitoneally injected to label blood plasma. 34 Images (1024 × 300 pixels with a pixel resolution of 0.5 µm/pixel) of the vasculature and YFP-expressing cells were concurrently captured through an objective lens (XLPlaN25 × 1.05 WMP, Olympus Corporation) with band-pass filters (FV10-MRG/R, Olympus Corporation) of 575–630 nm and 495–540 nm, respectively.
Pre-stimulation baseline images were captured for 50 sec (a total of 10 images at each depth ranging from 0 to 400 µm from the cortical surface with a step size of 100 µm and an inter-frame interval of 5 sec). Post-stimulation images were captured for 150 sec (i.e., a total of 30 images at each depth with an inter-frame interval of 5 sec), immediately after the cessation of the photo-stimulation (approximately 2–3 sec). The measurements were repeated 3–5 times at each location with an interval of approximately 5 min. One to 12 locations (i.e., one to 12 vessels) were measured in each animal, while avoiding large vessel (>0.07 mm in diameter) areas on the cortical surface
The images were analyzed with a custom-written code in MATLAB. A pre-stimulation baseline image was generated by averaging the time-series images over 10 frames (i.e., 50 sec) of the pre-stimulation period, and a post-stimulation image was generated by averaging 3 frames (i.e., 15 sec) of the post-stimulation period, including the peak time (i.e., typically observed within 40 sec from the photo-stimulation). Binarized images were generated with a cutoff threshold at 60% of the signal (the mean intensity of the vessel centers)-to-noise (i.e., a background intensity) ratio to measure the vessel diameters. The diameters of the vessels located on the cortical surface (i.e., lying in parallel with the scanning directions) were manually measured by drawing a cross-section line at 5 random sites in each vascular segment, and values recorded along the segment were averaged. The diameter of the perforating vessels (i.e., extending into the parenchyma perpendicular to the cortical surface) was recorded at the minor axis of the elliptic approximation that was applied to the cross-section of the vessels in the image. 35 A relative change in the vessel diameter was calculated by dividing the post-stimulation diameter by the pre-stimulation diameter. In each animal, diameter responses of three types of the arteries: surface pial artery (SA), terminal artery (TA) just branched off from the SA, and penetrating arterioles (PA), were compared. The total numbers of vessels measured were as follows: n = 25, 25, and 40 vessels for SA, TA, and PA, respectively in the ChR2-astrocyte mice (N = 5 animals), and n = 18, 28, and 27 vessels, respectively, in the ChR2-neuron mice (N = 6 animals).
For YFP density measurements, a shading correction filter was first applied to normalize the inhomogeneity of the imaging signals in each XY image, and k-means clustering was applied to classify the pixel intensity distributions into 4 or 5 classes. The top 2 classes (high intensities) were then assigned to a cluster of the YFP signals, and an area density was measured by dividing a total area of the pixels showing YFP expression by the area of the field of view to normalize the area density in each image.
Pharmacology
A portion of the animal’s skull (3–4 mm in diameter) was removed and a small section of the dura was resected to enable the topical application of the drugs onto the cortical surface. Before opening the skull, CBF responses to photo-stimulation (0.05 mW) were measured with LSFG, and a craniotomy was conducted in a dark room under orange light to minimize unnecessary photo-activation of ChR2 during the surgery. After completing the surgery, the animal was stabilized for 1–2 hours and the CBF was monitored using LSFG. Then, the CBF response to photo-stimulation was re-evaluated at the location measured in the pre-surgery recording, and compatible CBF responses with the pre-surgery measurements were ensured.
A small volume (0.08–0.10 mL) of the drugs was topically applied over the areas of photo-stimulation and post-treatment measurements of the CBF responses were performed every 5–15 min until 90–120 min after the treatment. The CBF responses at the time when the maximum suppressive effects were found after drug application were compared with the pre-treatment measurements. Once the CBF responses returned to the pre-treatment level, the cortical surface was washed out with warmed saline, and the next drug was applied. A maximum three drugs was tested with a random order of drug application in each experiments. If the responses did not recover or the baseline CBF (measured with LSFG) was altered (approximately 20%), the experiments were terminated. Nine drugs were selected based on previous studies and a meta-analysis of the pharmacological perturbation of neurovascular coupling. 36 The drugs (concentration, number of the animals tested for ChR2-astrocyte and ChR2-neuron experiments, and time periods used for post-treatment measurements after the drug administration) tested were as follows: a metabotropic glutamate receptor antagonist 2-methyl-6-(phenylethynyl)pyridine (MPEP; 0.1 mM dissolved in saline, N = 8 and 6, for 20–40 min, Tocris Bioscience, Bristol, UK), a gap junction blocker carbenoxolone (CBX; 0.1 mM in saline, N = 6 and 6, for 20–30 min, Sigma-Aldrich, St. Louis, MO, USA), an inward rectifier potassium (Kir) channel blocker barium chloride (BaCl2; 0.5 mM in saline, N = 8 and 4, for 7–30 min, Yoneyama Yakuhin Kogyo Co., Ltd., Osaka, Japan), a N-methyl-D-Aspartate (NMDA) receptor blocker MK801 (0.1 mM in saline, N = 3 and 4, for 20–40 min, Sigma-Aldrich), a muscarinic acetylcholine receptor blocker atropine (0.02 mM in saline, N = 3 and 4, for 20–40 min, Sigma-Aldrich), a sodium channel blocker tetrodotoxin (TTX; 0.02 mM in saline, N = 4 and 8, for 10–30 min, Nacalai Tesque Inc., Kyoto, Japan), a potent inhibitor of prostaglandin synthesis indomethacin (Ind; 0.5 mM in saline, N = 5 and 5, for 10–60 min, INDACIN® IV, Merck Banyu Co., Ltd., Tokyo, Japan), a nonspecific nitric oxide synthase inhibitor N-(ω)-nitro-L-arginine methyl ester (L-NAME; 2 mM in saline, N = 4 and 6, for 10–33 min, Cayman Chemical Company, Ann Arbor, MI, USA), and a voltage-gated potassium (BK) channel blocker paxilline (Pax; 1 µM in saline, N = 4 and 5, for 30–40 min, Sigma-Aldrich).
Statistics
Data are presented as the means ± standard deviations for the animals measured (if not specified). Because of small number of sample sizes (less than 8 animals for each conditions) required in the present study, the normality of the data were confirmed by comparing the values of mean and median in each measurements that showed equivalent values. Statistical significance (p < 0.05) was determined using paired and unpaired Student’s t-test for comparisons between pre-treatment and post-treatment data of the same animal groups in pharmacological experiments and the measurements between two animal groups of ChR2-astrocyte and ChR2-neuron animals, respectively. For multiple comparisons, Dunnett’s test was performed for comparisons of the vasodilation and YFP densities between the measurements conducted at the parenchyma and cortical surface.
Results
Focal photo-activation was evident according to a reconstructed intensity map of the blue LED illumination (Figure 1(b)). In contrast, CBF responses were widely spread to nonstimulated periphery (Figure 1(c); ChR2-astrocyte activation). Cross-sectional profiles showed broad extension of the CBF responses in the both ChR2-astrocyte (Figure 1(d)) and ChR2-neuron mice (Figure 1(e)), compared to the intensity profiles of the blue LED whose average intensity was 0.25 ± 0.14% (N = 4) at the periphery relative to the maximum intensity in the core. Because the temporal dynamics of changes in CBF showed a similar time course at the core and periphery (Figure 1(d) and (e)), these responses were approximately coincident in the stimulated and nonstimulated cortex. Evoked increases in CBF eventually returned to pre-stimulation baselines for all stimulation conditions and in the both ChR2-astrocyte and ChR2-neuron mice, which is consistent with the previous studies. 27 , 28 The slow dynamics of CBF changes, compared to typically observed neurovascular couplings, could be partly due to long decay kinetic of step function opsin (i.e., approximately 100 sec for ChR2 (C128S). 37
First, the response amplitude and spatial extent of the CBF responses to photo-activation were compared in the ChR2-astrocyte (N = 5) and ChR2-neuron (N = 5) animals exposed to varying intensities of the blue LED. Exposure to a low intensity of the blue LED (0.005 mW/mm2) did not produce detectable changes in CBF in both animal models (Figure 2(a)). As the intensity increased from 0.025 to 2.5 mW/mm2, the responses of evoked CBF nonlinearly increased and were widely spread to the nonstimulated periphery (Figure 2(a)). The spatial profiles of the evoked CBF showed the higher peak amplitude of CBF response elicited with an increase in power of photo-stimulation in the ChR2-neuron mice, but wider responses were evident in the ChR2-astrocyte mice (Figure 2(b)) A quantitative comparison of the response amplitude showed 21–28% larger responses for ChR2-neural activation at the core (p < 0.05, Figure 2(c)). Nevertheless, equivalent spatial extent was observed for photo-activation of ChR2-neurons and ChR2-astrocytes (Figure 2(d)). Consequently, the spatial extent normalized by the peak amplitude of the CBF responses showed statistically significant higher spatial extent in the ChR2-astrocyte mice compared to the ChR2-neuron mice (Figure 2(e)). Based on these findings, the spatial extent of the CBF responses varied, depending on the type of the brain cell activated.
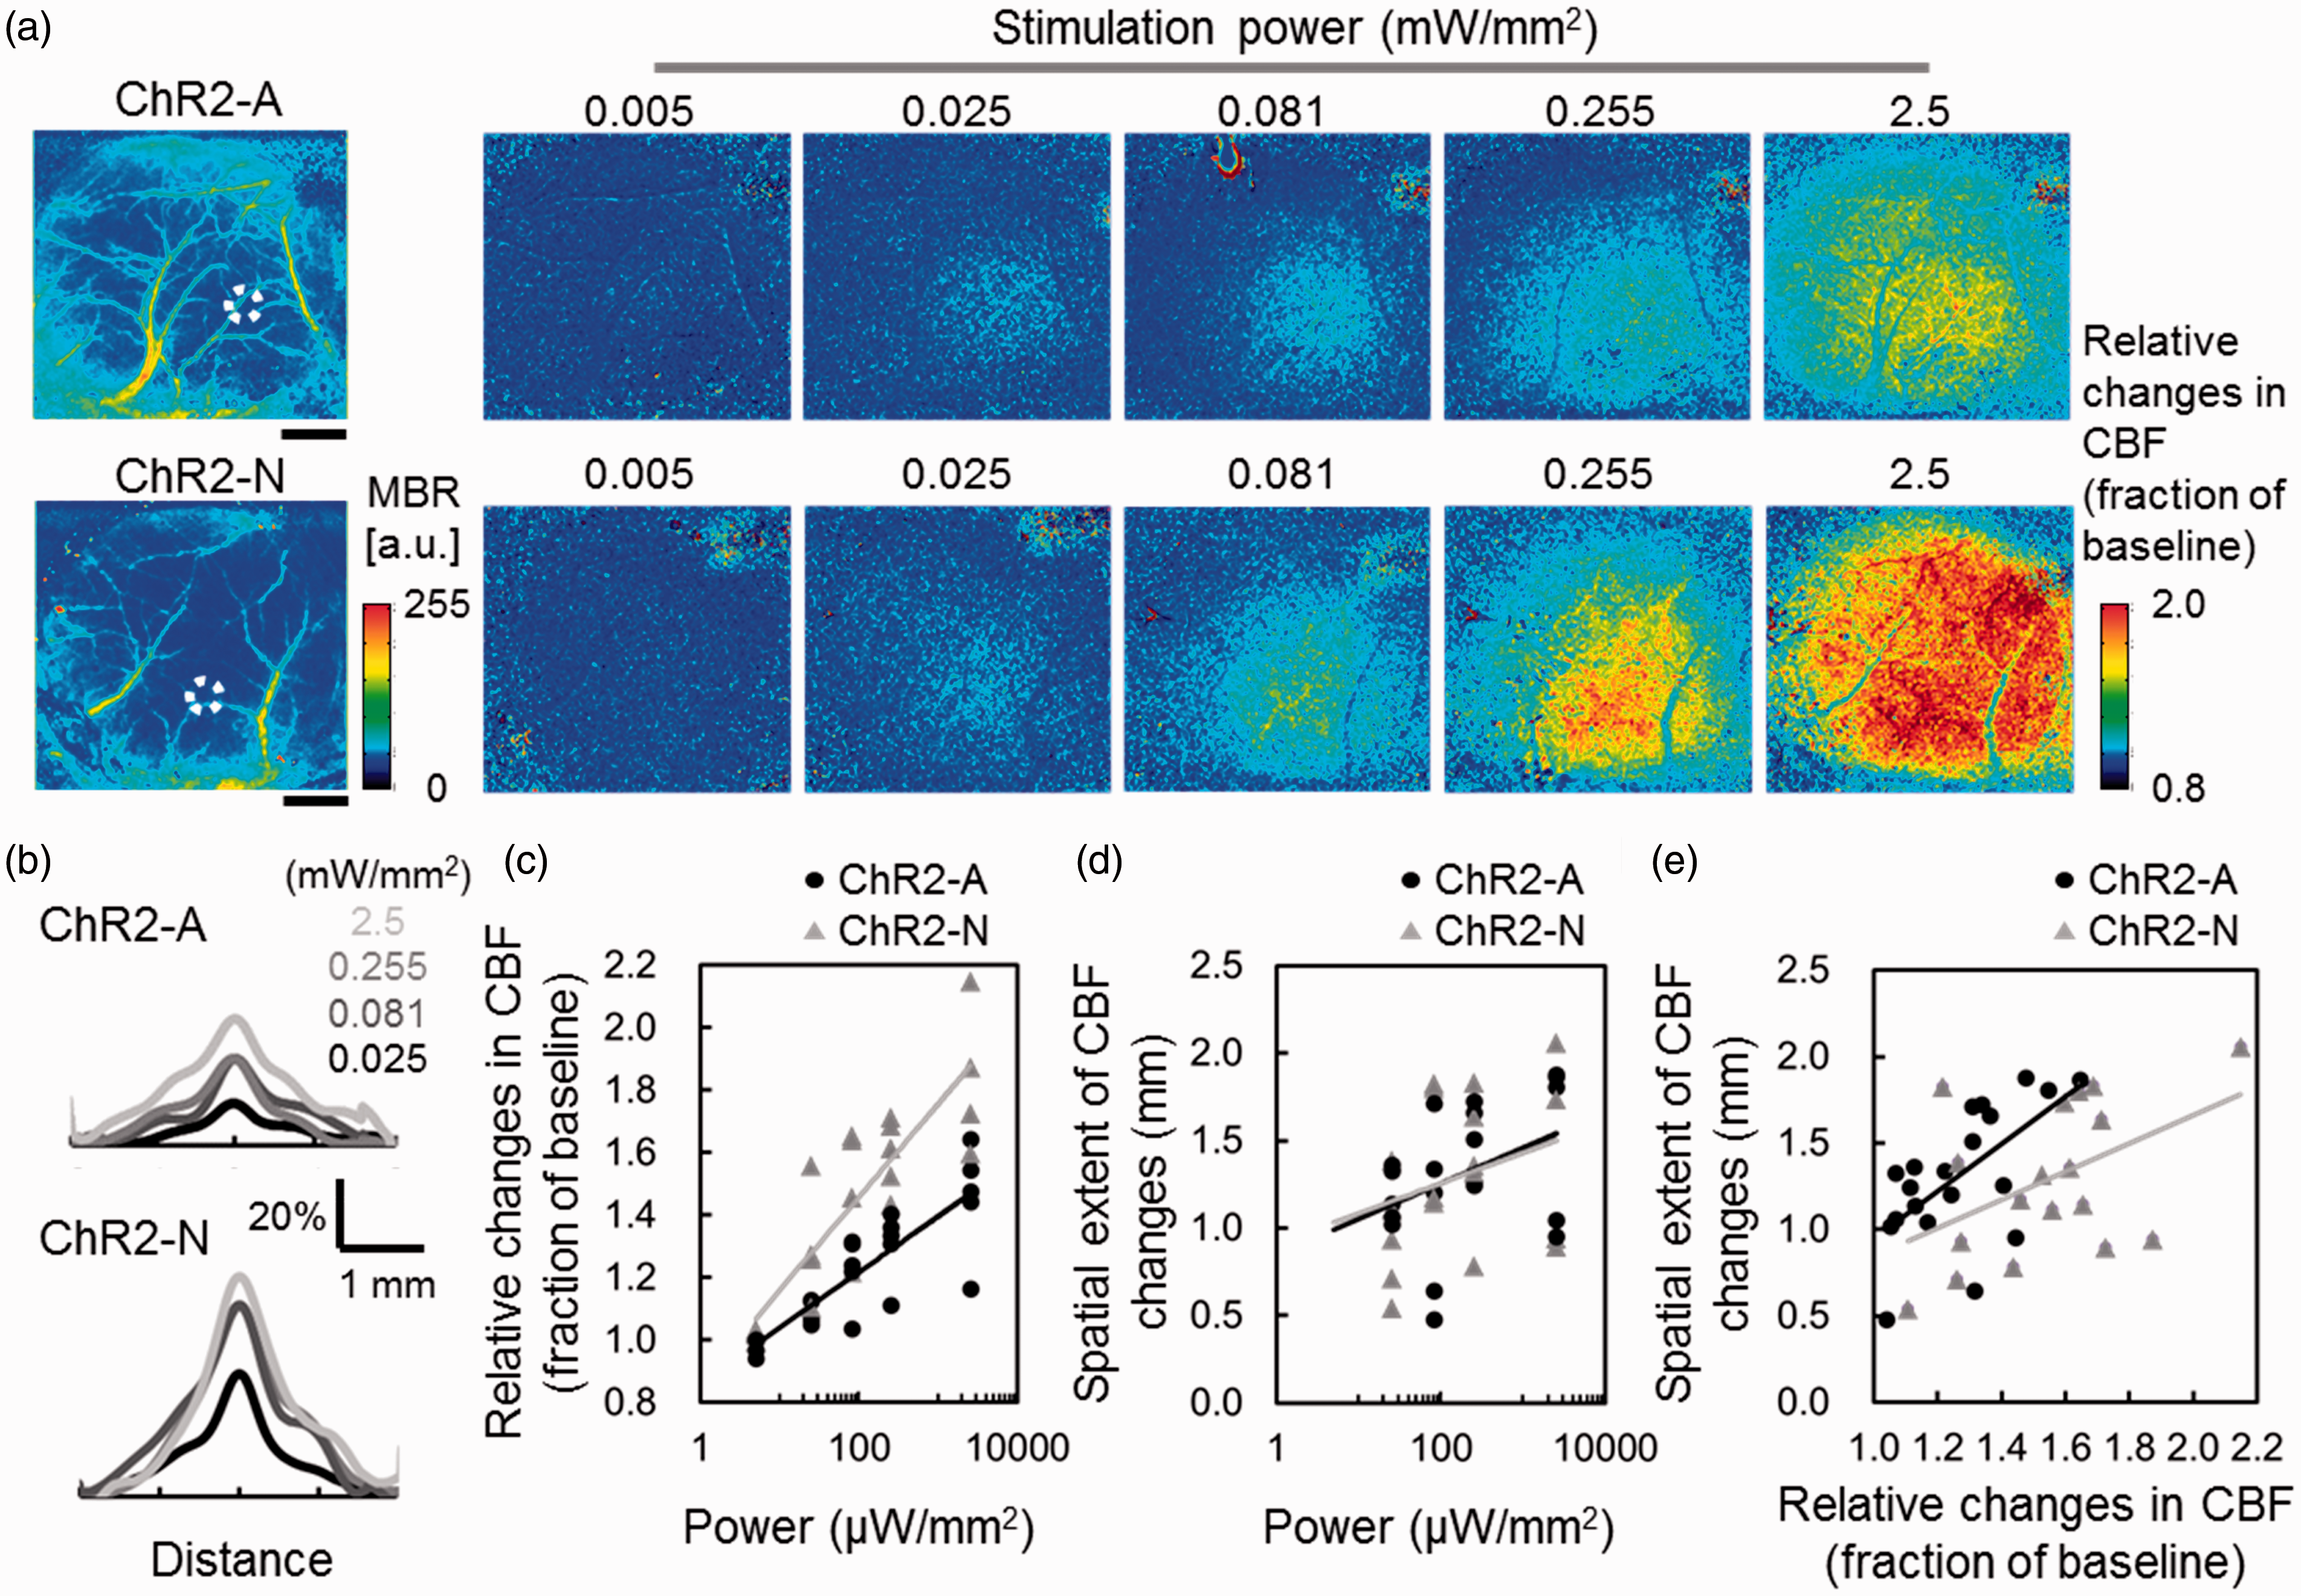
Comparisons of response amplitude of CBF responses and their spatial extent with changes in the power of photo-activation. (a) Representative results of LSFG measurements with varying intensities of blue LED illumination. Upper panels show the results of the representative ChR2-astrocyte mouse (ChR2-A), and lower panels show results from the ChR2-neuron mouse (ChR2-N). The locations of photo-activated regions are depicted on the pre-stimulation baseline images of LSFG (white dots, left panel). The color scale shows a mean blur rate (MBR). Photo-activation with 0.005 mW/mm2 did not result in detectable changes in CBF. The evoked CBF responses and their spatial extent were monotonically increased as the intensity increased over the range of 0.025–2.5 mW/mm2. Scale bar: 1 mm. (b) Comparison of spatial profiles of CBF responses between ChR2-astrocyte (ChR2-A, upper) and ChR2-neuron (ChR2-N, lower) mice. Individual lines indicate the average responses of evoked CBF over all animals, and the color indicates different power of photo-stimulation. With an increase in photo-stimulation, a higher peak amplitude was observed for ChR2-neuron mice, whereas a broader response was evident in ChR2-astrocyte mice. (c) Quantitative comparisons of the response amplitude measured at the stimulated core. The response amplitude nonlinearly increased as the power of photo-activation increased. Photo-activation of ChR2-neurons (gray triangle, N = 5 animals) showed consistently larger responses (p < 0.05) relative to ChR2-astrocyte activation (black circle, N = 5 animals). A regression line: Y = 0.13 LN (X) + 0.86 and Y = 0.08 LN (X) + 0.86 for ChR2-neuron and ChR2-astrocyte, respectively. (d) Comparisons of the spatial extent of the CBF responses. For all stimulation power, equivalent spatial extent was observed between ChR2-astrocyte (black circle) and ChR2-neuron (gray triangle) mice. A regression line: Y = 0.08 LN (X) + 0.91 and Y = 0.09 LN (X) + 0.85 for ChR2-neuron and ChR2-astrocyte, respectively. (e) Relationship between the peak amplitude of CBF responses and their spatial extents. Significantly higher spatial extent (p < 0.05) normalized by the peak amplitude was consistently observed for ChR2-astrocyte activation (black circle) compared to ChR2-neuron activation (gray triangle). A plot indicates the mean response to each power of photo-stimulation in individual animals. A regression line: Y = 0.81 X + 0.03 and Y = 1.4 X – 0.4 for ChR2-neuron (R = 0.47, p < 0.05) and ChR2-astrocyte mice (R = 0.62, p < 0.05), respectively.
Next, cerebrovascular responses to the photo-activation of ChR2 were measured with two-photon laser scanning fluorescence microscopy (two-photon microscopy) in vivo to further probe the differences in the spatial extent of the CBF responses. Photo-activation of ChR2-astrocytes resulted in remarkable vasodilation of both pial and penetrating arteries (Figure 3(a)). Similar temporal dynamics were consistently observed for the vasodilation over the surface (SA), terminal (TA), and penetrating arteries (PA) (Figure 3(b)). Population data (N = 5 animals) showed the dilation of the surface pial arteries (SA) by 15 ± 13% relative to the baseline diameters (25 ± 5 µm). In the parenchyma, deeper PA (PA-4; a depth of 400 µm with a baseline diameter of 15 ± 3 µm) showed larger vasodilation (40 ± 16%) than PA1 (26 ± 15%), PA2 (24 ± 14%), and PA3 (32 ± 22%), which were measured at depths of 100, 200, and 300 µm (mean baseline diameters of 16 ± 3 µm, 16 ± 3 µm, 17 ± 3 µm), respectively. Statistically significant differences in the vasodilation of the penetrating arterioles were not observed compared to the pial arteries (p > 0.05; Dunnett’s test, Figure 3(c)).
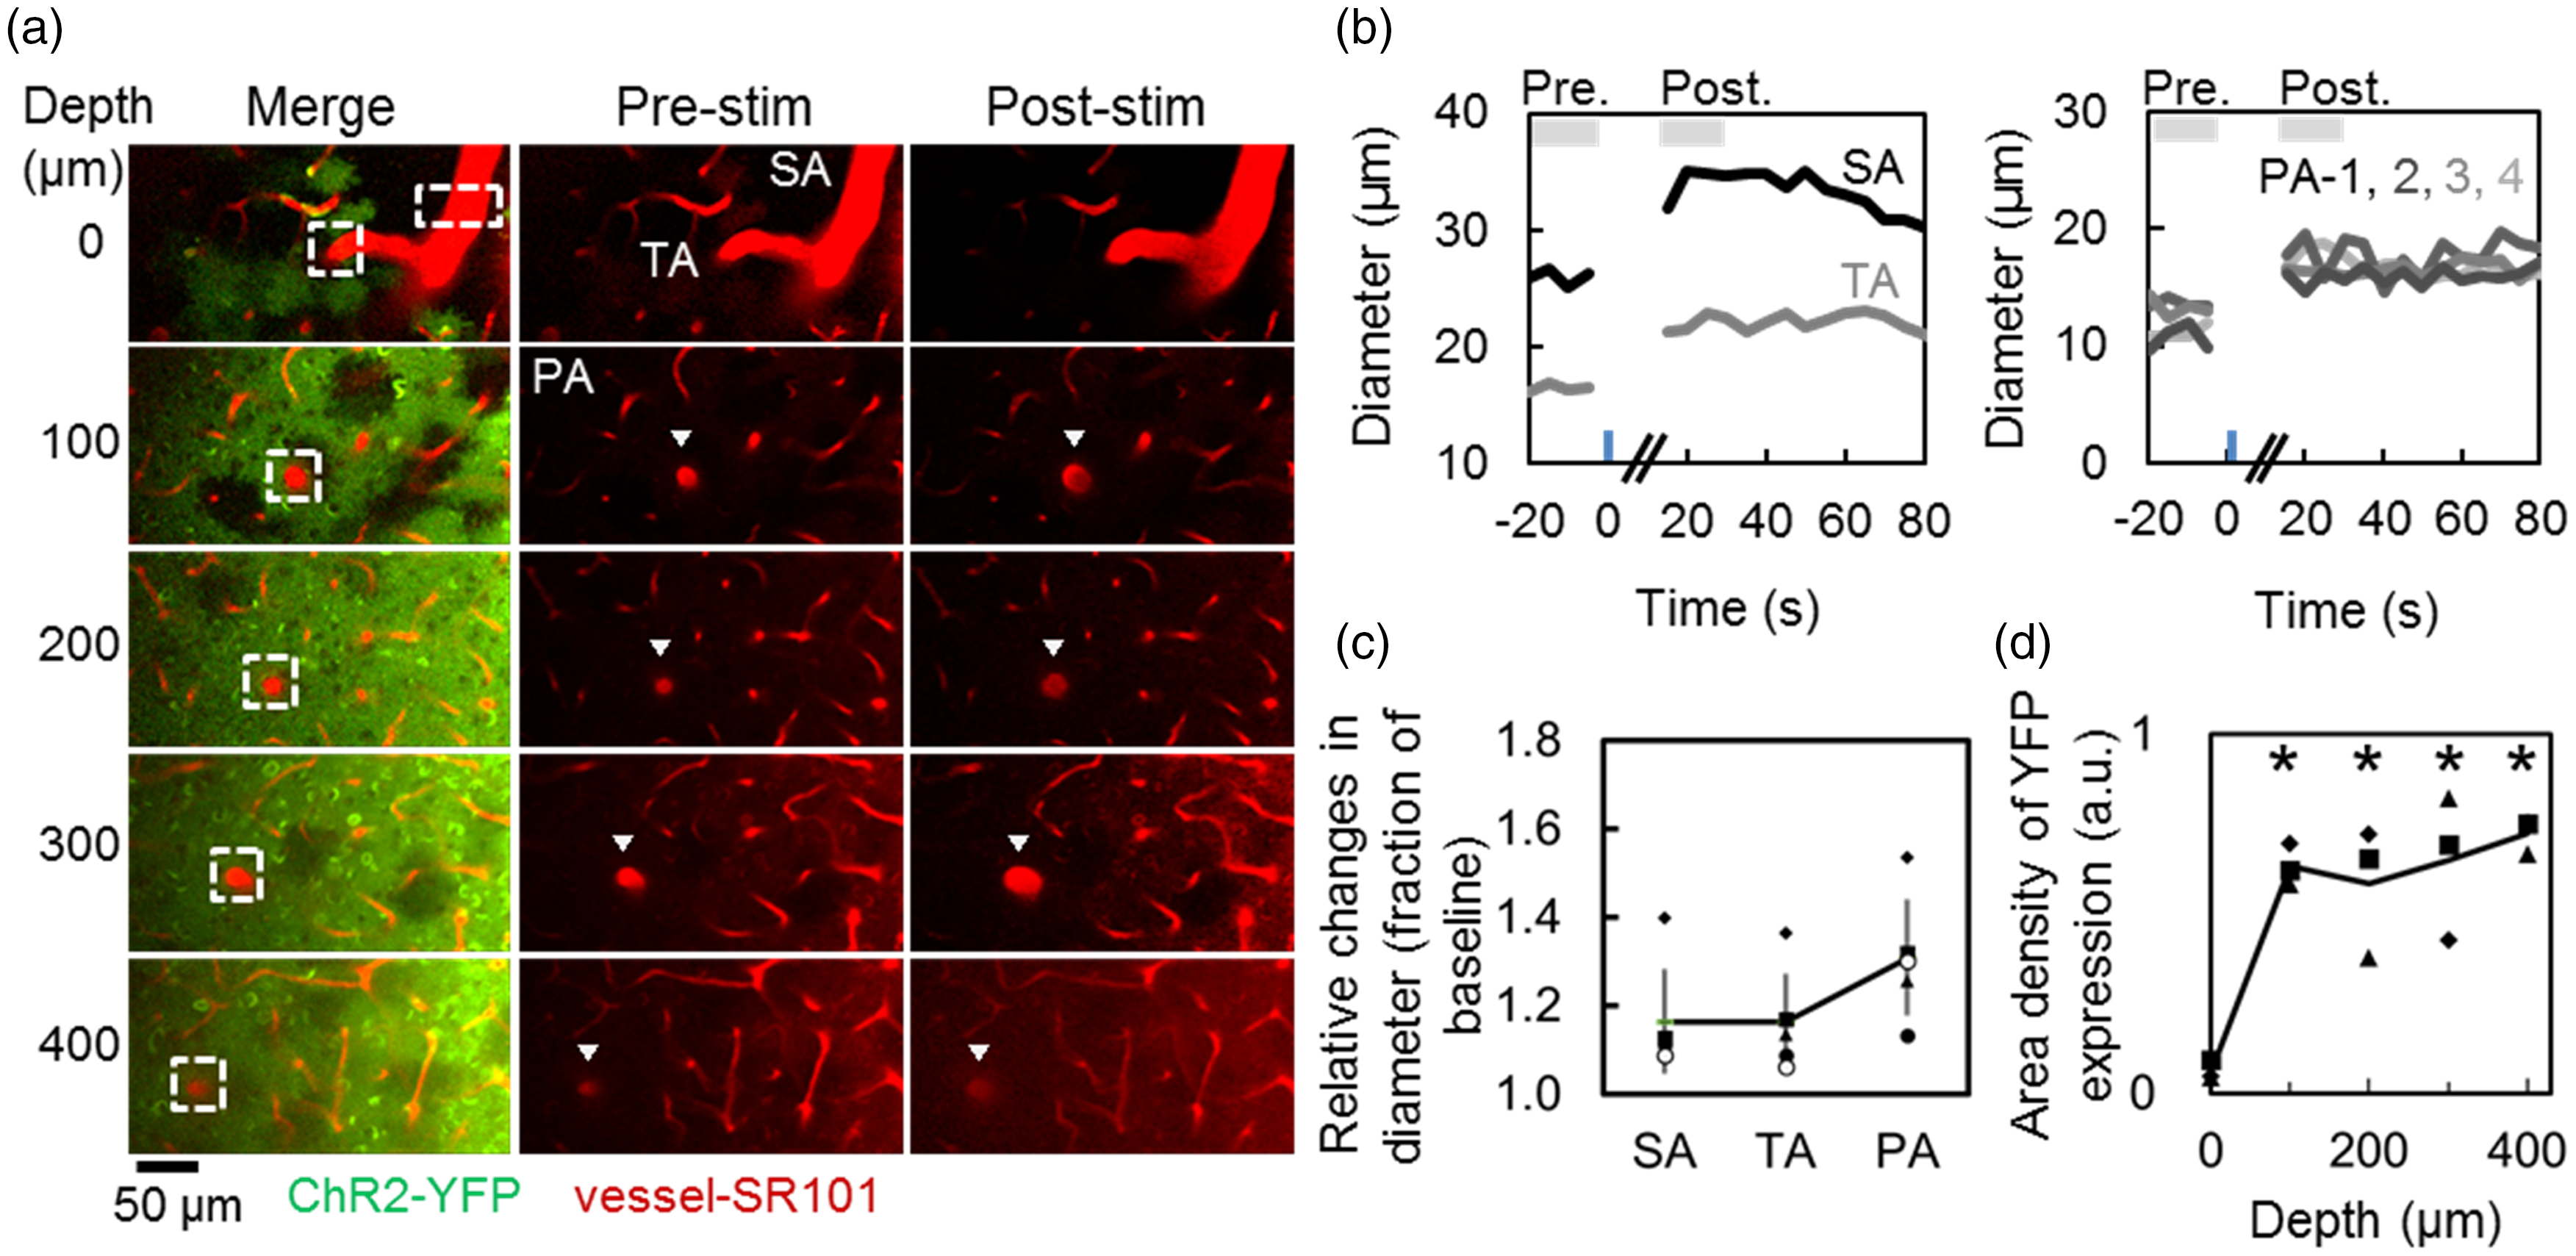
Changes in the diameter of cerebral arteries in response to the photo-activation of ChR2-astrocytes. (a) Representative two-photon microscopy images of YFP-expressing ChR2 (green) and sulforhodamine-101 (SR101) stained blood vessels (red) in the ChR2-astrocyte mouse. XYZ serial images were captured at depths of 0–400 µm with intervals of 100 µm from the cortical surface. A surface pial artery (SA) and terminal arteriole (TA) that enter the cortex (white rectangle) were identified at a depth of 0 µm (top panels), and the same penetrating arteriole (PA) was traced deeper in the cortex (white rectangle). Pre-stimulation baseline and post-stimulation images of the microvasculature were compared (center and right panels, respectively). All arteries (SA, TA, and PA) showed remarkable vasodilation (arrowheads) after photo-stimulation, whereas other microvessels remained unchanged. (b) Representative temporal dynamic responses of the arterial diameters shown in (a). The images were captured every 5 sec, and photo-activation was applied for 3 sec with an instrumental mercury lamp (470–490 nm, an average power of 0.26 mW/mm2) to the field of view at a depth of 0 µm without scanning to protect the photodetectors. Both the SA (black) and TA (gray) showed similar dynamic changes (left panel), which were also preserved in the responses of PA-1, 2, 3, and 4 measured at depths of 100, 200, 300, and 400 µm, respectively (dark to light gray, right panel). (c) Comparison of the changes in the diameter in response to the photo-activation of ChR2-astrocytes (N = 5 animals). Statistically significant differences in the vasodilation of the penetrating arterioles and the pial arteries were not observed (p > 0.05; Dunnett’s test). Each symbols represent the same animal results in this animal group. (d) Comparison of YFP-expressing ChR2 densities at various cortical depths. The area density of the YFP signals (ChR2) was calculated in each image using a k-means classification method. The area density of the ChR2-positve astrocytes showed statistically significant differences (*p < 0.05; Dunnett’s test) in the cortical surface relative to the parenchyma measured at depths of 100–400 µm (N = 3 animals).
In contrast, photo-activation of ChR2-neurons led to relatively small vasodilation of the surface pial arteries (Figure 4(a)), and variable temporal dynamics of the vasodilation of the penetrating arterioles over cortical layers (Figure 4(b)). Population data (N = 6 animals) consistently showed a small amount of vasodilation (9 ± 3%) of the SA (26 ± 6 µm in diameter), even compared to the vasodilation (29 ± 16%) of the TA (17 ± 4 µm in diameter) that directly branched off from the SA. In the parenchyma, robust vasodilatory responses occurred in the penetrating arterioles, with a mean value of 35–42% relative to the baseline diameters (mean baseline diameters of 14 ± 3 µm, 15 ± 3 µm, 16 ± 4 µm, and 15 ± 4 µm at depths of 100, 200, 300, and 400 µm, respectively). Statistically significant differences in the vasodilatory responses of the penetrating arterioles were detected, compared to the pial arteries (p < 0.05; Dunnett’s test, Figure 4(c)).
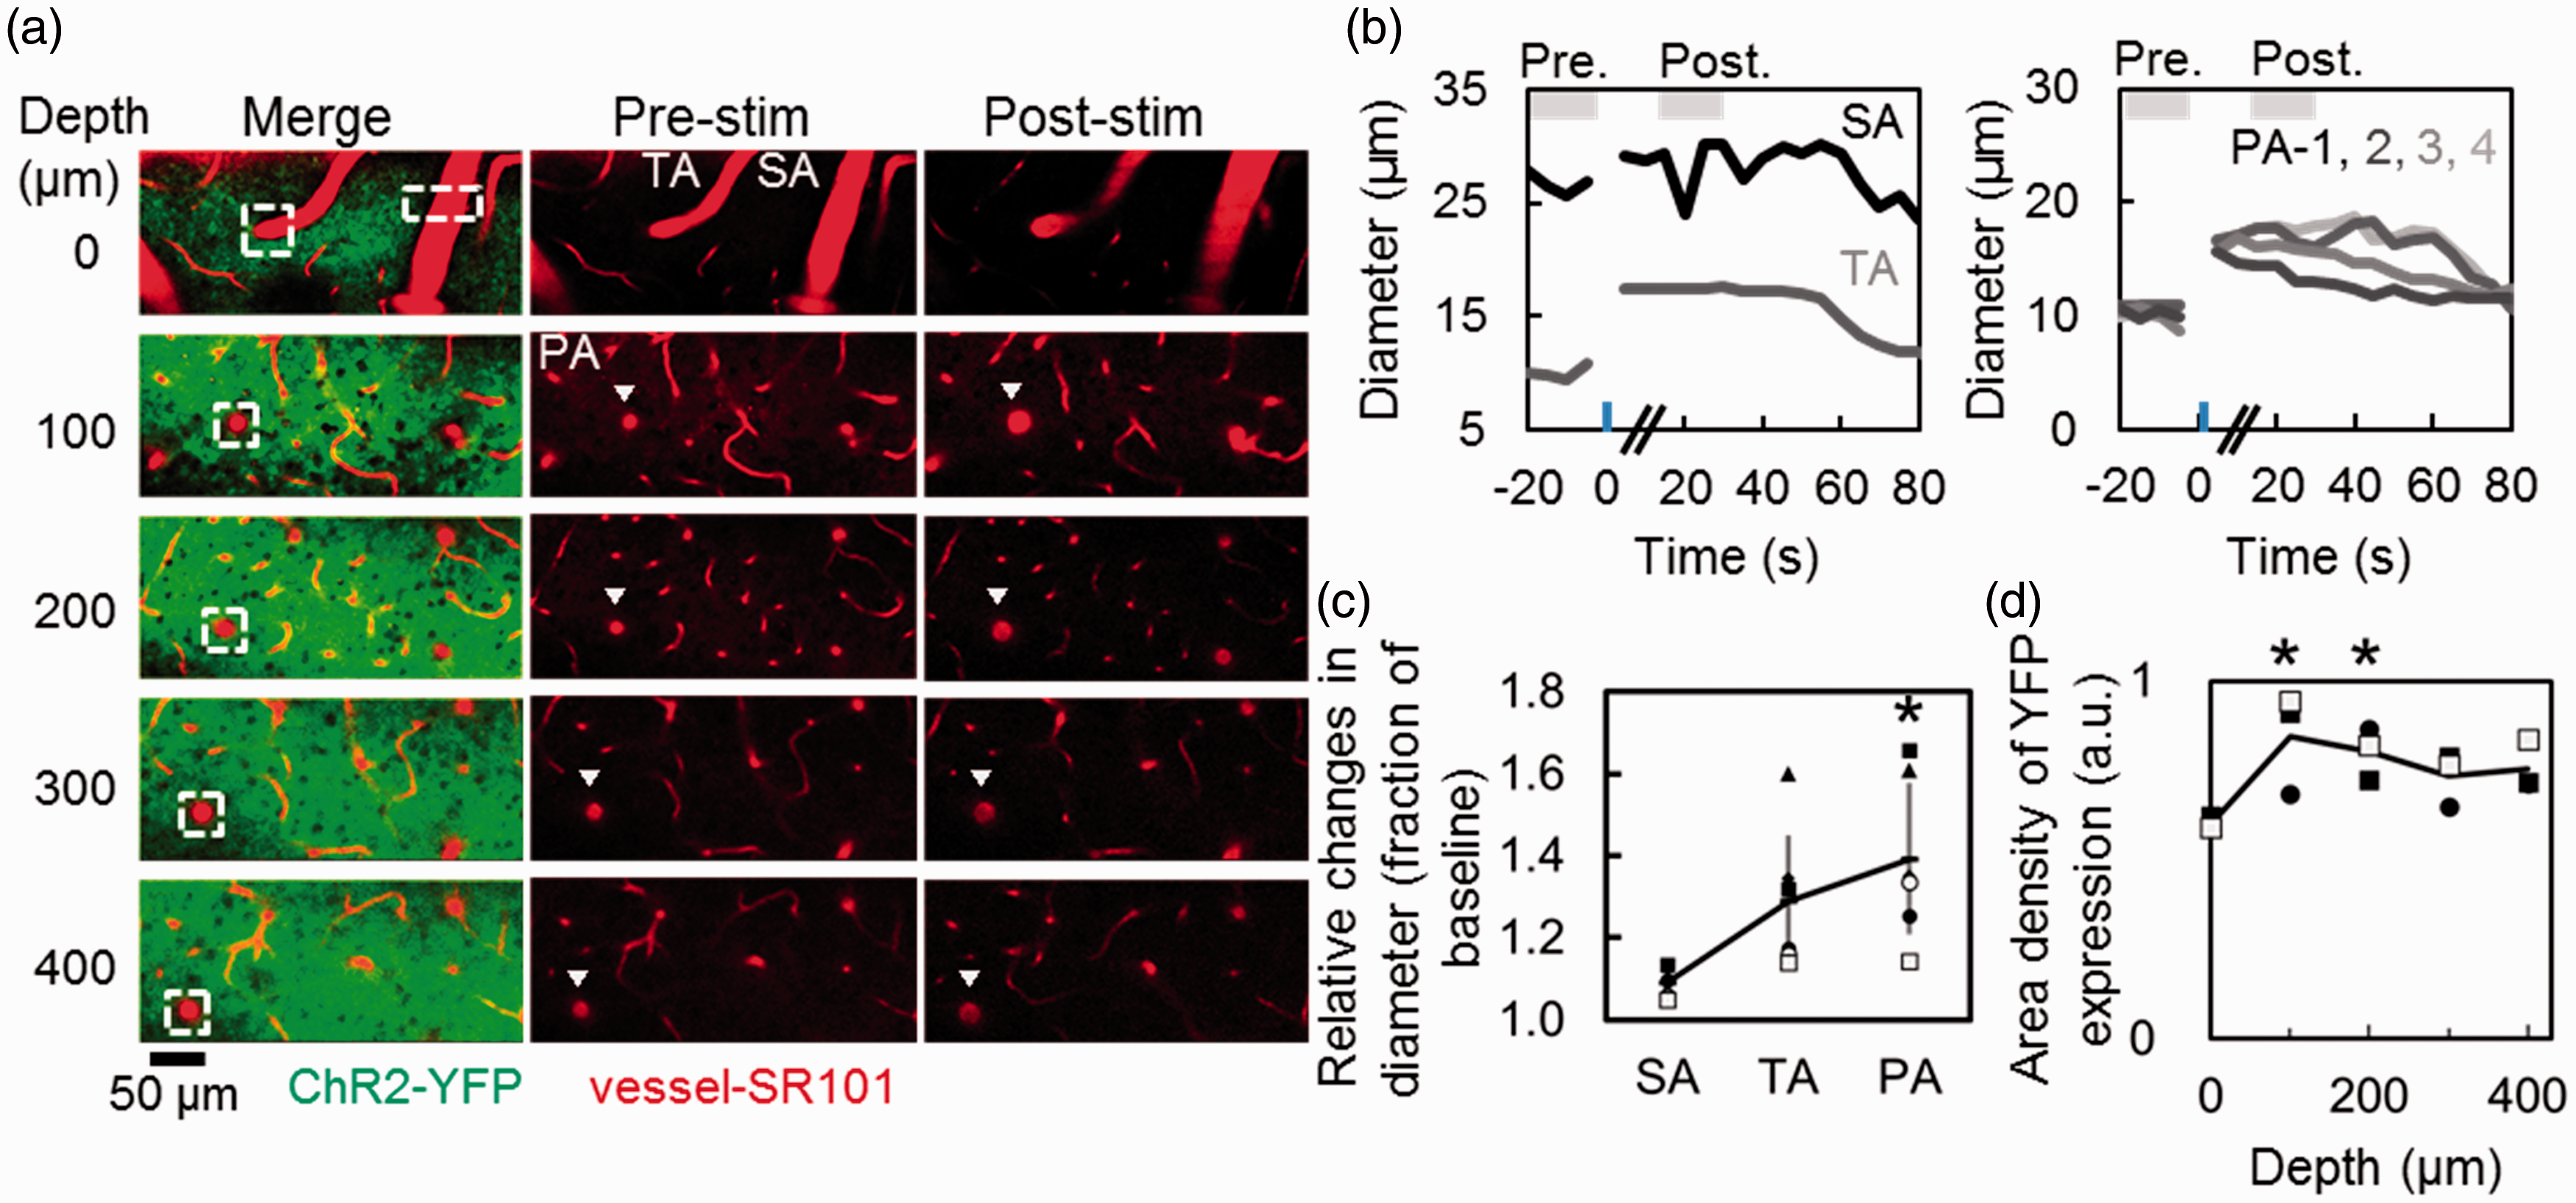
Changes in the diameters of cerebral arteries in response to the photo-activation of ChR2-neurons. (a) Representative two-photon microscopy images of YFP-expressing ChR2 (green) and sulforhodamine-101 (SR101) stained blood vessels (red) in the ChR2-neuron mouse. As shown in Figure 3, a surface pial artery (SA) and terminal arteriole (TA) that enter the cortex (white rectangle) were identified at a depth of 0 µm (top panels), and the same penetrating arteriole (PA) was traced deeper in the cortex (white rectangle). Remarkable vasodilation of the PA was observed after photo-stimulation (arrowheads). (b) Representative dynamic temporal responses of the arterial diameters shown in (a). The images were captured every 5 sec, and photo-activation was applied with 3 sec of illumination with an instrumental mercury lamp (470–490 nm, an average power of 0.26 mW/mm2). In contrast to the ChR2-astrocyte activation, changes in the diameters of the SA (black) were small, while the TA (gray) showed substantial vasodilation (left panel). Additionally, temporal dynamics of the changes in the diameters of PAs varied, depending on the depths at which they were measured; PA-1, 2, 3, and 4 were measured at depths of 100, 200, 300, and 400 µm, respectively (dark to light gray, right panel). (
Different contributions of pial and penetrating arteries during photo-stimulation to ChR2-asrocytes and ChR2-neurons were evident (Figure 5). Namely, photo-activation of ChR2-astrocytes resulted in 1.8 ± 0.6 fold larger responses of the penetrating arteries than the pial arteries, whereas ChR2-neural stimulation led to 4.4 ± 2.5 fold larger responses in the penetrating relative to pial arteries (p < 0.05, Figure 5(c)). The observations of the different degrees of vasodilation might be attributed to different populations of the ChR2-expressing cells. An area density of the YFP-signals (ChR2) was compared in each two-photon microscopy image using a k-means classification method to test this possibility. ChR2-positve astrocytes were sparsely distributed along the cortical surface (a relative area of 0.06 ± 0.02 [a.u.] within the FOV, N = 3 animals, Figure 3(d) and Supplementary Figure S2) compared to the parenchyma (a mean of 0.59–0.72 [a.u.], p < 0.05; Dunnett’s test). On the other hand, a relatively high density of ChR2-positive signals, including neuropil, was observed from the surface to a depth of 400 µm. Statistically significant differences in the neural YFP density were detected at a depth of 100 µm and 200 µm (0.85 ± 0.12 and 0.80 ± 0.06 [a.u.], respectively, N = 3 animals, Figure 4(d) and Supplementary Figure S2) compared to the surface (0.60 ± 0.02 [a.u.], p < 0.05; Dunnett’s test). Based on these results, the layer-dependent variations in the vasodilation and YFP density were not identical in the ChR2-neuron and ChR2-astrocyte animals.
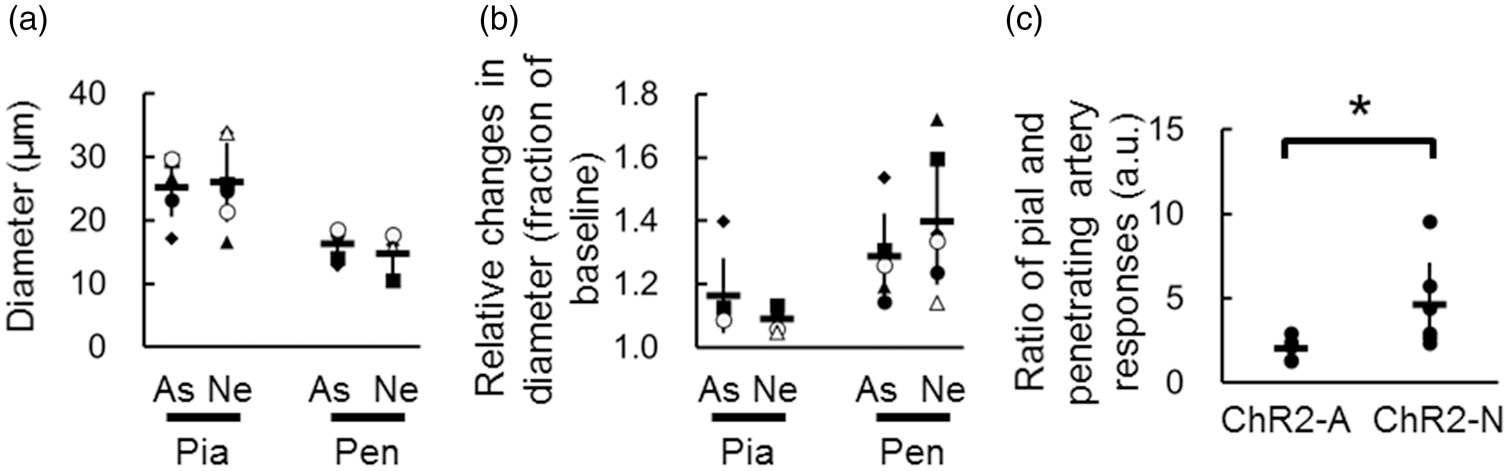
Comparison of the pial and penetrating arterial vasodilation. (a) Pre-stimulation baseline diameters of pial (Pia) and penetrating (Pen) arteries (averaged over depths of 100–400 µm) measured in ChR2-astrocyte (As) and ChR2-neuron (Ne) mice. Each symbols represent the same animal results in the animal groups shown in Figures 3(c) and 4(c). (b) Relative changes in diameters induced by photo-stimulation. (
Finally, drugs were topically applied onto the cortical surface after a portion of the skull and dura were removed under urethane anesthesia to pharmacologically inhibit the CBF responses to photo-activation. CBF responses to photo-activation of ChR2-astrocytes were significantly suppressed (p < 0.05, paired t-test, pre- vs. post-treatment, Figure 6) by the topical administration of MPEP (46 ± 31% reduction relative to the pretreatment response), CBX (71 ± 19%), BaCl2 (43 ± 23%), and MK801 (45 ± 17%). However, these drugs did not exert significant effects (p > 0.05) on the responses to ChR2-neuron activation (Figure 6). On the other hand, CBF responses to the photo-activation of ChR2-neurons were significantly suppressed by atropine (45 ± 20%), TTX (49 ± 24%), Ind (41 ± 26%), L-NAME (52 ± 30%), and Pax (55 ± 21%), whereas significant effects on ChR2-astrocyte activation were not detected after treatments with these drugs (Figure 6). Because these pharmacological inhibition assays were conducted with the same protocols in all experiments, the observed differences between those two animal groups (ChR2-neuron vs. ChR2-astrocyte; see also Supplementary Figure S3) support the findings that cell type-specific vasoactive pathways participate in the cerebrovascular responses to photo-activation.
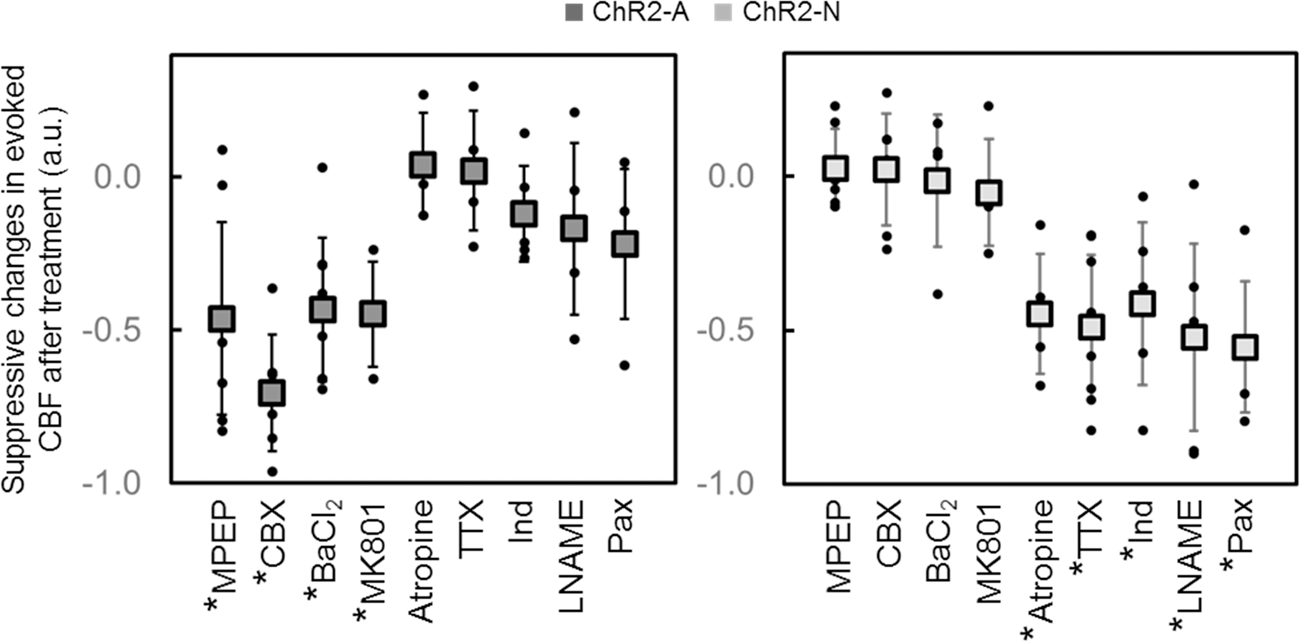
Pharmacological inhibition of the CBF responses to photo-activation support the findings that different vasoactive pathways were involved in a cell type-specific manner. CBF responses to the photo-activation of ChR2-astrocytes (ChR2-A, dark gray) were significantly suppressed (*p < 0.05, paired t-test, pre- vs. post-treatment) by topical application of MPEP, carbenoxolone (CBX), barium chloride (BaCl2), and MK801, although these drugs did not exert significant effects (p > 0.05) on the responses to ChR2-neuron activation (ChR2-N, light gray). The CBF responses to the photo-activation of ChR2-neurons were significantly suppressed by atropine, tetrodotoxin (TTX), indomethacin (Ind), L-NAME, and paxilline (Pax), whereas significant effects on the CBF responses to ChR2-astrocyte activation were not detected after treatments with these drugs. Error bar: standard deviation.
Discussion
As shown in the present study, transcranial photo-activation of ChR2-astrocytes led to a widespread increase in CBF that extended to the nonstimulated periphery, whereas photo-activation of ChR2-neurons resulted in a relatively localized increase in CBF (Figure 2). The differences in the spatial extent of the CBF responses were partially due to different sites of action of vasodilation (i.e., pial and penetrating arteries; Figure 5). The results of pharmacological inhibition assays further support the findings that pial and penetrating arterial vasodilation mechanisms are differentially evoked by photo-activation in a cell type-specific manner (Figure 6).
Photo-activation of ChR2-astrocytes induced vasodilation of both pial and penetrating arteries (Figure 3), consistent with well-known reactions of the cerebral arteries in the neurovascular coupling. Previous studies have consistently shown that sensory stimulation induces dilation of the penetrating arterioles in the activation foci and dilation of the pial arteries extending to surrounding regions of the rodent somatosensory cortex. 24 ,38–41 The latter spreads along the arterial networks on the cortical surface via endothelial pathways and vascular gap junctions. 40 , 41 Our results showing the suppression of CBF responses by CBX, a gap junction inhibitor, are consistent with those previous findings. Namely, the findings indicate that the CBF response to ChR2-astrocyte activation involves conducted vasodilation. BaCl2, an inhibitor of inwardly rectifying potassium (Kir) channels, also significantly suppressed the responses, further indicating the involvement of the Kir channel-sensitive vasodilatory mechanisms. The both in vivo and ex vivo studies revealed that the vasodilation conducted through the penetrating arterioles was elicited by a local increase in the extracellular potassium concentration in vicinity of the vascular cells. 42 , 43 The astrocytic endfeet have been recognized as an ideal source of the local efflux of potassium ions in the vicinity of the vascular cells responding to neural activity.44–49 The present results obtained with ChR2-astrocyte activation are consistent with these previous studies. Moreover, the present study and our previous studies 27 , 28 with photo-activation of astrocytes exclude neurogenic vasodilation mechanisms. The suppression of neural action potentials by TTX did not exert detectable effects on the CBF responses to ChR2-astrocyte activation. A lack of detectable changes in cortical electrophysiology (i.e., local field potential and spiking activity) has also previously been reported for photo-activation of ChR2-astrocytes. 28 Because MPEP and MK801, antagonists of glutamate receptors, also exerted suppressive effects on the evoked CBF responses, possible contributions of glutamate to the glial-endothelium pathways need to be considered in future studies.
Photo-activation of ChR2-neurons via the cholinergic receptor muscarinic 4 was observed to predominantly induce vasodilation of the penetrating arterioles (Figure 4). This animal model in which ChR2 was expressed in cortical neurons expressing cholinergic receptor muscarinic 4 was selected in the present study because of the well-known action site of vasodilation via cholinergic pathways in the penetrating arterioles, but less in the pial arteries. 50 , 51 Our previous study with in vivo two-photon microscopy revealed that electrical stimulation of cholinergic pathways in the basal forebrain selectively dilates the penetrating arterioles in the cortex, but not the pial arteries. 51 This localization of the vasodilation could be useful to access functional property of the penetrating arterioles without less influence on the pial arteries. Caution is needed when interpreting the present results of ChR2-neuron activation with respect to general mechanisms of neurovascular coupling (i.e., driven by glutamatergic pathways), because vasodilation mechanisms provoked by glutamatergic pathways are not necessarily the same as the vasodilation driven by the cholinergic pathway. Cholinergic vasodilation is shown to involve the activation of acetylcholine receptors and synthesis of nitric oxide. 52 , 53 The present results of the atropine- and L-NAME-induced suppression of CBF responses are consistent with this vasodilatory mechanism. The observed inhibitory effects on the CBF responses induced by the suppression of neural action potentials with TTX further support the neurogenic origins of vasodilatory mechanisms. However, our results do not exclude the contributions of other types of brain cells. According to Lecrux et al. (2012), 54 CBF responses to the activation of basal forebrain cholinergic fibers involve glutamate-releasing pyramidal cells, glutamatergic and GABAergic (γ-aminobutyric acid) interneurons, and metabolically active astrocytes containing vasoactive EETs (epoxyeicosatrienoic acids), but not COX-dependent pathways. 54 The results of the pharmacological inhibition experiments in the present study regarding ChR2-neuron activation are not completely consistent with those findings. The differences in the pharmacological results could be due to differences in manipulation of neural circuits, intensity of activation, anesthesia and animal strains etc. Because optogenetic manipulation directly caused depolarization of the cells (i.e., measured with a patch clamp technique 30 ) photo-activation of ChR2-neurons, used in the present study, augmented cortical electrophysiological activity independent of physiological connectivity. Future studies with optogenetic manipulation of specific neural circuits are further needed.
Although multiple types of brain cells participate in neurovascular coupling, specific vasoactive pathways may be selectively impaired under disease conditions. Chronic hypoxia impairs the activity-dependent vasodilation of the penetrating arterioles, but not the pial arteries. 24 A decrease in NO production impairs BK channel activity under hypoxia. 55 In the present study, paxilline, a specific BK channel inhibitor, suppressed the CBF responses to ChR2-neuron activation, indicating that this vasodilatory mechanism with ChR2-neuron activation involves BK channel activity. Considering the specificity of the cell type-dependent vasodilatory responses to photo-activation, the animal models presented here will be useful for identifying a potential therapeutic target for the dysfunction of the neurovascular coupling, such as under conditions of hypoxia/ischemia,21–24 hypertension, 56 , 57 diabetic mellitus, 58 brain trauma, 59 and Alzheimer’s disease. 60 , 61
A limitation of the present study is that optogenetic manipulation may not necessarily substitute for the physiological signaling mechanisms mediating neurovascular coupling such as investigated using sensory stimulation paradigms. In the present study, we maintained a low power of the photo-activation and ensured that the responses of CBF and vasodilation were within the physiological limits. Our protocols of photo-activation did not cause spreading depolarization 62 , 63 or any detectable changes in CBF in wild type animals, 27 because of the highly sensitive mutant of ChR2(C128S) used in the present study. 30 The level of sensitivity that triggered detectable changes in CBF was estimated to be approximately 0.01 mW/mm2 on the skull, which is three orders of magnitude lower than the power of blue light that induces relaxation of naive vascular cells (>10 mW/mm2). 64 Under all stimulation conditions, changes in the systemic physiology of the animals (i.e., respiration and heart rates) were not detected.
In conclusion, optogenetic activation of brain cells leads to cell type-dependent cerebrovascular responses, such as pial and penetrating arterial vasodilation. The animal models presented here are useful to identify a potential therapeutic target in preclinical studies of cerebrovascular and neurodegenerative disorders. Optogenetic manipulation of vascular cells will also be a complementary approach to assess health and function of brain cells and vascular cells. The advantage of these methods is that they allow direct perturbation of the neurovascular coupling in the target brain regions without altering systemic circulation, which has been never achieved in previous studies, such as with hypercapnic challenge and intravenous injection of acetazolamide (a potent vasodilator).
Supplemental Material
sj-pdf-1-jcb-10.1177_0271678X211010355 - Supplemental material for Differential pial and penetrating arterial responses examined by optogenetic activation of astrocytes and neurons
Supplemental material, sj-pdf-1-jcb-10.1177_0271678X211010355 for Differential pial and penetrating arterial responses examined by optogenetic activation of astrocytes and neurons by Nao Hatakeyama, Miyuki Unekawa, Juri Murata, Yutaka Tomita, Norihiro Suzuki, Jin Nakahara, Hiroyuki Takuwa, Iwao Kanno, Ko Matsui, Kenji F Tanaka and Kazuto Masamoto in Journal of Cerebral Blood Flow & Metabolism
Footnotes
Funding
The author(s) disclosed receipt of the following financial support for the research, authorship, and/or publication of this article: This work was partially supported by JSPS KAKENHI [grant number 16K01944, 19K07795 to KM, 20K06929 to YT] and Keio University Program for the Advancement of Next Generation Research Projects.
Acknowledgements
The authors thank Takuma Sugashi and Tatsushi Watanabe for their assistance with the experiments and data analysis.
Declaration of conflicting interests
The author(s) declared no potential conflicts of interest with respect to the research, authorship, and/or publication of this article.
Authors’ contributions
NH, MU, YT, IK, KT, and KM designed the study; NH, MU, and KM performed the experiments; NS, JN, HT, K Matsui, and KT contributed experimental resources/tools; NH, JM, and KM analyzed data; NH, MU, and KM wrote the original manuscript; YT, NS, JN, HT, IK, K Matsui, and KT reviewed and edited the manuscript; and YT, IK, NS, JN, KT and KM supervised the project.
Supplemental material
Supplemental material for this article is available online.
References
Supplementary Material
Please find the following supplemental material available below.
For Open Access articles published under a Creative Commons License, all supplemental material carries the same license as the article it is associated with.
For non-Open Access articles published, all supplemental material carries a non-exclusive license, and permission requests for re-use of supplemental material or any part of supplemental material shall be sent directly to the copyright owner as specified in the copyright notice associated with the article.