
Abstract
Previous diffusion tensor imaging (DTI) studies indicate that impaired microstructural integrity of the normal-appearing white matter (NAWM) is related to cognitive impairment in cerebral small vessel disease (SVD). This study aimed to investigate whether quantitative T2 relaxometry is a suitable imaging biomarker for the assessment of tissue changes related to cognitive abnormalities in patients with SVD. 39 patients and 18 age-matched healthy control subjects underwent 3 T magnetic resonance imaging (MRI) with T2-weighted multiple spin echo sequences for T2 relaxometry and DTI sequences, as well as comprehensive cognitive assessment. Averaged quantitative T2, fractional anisotropy (FA) and mean diffusivity (MD) were determined in the NAWM and related to cognitive parameters controlling for age, normalized brain volume, white matter hyperintensity volume and other conventional SVD markers. In SVD patients, quantitative T2 values were significantly increased compared to controls (p = 0.002) and significantly negatively correlated with the global cognitive performance (r= –0.410, p = 0.014) and executive function (r= –0.399, p = 0.016). DTI parameters did not correlate with cognitive function. T2 relaxometry of the NAWM seems to be sensitive to microstructural tissue damage associated with cognitive impairment in SVD and might be a promising imaging biomarker for evaluation of disease progression and possible effects of therapeutic interventions.
Introduction
Cerebral small vessel disease (SVD) is one of the most important causes of ischemic stroke and the major cause of vascular cognitive impairment and vascular dementia. 1 Among the imaging findings, which characterize SVD on conventional magnetic resonance imaging (MRI) data, white matter hyperintensities (WMH) of various degrees, observed on T2-weighted and fluid-attenuated inversion recovery (FLAIR) images, are usually the predominant manifestation. 2 The volume of WMH and the progression of these lesions are associated with cognitive impairment or cognitive decline.3–6 However, effect sizes have been shown to be relatively small,6,7 suggesting that the WMH volume accounts for a modest degree of cross-sectional variation in cognition status.6,7
The degree of microstructural damage in the surrounding normal-appearing white matter (NAWM), which by definition cannot be detected with conventional MRI techniques, has been demonstrated to be more strongly related to cognitive impairment than the WMH volume.8–10 The diffusion tensor imaging (DTI) parameters fractional anisotropy (FA) and mean diffusivity (MD), which quantify the directionality and the overall magnitude of water diffusion,9,11 can be used for the assessment of NAWM microstructural integrity. 12 Both in cross-sectional 9 and longitudinal 13 studies, diffusion alterations were strongly associated with SVD-related cognitive impairment, which is commonly characterized by attention deficits, executive dysfunction and impaired psychomotor speed. 6
Recent studies proposed processes such as a primary increase of the interstitial fluid content due to blood-brain barrier (BBB) leakage14–16 and a formation of myelin vacuoles 17 as key mechanisms of microstructural WM damage, suggesting that abnormalities of the fiber organization might rather represent a secondary mechanism.11,15 In the light of these results, it has been suspected that diffusion alterations including reduced FA in SVD are a rather unspecific phenomenon mainly driven by an increase of the free tissue water fraction and not by primary structural damage to the WM tracts. 11 Therefore, other imaging methodologies apart from DTI might also provide promising imaging biomarkers assessing processes underlying SVD-related clinical deficits on the microstructural level. Besides its sensitivity to net water uptake in brain tissue,18–20 axonal damage, demyelination and gliotic tissue conversion,21–23 quantitative T2 relaxometry is highly sensitive to enlargement of the extracellular compartment. 20 In the study presented here, we aimed to investigate changes of quantitative T2 values within the NAWM in patients with SVD and their potential association with cognitive impairment, hypothesizing that T2 relaxometry may be a suitable surrogate marker for microstructural WM damage and resulting cognitive deficits in SVD. For comparison, established imaging parameters of microstructural WM integrity were derived from additional DTI data.
Materials and methods
Subjects
Patients with sporadic SVD (n=39) were recruited in the Department of Neurology at Goethe University Frankfurt, Germany. SVD was defined as the presence of confluent WMH and lacunes in clinical routine MRI. The main reasons for admission or referral to the hospital were either a transient ischemic attack, or an ischemic stroke manifesting with a lacunar syndrome or chronic symptoms of SVD, such as cognitive impairment or gait disturbances. In addition, also neurological patients with SVD as an incidental finding on neuroimaging were included. Exclusion criteria were as follows: cognitive impairment or dementia with suspected neurodegenerative origin, relevant stenosis of a brain-supplying artery (degree of ≥50%), non-lacunar cerebral infarction, white matter lesions not compatible with sporadic SVD (e.g. inflammatory origin) and common MRI contraindications. Furthermore, 18 control subjects were recruited. Inclusion criteria were: 1) no history of neurological or psychiatric disease, 2) no history of diabetes mellitus and untreated arterial hypertension, 3) no active smoking and 4) absence of confluent white matter lesions on T2-weighted/FLAIR images (Fazekas-Score ≤1). Inclusion and exclusion criteria for SVD patients and healthy control subjects applied in this study were comparable to the criteria of previous studies investigating microstructural WM integrity and cognitive impairment in SVD.11,21,24 The study was approved by the local institutional review board of the Goethe University Frankfurt, Faculty of Medicine (Ethikkomission des Fachbereichs Medizin) and written informed consent was obtained from all subjects before enrollment. The study was conducted in accordance with the Helsinki Declaration (revised version from 1983).
MR imaging protocol
MRI data acquisition was performed on a 3-Tesla (T) whole-body magnetic resonance (MR) scanner (Trio, Siemens Healthineers, Erlangen, Germany) which uses a body coil for radio-frequency (RF) transmission and an 8-channel phased-array head coil for RF reception.
DTI data were acquired using a diffusion-weighted (DW) twice-refocused (tr) spin-echo (SE) echo planar imaging (EPI) sequence. Parameters used for DTI data acquisition were: field of view (FoV) = 192 × 192 mm2, matrix size = 96 × 96, isotropic resolution = 2 mm, 70 interleaved axial slices (2 mm thickness, no interslice gap), TR = 9000 ms, TE = 81 ms, echo-spacing =0.86 ms, readout bandwidth = 1302 Hz/pixel, partial Fourier encoding = 6/8, parallel imaging with two-fold acceleration, 12 different diffusion encoding directions with a b-value of 1000 s/mm2. In order to correct for geometrical distortions induced by static magnetic field (B0) inhomogeneities, two sets of five reference images with b = 0 were acquired with either positive or negative phase encoding gradients, yielding five pairs of DTI data sets with opposite distortions.
T2 mapping was based on a fast spin-echo sequence with an echo-train length of 11 echoes per excitation, an echo spacing of 17.1 ms, and the following imaging parameters: 35 axial slices (2 mm thickness, no interslice gap), TR = 5000 ms, bandwidth = 100 Hz/pixel, 180° refocusing pulses, FOV = 240 × 180 mm2, matrix size = 192 × 144 (readout × phase encoding), in-plane resolution = 1.25 × 1.25 mm2. For quantitative T2 mapping, 5 datasets were acquired with different TE values (17, 86, 103, 120, 188 ms), keeping all other acquisition parameters constant. The total duration was 6 minutes 25 seconds.
Anatomical imaging for tissue segmentation was based on a T1-weighted Magnetization-Prepared Rapid Acquisition of Gradient Echos (MP-RAGE) data set, acquired with the following parameters: TR/TE/TI = 1900/3.04/900 ms, FOV = 256 × 256 × 192 mm3, whole-brain coverage, isotropic spatial resolution =1 mm, acquisition time = 4 minutes 28 seconds. Furthermore, a 3D FLAIR sequence was included. Protocol parameters were: TR/TE/TI = 1600/3.53/2200 ms, FOV = 256 × 256 × 192 mm3, whole-brain coverage, isotropic spatial resolution = 1 mm, acquisition time = 8 minutes 8 seconds.
Image post-processing and analysis
Imaging data were processed with custom-built MATLAB (version 8.0, The MathWorks, Inc.) and shell scripts and tools from the FMRIB’s Software Library (FSL, version 5.0.7) and SPM 12 (Wellcome Department of Cognitive Neurology, UCL Institute of Neurology, London, United Kingdom).
DTI data with positive and negative phase encoding gradients were processed with the FSL tool ‘TOPUP’, 25 estimating the susceptibility-induced B0 inhomogeneities 25 with subsequent distortion correction of the DTI data. Skull-stripping of the corrected data was performed with the FSL tool ‘BET’ 26 and a binary brain mask was generated. Using standard parameters, corrections inside the brain mask were performed with the FSL tool ‘EDDY’ 27 to compensate for residual eddy-current-induced distortions and subject motion effects. The water diffusion tensor for each voxel was obtained with the FSL tool ‘DTIFIT’,28,29 which was also used to calculate parametric maps of FA and MD from the local diffusion tensor eigenvalues.
For T2 mapping, in order to reduce the influence of subject motion, the individual source data sets acquired at different TE were co-registered to a common target, based on the sum-of-squares average of these data sets. Quantitative T2 maps were obtained pixel-wise from the five coregistered data sets by fitting mono-exponentially the dependence of the T2-weighted signal amplitude on TE. The calculation of T2 maps was based on home-written MATLAB scripts which were run in GNU Octave, version 4.0.0 (http://www.octave.org) as the syntax in Octave and MATLAB is largely identical.
Structural imaging data (including T1-weighted MP-RAGE and FLAIR) and quantitative T2 maps were skull-stripped using ‘BET’. 26 WMH were automatically segmented on FLAIR images (Figure 1(a)) by gradual thresholding of FLAIR signal intensities, yielding five different WMH masks based on different thresholds for each patient. The same procedure and the same thresholds were used for each individual patient. In detail, using the MRIcron software (Chris Rorden, Columbia, SC, USA; www.mricro.com), a rough lower threshold (T = 80) was first applied to the FLAIR data with 256 gray levels (0 = black, 255 = white) in order to suppress the signals of the individual tissue types (WM, GM, CSF) and to highlight the hyperintense lesions. In the second step, the lower threshold was applied to obtain a subset of the data with intensity values in the range of 81 to 255. This range was subsequently rescaled to the gray value range from 0 to 255 for further histogram-based analysis. Using MATLAB, five new thresholds were then defined on the rescaled data to perform a more precise selection of the lesions and to discard erroneously segmented tissue of GM and WM. Lower gray scale value thresholds of 10, 20, 30, 40, 50, 100 units where chosen, corresponding to a rejection of the lower 4%, 8%, 12%, 16%, 20%, 40% of the rescaled gray value range. The size of each of the masked out fractions of the gray value range depended on the distribution of the gray values in each individual subject. Two experienced neurological/neuroradiological readers (M.W. and A.S.; more than 15 and 7 years of experience, respectively), who were blinded to the cognitive test results and all other clinical and demographic data, evaluated the accuracy of the respective WMH estimates, choosing the best automatically generated WMH mask by consensus. The evaluation of the individual data sets showed that in general the visibility of lesions was optimized when pixels with intensities in the lower 16% - 20% of the rescaled gray value range were masked out. If necessary, the WMH masks were manually corrected. During manual correction, standardized consensus criteria 2 were strictly applied for the classification of FLAIR hyperintensities as WMH of vascular origin. These criteria ensure the accurate and reliable differentiation of WMH from other FLAIR-hyperintense lesions such as recent subcortical infarcts or lacunes and (prominent) perivascular spaces, which occasionally may suffer from inadequate fluid suppression, thus appearing hyperintense on FLAIR images. 2 Finally, the resulting WMH segmentations were binarized to obtain WMH masks for further analysis. A representative example for an individual binary WMH mask is demonstrated in Figure 1(b) (red regions). Tissue segmentation of the T1-weighted MP-RAGE datasets was performed with SPM 12, thresholding the WM tissue probability map at 70% to obtain a binary WM mask. For quantitative image analyses, FLAIR and T1-weighted images were linearly co-registered (“FLIRT”, FSL 30 ) to the target data set created for T2 mapping. The resulting co-registration matrices were applied to the WMH mask and WM mask for co-registration to the target data set. A mask of NAWM (Figure 1(b), blue area) was generated by eliminating voxels inside the WMH mask from the WM mask. For assessment of the distribution of WMH in the SVD patients group, all WMH masks were co-registered to a template in the Montreal Neurological Institute (MNI) 152 standard space (1 mm isotropic resolution). The transformation of each individual WMH mask was performed by applying the co-registration matrix between the respective FLAIR dataset and the MNI template, which was obtained via non-linear co-registration algorithms (FSL tool ‘FNIRT’ 31 ) after initialization with the respective linear co-registration matrices. In order to perform image analyses in a common image space, FA and MD maps were linearly co-registered to the target data set created for T2 mapping. In order to minimize partial volume effects, cerebrospinal fluid (CSF) compartments were removed from parameter maps by excluding voxels inside a CSF mask obtained from tissue segmentation. The individual NAWM masks were used to read mean T2, FA and MD values across NAWM from the respective parameter maps (Figure 1(c) to (e)).
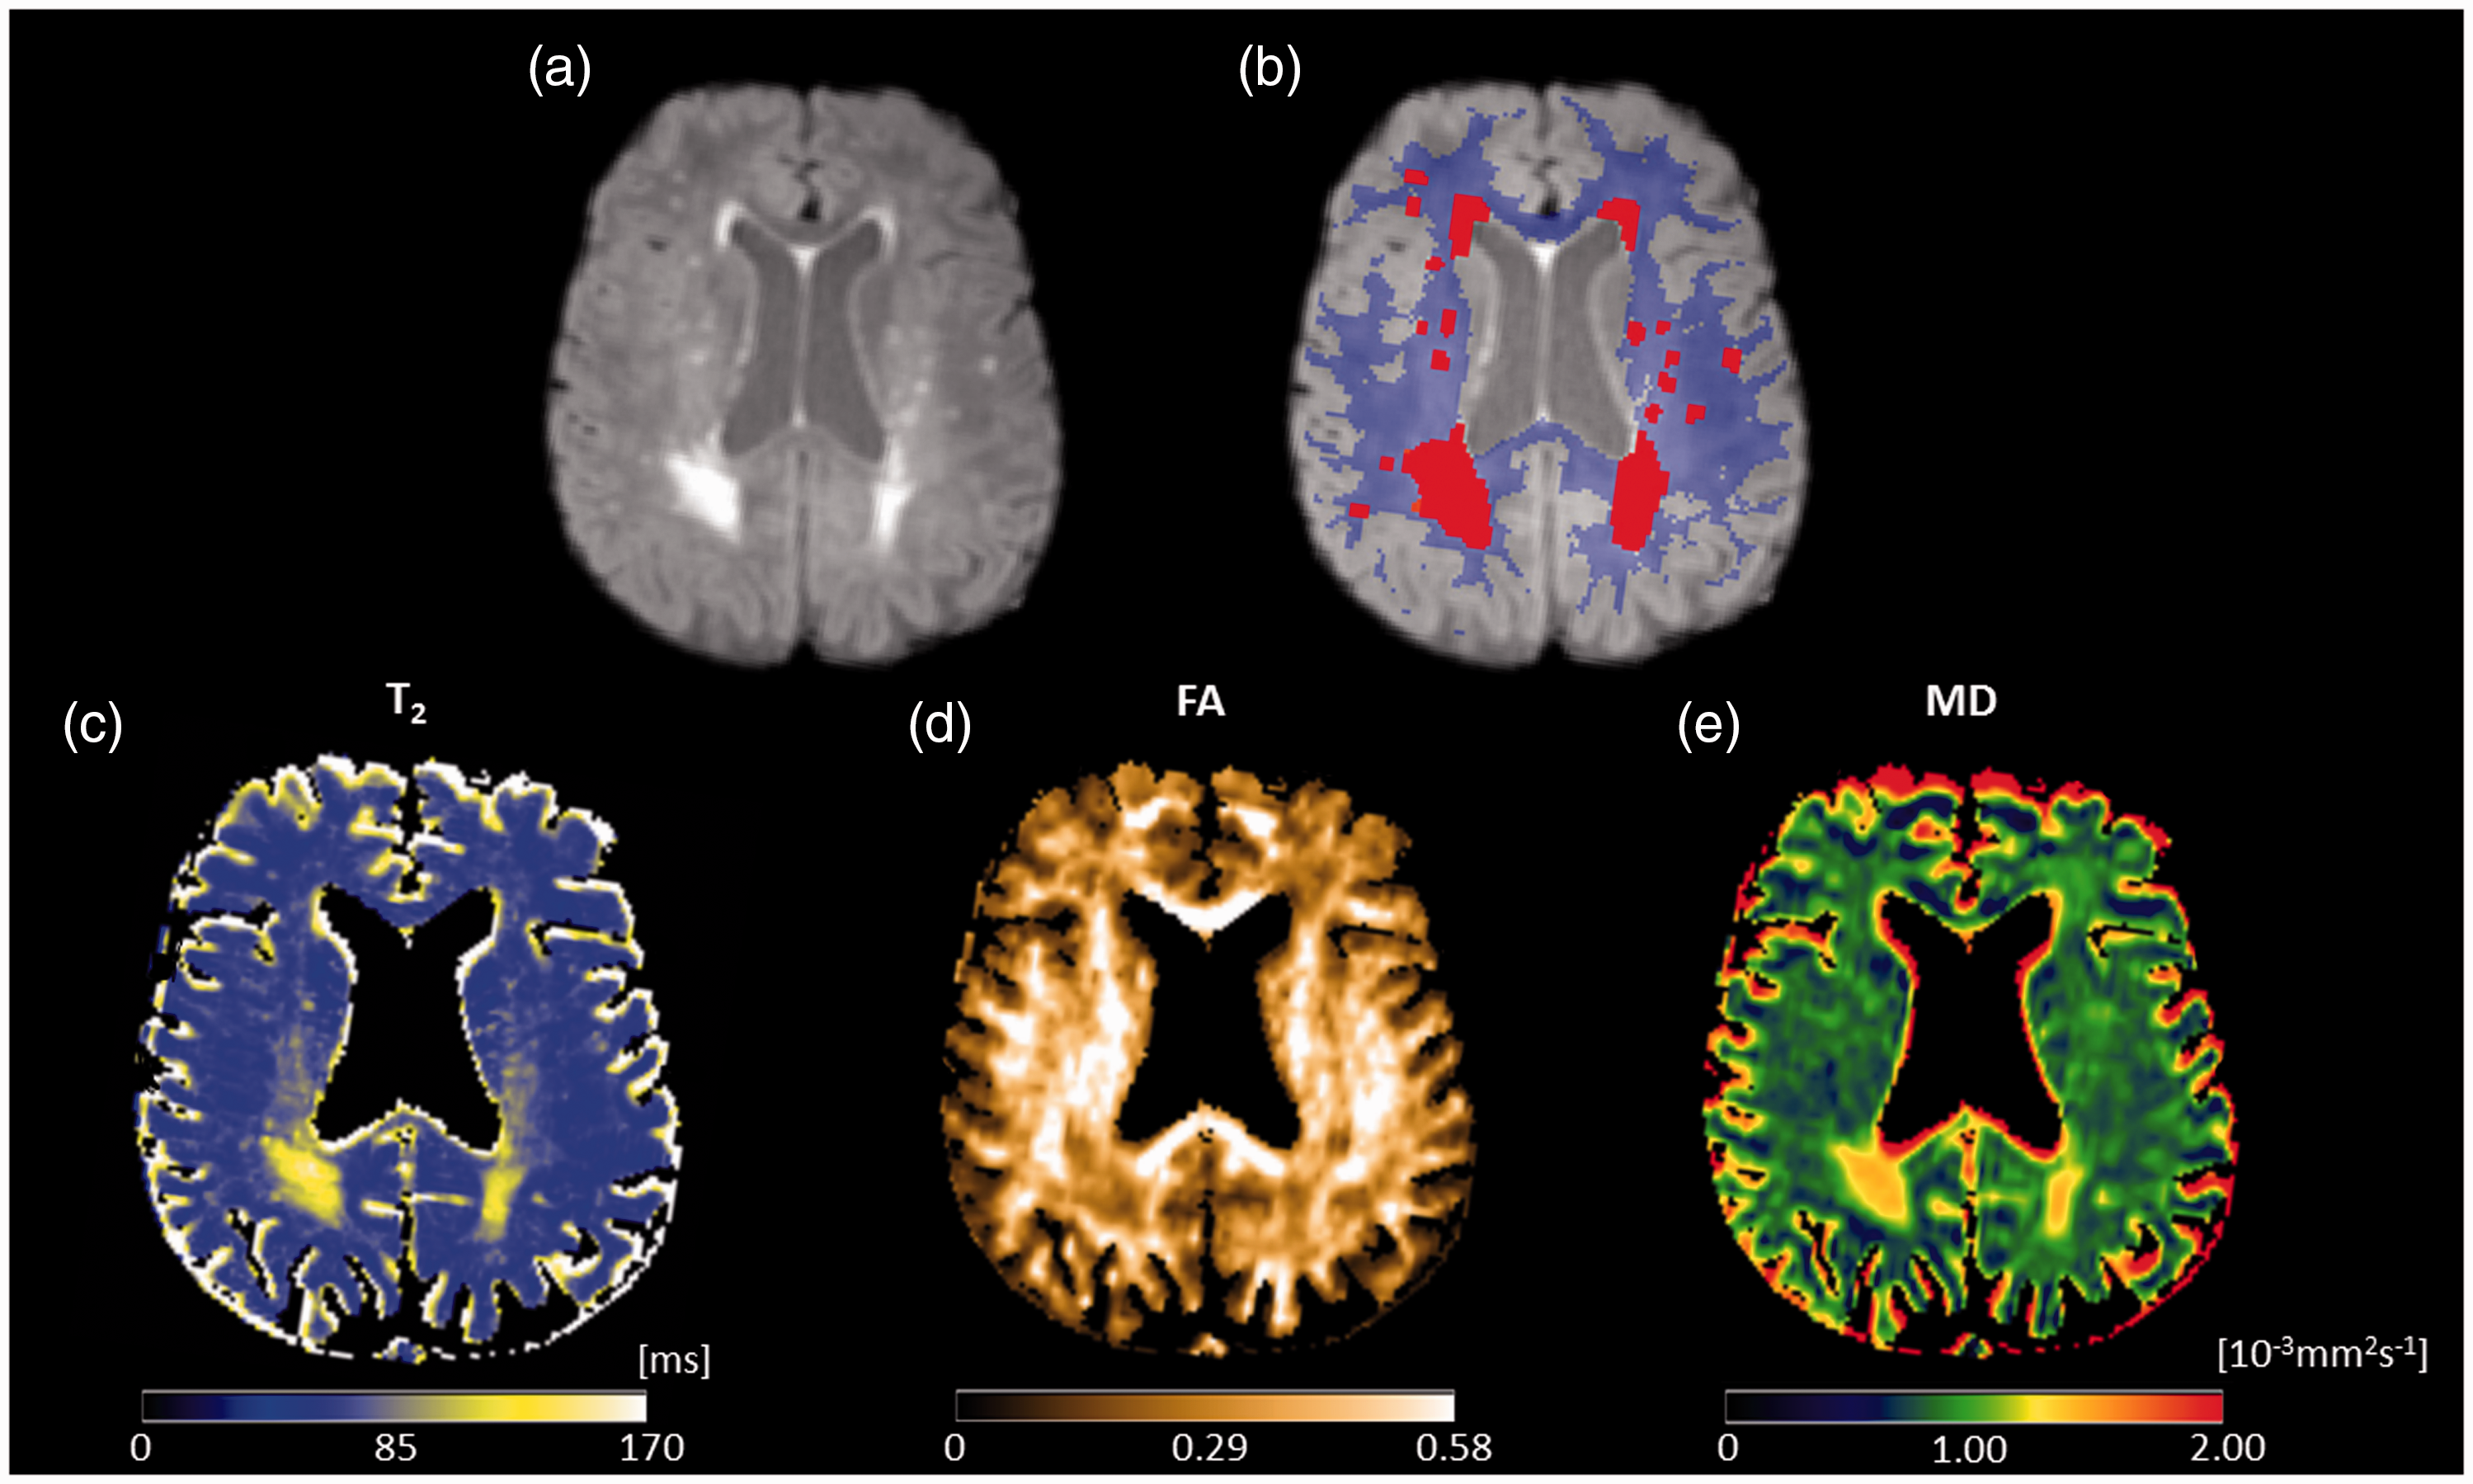
Illustration of tissue segmentation and image analysis. (a) FLAIR image, which was used for segmentation of WMH. (b) FLAIR image with overlaid WMH mask (red regions) and NAWM mask (blue mask). The NAWM mask was applied to the respective parameter maps and used to extract values from the quantitative maps of T2 (c), FA (d) and MD (e). It should be noted that voxels representing cerebrospinal fluid (CSF) were removed from the parameter maps using the CSF mask obtained from tissue segmentation. All images are shown after coregistration to the target data set created for T2 mapping. FA: fractional anisotropy; MD: mean diffusivity; ms: milliseconds; mm: millimeters; s: seconds.
The normalized brain volume (NBV), which represents the brain volume relative to the individual skull size, thus being a volume measure sensitive to atrophy, was obtained from the MP-RAGE datasets using the FSL tool ‘SIENAX’.32,33 Consensus criteria 2 were used to assess the individual number of lacunes and cerebral microbleeds (CMB). Since lacunes and CMB may potentially influence mean T2, FA and MD values, the respective areas were manually removed from the NAWM mask, in case they had been classified as WM by the automatic tissue segmentation algorithm.
Cognitive assessment
All subjects underwent cognitive assessment using the test battery of the Consortium to Establish a Registry for Alzheimer’s Disease (CERAD, CERAD-plus version). 34 The trail making test part A (TMT-A), the trail making test part B (TMT-B) and the ‘s-words’ test are included in CERAD-plus. These tests cover the ‘subcortical’ cognitive domains psychomotor speed, executive function and phonematic fluency. Raw scores from the CERAD-plus test battery were transformed into z-scores and corrected for age, sex and years of education based on two normative samples for the German CERAD-plus version, 35 by means of a freely available software (https://www.memoryclinic.ch). Apart from the TMT-A and -B scores, which are of particular interest in SVD,11,36 a global cognitive index was calculated for the assessment of the cognitive performance in the SVD patients and the control subjects. In analogy to the CERAD total score described by Chandler et al., 37 the global cognitive index was calculated from the CERAD subtests (excluding the Mini-Mental State Examination [MMSE]). While the CERAD total score is based on the raw scores of the respective CERAD subtests, 37 the global cognitive index was calculated by averaging the corrected z-scores of the subtests. 38
Statistical analyses
Statistical analyses were performed with SPSS 26 (Armonk, NY). Unpaired t-tests were applied for group comparisons of imaging parameters and cognitive scores. Tests for partial correlations (Pearson’s r) were performed between the imaging parameters and the cognitive scores which showed significant group differences controlling for the variables age, WMH volume, NBV, number of lacunes and number of CMB.24,39 Compensation for multiple tests was performed for the comparisons between groups of the imaging parameters and of the cognitive scores as well as for the partial correlations using the Benjamini–Hochberg/False Discovery Rate (FDR) method (FDR = 0.05).
Results
Demographic and structural imaging characteristics
Patients and control subjects did not differ significantly in terms of age (70.5 ± 10.7 years vs. 70.9 ± 7.4 years, p = 0.840), sex (p = 0.400) and NBV (p = 0.676). WMH in SVD patients exhibited a widespread distribution across the entire cerebral WM and were mainly located in the rostral and dorsal periventricular and deep WM (Figure 2). Demographic characteristics and conventional imaging results are summarized in Table 1 for both groups.
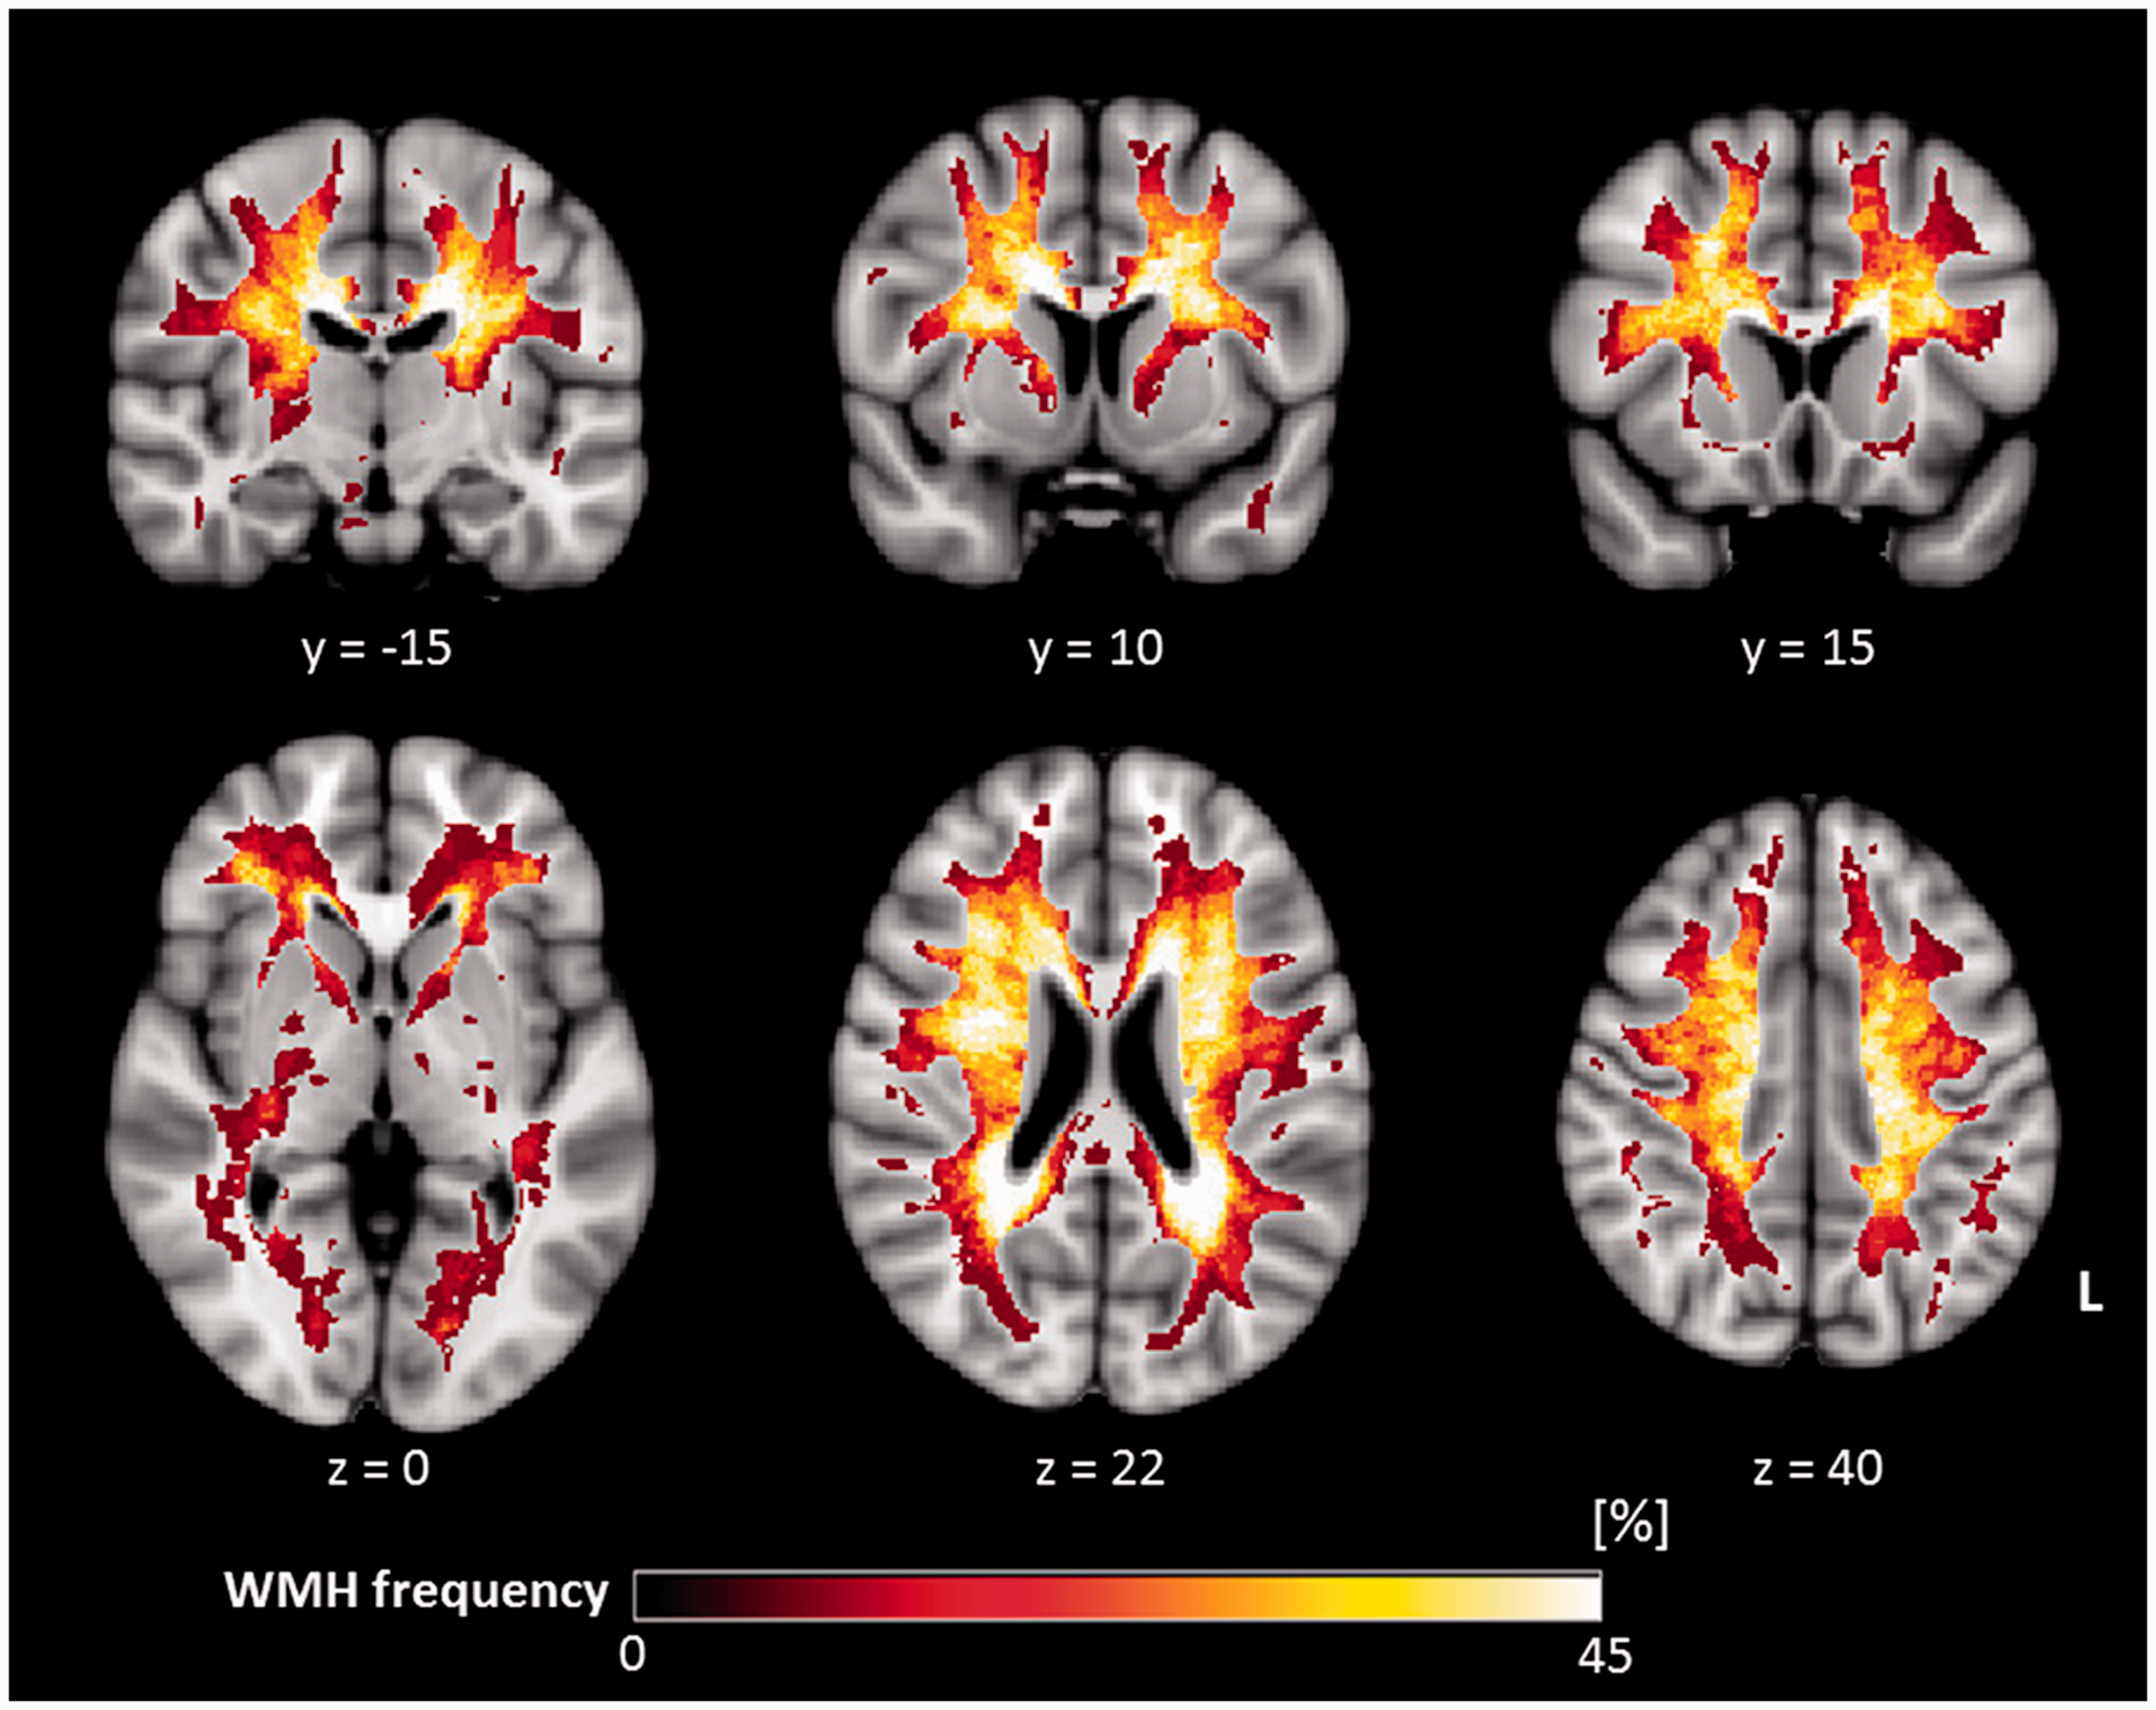
Distribution of WMH in the SVD patient group (n = 39). Each WMH mask was transformed by applying the co-registration matrix between the respective FLAIR dataset and the Montreal Neurological Institute (MNI) 152 standard space (1 mm isotropic resolution) which was obtained using non-linear co-registration algorithms (FSL tool ‘FNIRT’ 31 ) after initialization with the respective linear co-registration matrices. The color code projected onto the MNI 152 standard brain denotes the proportion of SVD patients exhibiting WMH in the respective pixel. A higher luminosity indicates a larger proportion of patients with local WMH. WMH: white matter hyperintensities; L: left.
Baseline demographic characteristics, conventional imaging and cognitive results.
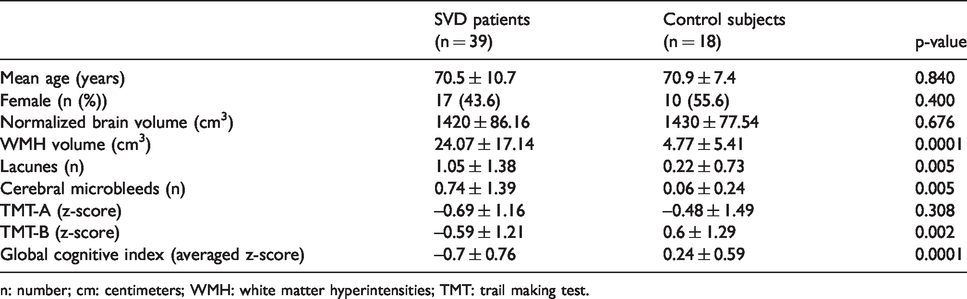
n: number; cm: centimeters; WMH: white matter hyperintensities; TMT: trail making test.
Cognitive performance in SVD patients and control subjects
A lower global cognitive index in SVD patients than in the healthy control group (z-score patients: –0.70 ± 0.76, control subjects: 0.24 ± 0.59, p = 0.0001) and an impaired executive function (TMT-B, z-score patients: –0.59 ± 1.21, control subjects: 0.60 ± 1.29, p = 0.002) for the SVD patients were observed. There was no significant difference between the groups in terms of psychomotor speed (TMT-A, z-score patients: –0.69 ± 1.16, control subjects: –0.48 ± 1.49, p = 0.308).
Quantitative T2/DTI parameters in NAWM of SVD patients
Quantitative T2 values in NAWM were significantly increased in SVD patients compared to control subjects (113.03 ± 13.70 ms vs. 102.9 ± 10.58 ms, p = 0.002, Figure 3(a)). Furthermore, the DTI parameters in NAWM differed between SVD patients and control subjects: FA was reduced in patients (0.383 ± 0.054 vs. 0.434 ± 0.027, p = 0.0001) and MD increased (0.885 ± 0.047 10−3mm2s−1 vs. 0.822 ± 0.057 10−3mm2s−1, p = 0.0005) (Figure 3(b) and (c)).
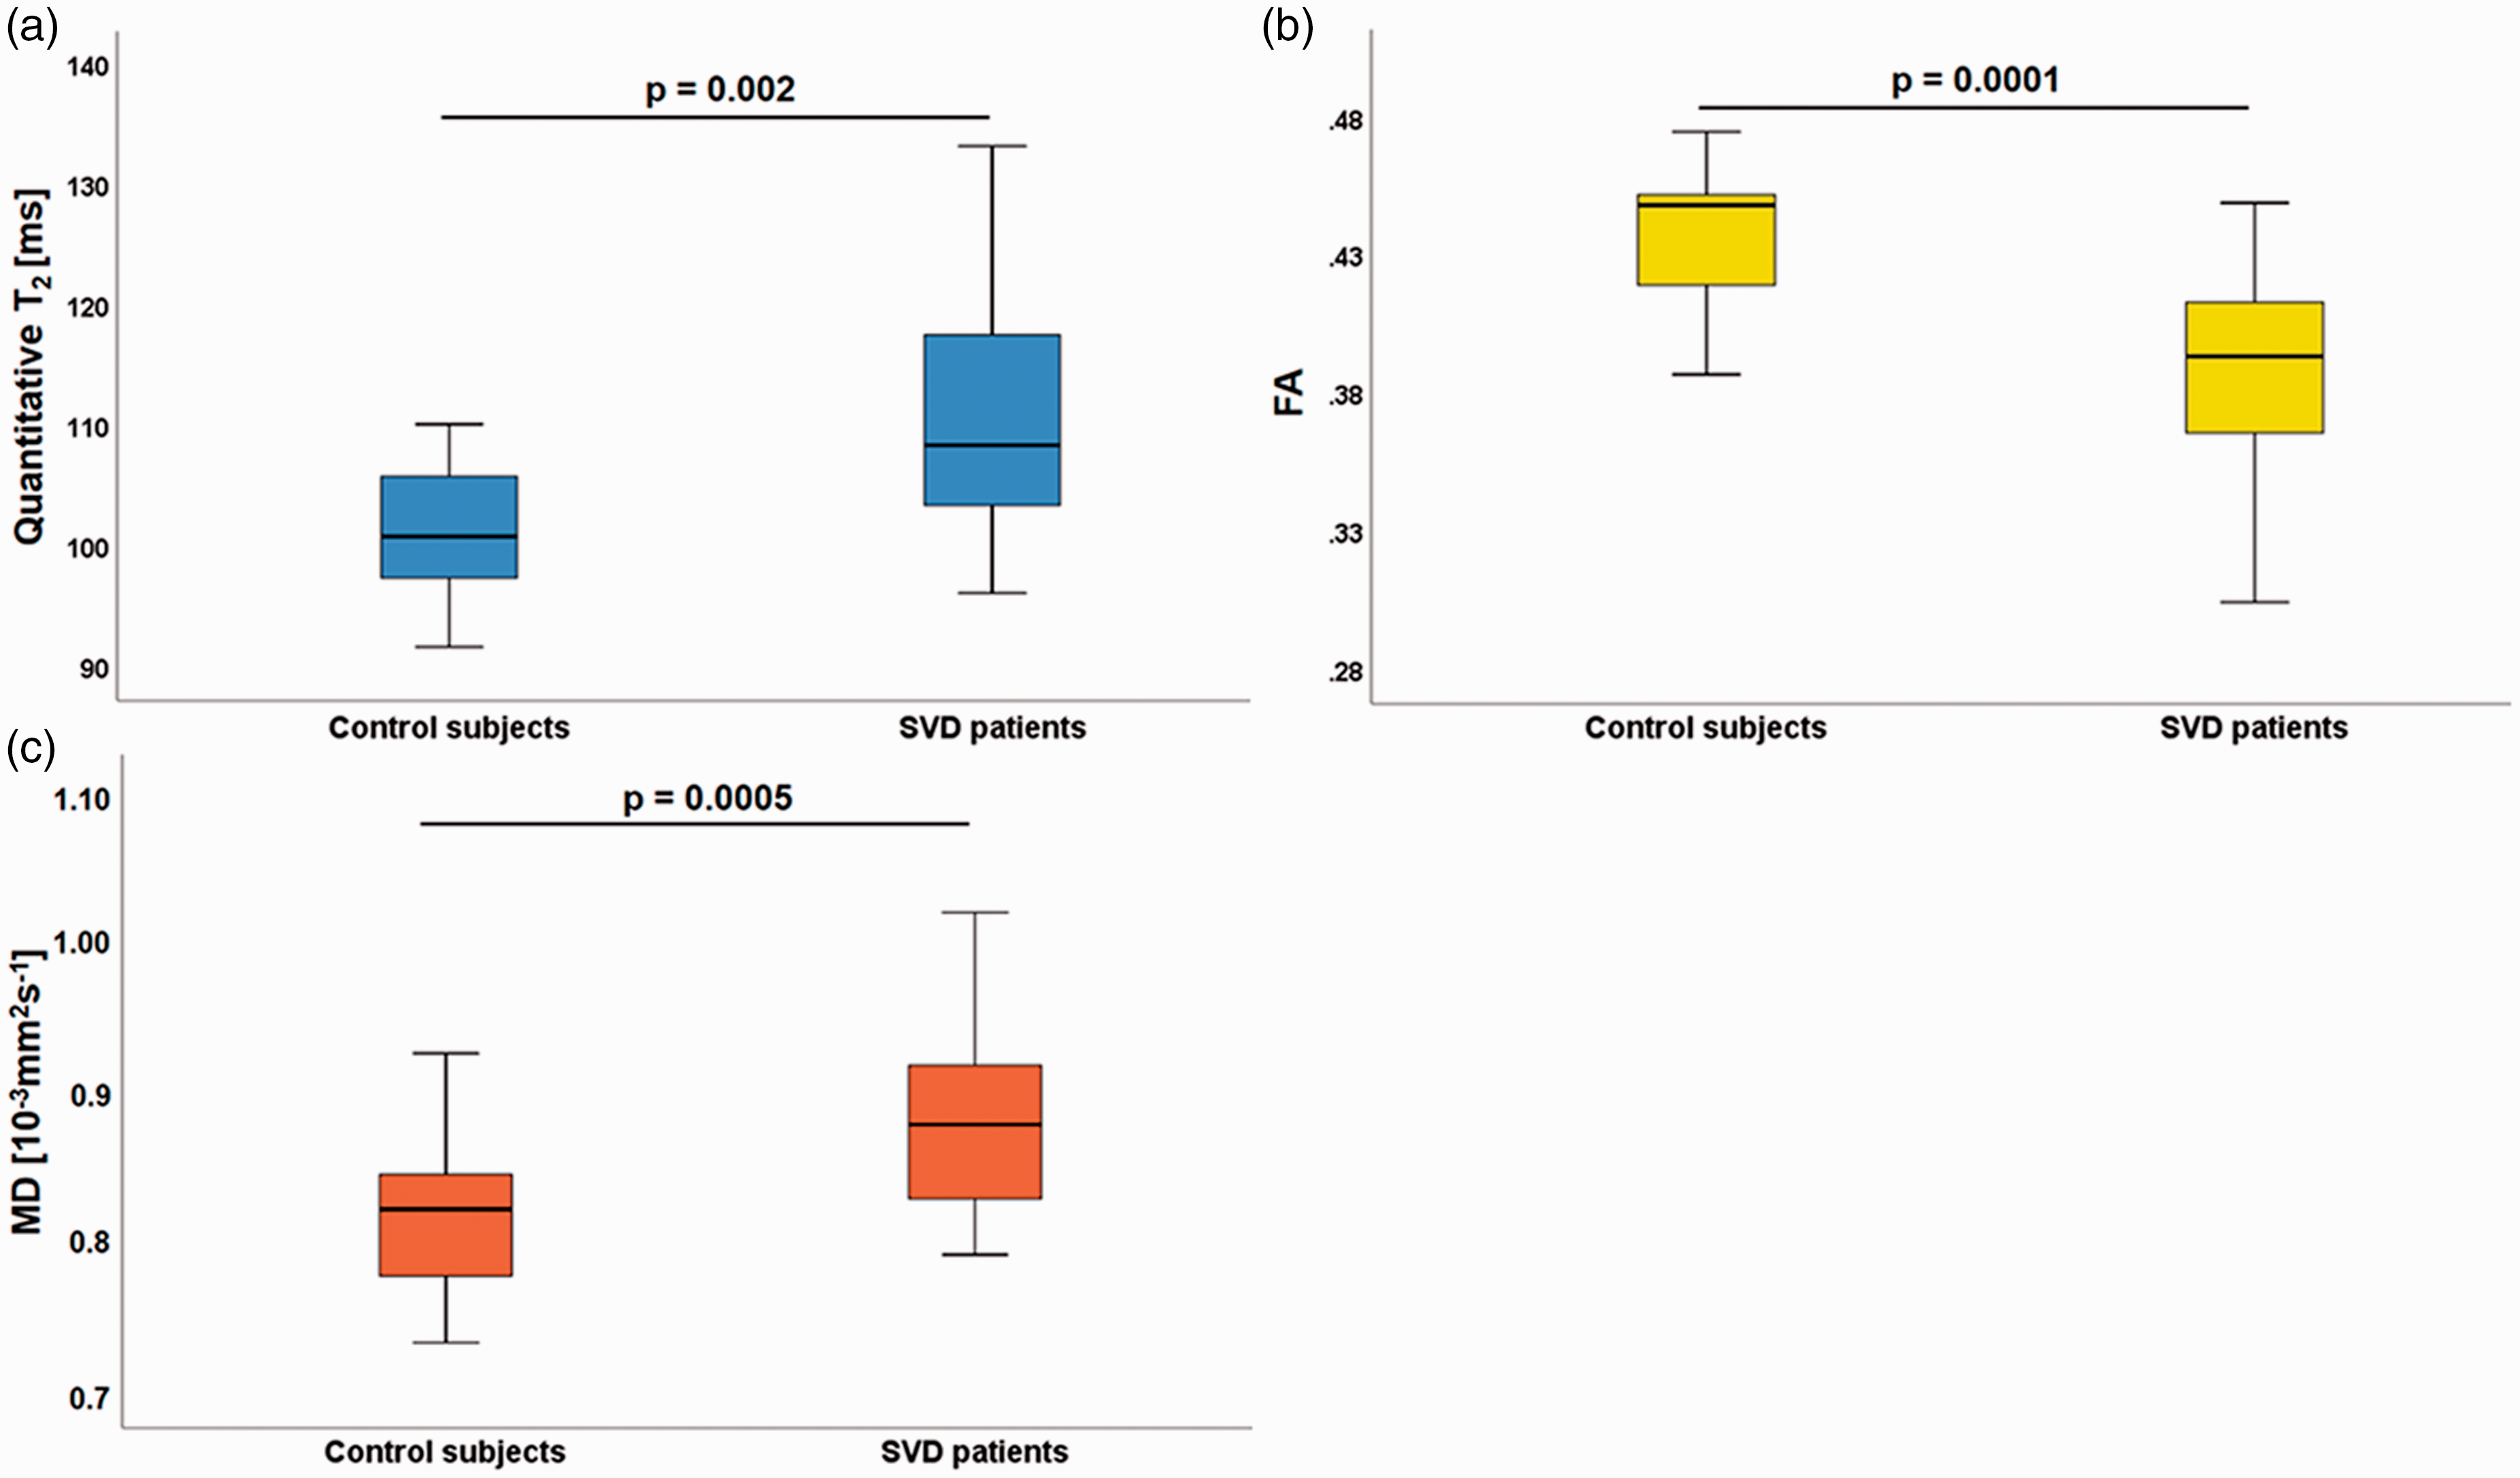
Boxplots demonstrating quantitative values of T2 (a), FA (b) and MD (c), evaluated in NAWM of SVD patients and control subjects. Significant increases were observed for T2 and MD values, while FA values were significantly decreased in patients compared to control subjects. FA: fractional anisotropy; MD: mean diffusivity; ms: milliseconds; mm: millimeters; s: seconds.
Relationship between imaging parameters in NAWM and cognitive function in SVD patients
Quantitative T2 values averaged across NAWM showed a significant negative correlation with the performance in the TMT-B test (r= –0.399, p = 0.016, Figure 4(a)), indicating that higher T2 values are associated with a reduced executive function, while no significant correlations were found for the FA (r = –0.258, p = 0.097) and MD values (r = –0.287, p = 0.080). Similarly, a significant negative correlation between quantitative T2 values in NAWM and the global cognitive index was observed (r = –0.410, p = 0.014, Figure 4(b)) indicating cognitive deficits in patients with higher T2 values. Again, no significant correlations were found between the global cognitive index and the FA (r = –0.329, p = 0.047) and MD values (r = –0.71, p = 0.365). The correlation between FA and the global cognitive index (p = 0.047) was not statistically significant because FDR compensation for multiple comparisons resulted in an adjusted significance level of q < 0.029 for this test.
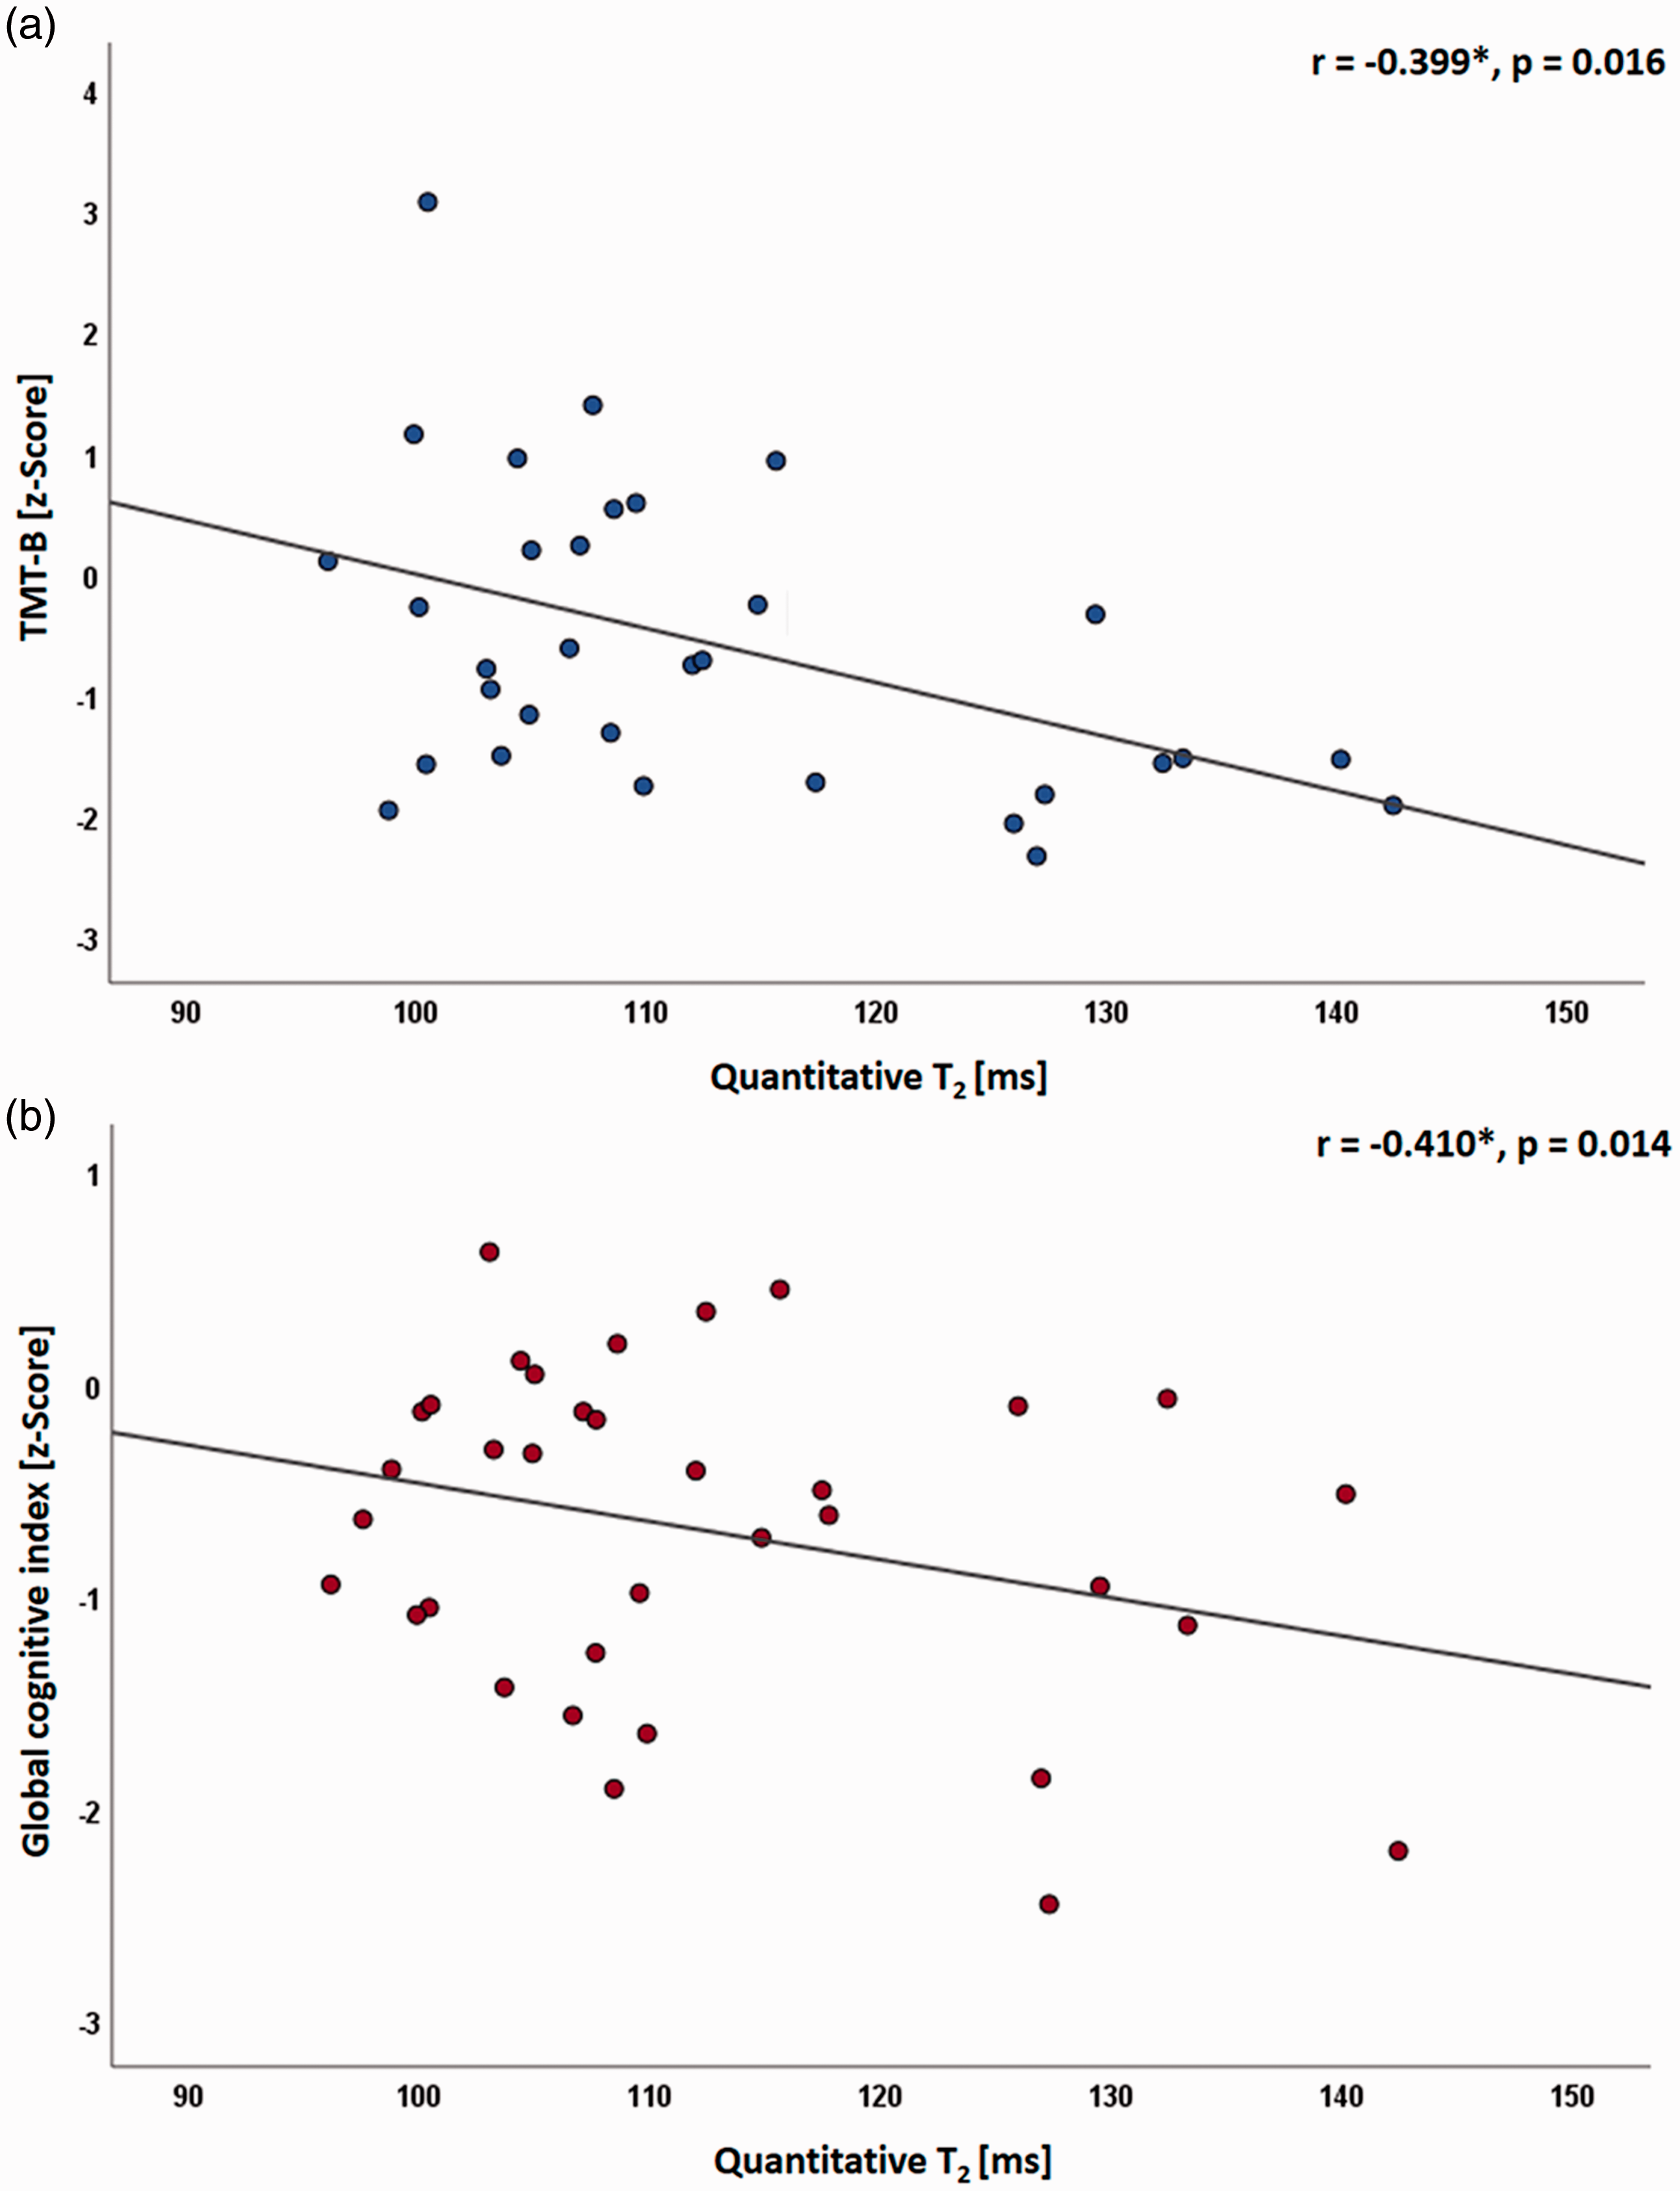
Scatterplots illustrating the significant negative correlation of the performance in the trail making test (TMT) matrix B (a) and of the global cognitive index (b) with quantitative T2 values averaged across NAWM of SVD patients. ms: milliseconds; *: partial correlation corrected for age, NBV, WMH volume, number of lacunes and number of CMB.
Discussion
This study aimed to detect and characterize microstructural WM changes in SVD patients as compared to age-matched healthy control subjects, in regions appearing normal on conventional MRI datasets. Furthermore, this study aimed to investigate whether these alterations of WM microstructure are clinically relevant for the cognitive function in patients with SVD, which might allow for identifying potential imaging biomarkers of cognitive impairment in SVD. This opens a window of insight into a disease affecting large parts of the elderly population. 40 In particular, the T2 relaxation time and DTI parameters were assessed in NAWM of patients with SVD and white matter of age-matched healthy control subjects, correlating these parameters with cognitive deficits - a common clinical manifestation of SVD. 1 In accordance with previous studies,11,21,36 T2 and MD values were significantly increased in NAWM surrounding the WMH (Figure 3(a) and (c), whereas FA was significantly reduced (Figure 3(b)). Previous studies in the field demonstrated a correlation of the DTI parameters MD and FA with the cognitive function in larger cohorts of patients.9,13,41,42 However, to the best of our knowledge, the relationship between T2 values in NAWM - which reflect changes in tissue composition including and beyond an alteration of the water content20,21 - and the cognitive status has not been investigated so far. The study presented here assessed both T2 and DTI parameters, revealing a significant correlation only between quantitative T2 values averaged across NAWM of SVD patients and the global cognitive function and executive function - cognitive domains showing significant impairment in SVD patients as compared to control subjects (Table 1).
As a consequence of the small effect sizes of the association between WMH volume and cognitive function, extensive WMH do not necessarily cause relevant cognitive impairment.6,7 Therefore, numerous studies have highlighted the importance of the surrounding NAWM with regard to compromised microstructural integrity as the pathophysiological basis of clinical deficits in SVD.9,15,41 Significant associations between cognition and both globally11,36,41 and regionally (e.g. restricted to specific fiber tracts) 9 impaired microstructural NAWM integrity have been reported.
There is increasing evidence from recent pre-clinical16,17 and MRI studies,11,14,15,43,44 suggesting that compromised WM fiber organization is a phenomenon of subordinate relevance in SVD pathophysiology. Considering these findings, the alterations of DTI parameters in SVD may be rather unspecific and reflect extension of the interstitial compartment, which is mainly driven by interstitial fluid increase due to BBB leakage. 11 Imaging parameters, which are suitable as independent surrogate markers for monitoring disease progression and identifying SVD patients at risk of (further) cognitive decline need to quantify the key microstructural abnormalities with the highest possible sensitivity and specificity - especially given the multicollinearity between NAWM microstructural integrity, common SVD imaging markers, age and cognitive impairment in SVD.11,38 T2 relaxometry has been shown to be highly sensitive to an increased water fraction in different microstructural compartments.18–20,45 Of course, also the DTI parameter MD is sensitive to an enlargement of the extracellular space and elevated interstitial fluid content, resulting in an increased water diffusion. 11 However, increases of the extracellular and the myelin water content can have opposite effects on the overall tissue water diffusion, 46 potentially causing bidirectional effects on the MD in SVD. In the presented study, FA values extracted from the NAWM showed an insignificant negative-signed relationship with the global cognitive function and executive performance in SVD patients, which seems at first glance counter-intuitive, given the reduced cognitive performance and the decreased FA values in patients compared to controls (Table 1, Figure 3(b)). This finding might be attributed to the general dependence of FA on the regional WM structure. In particular, the large central WM tracts exhibit higher FA values than the more peripheral association and U fibers (Figure 1(d)). 15 Therefore, as WMH usually affect the periventricular areas harboring the large WM tracts (Figure 2) and then gradually extend to the periphery, 15 FA in the NAWM decreases with increasing WMH volume irrespectively of additional impairment of the NAWM microstructure. 15 Furthermore, axonal damage causing decreases of FA seems to occur as a secondary mechanism in SVD.11,15,47 One might assume that for these reasons, FA in NAWM might be less sensitive to the microstructural tissue pathology related to clinical deficits in SVD than other imaging parameters. Nevertheless, both FA and MD in the NAWM discriminate well between SVD patients and healthy controls (Figure 3(b) and (c)) and certain characteristics extracted from MD parametric maps have been demonstrated to be closely related to the clinical status.24,36,38,39 In summary, the results of the presented study suggest that T2 relaxometry is highly sensitive to abnormalities of the microstructural tissue integrity, which are pathophysiologically relevant to cognitive impairment, and that effects sizes might be reasonably high, thus allowing to detect significant associations also in cohorts with smaller sample sizes.
Limitations
The major limitation of this study is the relatively small sample size. Therefore, a reliable comparison between imaging parameters could not be performed. The small sample size might also partly explain the lack of a significant impairment of psychomotor speed (TMT-A) in the SVD patients group (Table 1), which would usually have been expected in SVD6,11,12 Furthermore, T2 mapping with only five echo times as performed in this study does not allow for a more profound investigation of the microstructural tissue pathology by means of a separate quantification of water fractions in different tissue compartments. Finally, since this is a cross-sectional study, we cannot comment on the utility of T2 relaxometry for the prediction of further cognitive decline and development of dementia in SVD. Future studies with a larger cohort and a longitudinal design might compare effect sizes of the associations between qMRI parameters and the clinical status across the parameters and assess the utility of T2 as a predictor for future cognitive decline.
Conclusions
In conclusion, T2 relaxometry seems to be highly sensitive to pathological microstructural tissue changes with relevance for the development of cognitive impairment in SVD, although the underlying microstructural and pathophysiological abnormalities remain somewhat speculative. Therefore, the T2 relaxation time might be a suitable imaging biomarker for clinico-radiological correlations in future clinical studies.
Footnotes
Funding
The author(s) disclosed receipt of the following financial support for the research, authorship, and/or publication of this article: This work was supported by a research grant to Dr. Seiler from Goethe University Frankfurt, by the Else Kröner-Fresenius-Stiftung, by the Clinician Scientists program at Goethe University and by the State of Hesse with a LOEWE-Grant to the CePTER-Consortium (![]() ).
).
Declaration of Conflicting Interests
The author(s) declared the following potential conflicts of interest with respect to the research, authorship, and/or publication of this article: Dr. Elke Hattingen has received speaker’s honoraria from BRACCO.
Authors’ contribution
Annemarie Brandhofe: Conceptualization of the study, literature research, collection of clinical data, cognitive testing, data interpretation, writing. Christoph Stratmann: Conceptualization of the study, literature research, collection of clinical data, cognitive testing, data interpretation, writing. Jan-Rüdiger: Acquisition of imaging data and post-processing, data analysis, critical review of the manuscript. Ulrich Pilatus: Acquisition of imaging data and post-processing, data interpretation, critical review of the manuscript. Elke Hattingen: Statistical analysis, data interpretation, critical review of the manuscript. Ralf Deichmann:- Development of the quantitative MR imaging technique and the motion correction algorithm, critical review of the manuscript. Ulrike Nöth: Development of the quantitative MR imaging technique and the motion correction algorithm, critical review of the manuscript. Marlies Wagner: Conceptualization of the study, literature research, MRI image analysis, statistical analysis, writing. René-Maxime Gracien: Conceptualization of the study, data interpretation, technical advice regarding data analysis, MRI image analysis, critical review of the manuscript. Alexander Seiler: Conceptualization of the study, literature research, MRI image analysis, statistical analysis, writing.