
Abstract
Understanding cell-specific transcriptome responses following intracerebral hemorrhage (ICH) and ischemic stroke (IS) will improve knowledge of the immune response to brain injury. Transcriptomic profiles of 141 samples from 48 subjects with ICH, different IS etiologies, and vascular risk factor controls were characterized using RNA-seq in isolated neutrophils, monocytes and whole blood. In both IS and ICH, monocyte genes were down-regulated, whereas neutrophil gene expression changes were generally up-regulated. The monocyte down-regulated response to ICH included innate, adaptive immune, dendritic, NK cell and atherosclerosis signaling. Neutrophil responses to ICH included tRNA charging, mitochondrial dysfunction, and ER stress pathways. Common monocyte and neutrophil responses to ICH included interferon signaling, neuroinflammation, death receptor signaling, and NFAT pathways. Suppressed monocyte responses to IS included interferon and dendritic cell maturation signaling, phagosome formation, and IL-15 signaling. Activated neutrophil responses to IS included oxidative phosphorylation, mTOR, BMP, growth factor signaling, and calpain proteases-mediated blood–brain barrier (BBB) dysfunction. Common monocyte and neutrophil responses to IS included JAK1, JAK3, STAT3, and thrombopoietin signaling. Cell-type and cause-specific approaches will assist the search for future IS and ICH biomarkers and treatments.
Introduction
Of the peripheral leukocytes that respond to cerebrovascular injury, monocytes and neutrophils are major cell types that respond to intracerebral hemorrhage (ICH) and ischemic stroke (IS).1–3 They infiltrate injured vessels and brain, induce an inflammatory response, and participate in complex multiphasic damage and repair mechanisms. 4 , 5
Monocytes account for ∼2–8% of peripheral leukocytes and can be pro-inflammatory or anti-inflammatory. 6 Since monocytes transform into macrophages in injured tissue, gene expression changes in monocytes could provide a better understanding of this transformation. Monocyte recruitment to injured areas depends on cytokines and other factors. Pro-inflammatory monocytes express the C-C Motif Chemokine Receptor 2 protein (CCR2) important for monocyte mobilization, while anti-inflammatory monocytes express CX3CR1. 3 In the acute phase following IS, increased pro-inflammatory monocytes and reduced anti-inflammatory monocytes maintain vascular stability, eliminate necrotic cells, and induce macrophage/microglia M2 polarization. 7 A lower lymphocyte-to-monocyte ratio at admission is associated with worse stroke outcome. 8 In chronic IS pro-inflammatory, monocytes can convert to anti-inflammatory ones, mediating repair, and debris clearance. 7
Neutrophils are the most numerous peripheral blood leukocyte. Their counts increase a few hours after stroke and remain high for a week. Higher white blood cell counts and neutrophil-to-lymphocyte ratios are associated with worse stroke outcome. 9 , 10 Neutrophils may initiate stroke, by mediating thrombosis via interaction with platelets and atherosclerotic plaque. 11 They interact with the endothelium by binding adhesion molecules like ICAM-1 and interact with chemokines through their plasma membrane chemokine receptors. Neutrophils release proteases (i.e. elastase and proteinase 3) and peptidases such as MMP-9 which disrupt the BBB; and neutrophils release cytokines which attract other leukocytes and injure brain. 3 , 11 Neutrophils can polarize to subtypes, like N1, which produces IFNγ and TNFα, or to the N2 subtype, induced by TGFβ. The N2 subtype contributes to the resolution of inflammation and promotes clearance of neutrophils by macrophages.12–14
In ICH, infiltration of circulating leukocytes peaks between one and three days and persists for weeks. 1 Monocyte recruitment is mediated partly by CCR2 and CCR2 expressing cells are involved in hematoma clearance and recovery. 15 By 12-h post-ICH, monocytes outnumber neutrophils in the perihematomal area. 16 Activation of monocytes, monocyte-derived macrophages, and neutrophils occurs via cytokines and other inflammatory factors that further promote tissue damage. 1 , 17 , 18 Neutrophils produce reactive oxygen species (ROS) and attract monocytes and macrophages, 18 but at later stages produce lactoferrin to bind iron and contribute to hematoma resolution. 19
Though the immune response is important in stroke, the transcriptional changes in specific blood cell types in humans have not been studied. Our previous microarray studies following IS and ICH showed altered expression for some genes in whole blood that were monocyte- or neutrophil-specific. 20 , 21 For IS, innate immune responses were enriched in PMN-specific genes, including TREM1, interleukins, and interleukin receptors. Differentially expressed transcripts found in whole blood showed enrichment of neutrophil and monocyte specific genes in ICH and for neutrophil genes in IS. 21 We have previously shown that different IS causes have a specific gene response in whole blood.22–24 Thus, here we analyzed the transcriptomic responses of isolated monocytes and neutrophils from ischemic strokes of cardioembolic (CE), large vessel (LV), and small vessel (SV) etiologies, and ICH when compared to controls with vascular risk factors (VRFC).
We show, for the first time in humans, that there are cell type-specific gene expression profiles in monocytes and neutrophils following ICH and IS and its different etiologies. These cell-specific human data will provide novel biomarkers and therapeutic targets, and will help inform future experimental stroke model studies as to whether the immune responses in animal models are similar to those seen in human ICH and IS.
Materials and methods
Patients and sample preparation
The protocol was approved by the University of California-Davis Institutional Review Board (IRB-ID 248994-41) and adheres to all federal and state regulations related to the protection of human research subjects, including The Common Rule, The Belmont Report, and Institutional policies and procedures. Written informed consent was obtained from ischemic stroke (IS), spontaneous intracerebral hemorrhage (ICH), and vascular risk factor control (VRFC) subjects at the UC Davis Medical Center from all participants or their proxy. Stroke diagnoses were made by history, exam, and CT or MRI by two neurologists. Ischemic strokes included three etiologies: cardioembolic (CE), large vessel (LV), and small vessel (SV). Three ischemic stroke patients of 33 received thrombolytic therapy (recombinant tissue plasminogen activator, rtPA). None of the IS cases developed hemorrhagic transformation. Subjects were excluded from the study with current or recent (two weeks) infection, anticoagulation, immunosuppressive therapy, or blood malignancies. Control subjects had vascular risk factors (hypertension, hypercholesterolemia, diabetes mellitus type 2, and/or smoking) (VRFC) but no history of stroke, myocardial infarction, or peripheral vascular disease. Blood was collected by venipuncture in PAXgene whole blood RNA tubes and K2 EDTA tubes (BD Biosciences). Monocytes and neutrophils were isolated using the RoboSep Cell Isolation Protocol, with the EasySep human buffy coat CD14+ selection for monocytes, and isolation kits which negatively selected neutrophils (Stemcell Technologies Inc.). Cell purity was validated using flow cytometry on a BD LSR II (Becton Dickinson) and fluorescent antibodies directed to cell-type specific markers not used for cell sorting. Monocytes were detected by anti-CD36-APC (Biolegend) with purity >93%; neutrophils were detected with dual labels for anti-CD16-PE and anti-CD66b-FITC (Biolegend) with purity >99% (Supplementary Figure 1(a) and (b)).
RNA isolation and library preparation
Total RNA was extracted from monocyte and neutrophil samples using Zymo Direct-zol RNA mini-prep kit (Zymo Research), as per manufacturer’s protocol, followed by DNase treatment (QIAgen). RNA from whole blood samples was extracted using Qiagen QIAcube with PAXgene Blood mRNA Kit (QIAgen). Libraries were prepared using NuGEN Ovation Universal RNA-Seq system (Tecan). Ribosomal RNA and globin transcripts were depleted using InDA-C (Tecan).
RNA-seq analyses
RNA sequencing was performed on Illumina HiSeq 4000 platform with an average of 200 M ± 10M PE (paired-end) reads per sample. Raw reads were processed with expHTS 25 to trim low-quality sequences and adapter contamination, and to remove PCR duplicates. Trimmed reads were aligned using STAR v.2.5.2b aligner 26 to the human GRCh38 primary assembly genome with GENCODE v25 annotation. Raw counts/genes were generated using featureCounts of the Subread software v.1.6.0. 27 Raw counts were normalized (transcripts per million, TPM) per sample. Partek Genomics suite was used to analyze differentially expressed genes using analysis of covariance (ANCOVA) models and REML variance estimate. 28 The statistical models are outlined in the results below. Fisher's least significant difference (LSD) was used for individual contrasts. 29 Principal component analyses were performed using Partek Genomics suite. Gene ontology enrichment was explored using DAVID. 30 , 31
Pathway and upstream regulation analyses
Pathway enrichment analyses were performed using ingenuity pathway analysis (IPA, Ingenuity Systems®, QIAgen). 32 Gene lists analyzed in IPA used uncorrected p < 0.05 and FC > |1.2| to provide more genes per pathway. Pathways with Fisher’s exact test p < 0.05 were considered statistically over-represented. In the figures, pathways with Benjamini–Hochberg corrected p < 0.05 are labeled with an asterisk. IPA also predicted significant pathway activation (Z ≥ 2.0) or significant suppression (Z ≤ −2). The Z-score is based on an algorithm that compares the input dataset with pathway patterns, accounting for the activation state of molecules related to the pathway, causal relationships, and curated literature. Upstream transcriptional regulators were also predicted.
Results
Subject demographics and samples analyzed
The cohort demographics and clinical characteristics are presented in Table 1. Sex was not significant. Age was significantly different for IS versus control and IS versus ICH comparisons; thus, age was included in the statistical models. Time from symptom onset to the blood collection time was significantly different between IS and ICH, but not for the main comparisons between IS and VRFC, and ICH and VRFC. Given the broad range of times in both groups, we did not include this variable in our gene expression model in order to analyze the consistent aspect of the immune response irrespective of time. Thus, the ICH data encompass a period after ICH of ∼ 0.5 to 3.5 days, and the IS data encompass a period of ∼0.5 to 2.0 days. Hypertension was not significantly different between the groups, while diabetes and hypercholesterolemia were for IS versus VRFC and ICH versus VRFC, but not for IS versus ICH (Table 1). Smoking status was not significantly different between groups. We investigated the differentially expressed gene (DEGs) lists by hierarchical clustering to make sure the differential responses were not driven by these vascular risk factor differences (not shown). Most subjects (n = 44 of 48) had three sample types – neutrophils, monocytes, and whole blood. Analysis at the whole transcriptome level showed a clear separation of transcriptomes based on sample type (Supplementary Figure 1(c)), which is consistent with the presence of two distinct cell populations (monocytes and neutrophils) and whole blood.
Cohort demographics and relevant clinical characteristics.
aNIHSS available on 32/33 IS subjects.
Specific monocyte, neutrophil, and whole blood responses following ICH and ischemic stroke
For analyses of the genomic changes associated with IS and ICH, differentially expressed genes were identified using a mixed effects regression model including Sample_Type (monocytes (M), neutrophils (N), whole blood (WB)), Diagnosis (IS, ICH, VRFC), Subject_ID (random effect), age, and an interaction Sample_Type * Diagnosis. Genes with FDR (False Discovery Rate)-corrected p(Sample_Type*Diagnosis) < 0.2, which also had p < 0.05 and fold change (FC) > |1.2| for individual contrasts, were considered DEGs.
ICH versus VRFC
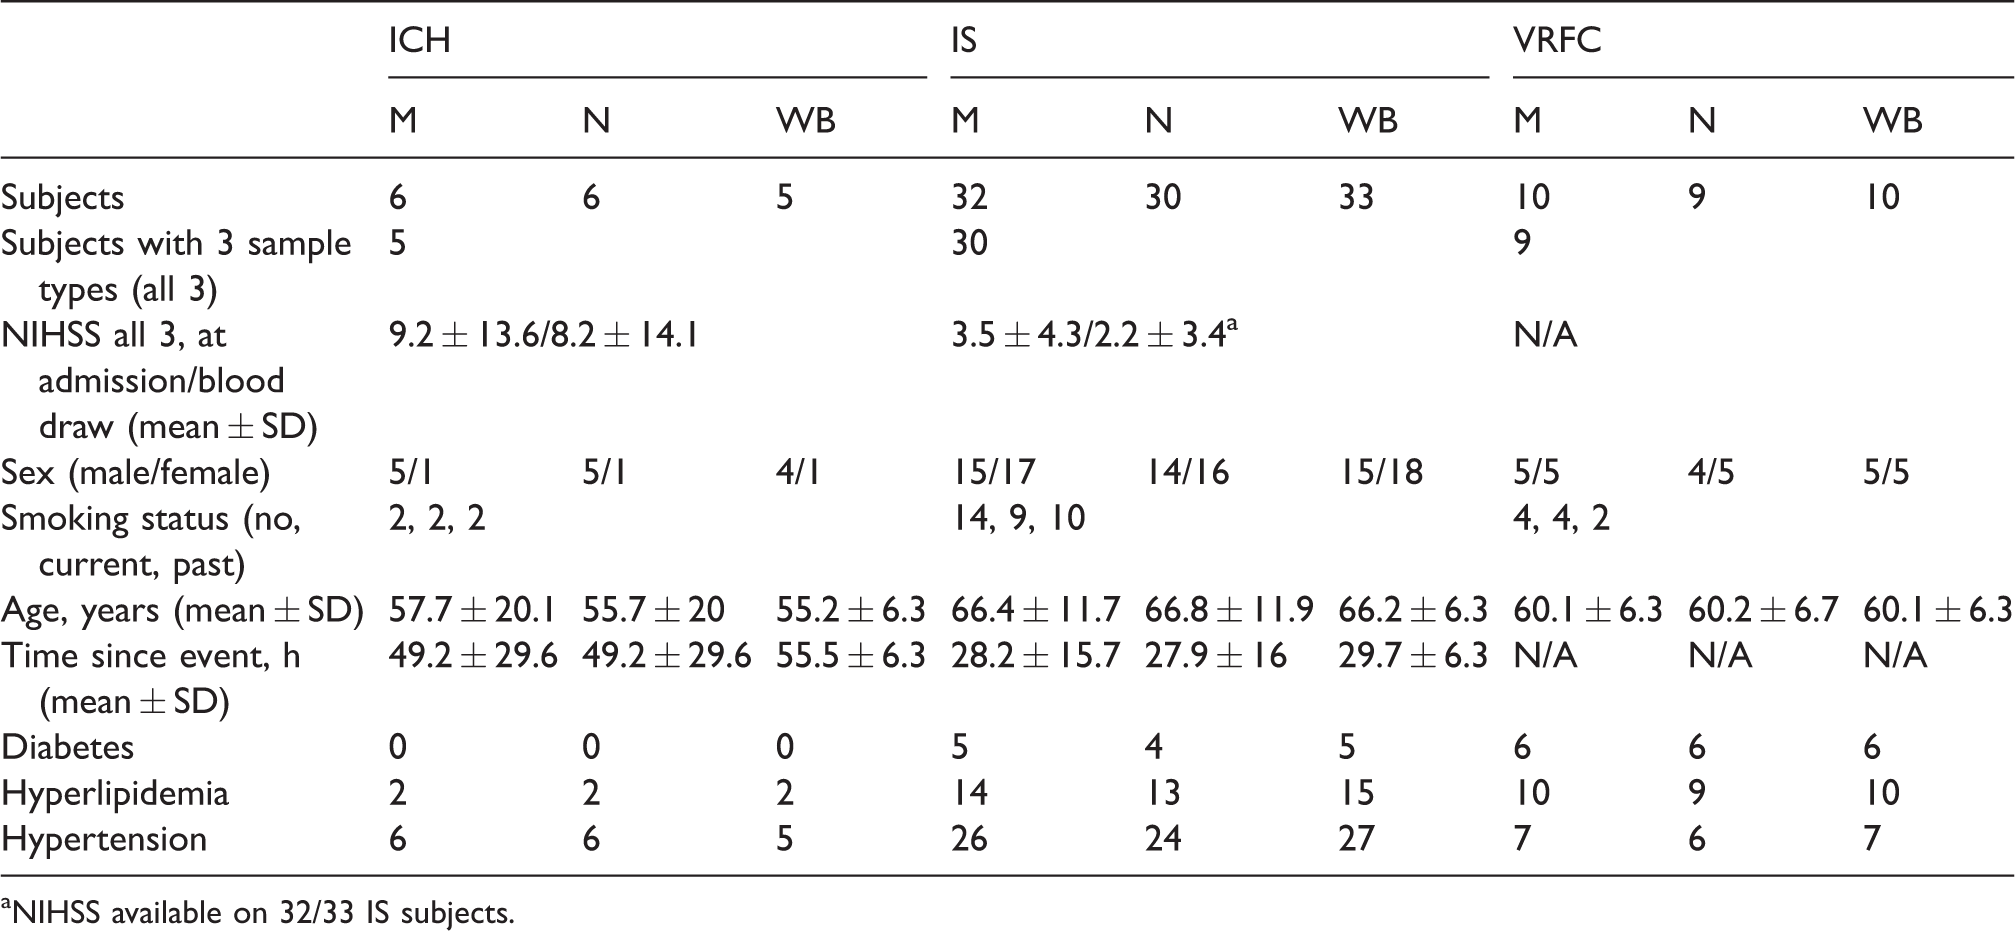
Using the above criteria, a total of 51, 295, and 177 DEGs were found for ICH versus VRFC in monocytes, neutrophils and whole blood, respectively (FDR p(Dx)<0.2 and p < 0.05) (Figure 1(a)). Only the GBP5 gene (guanylate binding protein 5, an activator of NLRP3 inflammasome assembly) was shared between all three sample types. There was significant overlap of DEGs between monocytes and WB (p < 10e-16), neutrophils and WB (p < 10e-16), and between M and N (p = 5.2e-10) (Figure 1(a)). The ICH signatures revealed group separation (ICH vs. VRFC) in both monocytes and neutrophils on principal components analysis (PCA) (Figure 1(b)). Since blood samples’ collection time from onset was within 3.5 days for ICH patients and within 2 days for IS patients, we investigated whether ICH subjects with earlier blood draws would group together and separately from ICH subjects with later blood draws based on the DEG signatures. No subgrouping was observed after performing unsupervised hierarchical clustering of monocyte and neutrophil DEGs between ICH and VRFC (Supplementary Figure 2).
Molecular signatures for ICH versus VRFC in the sample types analyzed. (a) Venn diagram of the numbers of DEGs in monocytes (green), neutrophils (orange), and whole blood (brown); (b) principal component analyses (PCA) using the DEGs in ICH-monocytes versus VRFC-monocytes (left PCA) and ICH-neutrophils versus VRFC-neutrophils (right PCA); (c) Venn diagram of the numbers of over-represented significant canonical pathways (p < 0.05) for ICH; (d) common pathways in all three sample types – monocytes, neutrophils, and whole blood. The asterisk depicts significant pathways that passed additional stringency criteria (Benjamini–Hochberg corrected p-value < 0.05). In the plot, orange cells indicate predicted activation of the pathway, blue ones show predicted inhibition, grey cells – no prediction can be performed, and white depicts no direction can be inferred. The shades for every colored cell represent z-scores values. Arrows represent the direction of the change for significant activation (Z ≥ 2= activation, up arrow); or significant inhibition (Z ≤ −2, down arrow). Top enriched pathways are shown for monocytes (e) and neutrophils (f). Role of pattern recognition receptors in recognition of bacteria and viruses is abbreviated.
Pathway enrichment analysis functionally characterized the immune response per cell type: 573, 3250, and 2550 DEG for ICH in monocytes, neutrophils, and whole blood, respectively, were considered for the analysis (p < 0.05) (Table S2). The monocyte ICH response included significant suppression (Z ≤ −2) of pathways including dendritic cell maturation, TREM1 signaling, role of pattern recognition receptors, neuroinflammation signaling, interferon signaling, and Inflammasome (Table S3). None of the 82 monocyte ICH pathways were predicted to be significantly activated (Z ≥ 2). The neutrophil activated ICH response included relaxin signaling, notch signaling, GnRH (gonadotropin-releasing hormone) signaling, inositol phosphate compounds, and NGF signaling, and one significantly suppressed pathway – interferon signaling (Table S3). Most overrepresented pathways in monocytes and neutrophils were shared with those enriched in whole blood (69.5% and 77.6%, respectively) (Figure 1(c)). Notably, some of the common pathways between monocytes and whole blood have opposite activation/suppression status (Figure 1(d)) like neuroinflammation signaling, predicted to be inhibited in monocytes and activated in whole blood. Considering the cell-specific responses in monocytes (Figure 1(e) and Table S3) to ICH, the top pathways included communication between innate and adaptive immune cells, crosstalk between dendritic and natural killer cells, and atherosclerosis. In neutrophils, the top ICH pathways (Figure 1(f) and Table S3) included tRNA charging, linolenate, cholesterol, and nucleotide synthesis.
IS versus VRFC
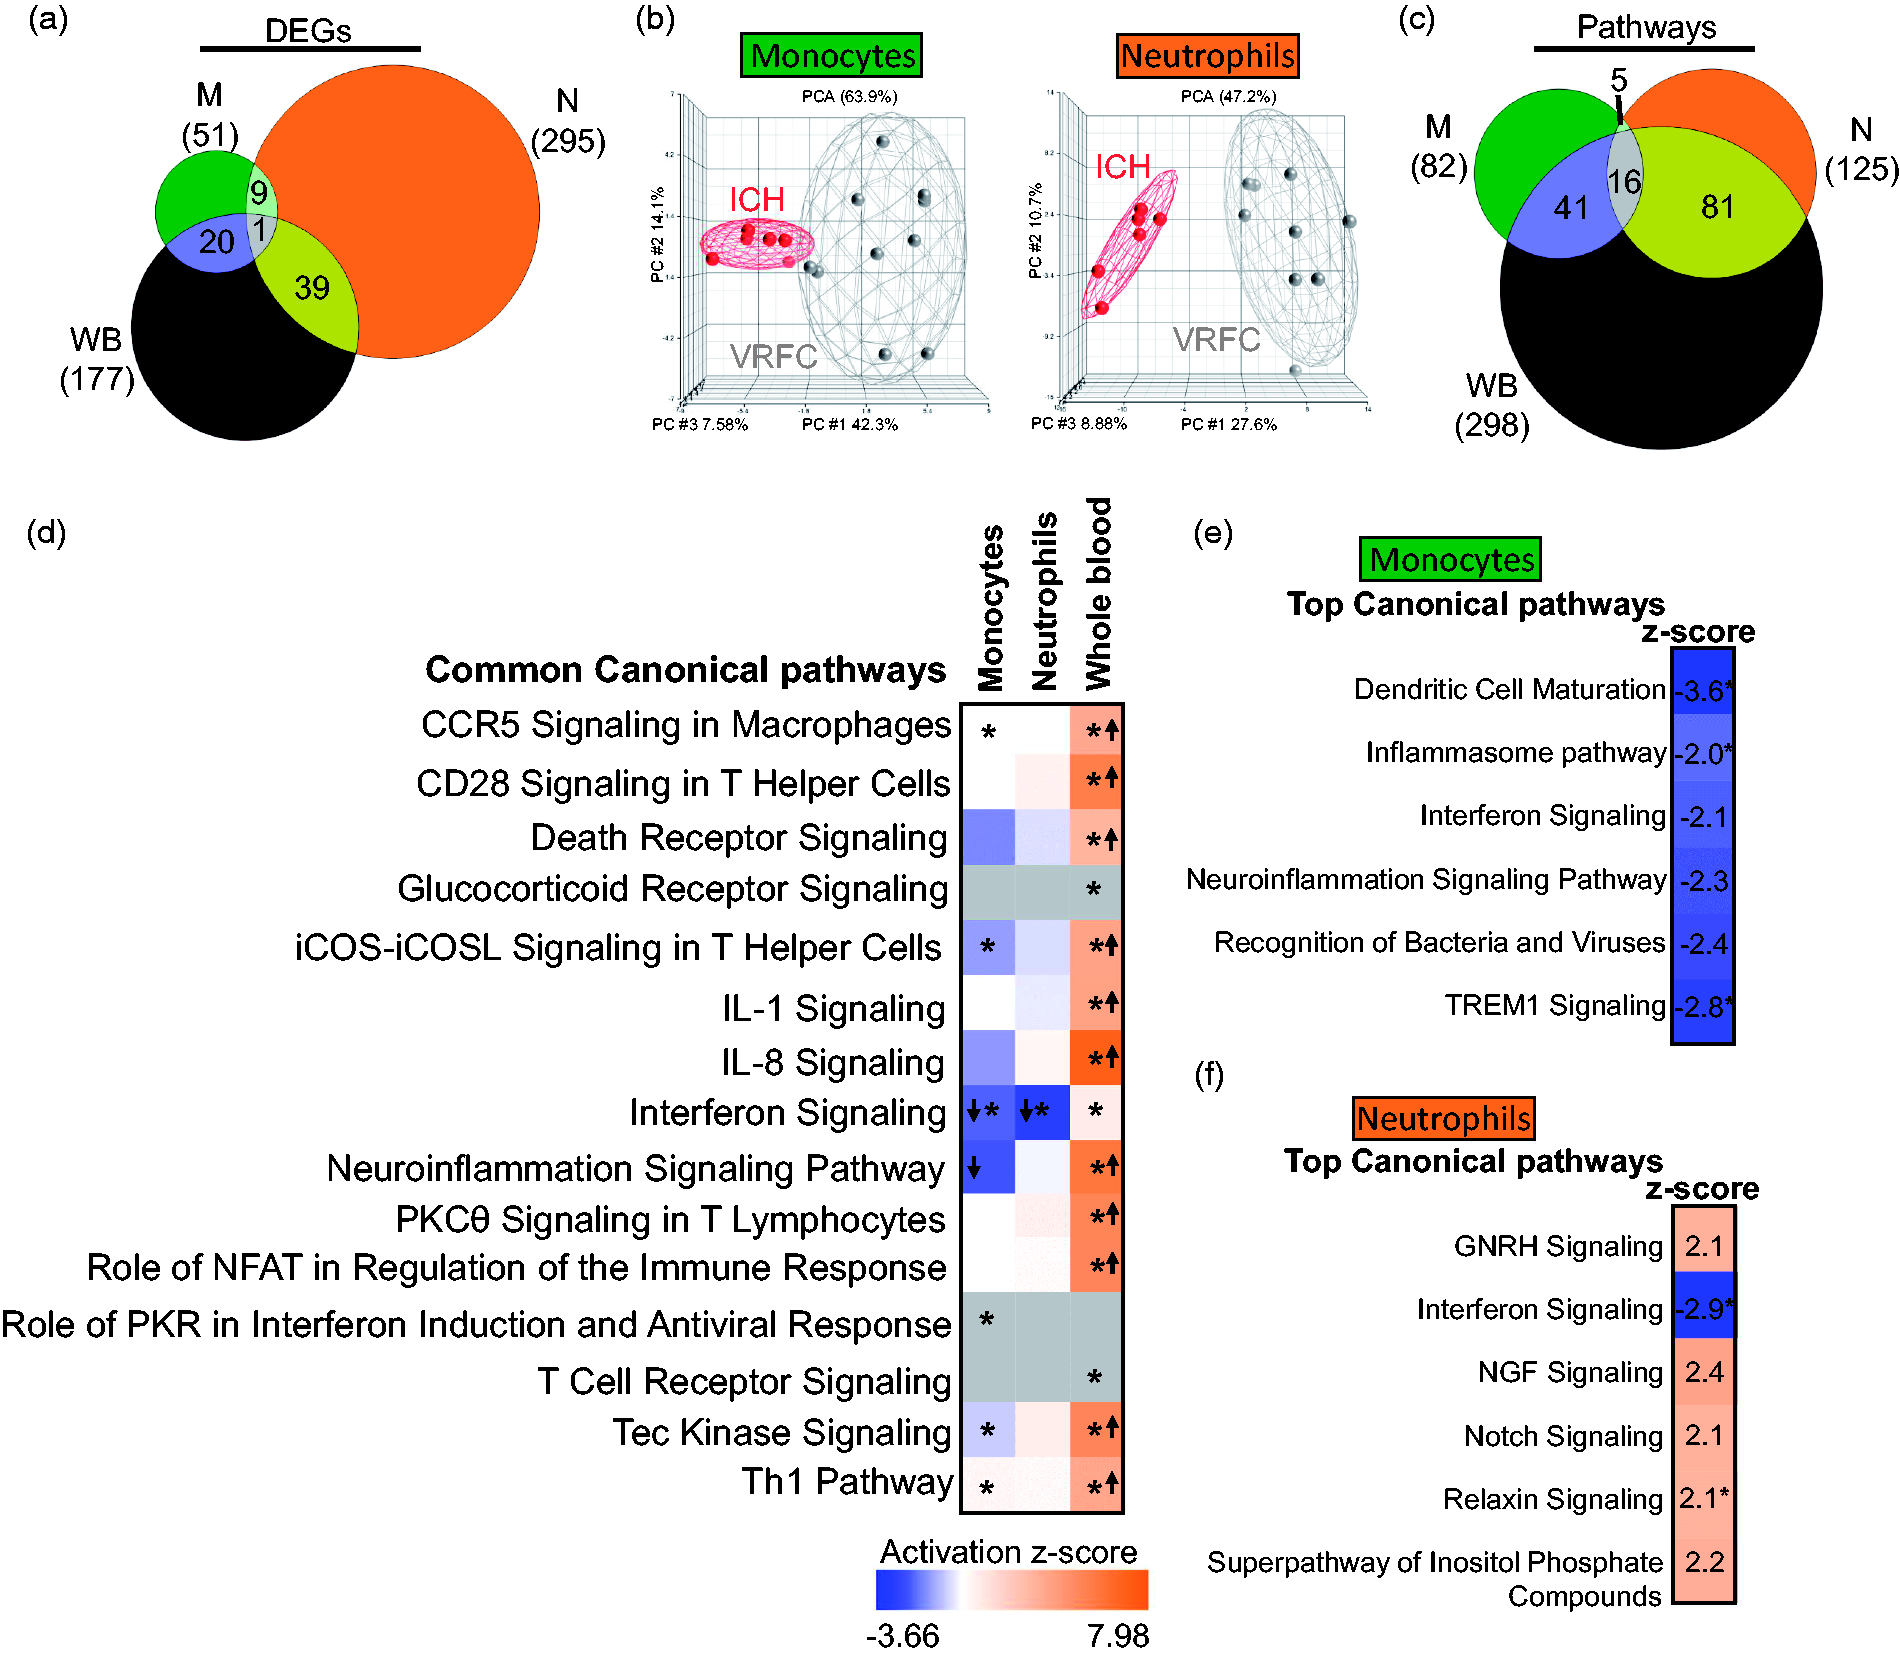
Analysis of IS subjects irrespective of IS cause yielded 27, 248, and 77 DEGs in IS versus VRFC (monocytes, neutrophils, and whole blood, respectively) (FDR p(Dx) <0.2 and p < 0.05 for each individual contrast) (Figure 2(a)) (Supplementary Table S1). There was significant overlap of DEGs between monocytes and WB (p = 0.003), neutrophils and WB (p < 10e-16), and between M and N (p = 0.002) (Figure 2(a)). The IS signatures revealed separation of monocytes and neutrophils on PCA (Figure 2(b)). rtPA administration in three IS patients did not affect the differential expression results, as no subgrouping was observed after performing unsupervised hierarchical clustering of the monocytes’ and neutrophils’ DEGs between IS and VRFC (Supplementary Figure 3).
Molecular signatures for IS versus VRFC in the sample types analyzed. (a) Venn diagram of the numbers of DEGs in monocytes (green), neutrophils (orange), and whole blood (brown); (b) principal component analyses (PCA) using the DEGs in IS-monocytes versus VRFC-monocytes (left PCA) and IS-neutrophils versus VRFC-neutrophils (right PCA), the effects of additional factors were removed before plotting. (c) Venn diagram of the numbers of over-represented significant canonical pathways (p < 0.05) for IS; (d) common pathways in monocytes and neutrophils. Top enriched pathways are shown for monocytes (e) and neutrophils (f). The asterisk depicts significant pathways that passed additional stringency criteria (Benjamini–Hochberg corrected p-value < 0.05). In the plot, orange cells indicate predicted activation of the pathway, blue ones show predicted inhibition, grey cells – no prediction can be performed, and white depicts no direction can be inferred. The shades for every colored cell represent z-scores values. Arrows represent the direction of the change for significant activation (Z ≥ 2 = activation, up arrow); or significant inhibition (Z ≤ −2, down arrow).
DEGs subjected to pathway analysis for IS included 365, 3366, and 1855 genes (monocytes, neutrophils, and whole blood, respectively) with p < 0.05 for each individual contrast. The monocyte IS response included significant suppression (Z ≤ −2) of dendritic cell maturation, interferon, TREM1, and IL-7 signaling pathways (Table S3). None of the 54 monocyte IS pathways were significantly activated (Z ≥ 2). The neutrophil IS response included significantly activated pathways including TGF-β, mTOR, Integrin, BMP, GM-CSF, and IL-3 signaling (Table S3). No neutrophil IS pathway was significantly suppressed. There was little overlap of enriched canonical pathways (Figure 2(c)). Pathways related to cytokine signaling, STAT3, and thrombopoietin signaling were common between monocytes and neutrophils, with significant activation of thrombopoietin signaling in neutrophils (Figure 2(d)). Pathway analysis of IS monocytes showed significantly inhibited pathways (Z ≤ −2) including interferon and dendritic cell maturation (Figure 2(e)). IS neutrophils had activated oxidative phosphorylation, mTOR signaling, and calpain protease pathways (Figure 2(f)).
ICH versus IS
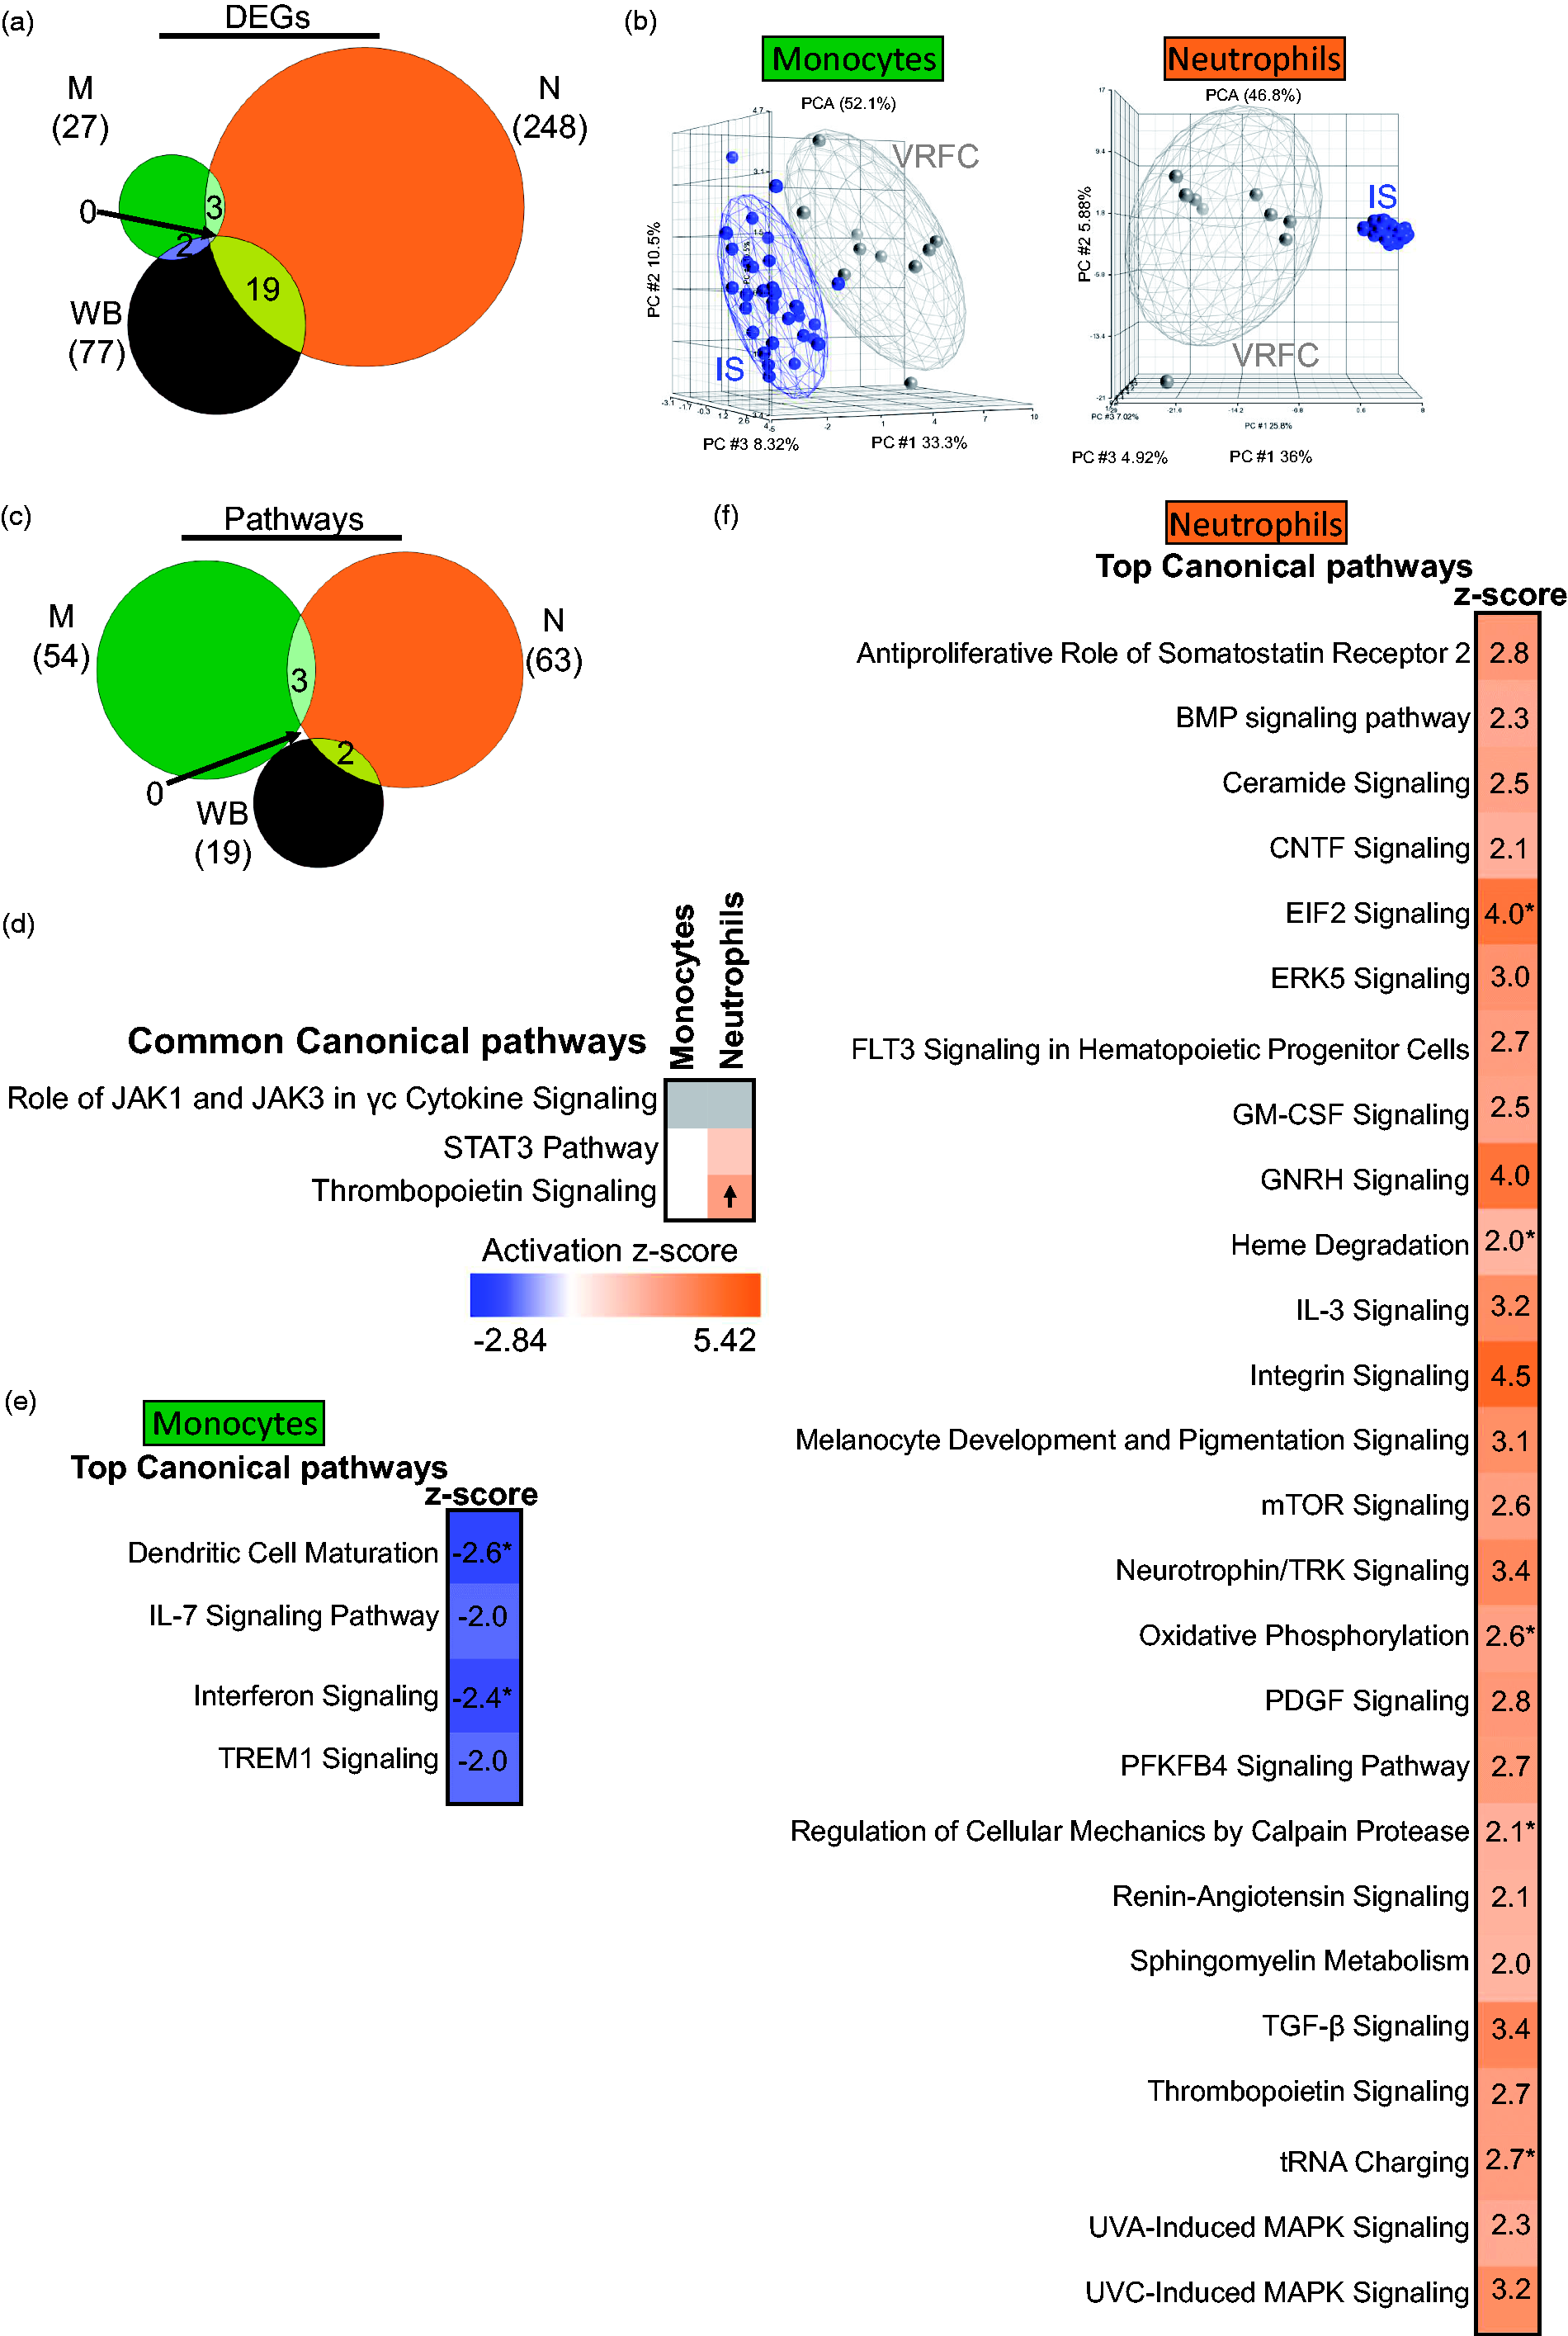
ICH was compared to IS to identify common and specific responses to ICH and IS. Overlaps between the DEGs in the transcriptional response of IS_M and ICH_M, IS_N and ICH_N and IS_WB and ICH_WB were all highly significant (p < e-16 for each of the overlaps) (Figure 3(a)). For IS, the shared genes with ICH were fairly constant – in monocytes (67%), neutrophils (68%), and whole blood (66%), while for ICH there was a more variable response – the largest proportion of genes shared with IS was in ICH neutrophils (57%), followed by ICH monocytes (35%) and ICH whole blood (29%). PCAs using all DEGs in IS and ICH showed good separation of ICH and IS from VRFC for the monocyte and neutrophil genes (Figure 3(a), bottom row). At the pathway level (Supplementary Table S3 and Figure 3(b) and (c)), when comparing between IS and ICH, the latter has a higher number of significant over-represented pathways in both monocytes and neutrophils. In monocytes, signaling pathways (i.e. STAT3, NF-κβ) and immune pathways, such as interferon, dendritic cell maturation and TREM1 signaling, were enriched and predicted to be suppressed in both IS and ICH. For neutrophils, over-represented pathways seen in both groups included mitochondrial dysfunction, TGF-β, protein regulation, and PPARα. GNRH signaling was predicted to be activated in both ICH and IS, and was previously identified in our study of ruptured versus non-ruptured brain arteriovenous malformations. 33
Comparison of the transcriptional changes in ICH and IS (irrespective of IS-cause). (a) Venn diagrams are shown for the genes found DE in IS and ICH according to the criteria used (FC > |1.2|, p < 0.05 for the individual contrasts and having Sample_Type * Diagnosis FDR (step up) < 0.2), in monocytes, neutrophils, and whole blood. The overlap of DEGs between ICH and IS is significant (hypergeometric test). From all the gene lists included in the Venn diagrams, below are the corresponding PCAs, where grey circles indicate VRFC, red depicts ICH, and blue, IS. Ellipsoids represent two standard deviations from the centroid. Top 10 canonical pathways for IS and ICH (Fisher’s p-value < 0.05) in (b) monocytes and (c) neutrophils are presented. The asterisk depicts pathways with Benjamini–Hochberg corrected p-value < 0.05. In the plot, orange cells indicate predicted activation of the pathway, blue ones show predicted inhibition, white cells – no direction can be predicted, and grey depicts no prediction can be performed. The shades for every colored cell represent z-scores values. Arrows indicate predicted significant activation (Z ≥ 2, up arrow) or significant inhibition (Z ≤ −2, down arrow) of the pathway. Melanocyte development and pigmentation signaling is abbreviated. The Venn diagrams next to the heatmaps represent the number of pathways with p-value < 0.05 for both diagnoses in monocytes (b) and neutrophils (c).
For pathways exclusively enriched in either IS or ICH (Supplementary Figure 4 and Table S3), monocyte cytokine signaling, phagosome formation, and suppressed IL-7 signaling were among the top 10 pathways in IS, while ICH monocyte pathways included innate and adaptive immune cell communication, crosstalk between dendritic and NK cells, CCR5 and atherosclerosis signaling. In neutrophils, IS-specific activated pathways included heme degradation, EIF2, oxidative phosphorylation, mTOR, and calpain protease signaling. In ICH neutrophils, interferon signaling was significantly suppressed, while Relaxin signaling, involved in vasodilation and angiogenesis, was significantly activated along with fMLP signaling which regulates cytokines (Supplementary Figure 4(b) and Table S3).
Predicted upstream transcriptional regulators, which can identify drivers of the differential expression in IS or ICH, are presented in Supplementary Table S4. ICH has more unique regulators than IS, while 37–42% of the IS’s upstream regulators were shared with ICH upstream regulators in both cell types. Interferon-related proteins are common regulators in ICH and IS for both monocytes and neutrophils (Supplementary Figure 5).
Specific monocyte, neutrophil, and whole blood responses following ischemic stroke of different etiologies
For the genomic changes associated with IS causes, DEGs were identified using a mixed effects regression model including Sample_Type (M, N, WB), diagnosis (IS-CE, IS-LV, IS-SV, ICH, VRFC), Subject_ID (random effect), age, and an interaction Sample_Type*Diagnosis. Genes with FDR-corrected p (Sample_Type*Diagnosis) < 0.2 (535 genes), which also had p < 0.05 and FC>|1.2| for individual contrasts, were considered DEGs.
Transcriptome differences between different cell types per IS cause
In cardioembolic IS, there were 23, 179, and 77 DEGs in monocytes, neutrophils, and whole blood, respectively, when compared to VRFC (Figure 4(a), Supplementary Table 5). In large vessel IS, there were 24, 170, and 159 DEGs in monocytes, neutrophils, and whole blood, respectively, when compared to VRFC (Figure 4(b), Supplementary Table 5). In small vessel IS, there were 23, 188, and 43 DEGs in monocytes, neutrophils, and whole blood, respectively, when compared to VRFC (Figure 4(c), Supplementary Table 5). Based on all DEGs for each IS cause, PCAs (Figure 4) showed separation of the sample types per diagnostic group (whole blood, not shown). Figure 4 shows a high percentage of unique DEGs per sample type, demonstrating cell-type specific response for monocytes and neutrophils. A role for other cell types is supported by the many specific DEGs in whole blood.
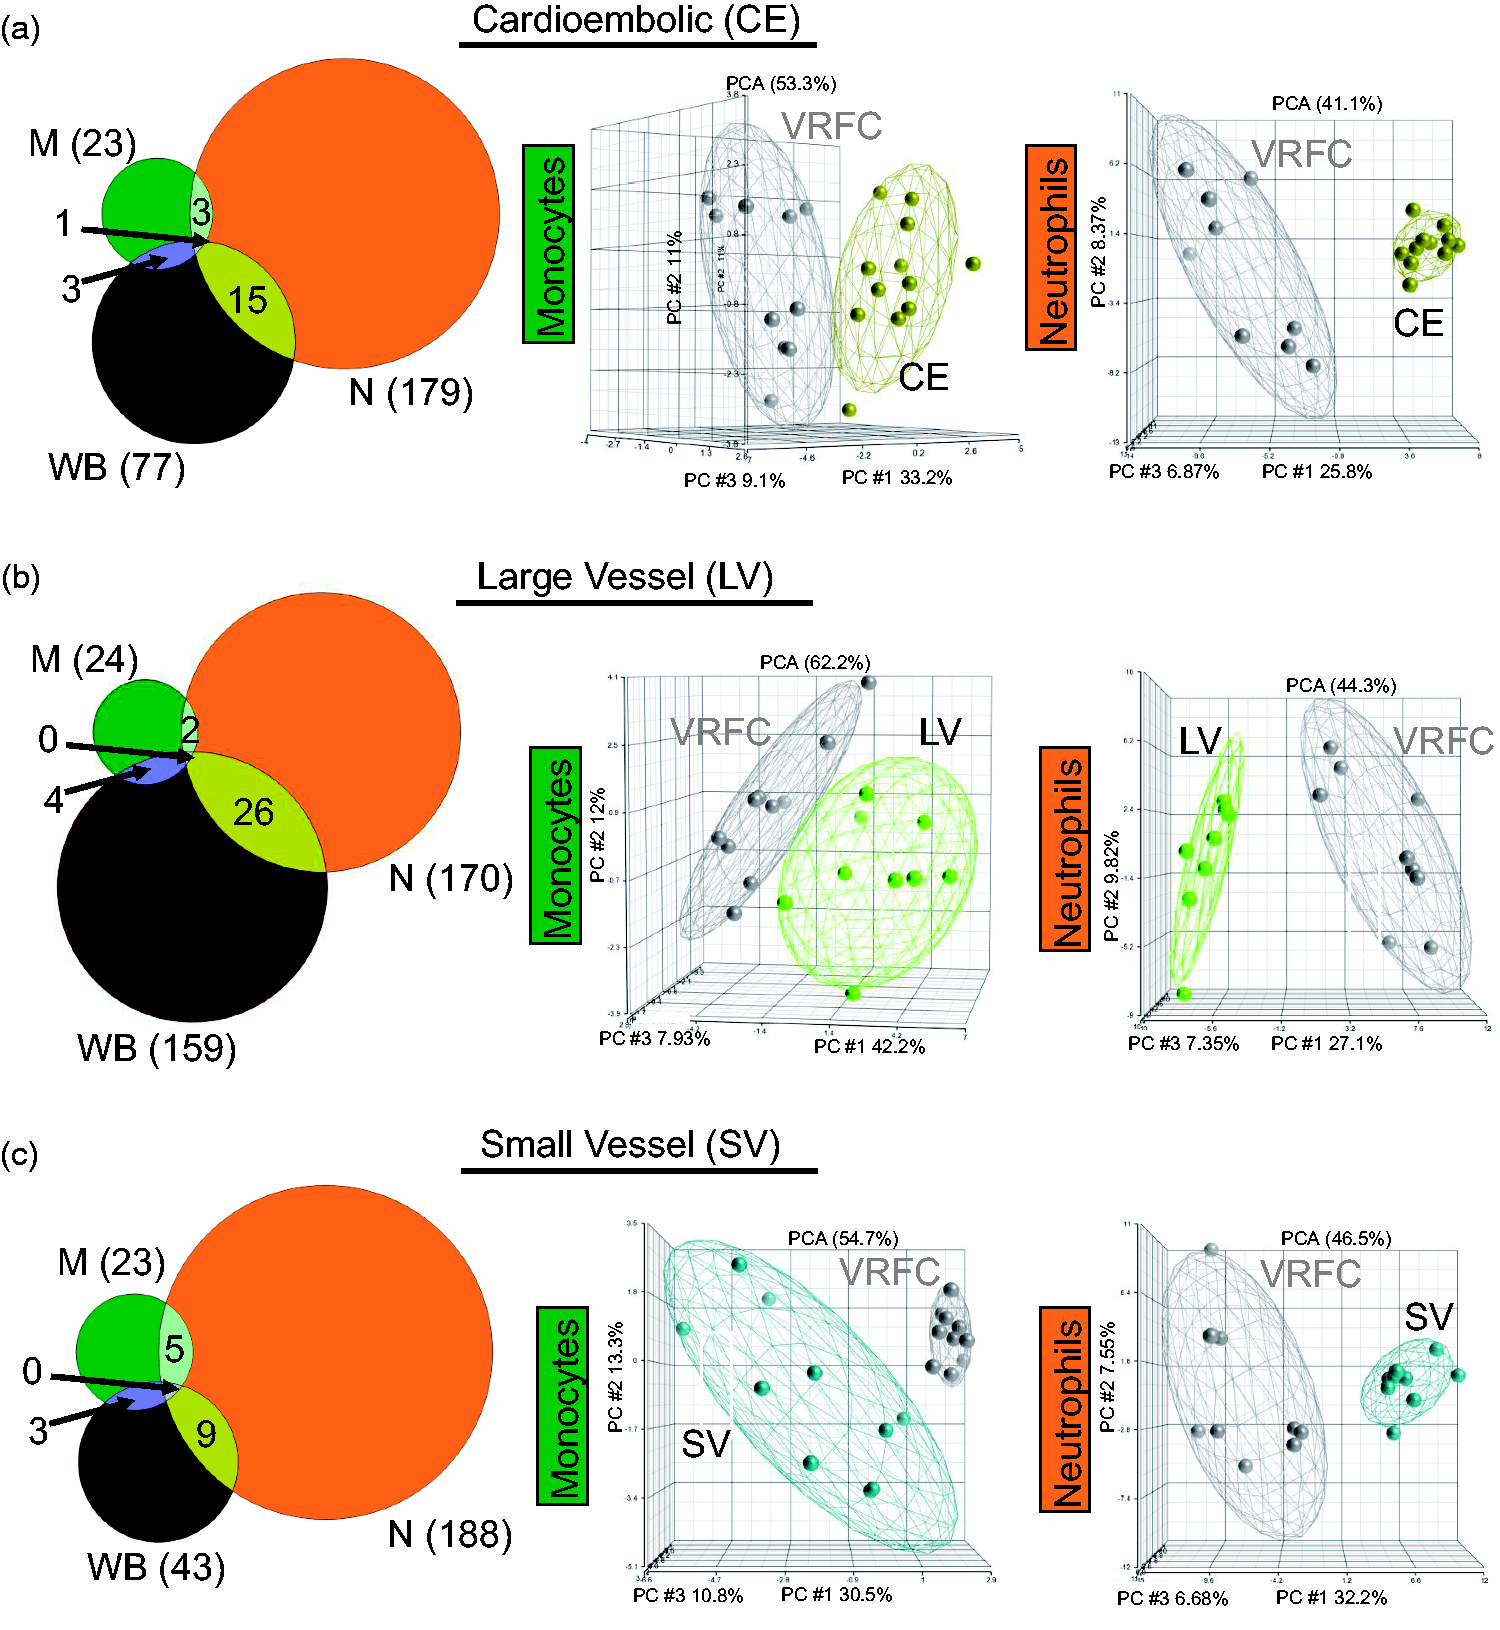
Comparison of the transcriptional changes in IS in the sample types analyzed in monocytes (green), neutrophils (orange), and whole blood (brown) considering IS cause. Venn diagrams and principal component analyses are shown for all the DEGs (fold change ±1.2 plus overlap of FDR (step up) < 0.2, with p-value < 0.05 for the ANOVA interactions assessed against VRFC: (a) CE stroke, (b) LV stroke, and (c) SV stroke). Ellipsoids represent two standard deviations from the centroid.
The number of significant pathways in all three causes of stroke was similar in the three sample types (p < 0.05) (Figure 5), except for LV in whole blood, for which there were ∼5 times as many pathways compared to CE and SV stroke. This suggests a greater involvement of other blood cells in the response to LV stroke (Figure 5 and Table S7). The monocyte response of IS-CE subjects included GM-CSF and STAT3 signaling which were significantly suppressed, while in IS-SV, interferon and TREM1 signaling were significantly suppressed (Figure 5, Table S7). The neutrophil response in all IS causes included many activated pathways, i.e. oxidative phosphorylation in IS-CE, ERK5 signaling in IS-LV, and EIF2 signaling in IS-SV (Figure 5, Table S7). Notably, the neutrophil IS-SV response included several activated metabolic pathways, including four cholesterol biosynthesis pathways implicated in experimental SV stroke. 34 Monocytes display many pathways related to immune response regulation (Figure 5) and showed a larger number of upstream regulators than neutrophils (Supplementary Figure 6 and Table S8). Interferon pathway regulators were over-represented in monocytes for all IS etiologies. The predicted upstream neutrophil pathways were mediated more by cell and molecular regulation pathways (Supplementary Figure 6 and Table S8).
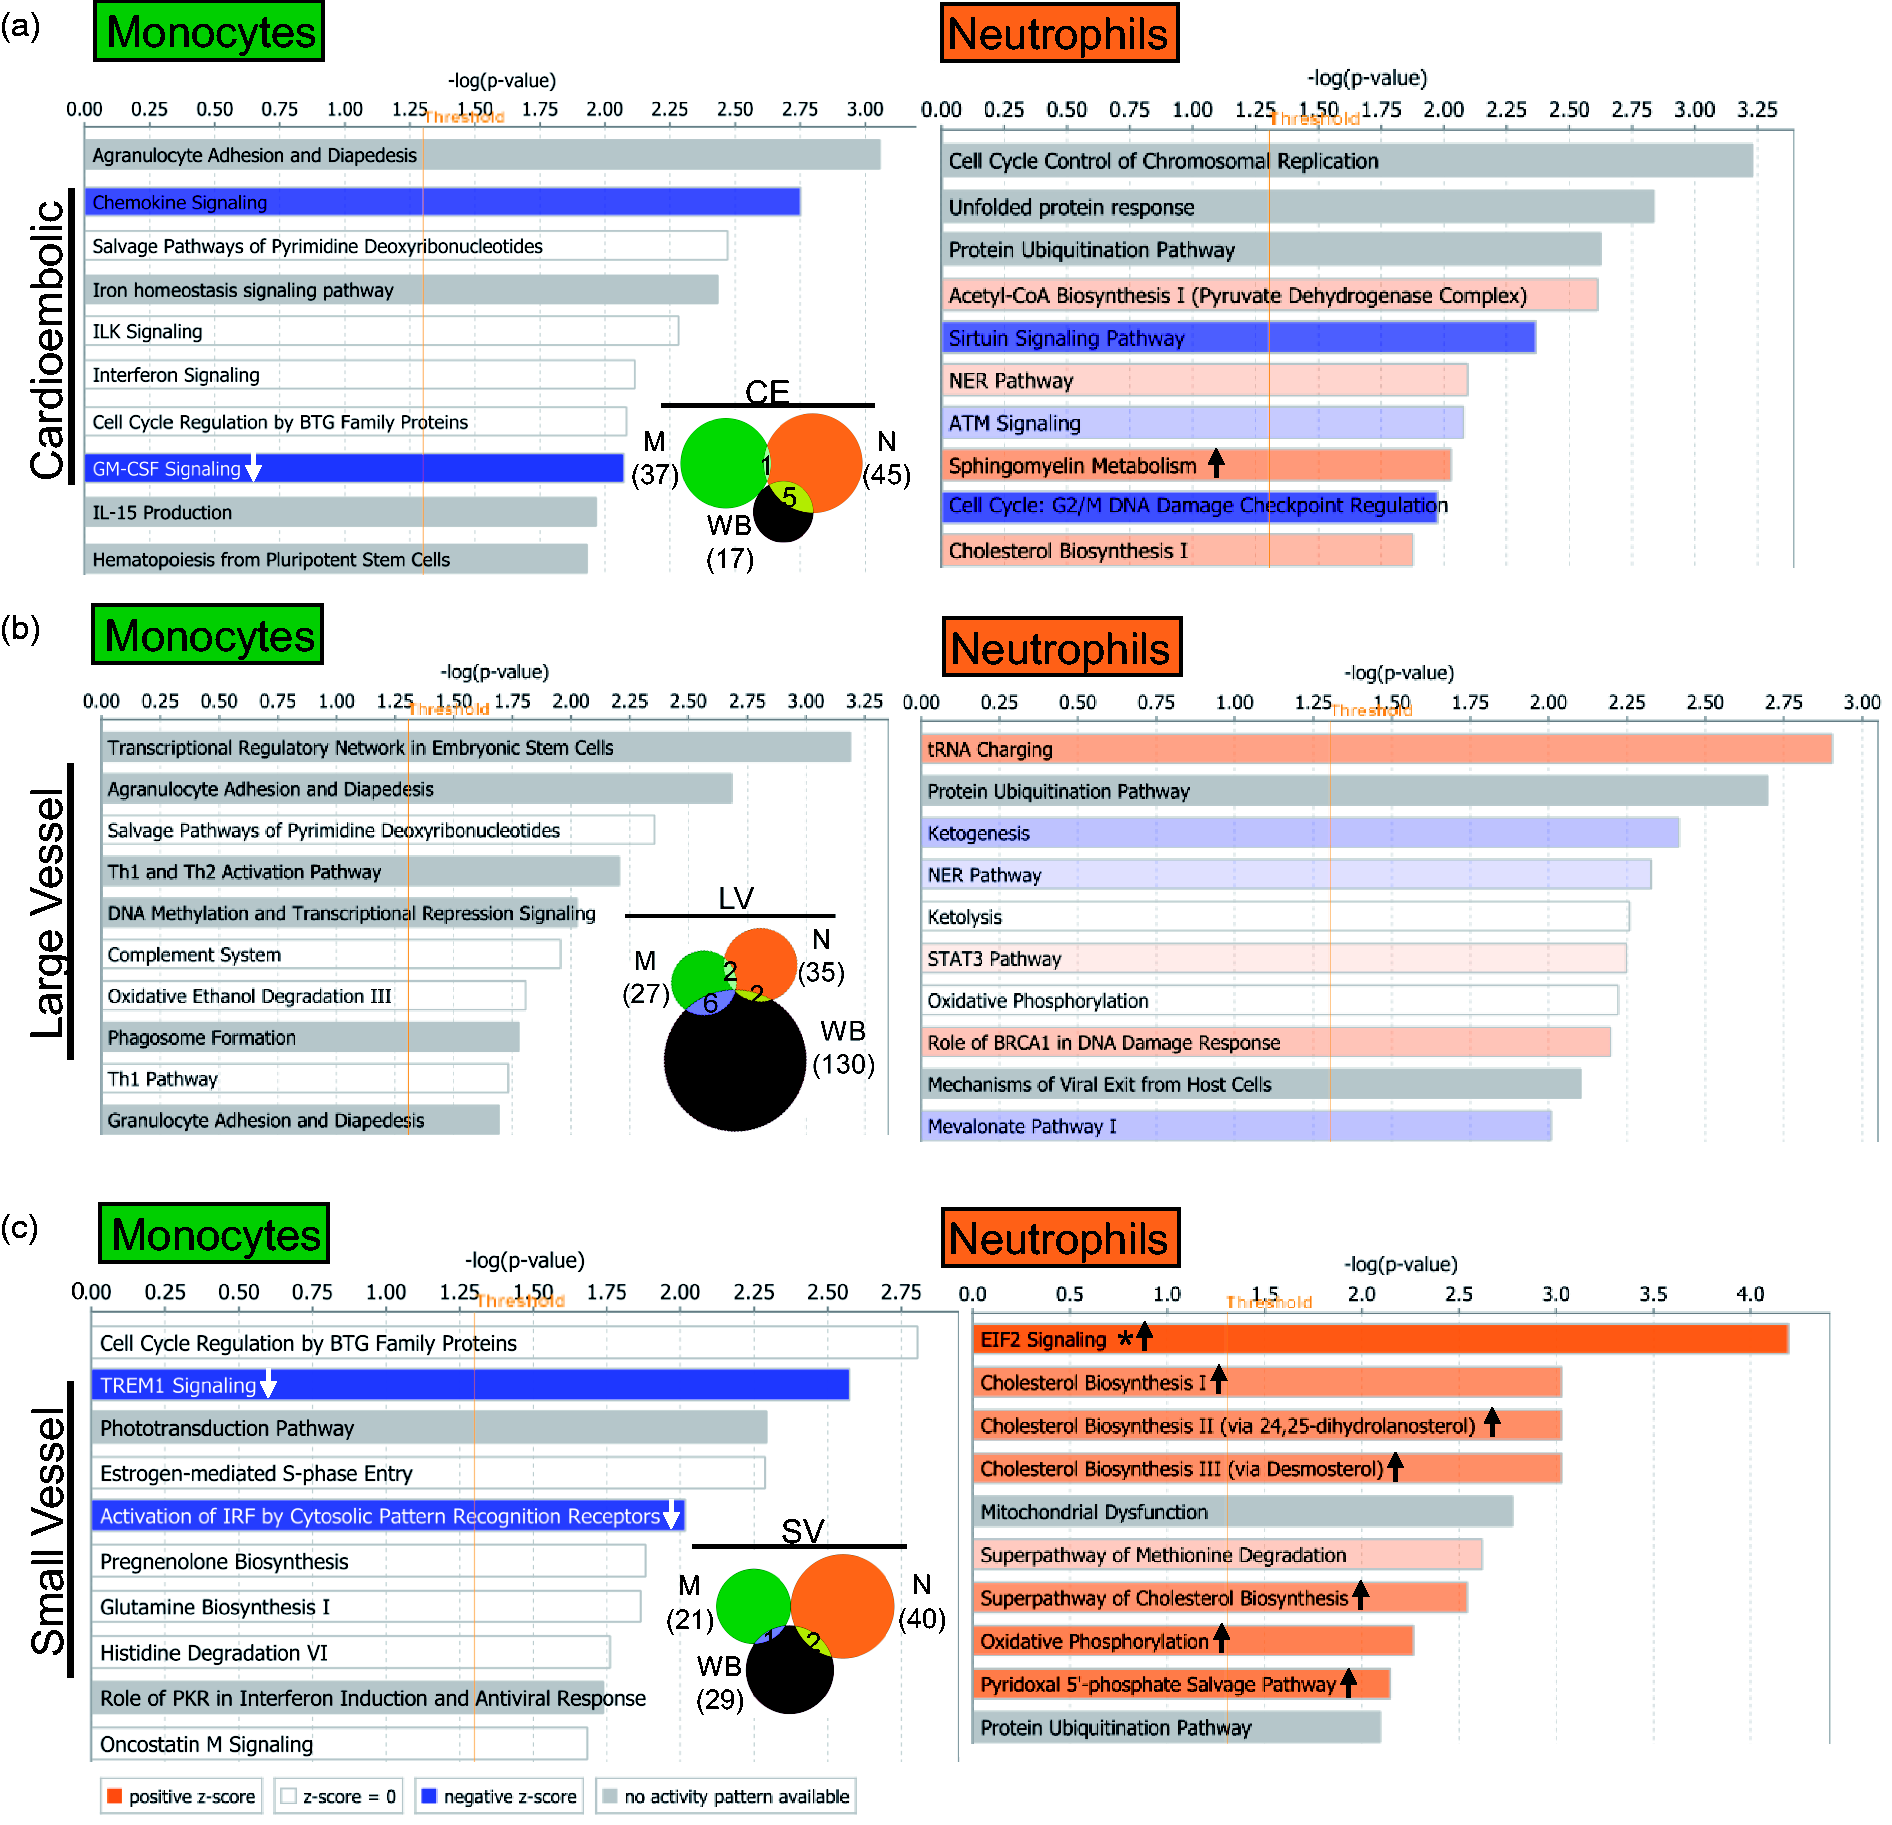
Top 10 IS cause-specific significantly over-represented (p < 0.05) pathways in monocytes and neutrophils in the different IS etiologies: (a) cardioembolic stroke; (b) large vessel stroke; and (c) small vessel stroke. The asterisk depicts pathways with Benjamini–Hochberg corrected p-value < 0.05. In the plots, arrows in the orange or blue bars indicate predicted significant activation (Z ≥ 2, up arrow) or significant inhibition (Z ≤ −2, down arrow) of the pathway. White bars – no direction can be predicted, and grey depicts no prediction can be performed. The vertical orange line marks the −log(p-value) > 1.3 threshold. The Venn diagrams represent all the pathways with a Fisher’s p-value < 0.05 in every IS cause.
Transcriptome differences between different IS causes per cell type
Transcriptional responses for the three IS etiologies for each cell type were compared since we have previously shown that different IS causes produce a specific transcriptome response in whole blood. 22 , 23 In monocytes, there were 23, 24, and 23 DEGs between IS-CE, IS-LV, and IS-SV, respectively, versus VRFC (Figure 6(a)). In neutrophils there were 179, 170, and 188 DEGs between IS-CE, IS-LV, and IS-SV, respectively, versus VRFC (Figure 6(c), Supplementary Table S5). In monocytes, there was significant overlap between CE and LV stroke (p < 10e-16), CE and SV (p = 5.4e–9), and SV and LV stroke (p = 2.3e–4). Neutrophils responded with a much larger number of genes (Figure 6(c)). In neutrophils, the overlaps between the causes were also significant (p < 10e-16 for CE vs. SV, CE vs. LV, and SV vs. LV). Based on the unique genes for each IS cause, PCAs showed clear group separation in monocytes and neutrophils (Figure 6(a) and (c)).
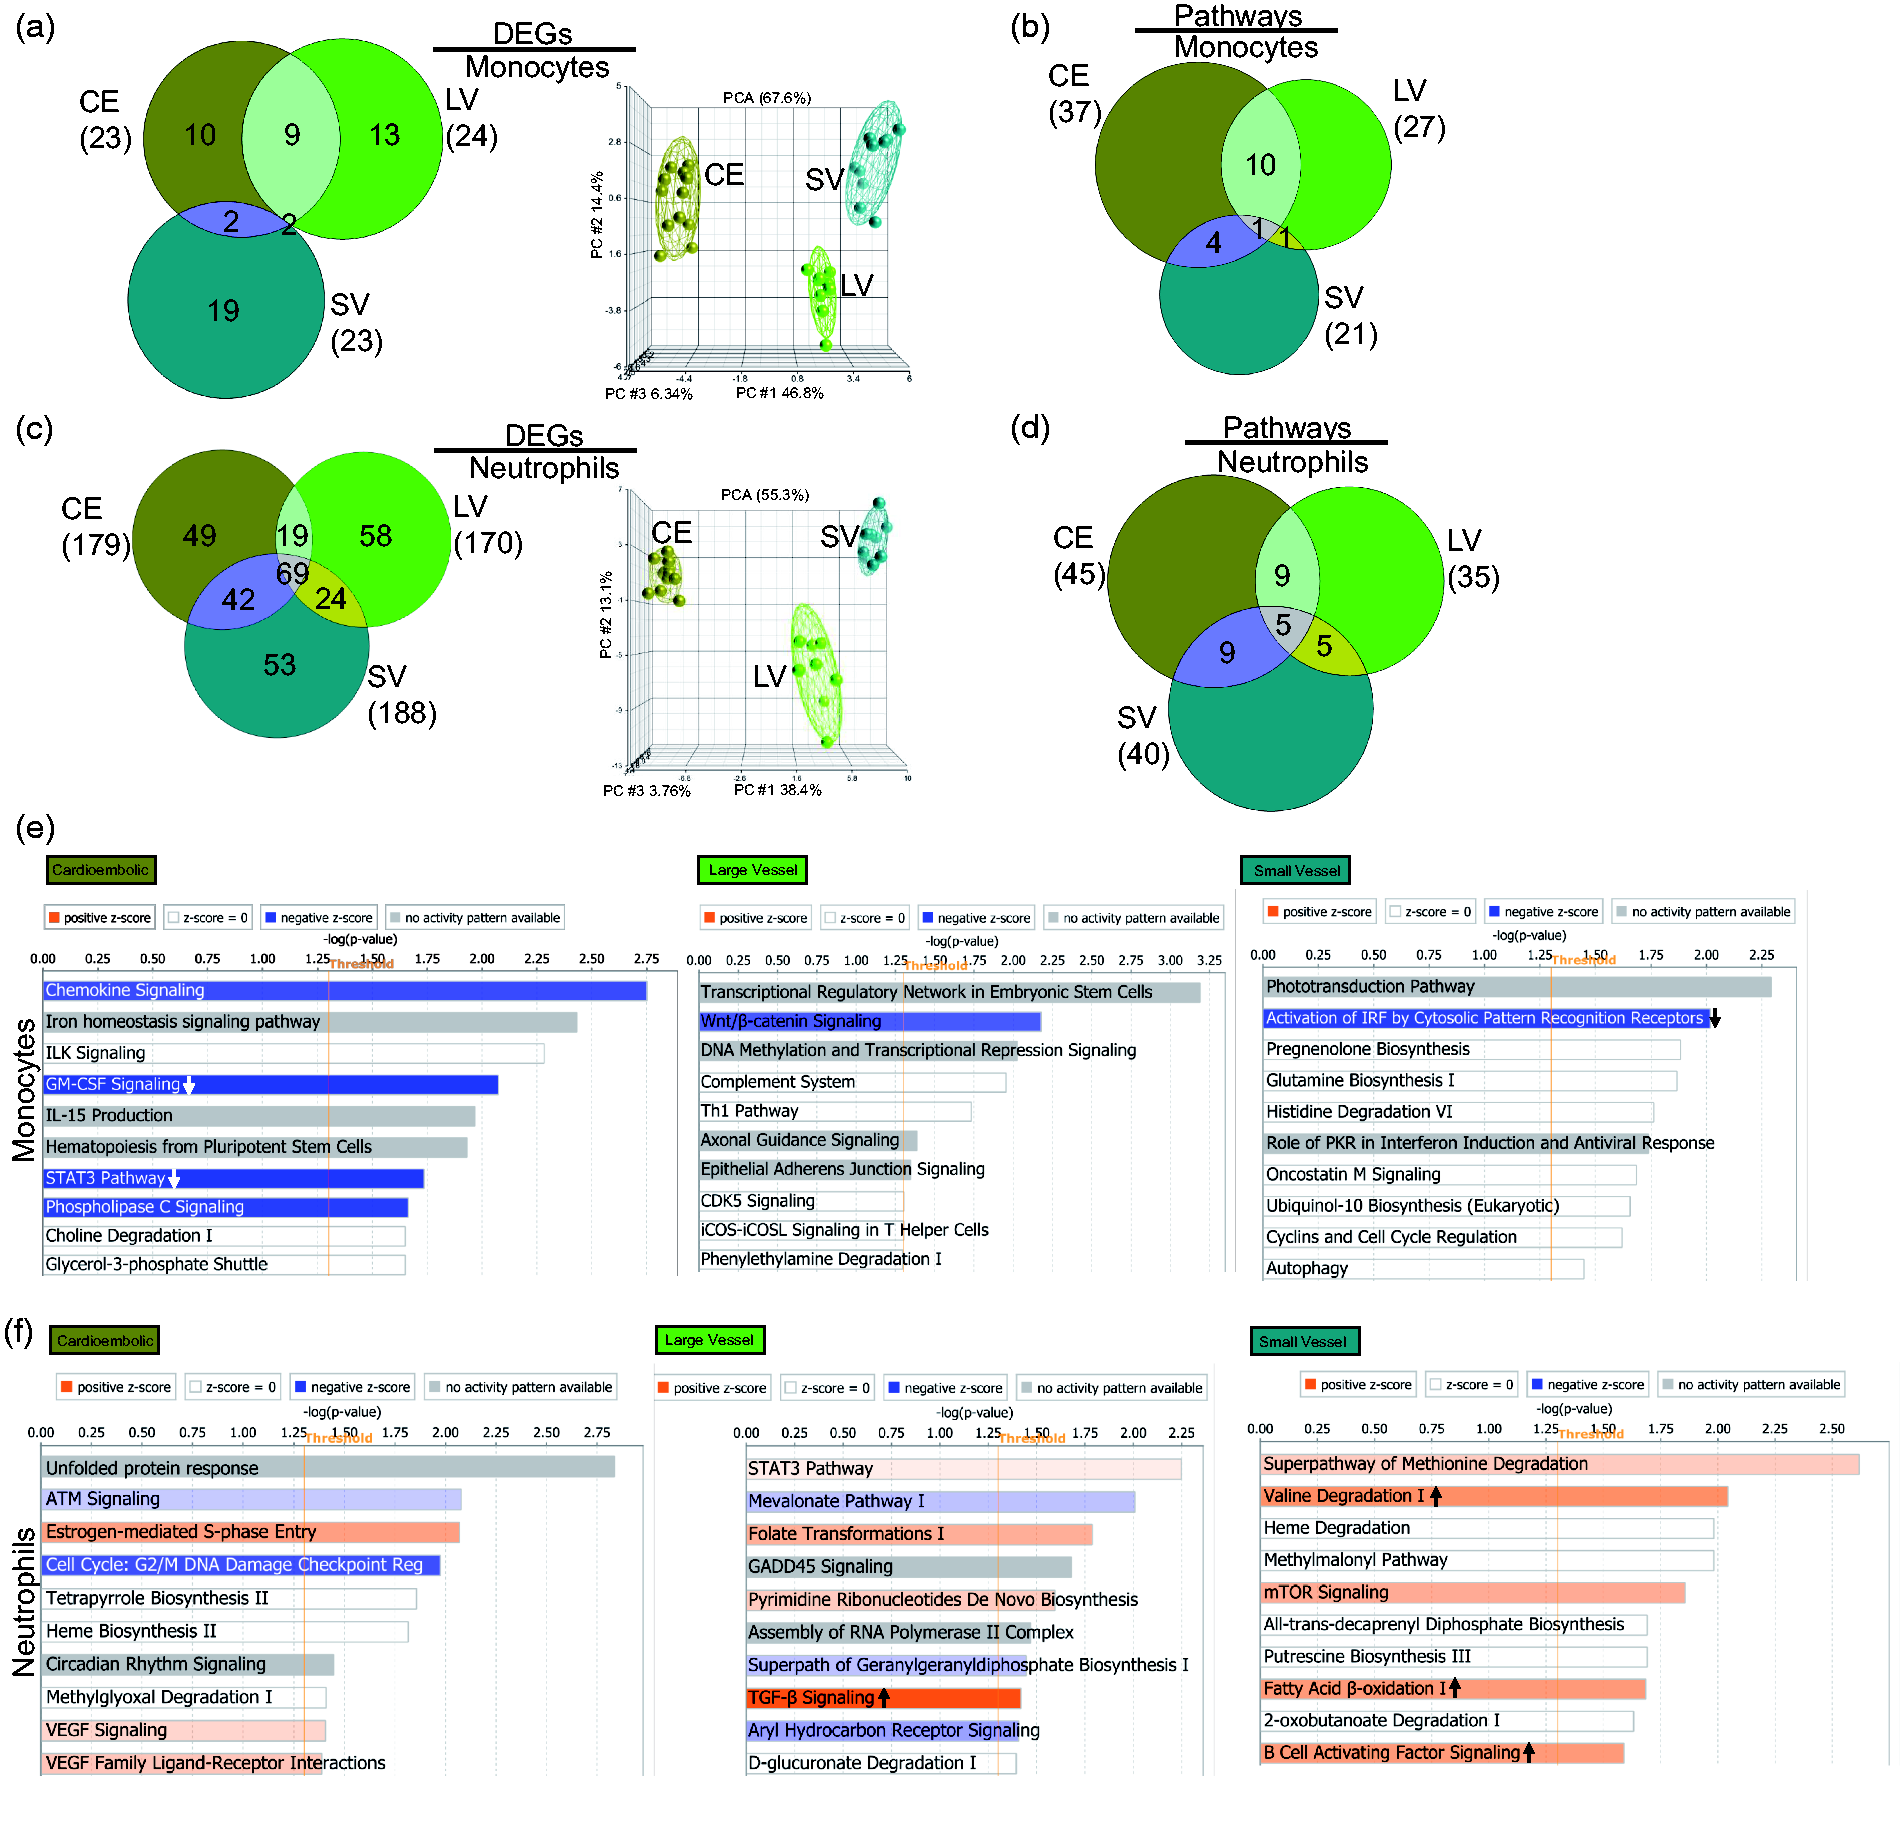
Comparison of the transcriptional changes in different IS etiologies versus VRFC in monocytes and neutrophils. Venn diagrams for the genes that meet the defined criteria (FC > |1.2|, p < 0.05 for the individual contrasts and having Sample_Type * Diagnosis FDR (step up) < 0.2). From the unique genes included in the Venn diagrams (not overlapped regions), the corresponding PCA is shown for (a) monocytes and (c) neutrophils. The effects of additional factors were removed before plotting. Ellipsoids represent 2 standard deviations from the centroid. Venn diagrams of the numbers of over-represented (Fisher’s p-value < 0.05) canonical pathways in (b) monocytes and (d) neutrophils. Top 10 over-represented canonical pathways exclusively found in CE, LV, and SV stroke in (e) monocytes and (f) neutrophils. In the plot, orange bars indicate predicted activation of the pathway, blue ones show predicted inhibition, white bars – no direction can be predicted, and grey depicts no prediction can be performed. The shades for every colored cell represent z-scores values. Arrows indicate predicted significant activation (Z ≥ 2, up arrow) or significant inhibition (Z ≤ −2, down arrow) of the pathway. The vertical orange line marks the −log(p-value)>1.3 threshold. In neutrophils, superpathway of geranylgeranyl diphosphate biosynthesis i (via mevalonate) and regulation (reg) are abbreviated.
Pathway analyses were performed for each stroke cause and cell type including monocytes (Figure 6(b) and (e)) and neutrophils (Figure 6(d) and (f)). Most enriched pathways (Fisher’s p-value < 0.05) were IS cause-specific. For monocytes, most pathways were unique for every IS cause, with the greatest overlap between CE and LV strokes (Figure 6(b)). Among the top 10 cause-specific pathways in monocytes, CE stroke showed significant suppression of STAT3 and GM-CSF signaling, LV stroke had a trend towards suppression of Wnt/β-catenin signaling, and SV showed suppression of cytosolic recognition receptors for IRF (Figure 6(e)). In neutrophils, for the top enriched pathways, many were predicted to be activated, including TGF-β – unique to LV, and fatty acid β-oxidation, B cell activating factor signaling, and valin degradation, which were unique for SV (Figure 6(f)). Notably, though neutrophils and monocytes had common pathways across the IS causes per cell type, they were represented by unique molecules that were exclusive for every IS etiology (Table S7).
Upstream regulator analyses in monocytes and neutrophils showed that most predicted transcriptional regulators were IS-cause specific, with neutrophils displaying more differences (Supplementary Figure 7). Several interferon regulators were exclusively represented in SV in neutrophils, along with T cell receptors which were predicted to be activated (Supplementary Table S8).
Discussion
Ischemic stroke (IS) and intracerebral hemorrhage (ICH) induce a complex multiphasic immune response that contributes to damage and repair. 1 , 3 , 18 Though previous studies show leukocyte subtypes have cell-specific transcriptional profiles, 35 this is the first to show cell-specific, whole-genome transcriptional profiles that change in neutrophils and monocytes and are specific for ICH and different IS causes. Building on previous whole blood studies that have shown the whole genome response to IS and ICH, 20 , 21 , 24 , 36 these studies show that gene expression is generally activated in neutrophils and suppressed in monocytes in the first few days following ICH and all causes of IS. Thus, the discussion will focus on these individual cellular responses that have never been investigated before in human IS or ICH.
Monocyte gene response to ischemic stroke is down-regulated
Communication between injured ischemic brain and peripheral blood leukocytes drives changes of the peripheral immune system that affect stroke pathophysiology and outcome. 7 Monocytes change phenotypes in response to their microenvironment, differentiating into different subtypes and to macrophages. 37 However, relatively few genes were dysregulated exclusively in IS monocytes, and all were down-regulated. Most were associated with the innate immune response and regulation of steroid biosynthesis. 30 , 31 We interrogated the DEGs for markers of monocytes subsets or polarization,38–41 but there was no evidence of predominance. Moreover, the gene markers showed high variability of expression, suggesting mixed monocyte populations, possibly due to the broad time window of the samples.
Amongst the most significantly over-represented suppressed pathways in IS monocytes were interferon signaling, dendritic cell maturation, and phagosome formation. The interferon pathway and its components, from cytokines, to receptors and associated transcription factors are involved in the immune response post-stroke (such as IFNγ, STAT1, and IRF-9),42–45 and were dysregulated in our previous studies. 21 In this study, in the subacute phase (28.2 ± 15.7 h), the interferon pathway was suppressed in monocytes, possibly by down-regulation of pro-inflammatory pathways, such as TREM1 signaling and/or by reducing the pro-inflammatory monocyte subtypes. 7 In addition, IFNγ, predicted to be a suppressed upstream regulator, has been associated with stroke-induced neurodegeneration since it is pro-inflammatory. 46 The down-regulation of these upstream regulators and pro-inflammatory pathways may suggest peripheral monocytes switch to more anti-inflammatory functions. Dendritic cells, whose maturation was predicted to be suppressed, are antigen-presenting cells that migrate to the injury site and regulate inflammation. 42 ,47–49 Monocytes can differentiate into dendritic cells50–52 and the monocyte profile we observed may reflect suppression of this transition. Phagocytosis signaling, which was over-represented in IS monocytes but not IS neutrophils, is essential in the stroke resolution phase, and monocytes and monocyte-derived macrophages participate in this stage. 53
There was a similar number of monocyte DEGs across IS causes that were mostly cause-specific; 17/23 DEGs in SV stroke were up-regulated. CA4 (carbonic anhydrase 4), which is associated with the BBB 54 was down-regulated in all IS causes. The only up-regulated monocyte genes in CE and LV stroke were SRCIN1 and DEFA3 (defensin alpha 3), respectively. SRCIN1 (SRC kinase signaling inhibitor 1) is a Src inhibitor. 55 Inhibition of Src-kinases has been associated with improved outcomes in experimental IS and ICH models. 56 , 57 DEFA3, an antimicrobial peptide found to be up-regulated in hypercholesterolemia, 58 has a role in thrombosis 59 and belongs to the family of defensins. Another gene from the defensins family, DEFA1B, was down-regulated in cardioembolic stroke.
Other monocyte DEGs in SV stroke are GLP2R, which is involved in glucose homeostasis and has been linked to risk of type 2 diabetes 60 , 61 ; and LRP4 which responds to ischemia in astrocytes, and in peripheral axons promotes nerve regeneration. 62 , 63 Interestingly, under normal conditions, there is no expression of this gene in monocytes. 64 The same was true for FGD5, a neovascularization inhibitor 65 ; HHIP, which is associated with prediabetes, 66 and PERM1, a gene involved in mitochondrial biogenesis whose expression pattern is altered with exercise. 67
CE, LV, and SV strokes had similar numbers of unique monocyte pathways per cause. Only the estrogen-mediated-S-phase entry pathway was shared between IS etiologies though most of the differentially expressed molecules from this pathway differed amongst IS causes. CCND1 (cyclin D1), the only pathway molecule down-regulated in all three IS causes, regulates the cell cycle which has an important role in stroke. 68 In a rat stroke model, bone marrow stromal cells (BMSCs) modulated cell cycle progression via down-regulation of the CCD1/cdk4/pRb pathway which appeared to contribute to stroke recovery. 69 For SV, the estrogen-mediated-S-phase entry pathway molecules E2F7 (E2F Transcription Factor 7) and CCNE2 (cyclin E2) were up-regulated, while E2F5 (E2F Transcription Factor 5) and CDK1 (Cyclin Dependent Kinase 1) were down-regulated in CE and LV stroke, respectively. E2F7 and E2F5 are E2F transcription factor family members which also regulate cell cycle progression. 70 E2F7 promotes angiogenesis by associating with HIF1A to activate VEGFA. 71 Absence of another family member, E2F1, attenuates brain injury and improves behavior following focal ischemia. 72 CCEN2 and CDK1 are involved in cell cycle regulation. Cell cycle machinery promotes angiogenesis, gliosis, and neuronal apoptosis and has been a therapeutic target for stroke. 68 , 73 Other unique monocyte pathways for IS causes included chemokine signaling, T helper regulation, TREM1 signaling, and GM-CSF. The last two were inhibited, suggesting a self-regulatory loop for monocytes to progress into the resolving phase of the injury. 74 , 75
Peripheral neutrophil response following IS
Neutrophils are key for the innate immune response and post-stroke neuroinflammation. Ischemia induces release of pro-inflammatory cytokines, matrix metalloproteinases (MMPs), and other molecules that lead to neutrophil recruitment to the damaged area and the breakdown of the BBB. 37 It has recently been suggested that neutrophils also have beneficial roles in later stages, 19 in particular the N2 phenotype. 13 , 14 No enrichment of gene markers of a particular neutrophil subset was observed in the DEGs.
The majority of the DEGs in neutrophils (197/248, 79%) were up-regulated in IS versus VRFC. Of these, only three were shared with IS monocytes. IS neutrophils had a large number of activated pathways (n = 33), many previously implicated in stroke, including integrin, 76 ERK5, 77 thrombopoietin, 78 calpain, and mTOR 79 signaling. ERK5 signaling, a MAP kinase family member, mediates inflammation and when activated, it induces PPARδ which is neuroprotective. 77 , 80 , 81 mTOR, activated after cerebral ischemia via Akt (protein kinase B), mediates gene transcription, autophagy, and apoptosis. 79 , 82 Integrins interact with extracellular matrix components to alter BBB permeability after stroke. 76 Calpain proteases dysregulate synapses, 83 and cause BBB breakdown and hyperpermeability following cerebral ischemia. 84
Neutrophil activation included BMP signaling, a TGFβ super-family member, which mediates glial scar formation after stroke. 85 Additional neutrophil activated pathways included: GM-CSF signaling which activates cell survival and differentiation 75 , 86 ; neutrophin/TRK signaling which activates hematopoietic cell survival, neurite outgrowth, and neurite differentiation 87 ; and PDGF signaling which activates chemotaxis and membrane ruffling which precedes cell migration and is crucial for leukocyte function. 88 , 89 Activation of TGFβ signaling, including TGFB3, and predicted suppression on IFN suggests some IS neutrophils may switch from N1 to N2 type neutrophils involved in the resolution of inflammation. 13 , 37
Though approximately 38% of neutrophil DEGs were shared between IS causes, there were unique signatures for every IS etiology. For example, HSPA2 (Heat Shock Protein Family A (Hsp70) Member 2) was up-regulated in lacunar stroke neutrophils. 90 EIF3J-AS1 (hypoxia induced lncRNA) 91 and PMM2 (phosphomannomutase 2) were differentially expressed in neutrophils of LV IS subjects. PMM2 is responsible for congenital disorder of glycosylation type IA with stroke-like and hemorrhagic events. 92
Among the neutrophil pathways in CE stroke were VEGF signaling and cell cycle regulation/DNA damage pathways. VEGF is associated with atherosclerosis, edema, neuroprotection, and angiogenesis. 93 High VEGF plasma levels correlate with CE stroke severity. 94 Estrogen-mediated-S-phase entry pathway was associated with all IS etiologies in monocytes, but only associated with CE in neutrophils. TGF-β signaling was activated in neutrophils in LV IS, and has a neuroprotective role in stroke. 95 B cell activating factor signaling was associated with SV IS, which is essential for B lymphocyte homeostasis. B cells help mediate adaptive immune responses to stroke and repair, 96 and appear to be activated by neutrophils which also produce the B cell activating factor. 97
There were five common neutrophil pathways among the three IS etiologies including mitochondrial dysfunction, oxidative phosphorylation, protein ubiquitination, UVC-induced MAPK signaling, and tRNA charging. However, nearly 33% of the molecules in these pathways were unique for CE, LV, or SV strokes, further underscoring the unique neutrophil response to each IS cause.
Monocyte response following ICH
Monocytes infiltrate ICH and can damage as well repair brain. 98 Our whole blood human studies have shown many differentially expressed monocyte-specific transcripts in ICH versus VRFC, 21 as well as monocyte ICH co-expression modules. 99
Most monocyte genes were suppressed after ICH. Only 3/51 monocyte DEG were up-regulated: MEOX1, not usually detected in monocytes 64 ; RN7SL546P (RNA, 7SL, cytoplasmic 546, pseudogene), and RP11-104G3.2, a pseudogene. Forty-one DEGs were unique to the ICH monocyte response, playing roles in the inflammatory/innate immune response, cytokine production, and cell migration. 30 , 31
Most ICH monocyte pathways were predicted to be significantly suppressed (Z ≤ −2), including interferon, dendritic cell maturation, TREM1, inflammasome, role of pattern recognition receptors, and neuroinflammation signaling pathway. PPAR signaling was predicted to be significantly activated, and PPARγ in macrophages has been shown to promote hematoma resolution and improve experimental ICH.100–102
Peripheral neutrophil response following ICH
Neutrophils infiltrate perihematomal tissue after ICH. 102 Our previous studies in whole blood of ICH patients pointed to many neutrophil-specific DEG and co-expression modules. 21 , 99 The neutrophil response after ICH in this study was much more robust than for ICH monocytes. The neutrophil unique DEGs regulate gene expression, enzymatic activity, and noncoding RNA. Many ICH DEGs are transcriptional regulators (41/295), such as TGFBIF1, IRF1, and several kinases (12/295), including up-regulated Fgr, which is a Src family tyrosine kinase which modulates ICH outcomes. 56
Neutrophils showed many activated pathways. These included: Relaxin signaling, involved in vasodilation and angiogenesis 103 with predicted activation of VEGF-A, MMP9, and angiogenesis; GNRH signaling, which has a role in neurodegeneration 104 ; NGF signaling which may be neuroprotective after ICH 105 ; and Notch signaling which modulates neuronal injury, apoptosis, angiogenesis, and BBB function following experimental ICH. 106 , 107 As in monocytes, the interferon pathway was significantly suppressed in ICH neutrophils along with IL-1 and α-adrenergic signaling pathways in our previous study. 21 IL-1 is a proinflammatory neutrophil mediator in ICH and represents a promising ICH treatment target108–110 (clinical trial NCT03737344). ICH causes activation of the α-adrenergic system which also has been an ICH treatment target. 111 , 112
Atypical gene expression in ICH, IS, and VRFC monocytes and neutrophils
There were many genes differentially expressed in monocytes and neutrophils following IS and ICH in this study which are typically expressed by other cell types. For example, immunoglobulin gene expression, typically expressed by B cells, was present in neutrophil and monocyte DEGs for both IS and ICH. Notably, they were all down-regulated in ICH and IS monocytes, up- and down-regulated in ICH neutrophils, and only up-regulated in IS neutrophils. However, this is not surprising since non-lymphoid cells can produce immunoglobulins, 113 , 114 including immunoglobulins from macrophages. 115 This atypical expression pattern shows fine-tuning of genes by IS and ICH, as has been described for systemic inflammation and cardiovascular disease. 116
To underscore the utility of the transcriptome findings in this study, we estimated the Pearson’s correlation coefficient between the expression of the DEGs and the NIHSS (NIH Stroke Scale), a measure of severity, at the time of the blood draw. We found FFAR2 (r=−0.98, FDR-corrected p = 0.011) and WASF3 (r = 0.96, FDR-corrected p = 0.038) correlated with NIHSS in ICH monocytes. FFAR2, a short chain free fatty acids receptor, is associated to chronic inflammatory diseases and modulates the monocyte inflammatory response.117–120 WASF3 has a role in cell migration in cancer, acts as a cytoskeleton regulator, and is a target for miR-200b during monocyte-derived dendritic cell differentiation.121–124 DHX58, a regulator of innate immune genes, 125 negatively correlated with the NIHSS (r=−0.96, FDR-p = 0.047) in ICH neutrophils. In IS neutrophils, up-regulation of TTC31, which has been associated to atrial fibrillation 126 and down-regulation of IATPR (ITGB1 adjacent tumor promoting lncRNA) correlated with NIHSS (r=−0.65, FDR-p = 0.025, and r=−0.63, FDR-p = 0.025, respectively). Thus, these DEGs may be potential therapeutic targets since they correlated with the NIHSS.
There was relatively little overlap of monocyte DEGs with whole blood DEGs. This could be accounted for in part by counteracting expression from other cell types in whole blood (i.e. some genes may increase in some cell types but decrease in other cell types with little net change in whole blood). In addition, monocytes were isolated by positive selection in IS, ICH, and control samples, which might have blunted the expression differences observed in isolated monocytes compared to whole blood where cells are immediately lysed and mRNA stabilized just after the blood draw. In addition, blood samples were taken over the first 3.5–4 days following symptom onset which likely dampened expression patterns that can occur within half a day. 21 Time-dependent ICH and IS responses in the peripheral whole blood transcriptome have been reported in our previous studies. 21 , 127 Thus, future time-dependent trajectory analysis of the monocyte and neutrophil ICH and IS responses would help delineate the dynamic time-dependent peripheral response over hours to days.
Though many studies have shown extremely high correlation between RNA-Seq results and qRT-PCR128–133 and our analysis pipeline and very high sequencing coverage of our samples allow for confident transcript quantitation,134–138 future studies will need to validate findings in separate/larger cohorts, and with alternative RNA quantification methods like PCR. In addition, there was a significant difference in some vascular risk factors (VRF) between ICH and IS and controls. Therefore, some differences of gene expression could be due to these VRF. However, examination of the DEGs using unsupervised hierarchical clustering showed grouping by diagnosis only, and not by diabetes, hyperlipidemia, or other VRFs (not shown).
Overall, the identified monocyte and neutrophil dysregulated genes and pathways in ICH and IS and its different etiologies will help us understand the immune responses to each, to better distinguish among IS etiologies, and eventually may guide biomarker and treatment development. These data will also allow for comparison of the immune responses in experimental IS and ICH models to the human immune responses to each and to potentially improve the models.
Supplemental Material
sj-pdf-1-jcb-10.1177_0271678X20953912 - Supplemental material for Distinct peripheral blood monocyte and neutrophil transcriptional programs following intracerebral hemorrhage and different etiologies of ischemic stroke
Supplemental material, sj-pdf-1-jcb-10.1177_0271678X20953912 for Distinct peripheral blood monocyte and neutrophil transcriptional programs following intracerebral hemorrhage and different etiologies of ischemic stroke by Paulina Carmona-Mora, Bradley P Ander, Glen C Jickling, Cheryl Dykstra-Aiello, Xinhua Zhan, Eva Ferino, Farah Hamade, Hajar Amini, Heather Hull, Frank R Sharp and Boryana Stamova in Journal of Cerebral Blood Flow & Metabolism
Supplemental Material
sj-pdf-2-jcb-10.1177_0271678X20953912 - Supplemental material for Distinct peripheral blood monocyte and neutrophil transcriptional programs following intracerebral hemorrhage and different etiologies of ischemic stroke
Supplemental material, sj-pdf-2-jcb-10.1177_0271678X20953912 for Distinct peripheral blood monocyte and neutrophil transcriptional programs following intracerebral hemorrhage and different etiologies of ischemic stroke by Paulina Carmona-Mora, Bradley P Ander, Glen C Jickling, Cheryl Dykstra-Aiello, Xinhua Zhan, Eva Ferino, Farah Hamade, Hajar Amini, Heather Hull, Frank R Sharp and Boryana Stamova in Journal of Cerebral Blood Flow & Metabolism
Supplemental Material
sj-pdf-3-jcb-10.1177_0271678X20953912 - Supplemental material for Distinct peripheral blood monocyte and neutrophil transcriptional programs following intracerebral hemorrhage and different etiologies of ischemic stroke
Supplemental material, sj-pdf-3-jcb-10.1177_0271678X20953912 for Distinct peripheral blood monocyte and neutrophil transcriptional programs following intracerebral hemorrhage and different etiologies of ischemic stroke by Paulina Carmona-Mora, Bradley P Ander, Glen C Jickling, Cheryl Dykstra-Aiello, Xinhua Zhan, Eva Ferino, Farah Hamade, Hajar Amini, Heather Hull, Frank R Sharp and Boryana Stamova in Journal of Cerebral Blood Flow & Metabolism
Supplemental Material
sj-pdf-4-jcb-10.1177_0271678X20953912 - Supplemental material for Distinct peripheral blood monocyte and neutrophil transcriptional programs following intracerebral hemorrhage and different etiologies of ischemic stroke
Supplemental material, sj-pdf-4-jcb-10.1177_0271678X20953912 for Distinct peripheral blood monocyte and neutrophil transcriptional programs following intracerebral hemorrhage and different etiologies of ischemic stroke by Paulina Carmona-Mora, Bradley P Ander, Glen C Jickling, Cheryl Dykstra-Aiello, Xinhua Zhan, Eva Ferino, Farah Hamade, Hajar Amini, Heather Hull, Frank R Sharp and Boryana Stamova in Journal of Cerebral Blood Flow & Metabolism
Supplemental Material
sj-pdf-5-jcb-10.1177_0271678X20953912 - Supplemental material for Distinct peripheral blood monocyte and neutrophil transcriptional programs following intracerebral hemorrhage and different etiologies of ischemic stroke
Supplemental material, sj-pdf-5-jcb-10.1177_0271678X20953912 for Distinct peripheral blood monocyte and neutrophil transcriptional programs following intracerebral hemorrhage and different etiologies of ischemic stroke by Paulina Carmona-Mora, Bradley P Ander, Glen C Jickling, Cheryl Dykstra-Aiello, Xinhua Zhan, Eva Ferino, Farah Hamade, Hajar Amini, Heather Hull, Frank R Sharp and Boryana Stamova in Journal of Cerebral Blood Flow & Metabolism
Supplemental Material
sj-pdf-6-jcb-10.1177_0271678X20953912 - Supplemental material for Distinct peripheral blood monocyte and neutrophil transcriptional programs following intracerebral hemorrhage and different etiologies of ischemic stroke
Supplemental material, sj-pdf-6-jcb-10.1177_0271678X20953912 for Distinct peripheral blood monocyte and neutrophil transcriptional programs following intracerebral hemorrhage and different etiologies of ischemic stroke by Paulina Carmona-Mora, Bradley P Ander, Glen C Jickling, Cheryl Dykstra-Aiello, Xinhua Zhan, Eva Ferino, Farah Hamade, Hajar Amini, Heather Hull, Frank R Sharp and Boryana Stamova in Journal of Cerebral Blood Flow & Metabolism
Supplemental Material
sj-pdf-7-jcb-10.1177_0271678X20953912 - Supplemental material for Distinct peripheral blood monocyte and neutrophil transcriptional programs following intracerebral hemorrhage and different etiologies of ischemic stroke
Supplemental material, sj-pdf-7-jcb-10.1177_0271678X20953912 for Distinct peripheral blood monocyte and neutrophil transcriptional programs following intracerebral hemorrhage and different etiologies of ischemic stroke by Paulina Carmona-Mora, Bradley P Ander, Glen C Jickling, Cheryl Dykstra-Aiello, Xinhua Zhan, Eva Ferino, Farah Hamade, Hajar Amini, Heather Hull, Frank R Sharp and Boryana Stamova in Journal of Cerebral Blood Flow & Metabolism
Supplemental Material
sj-pdf-8-jcb-10.1177_0271678X20953912 - Supplemental material for Distinct peripheral blood monocyte and neutrophil transcriptional programs following intracerebral hemorrhage and different etiologies of ischemic stroke
Supplemental material, sj-pdf-8-jcb-10.1177_0271678X20953912 for Distinct peripheral blood monocyte and neutrophil transcriptional programs following intracerebral hemorrhage and different etiologies of ischemic stroke by Paulina Carmona-Mora, Bradley P Ander, Glen C Jickling, Cheryl Dykstra-Aiello, Xinhua Zhan, Eva Ferino, Farah Hamade, Hajar Amini, Heather Hull, Frank R Sharp and Boryana Stamova in Journal of Cerebral Blood Flow & Metabolism
Supplemental Material
sj-xlsx-9-jcb-10.1177_0271678X20953912 - Supplemental material for Distinct peripheral blood monocyte and neutrophil transcriptional programs following intracerebral hemorrhage and different etiologies of ischemic stroke
Supplemental material, sj-xlsx-9-jcb-10.1177_0271678X20953912 for Distinct peripheral blood monocyte and neutrophil transcriptional programs following intracerebral hemorrhage and different etiologies of ischemic stroke by Paulina Carmona-Mora, Bradley P Ander, Glen C Jickling, Cheryl Dykstra-Aiello, Xinhua Zhan, Eva Ferino, Farah Hamade, Hajar Amini, Heather Hull, Frank R Sharp and Boryana Stamova in Journal of Cerebral Blood Flow & Metabolism
Footnotes
Funding
The author(s) disclosed receipt of the following financial support for the research, authorship, and/or publication of this article: These studies were supported by NIH grants NS106950, NS101718, and NS097000 (FRS, BSS, BPA).
Acknowledgements
We thank the patients who participated in this study and appreciate the support of the UCD Department of Neurology and MIND Institute. Sequencing was performed by the UCD DNA Technologies and Expression Analysis Core (NIH 1S10OD010786-01). We thank Dr. Paul Ashwood, Dr. Milo Careaga, Dr. Destanie R. Rose and Mr. Houa Yang for help with flow cytometry.
Data availability
The data generated for this study will be available upon written request.
Declaration of conflicting interests
The author(s) declared no potential conflicts of interest with respect to the research, authorship, and/or publication of this article.
Authors’ contributions
Conceived and designed the experiments, and edited the manuscript: BS, FRS, BPA, PC-M. Performed the experiments and/or reviewed data: BPA, FH, HH, XZ, CD-A, EF, HA, PC-M. Cell purity characterization and analysis: BPA, CD-A. Clinical characterization: GJ, FRS. Analyzed the gene expression data and wrote the first draft: PC-M.
Supplemental material
Supplemental material for this article is available online.
References
Supplementary Material
Please find the following supplemental material available below.
For Open Access articles published under a Creative Commons License, all supplemental material carries the same license as the article it is associated with.
For non-Open Access articles published, all supplemental material carries a non-exclusive license, and permission requests for re-use of supplemental material or any part of supplemental material shall be sent directly to the copyright owner as specified in the copyright notice associated with the article.