
Abstract
Huntington’s disease (HD) is a neurodegenerative disease caused by a CAG triplet repeat expansion in the Huntingtin gene. Metabolic and microvascular abnormalities in the brain may contribute to early physiological changes that subserve the functional impairments in HD. This study is intended to investigate potential abnormality in dynamic changes in cerebral blood volume (CBV) and cerebral blood flow (CBF), and cerebral metabolic rate of oxygen (CMRO2) in the brain in response to functional stimulation in premanifest and early manifest HD patients. A recently developed 3-D-TRiple-acquisition-after-Inversion-Preparation magnetic resonance imaging (MRI) approach was used to measure dynamic responses in CBV, CBF, and CMRO2 during visual stimulation in one single MRI scan. Experiments were conducted in 23 HD patients and 16 healthy controls. Decreased occipital cortex CMRO2 responses were observed in premanifest and early manifest HD patients compared to controls (P < 0.001), correlating with the CAG-Age Product scores in these patients (R2 = 0.4, P = 0.001). The results suggest the potential value of this reduced CMRO2 response during visual stimulation as a biomarker for HD and may illuminate the role of metabolic alterations in the pathophysiology of HD.
Introduction
Huntington’s disease (HD) is a neurodegenerative disease caused by a CAG repeat expansion in the Huntingtin gene. 1 The progression of HD can be separated into premanifest and manifest periods. The approximate years-to-onset (YTO) of diagnosable motor signs can be predicted from the length of CAG repeats and the subject’s current age, 2 and a variable of the form (CAG repeat length –33.66) × current age, termed the CAG-Age Product or “CAP score,” has proved to be a useful means to track the extent of exposure of the individual to the effects of the genetic mutation over time. 3
Progressive atrophy of striatum is an imaging hallmark for HD. 3 –8 Furthermore, ample evidence indicates the existence of brain abnormalities in HD not reflected in brain structural changes. Impaired cerebral glucose metabolism was found in early HD using positron emission tomography (PET).9–14 A recent PET study showed that metabolic changes in the brain occurred earlier and progressed faster than structural brain changes in premanifest HD subjects. 15 Metabolic changes in the HD brain were also shown using magnetic resonance spectroscopy (MRS).16–23 Oxidative stress and metabolic disturbances in the brain are hypothesized to contribute to HD pathogenesis.24–29 Moreover, as the supply of oxygen and other energy substrates in brain tissue is controlled by blood vessels, microvascular abnormalities often accompany metabolic disturbance in the brain. In HD, perturbations in cerebral perfusion (cerebral blood flow or CBF, and cerebral blood volume or CBV)9,30–39 and in brain microvasculature39–42 have been found in human and animal studies. In a previous study from our group, 43 significantly increased CBV of small pial arteries and arterioles (CBVa) that correlated with the YTO was observed in the brain of premanifest HD patients at the baseline state when the subjects are at rest. In addition to baseline microvascular changes, dynamic changes in microvascular and metabolic parameters during functional stimulation may be relevant for understanding early physiological changes in HD. Blood-oxygenation-level-dependent (BOLD) functional magnetic resonance imaging (fMRI) has been widely used to assess brain function in humans by measuring dynamic MR signal changes during functional stimulation. However, the gross signal change in BOLD fMRI may reflect changes in several physiological parameters, including CBV, CBF, and cerebral metabolic rate of oxygen (CMRO2). A number of approaches have been developed to measure CBV and/or CBF responses along with the BOLD signal change, 44 making it possible to calculate CMRO2 dynamics using quantitative BOLD theories.44–47 Conventionally, BOLD, CBV, and CBF signal changes are measured using consecutive MRI scans. 44 In such approaches, the scan time is relatively long, and more importantly, there may be changes in physiological parameters between scans, causing inaccurate calculations of CMRO2.
We recently developed a 3D-TRiple-acquisition-after-Inversion-Preparation (3D-TRIP) MRI approach48–50 that can measure BOLD, CBF, and CBV signal changes in a single MRI scan with whole brain coverage, making the estimation of CMRO2 changes possible. In this study, we examined potential abnormalities in dynamic responses in microvascular and metabolic parameters during functional stimulation in premanifest and early manifest HD patients. The 3D-TRIP MRI method was employed to measure signal responses in BOLD, CBV, and CBF during a visual stimulation, from which the CMRO2 response was estimated. We studied responses in premanifest and early manifest HD patients and compared them to matched controls, with correlations to clinical measures.
Methods
A total of 39 participants including 23 premanifest and early manifest HD patients and 16 healthy controls matched in age and sex were recruited for this study through the Baltimore Huntington’s Disease Center at the Johns Hopkins School of Medicine (Table 1). The conduct of the study was governed by the ethical guidelines issued by the institutional committee on human experimentation (Johns Hopkins Institutional Review Board), as well as the Helsinki Declaration of 1975 (and as revised in 1983). 51 All participants gave written informed consent before participating in this Johns Hopkins Institutional Review Board-approved study (approval number: NA_00038524). No subject had history or signs on exam suggestive of other neurologic disease. The CAP score 52 and YTO of motor symptoms 2 were estimated for all HD patients. The CAP score is an estimate of cumulative exposure to the effects of the CAG repeat expansion in mutant Huntingtin. 52 All participants were examined using the Unified Huntington’s disease Rating Scale. 53 The necessary sample size to ensure a power of 0.8 and significance at α = 0.05 was estimated based on the effect size of baseline CBVa change in premanifest HD patients from our previous study. 43 There is no overlap between the cohort in this study and the one in the previous study.
Demographic data and clinical assessment scores of the study populations.
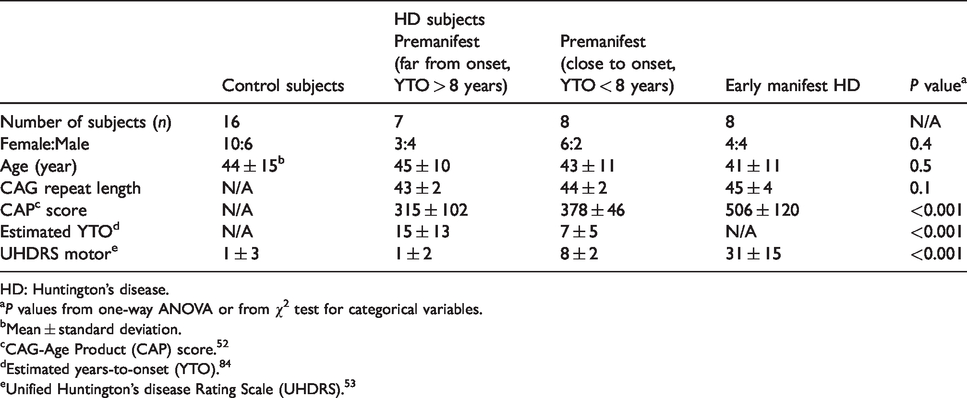
HD: Huntington’s disease.
aP values from one-way ANOVA or from χ2 test for categorical variables.
bMean ± standard deviation.
cCAG-Age Product (CAP) score. 52
dEstimated years-to-onset (YTO). 84
eUnified Huntington’s disease Rating Scale (UHDRS). 53
The 3D-TRIP MRI approach combines the vascular-space-occupancy (VASO),54,55 arterial-spin-labeling (ASL),56,57 and T2-prepared (T2prep) BOLD58 pulse sequences to measure CBV, CBF, and BOLD responses during functional stimulation in the brain in one single scan.48–50 It adopts a framework of interleaving slab-selective and nonselective inversion prepared scans, similar to some ASL sequences.56,57 After the inversion preparation, CBV-weighted VASO images are acquired at the first TI when the blood signal is nulled. CBF-weighted ASL images are obtained at the second TI which is typically much longer to allow the inverted (labeled) arterial spins to perfuse the capillary bed and exchange into the tissue. After that, a T2-preparation module and a third imaging readout are deployed to acquire BOLD images. Thus, CBV, CBF, and BOLD signal changes can be measured using the same scan. The sensitivity and quantitative results from 3-D-TRIP MRI are comparable to those from each corresponding technique separately.48–50
MRI scans were performed on a Philips 7 T human scanner (Philips Healthcare, Best, the Netherlands). Dielectric pads were used to improve field homogeneity. 59 High-resolution anatomical images were acquired with a 3D magnetization prepared 2 rapid acquisition gradient echoes (MP2RAGE) sequence 60 (0.75 mm isotropic). The inflow-based vascular-space-occupancy (iVASO) MRI scan61–63 was performed to measure baseline CBVa. Compared to our previous study, 43 iVASO MRI has been extended from single-slice 43 to 3D whole brain coverage64,65 with the following parameters: voxel = 3.5 × 3.5 × 5 mm3, 20 slices. 3D-TRIP MRI50 (TR/TI1/TI2/TI3/FA = 4.0s/0.6s/1.5s/2.4s/7°, 3.5 mm isotropic) was performed in each participant during a blue-yellow flashing checker-board paradigm (flashing frequency = 8Hz, 4 blocks of alternating 24-s flashing and 40-s rest periods). To ensure that the subjects were awake during the flashing checker-board presentation, they were asked to press a button at the start and end of each flashing period. To minimize motion-related image artifacts in this population, foam pads and straps were used to restrict head movement during MRI scans.
Image analysis was performed with the statistical parametric mapping (SPM) software package (Version 12, Wellcome Trust Centre for Neuroimaging, London, UK; http://www.fil.ion.ucl.ac.uk/spm/) and other in-house code programmed in MATLAB (MathWorks, Natick, MA, USA). Previously developed analysis pipelines for iVASO62,64,65 and 3D-TRIP50 MRI were used. 3-D-TRIP MRI images were realigned using the routine in SPM to correct for head movement between scans, and the resulting motion parameters were reported and included as covariates in statistical analysis. Anatomical images were coregistered with iVASO and 3D-TRIP images using the mutual information algorithm in SPM. Regional brain volumes were estimated using the segmentation routine in SPM from the MP2RAGE images. Baseline CBVa maps were calculated using the iVASO theory. 62 For 3D-TRIP, both activation-based and region-of-interest (ROI)-based analysis were carried out. In activation-based analysis, a general linear model was employed to detect functional activation (adjusted P value < 0.05, cluster size ≥ 4) during the visual stimulation. Only voxels that met activation detection criteria in all three modalities (BOLD, CBV, and CBF) in the visual cortex were used to calculate signal changes in subsequent analysis. The activation detection threshold was identical in all three modalities, and signal-to-noise ratio (SNR) thresholds (SNR > 20) established in previous studies were used to exclude voxels with low SNR.50,66 In the ROI-based analysis, signals over the entire visual cortex in each subject were averaged. In both analysis methods, the relative signal change (ΔS/S) in each voxel was calculated as the difference between average signals during the rest and activation periods divided by the average rest signal. Partial volume correction for 3D-TRIP data was performed as previously described.48–50
Relative change in CBV during visual stimulation was calculated using the following equation according to the VASO theory54,67

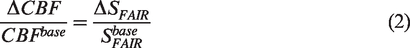
Relative change in CBF was quantified from the flow-sensitive alternating inversion recovery (FAIR) signal change, which is directly proportional to CBF change:56,57
Relative CMRO2 change was estimated from the BOLD, CBF, and CBV changes. First, venous blood oxygenation (Yv) was calculated from BOLD and CBV data using the quantitative BOLD model as described in previous studies,47,69,70 from which the oxygen extraction fraction (OEF) can be calculated as
70

As arterial blood is nearly fully oxygenated, the arterial oxygenation (Ya) was taken to be 0.98.
47
The relative CMRO2 change can then be derived from OEF and CBF changes using the following equation

Group comparisons were performed with two-tailed t-tests. Correlations between dynamic responses in BOLD, CBV, CBF, and CMRO2, and the CAP score were calculated using multiple regression. Age, sex, regional brain atrophy derived from MP2RAGE scans, and head motion parameters from preprocessing were all accounted for as covariates. Multiple comparisons were corrected for the four measures (BOLD, CBV, CBF, and CMRO2) with the family-wise error rate (adjusted P < 0.05).
Finally, to assess test–retest reproducibility of the 3D-TRIP MRI technique, the MRI scans were repeated on all control subjects (n = 16) on the same scanner three to six weeks after the initial scans. Only ROI-based analysis was performed. Reproducibility was assessed with the coefficient of variation of the measured parameters between scans, and the intraclass coefficient (ICC), which reflects the degree of absolute agreement among measurements (i.e., criterion-referenced reliability). 71 The procedure used here is identical to that in our previous reproducibility study conducted on 3 T scanners. 72
Results
Table 1 summarizes the demographic data for the study populations. No significant difference in age and sex was observed among groups (P > 0.1). The three HD patient sub-groups showed significant overall difference (from one-way analysis of variance (ANOVA)) in the CAP score (P < 0.001) and YTO (P < 0.001), and UDHRS motor score (P < 0.001). Since all HD patients were in premanifest or early manifest phase, involuntary movements were minimal during MRI scans. No major image artifacts due to subject movement during the image acquisition were seen on all images. Average motions during 3D-TRIP scans were quantified in the SPM realignment routine (control: 0.33 ± 0.12 mm translation, 0.05 ± 0.05° rotation; HD: 0.32 ± 0.16 mm translation, 0.05 ± 0.06° rotation; P > 0.1). No significant atrophy was found in the visual cortex in this cohort of premanifest and early manifest HD patients. The gray matter volume in the visual cortex was 3 ± 11% smaller in HD patients compared to controls (P = 0.68). No significant correlation was found between gray matter volumes in the visual cortex and CAP scores in HD patients. Significant increase in baseline CBVa in the visual cortex was found in HD patients (1.04 ± 0.15 ml/100 ml) compared to controls (0.95 ± 0.15 ml/100 ml, relative difference 10%, P = 0.01). Baseline CBVa in the visual cortex showed significant correlation the CAP scores in HD patients (R2 = 0.13, P = 0.05).
Figure 1 displays a set of representative BOLD, VASO, and ASL images acquired using 3D-TRIP MRI in a control subject and an HD patient, and the corresponding time courses averaged over common voxels activated in all three modalities and the calculated CMRO2 time course during the visual stimulation. The group-averaged quantitative results from all subjects from the activation and ROI-based analysis are summarized in Table 2. Individual results from each subject are included in the supplementary materials. In the activation-based analysis, trends (not significant) of reduced responses in BOLD and CBF during visual stimulation were observed in HD patients compared to controls. Meanwhile, CBV response significantly increased in HD patients, leading to the calculation of a significantly reduced CMRO2 response in HD patients. All signal responses in the control group were in the normal range.47,50,66
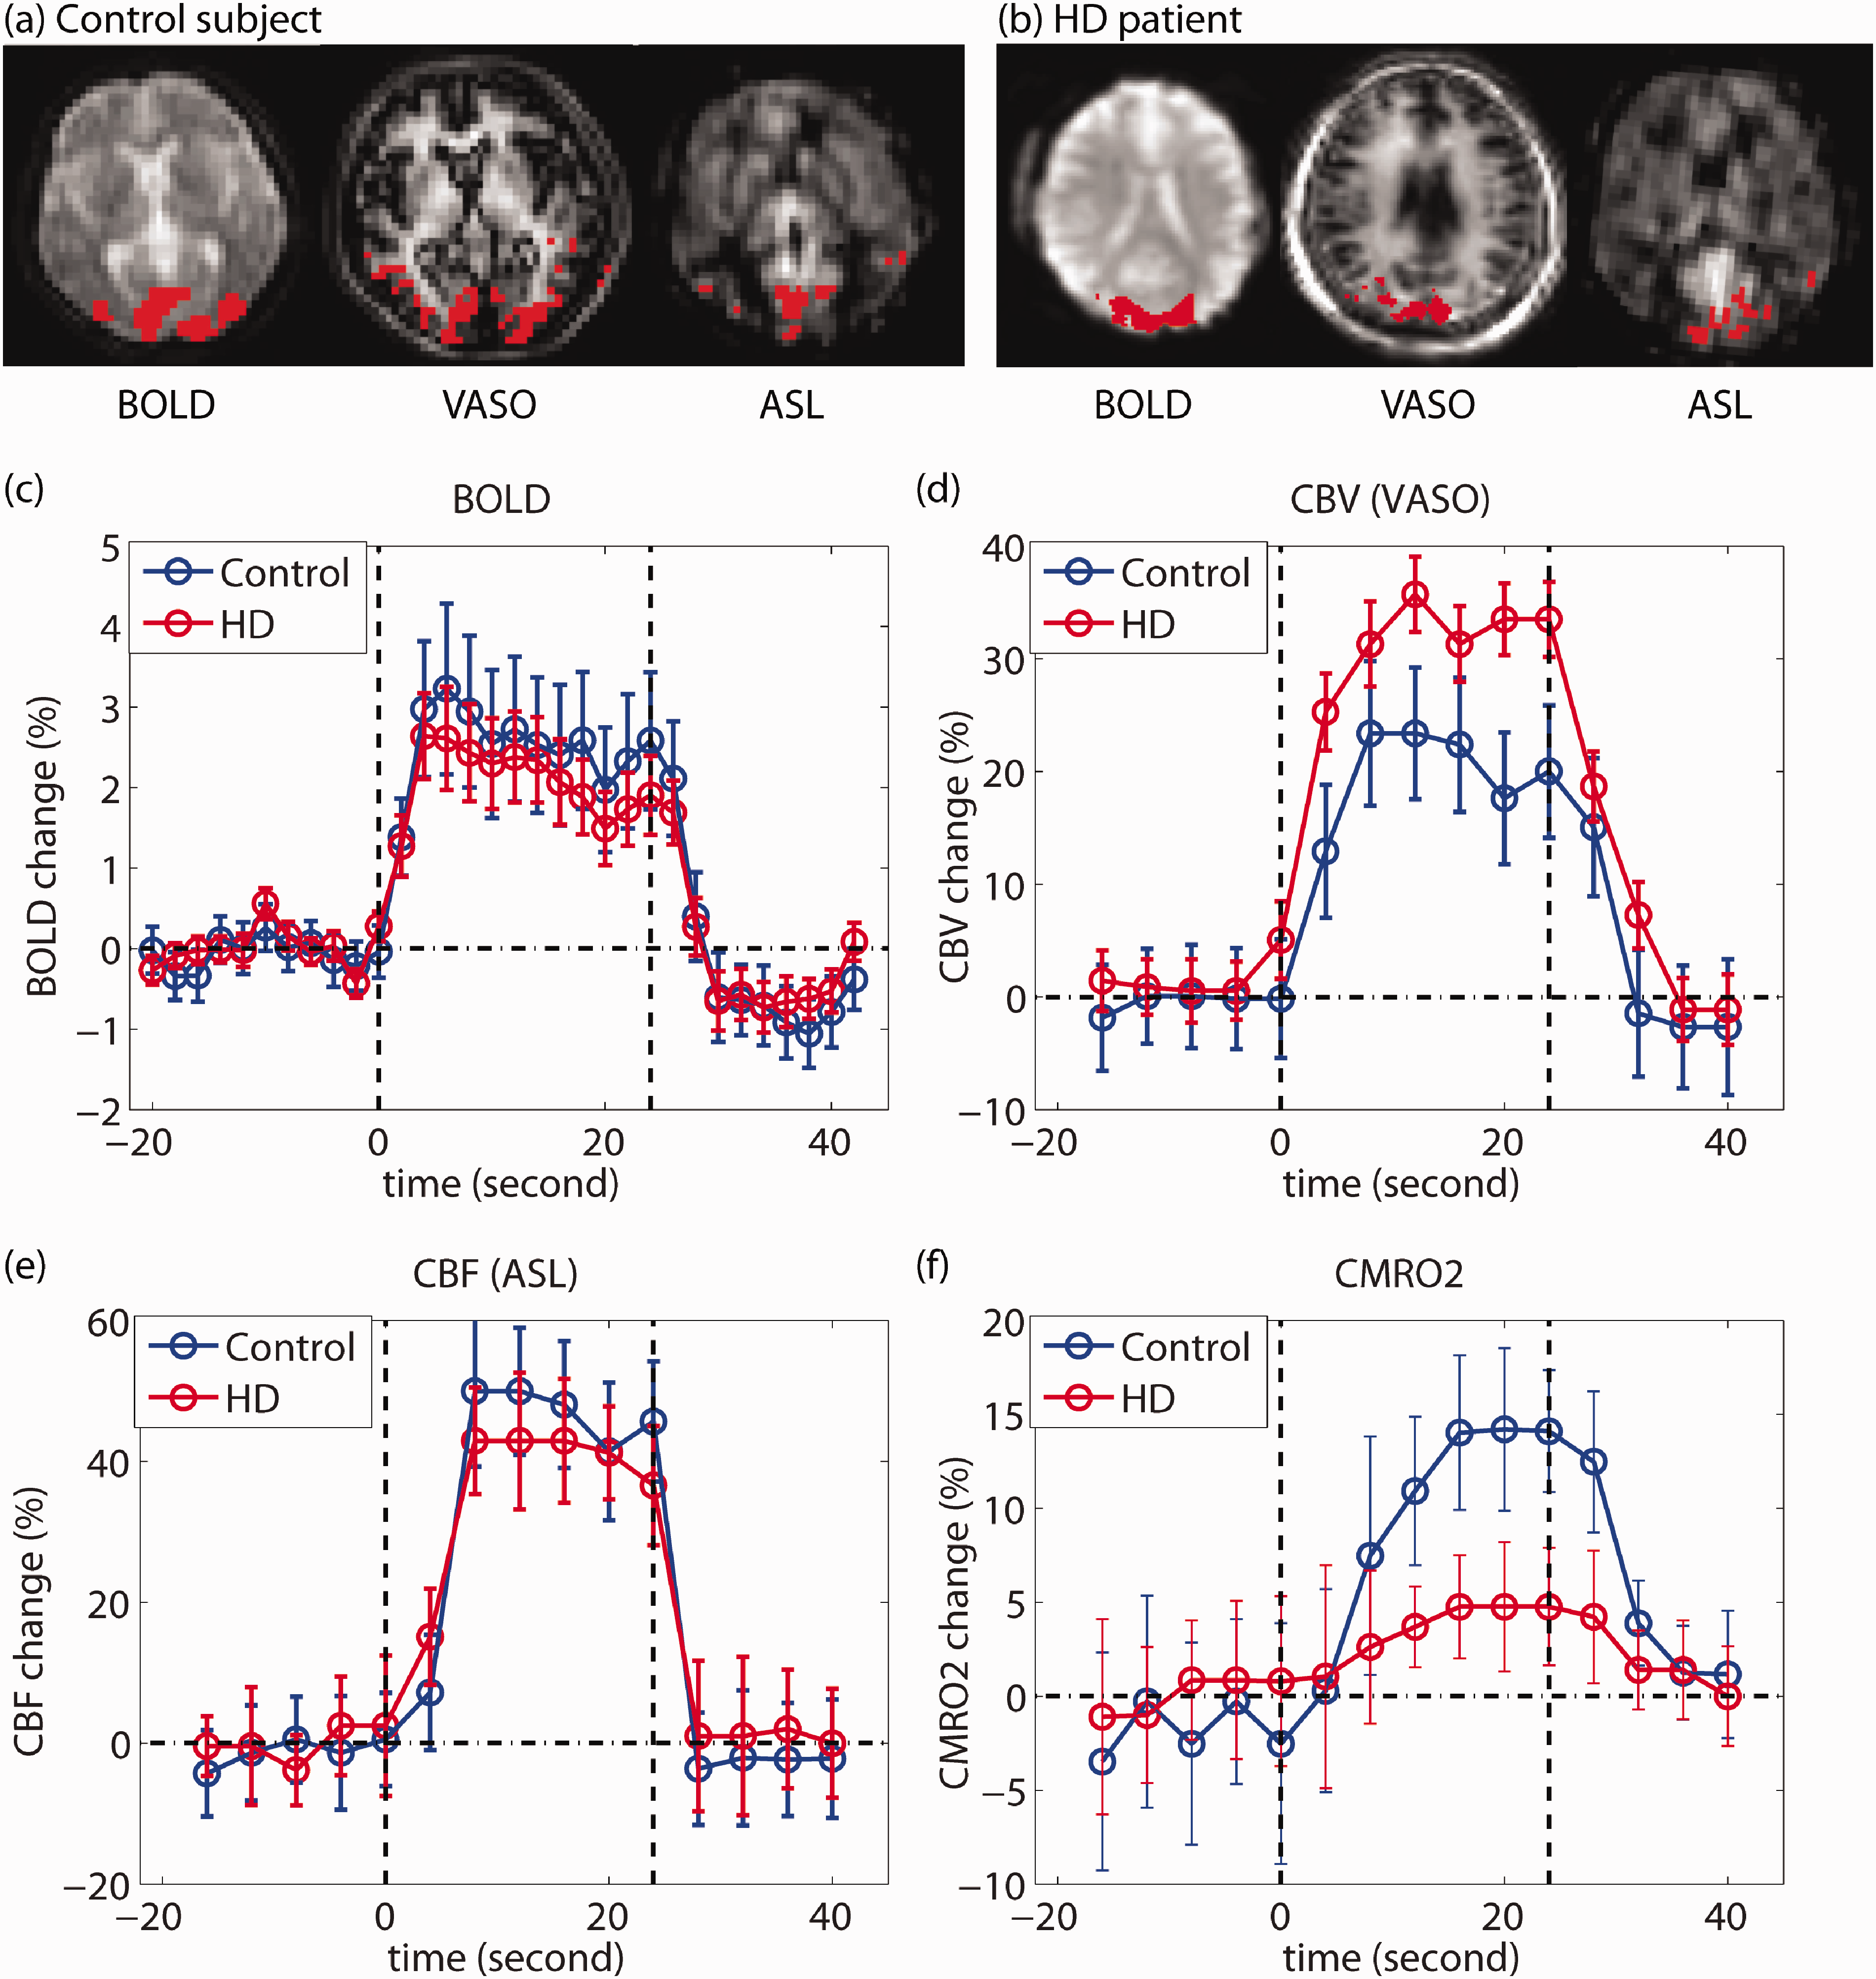
Measurement of BOLD, CBV (VASO), and CBF (ASL) responses during visual stimulation using 3D-TRIP MRI on 7 T: typical results from a healthy control and an HD patient. (a, b) Typical 3D-TRIP images and activated regions (voxels highlighted with red) in the visual cortex in a control and an HD patient, respectively. (c–f): Time courses of each parameter during the visual task. The vertical dashed lines depict the start and end of the visual stimulation. The error bars indicate intrasubject standard deviations.
Quantitative results from group comparisons and correlation analysis from all subjects.
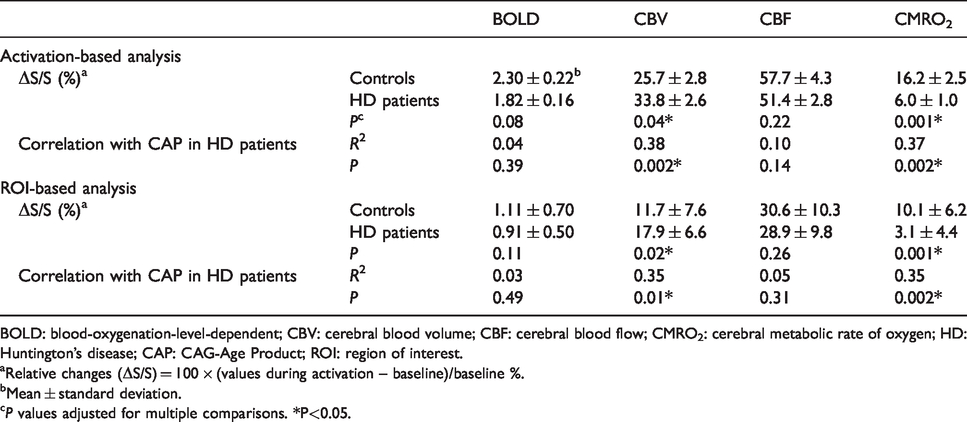
BOLD: blood-oxygenation-level-dependent; CBV: cerebral blood volume; CBF: cerebral blood flow; CMRO2: cerebral metabolic rate of oxygen; HD: Huntington’s disease; CAP: CAG-Age Product; ROI: region of interest.
aRelative changes (ΔS/S) = 100 × (values during activation – baseline)/baseline %.
bMean ± standard deviation.
cP values adjusted for multiple comparisons. *P<0.05.
Significant correlations (Table 2, Figure 2) were detected between CAP and responses in CBV (positive correlation) and CMRO2 (negative correlation), but not between CAP and responses in BOLD and CBF in HD patients. All HD patients showed lower CMRO2 response than the average value from the control group, including the three patients with YTO > 20 years. Five (out of eight) early manifest HD and two (out of eight) premanifest (close to onset) HD patients showed almost completely absent (<1%) CMRO2 response during the visual stimulation. A one-way ANOVA with the least significant difference method for the comparison of pairs of groups (multiple comparisons corrected) 73 was attempted with our data. Significant differences in CMRO2 response (overall, F = 4.4, P < 0.03) between controls and all three HD sub-groups (P < 0.03), and between premanifest (far from onset) HD and early manifest HD (P < 0.01), were revealed. Significant differences in CBV response (overall, F = 7.8, P < 0.01) between controls and early manifest HD (P < 0.01), between premanifest (far from onset) HD and early manifest HD (P < 0.01), and between premanifest (close to onset) HD and early manifest HD (P < 0.02) were observed. No other ANOVA comparisons showed significant results.
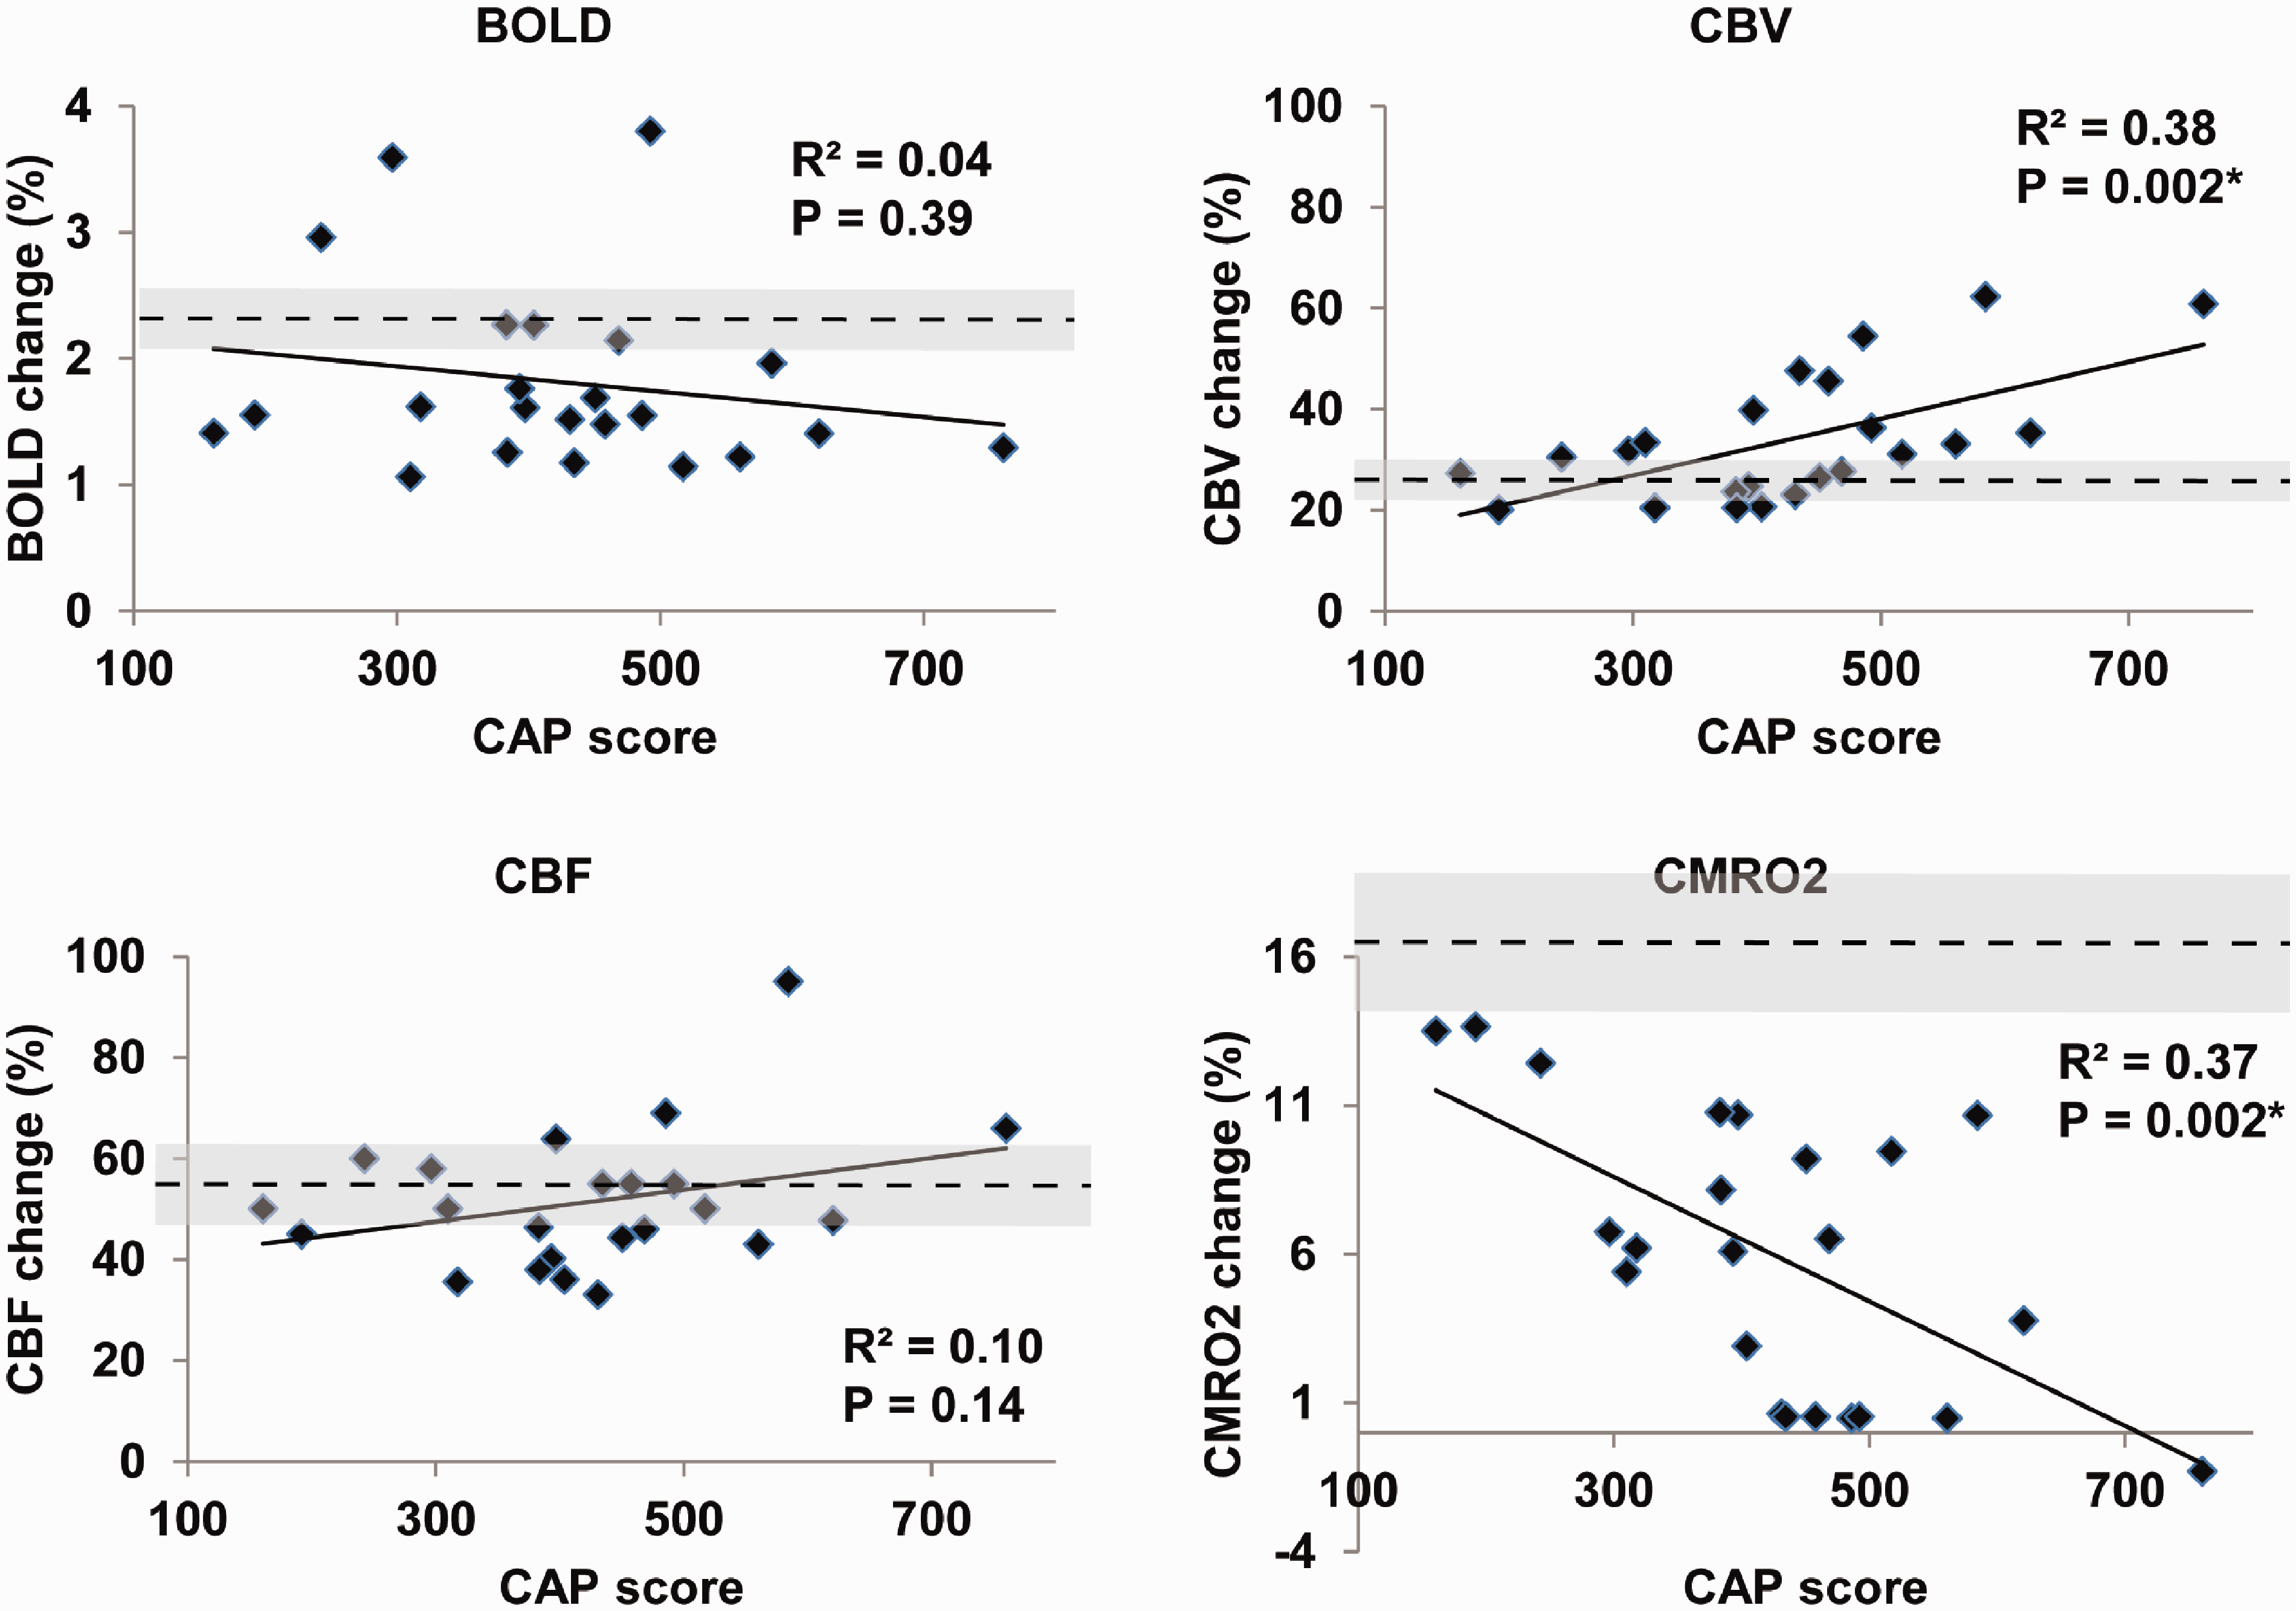
Correlations analysis from the activation-based approach. Scatter plots showing correlations between responses in BOLD, CBV, CBF, and CMRO2 during visual stimulation and the CAP score. The horizontal dashed line and the shaded band around it represent the mean and standard deviation values of the control group. *P < 0.05. R2: adjusted R2 from multiple regression. P values adjusted for multiple comparisons.
In addition to activation-based analysis, an ROI-based analysis was also performed (Table 2). Signal responses during visual stimulation from the ROI-based analysis were generally smaller than the corresponding values from the activation-based analysis. This can be expected because, in the ROI-based analysis, voxels that did not reach the activation detection threshold are included, which may dilute the overall signal changes during stimulation. The general pattern and significant conclusions from the ROI-based analysis were all comparable to those from the activation-based analysis.
Table 3 shows the results for the reproducibility of 3D-TRIP MRI measured in the control subjects. The individual measures (BOLD, CBV, and CBF) from 3D-TRIP showed comparable reproducibility to corresponding parameters assessed in our previous 3 T study using separate scans. The CMRO2 measure derived in 3D-TRIP showed comparable reproducibility as the CBF (ASL) measure. All ICCs are significantly different from zero (P < 0.001).
Reproducibility of 3-D-TRIP MRI measured in control subjects (n = 16) at 7 T.
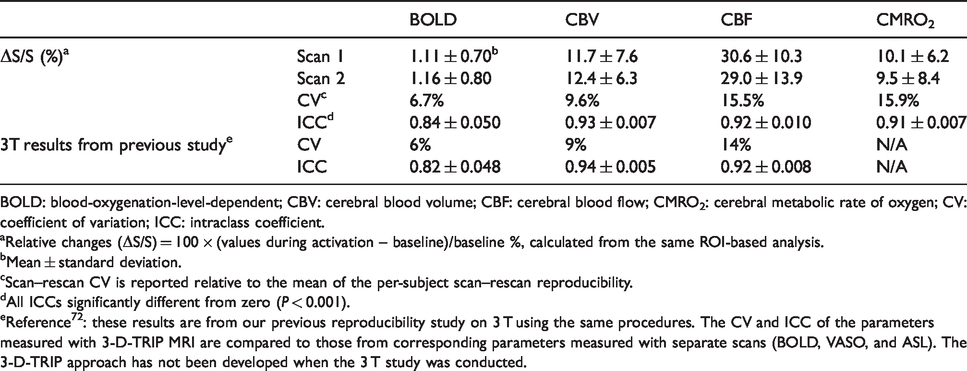
BOLD: blood-oxygenation-level-dependent; CBV: cerebral blood volume; CBF: cerebral blood flow; CMRO2: cerebral metabolic rate of oxygen; CV: coefficient of variation; ICC: intraclass coefficient.
aRelative changes (ΔS/S) = 100 × (values during activation – baseline)/baseline %, calculated from the same ROI-based analysis.
bMean ± standard deviation.
cScan–rescan CV is reported relative to the mean of the per-subject scan–rescan reproducibility.
dAll ICCs significantly different from zero (P < 0.001).
eReference72: these results are from our previous reproducibility study on 3 T using the same procedures. The CV and ICC of the parameters measured with 3-D-TRIP MRI are compared to those from corresponding parameters measured with separate scans (BOLD, VASO, and ASL). The 3-D-TRIP approach has not been developed when the 3 T study was conducted.
Discussion
In this study, 3D-TRIP MRI was performed to investigate the potential microvascular and metabolic abnormalities in response to functional stimulation in the visual cortex in HD patients. BOLD fMRI has been widely used to investigate functional and neurovascular abnormalities in brain diseases, including HD. 74 During functional stimulation, the BOLD signal typically increases compared to baseline, which is the result of responses in several physiological parameters, including CBV, CBF, and CMRO2. Therefore, it is important to measure changes in individual physiological parameters in brain diseases. In our data, CMRO2 response showed significant abnormalities in HD patients compared to controls (P = 0.001). Significantly increased CBV response during visual stimulation was found in HD patients compared to controls (P = 0.04), which correlated with the CAP score. The BOLD response showed a decreasing trend (P = 0.08) in HD patients compared to controls, in congruence with previous reports.30–37 If the two HD patients with BOLD responses that are more than two standard deviations from the median are excluded (subject 6011, 6021 in Table S1, potential outliers), the BOLD response becomes significantly lower in HD patients than controls (P = 0.01). Response in CBF during visual stimulation also showed a decreasing trend in HD patients compared to controls, in agreement with previous reports.30–37
The responses of BOLD, CBV, CBF, and CMRO2 in the control group were all in the normal range,47,50,66 providing validation for our measurements in the study. All parameters measured in 3D-TRIP showed good reproducibility that is comparable to corresponding 3 T measures (Table 3).
Consistent with our previous report, 43 baseline CBVa in the visual cortex increased significantly in HD patients compared to controls and correlated significantly with the CAP scores in HD patients. The relative increase of CBVa in HD patients (∼10%) was smaller than that in our previous study (∼30% in the occipital lobe). 43 A single-slice version of iVASO MRI was used when we conducted the initial study, 43 and CBVa in the occipital region in a single slice was reported. In the current study, the later developed 3-D iVASO MRI was used, which allows whole brain coverage with similar total scan time.64,65 Thus, CBVa averaged over the entire primary visual cortex was reported here. Besides, the cohort in the current study does not overlap with the cohort in the previous study. 43
The most significant finding in our data is the impaired CMRO2 response during visual stimulation in HD patients compared to controls and its strong correlation with the CAP score. CMRO2 responses from all HD patients were lower than the average value from the control group (Figure 2). In HD patients, CBV and CBF still showed significant positive responses (compared to baseline), but the CMRO2 response was much diminished during the same visual stimulation. In several early manifest and premanifest (close to onset) HD patients, CBV and CBF increased, but no substantial CMRO2 response was detected during visual stimulation. Note that a button press was recorded from each of these patients at the start and end of each flashing period, confirming that the participants were awake during the flashing checker-board presentation. The ANOVA analysis on the data from the three sub-groups of HD patients showed that abnormalities in CBV response were not significant until the early manifest stage, while significant abnormalities in CMRO2 response began in the premanifest stage (Figure 2). This seems to indicate that CMRO2 abnormality occurs earlier and presents greater effect sizes than microvascular abnormalities (CBV and CBF responses). One possible explanation may be that although the microvasculature was able to sustain energy delivery during neuronal activation via blood flow regulation, the oxygen consumption in the brain tissue was abnormal in these patients. In fact, the CBV response in HD patients was significantly larger than that in controls, indicating greater vasodilation in response to the visual stimulation, implying a possible compensatory mechanism to maintain blood flow and tissue perfusion. Deficit in energy consumption in HD is in line with the metabolic abnormalities in HD reported in the literature. For instance, the decreased CMRO2 response is congruent with a prior study from Mochel et al., 16 which reported impaired (close to zero) inorganic phosphate/phosphocreatine ratio and inorganic phosphate/adenosine triphosphate ratio (reflecting adenosine diphosphate concentrations) responses during visual stimulation in early manifest HD patients using 31 P MRS. A number of previous PET studies have investigated the metabolic abnormalities in the striatum in HD.10,14,15,29,75 While metabolic alterations are a consistent finding, the nature and origin of these alterations are more controversial.24–29 It has long been thought that mitochondrial abnormalities are central, but more recent studies have also suggested the importance of glycolysis, fatty acid metabolism, or other aspects of cellular metabolism.75–79
However, a few confounding effects need to be considered when interpreting the data. First, the calculation of relative CMRO2 change in 3D-TRIP can be affected by baseline CBV values. In the 3D-TRIP equations described in the Methods section, a constant baseline CBV is assumed, and CBVa is assumed to occupy 30% of total CBV. In this study, baseline CBVa was measured using iVASO MRI in all subjects, but baseline total CBV was not measured in this cohort (which typically requires intravenous administration of exogenous MRI contract agents). CBVa in the visual cortex showed an approximately 10% increase in HD patients compared to controls. If a baseline CBVa value that is 20% greater than the current value is assumed for HD patients (not controls) with unchanged baseline total CBV, the estimated CMRO2 change in HD patients will decrease from 6.0% to 5.7%, making the relative difference of CMRO2 change slightly larger between HD patients and controls. However, if the same increase (20%) in baseline total CBV is assumed, the estimated CMRO2 change in HD patients will increase from 6.0% to 12.0%. This can be expected as venous CBV change has a larger impact on the BOLD effect than CBVa. A 20% increase of venous CBV in the visual cortex in these HD patients compared to controls seems unlikely though, as many studies have reported decreased CBF in HD,9,30–39 and relative changes in venous CBV are often much smaller than relative changes in CBVa. 80 However, one cannot rule out the possibility that the observed striking difference in CMRO2 responses between HD patients and controls may be partially accounted for by a baseline CBV change in HD patients. Second, the CMRO2 change was estimated from BOLD, CBV, and CBF measures in 3D-TRIP. Thus, measurement noises in BOLD, CBV, and CBF could, in principle, make the CMRO2 change look more significant than the CBV change. In our data, CBV abnormalities, although less significant, also showed progression from the premanifest to the early manifest stages similar to CMRO2 abnormalities. Therefore, the data from the current study cannot provide definitive evidence to determine whether microvascular abnormality or metabolic impairment is the primary driven effect in HD. Future studies combining MRI and other imaging modalities (for instance, invasive optical imaging) in animal models of HD may be possible to elucidate such mechanisms.
In the current study, we chose to use visual stimulation because it is a simple and robust paradigm to test our methodology and because recent data and concepts indicate that more widespread areas of the brain beyond the motor circuit are affected early in HD including occipital brain regions subserving visual functions. 81
Our results suggest that the metabolic and microvascular abnormalities in HD are present in the cortex in the premanifest stage. Other brain regions, such as other sensory and motor regions and the striatum, could be probed with the same methodology using specifically designed functional stimulation. It would be of great potential importance for designing therapeutic interventions to understand better what regions of the brain are functionally impaired early in the natural history of the disease. Two major approaches to Huntingtin-lowering therapeutic interventions currently are being tested for HD. Antisense oligonucleotides are being administered into the cerebrospinal fluid, 82 which will superfuse the cortex well, and need to diffuse to the striatum. By contrast, adeno-associated virus ribonucleic acid interference reagents shown to be effective in mice 83 will be injected into deep brain structures especially the striatum in human subjects and will need to be transported to the cortex. The fMRI method described here may provide a means to determine metabolic and microvascular abnormalities in the brain regions differentially targeted by these strategies.
Limitations of this study include the relatively small sample size and the cross-sectional design. The sample size was estimated based on the effect size of baseline CBVa change reported in our previous study. 43 The data from the current study will serve as the basis for more accurate power and sample size calculations for subsequent lager cross-sectional and longitudinal studies. Although the current study was performed on 7 T, the methodology was originally developed on 3 T and has been implemented on both platforms of clinical MRI systems. The sensitivity may be lower on 3 T compared to 7 T, but it can be compensated by reducing to partial brain coverage with a more focused target region identified from the current whole brain study (and thus less imaging acceleration is required which will increase sensitivity). Therefore, we expect that the findings at 7 T from this study will also have utility on more widely available 3 T scanners for future studies.
In summary, our data indicate that CMRO2 response during visual stimulation in the brain is abnormal in premanifest HD. We believe that these preliminary results merit further investigation in a larger cohort, with additional forms of sensory or other functional activation, and with a longitudinal design. Given the strong correlation with the CAP score shown in our data, CMRO2 measurement may prove a useful biomarker to track disease progression in premanifest as well as manifest HD, and we speculate that it may be responsive to therapeutic interventions.
Supplemental Material
sj-pdf-1-jcb-10.1177_0271678X20949286 - Supplemental material for Impaired response of cerebral oxygen metabolism to visual stimulation in Huntington’s disease
Supplemental material, sj-pdf-1-jcb-10.1177_0271678X20949286 for Impaired response of cerebral oxygen metabolism to visual stimulation in Huntington’s disease by Peter Klinkmueller, Martin Kronenbuerger, Xinyuan Miao, Jee Bang, Kia E Ultz, Adrian Paez, Xiaoyu Zhang, Wenzhen Duan, Russell L Margolis, Peter CM van Zijl, Christopher A Ross and Jun Hua in Journal of Cerebral Blood Flow & Metabolism
Footnotes
Funding
The author(s) disclosed receipt of the following financial support for the research, authorship, and/or publication of this article: This study was supported by the Dana Foundation, the Huntington’s Disease Society of America, and the NIH 5P41 EB015909 resource grant.
Acknowledgements
The authors thank Joseph Gillen, Terri Brawner, Kathleen Kahl, and Ivana Kusevic (F.M. Kirby Research Center) for experimental assistance and colleagues in the Baltimore Huntington’s Disease Center for support in the study organization.
Declaration of conflicting interests
The author(s) declared the following potential conflicts of interest with respect to the research, authorship, and/or publication of this article: This study was performed on a human MRI scanner manufactured by Philips Healthcare. Dr van Zijl is a paid lecturer and has a grant from Philips Healthcare. He also is the inventor of technology licensed to Philips. This arrangement has been approved by Johns Hopkins University in accordance with its conflict of interest policies. Full financial disclosure for the previous 12 months: none for all the authors.
Authors’ contributions
JH, RLM, PCMVZ, and CAR conceived this research project. JH, PK, MK, JB, KEU, XM, and AP were involved in the organization and execution of the project. JH designed the statistical analysis. PK, XM, AP, and XZ participated in the execution of the statistical analysis. JH, MK, RLM, PCMVZ, and CAR contributed to the review and critique of the statistical analysis. The first draft of the manuscript was written by JH and PK. The review and critique of the manuscript were provided by MK, XM, AP, WD, RLM, PCMVZ, and CAR.
Supplemental material
Supplemental material for this article is available online.
References
Supplementary Material
Please find the following supplemental material available below.
For Open Access articles published under a Creative Commons License, all supplemental material carries the same license as the article it is associated with.
For non-Open Access articles published, all supplemental material carries a non-exclusive license, and permission requests for re-use of supplemental material or any part of supplemental material shall be sent directly to the copyright owner as specified in the copyright notice associated with the article.