
Abstract
The positron emission tomography radioligand [11C]UCB-J binds to synaptic vesicle glycoprotein 2 A (SV2A), a regulator of vesicle release. Increased neuronal firing could potentially affect tracer concentrations if binding site availability is altered during vesicle exocytosis. This study assessed whether physiological brain activation induces changes in [11C]UCB-J tissue influx (K1), volume of distribution (VT), or binding potential (BPND). Healthy volunteers (n = 7) underwent 60-min [11C]UCB-J PET scans at baseline and during intermittent presentation of 8-Hz checkerboard visual stimulation. Sensitivity to intermittent changes in kinetic parameters was assessed in simulations, and visual stimulation was repeated using functional magnetic resonance imaging to characterize neural responses. VT and K1 were determined using the one-tissue compartment model and BPND using the simplified reference tissue model. In primary visual cortex, K1 increased 34.3 ± 15.5% (p = 0.001) during stimulation, with no change in other regions (ps > 0.12). K1 change was correlated with fMRI BOLD response (r = 0.77, p = 0.043). There was no change in VT (−3.9 ± 8.8%, p = 0.33) or BPND (−0.2 ± 9.6%, p = 0.94) in visual cortex nor other regions (ps > 0.19). Therefore, despite robust increases in regional tracer influx due to blood flow increases, binding measures were unchanged during stimulation. [11C]UCB-J VT and BPND are likely to be stable in vivo measures of synaptic density.
Introduction
Synaptic density can be assessed in vivo using the positron emission tomography (PET) radioligand [11C]UCB-J, which binds to the synaptic vesicle glycoprotein 2 A (SV2A). 1 Despite a growing body of literature demonstrating the utility of [11C]UCB-J to assess synaptic loss or dysfunction in clinical populations,1–5 questions remain about the interpretation of signals from SV2A-binding radiotracers. SV2A is expressed ubiquitously at synapses throughout the mammalian brain and plays a crucial role in normal synaptic function.6–8 [11C]UCB-J in vivo binding measures show excellent agreement with in vitro quantification of SV2A and synaptophysin, 1 another common synaptic marker protein. However, several factors in addition to the number of synapses in a given brain region could influence [11C]UCB-J binding. For example, while SV2A is expressed at a consistent level of approximately five copies per vesicle, 9 variation in the number of vesicles per synapse could affect tracer binding in the absence of differences in synaptic density itself. Number of synaptic vesicles is closely linked to capacity for neurotransmitter release, 10 suggesting that signals from SV2A-bindingra diotracers may reflect, to some degree, the functional capacity of synapses as well as their density. The potential effects of dynamic vesicle release processes on tracer binding remain to be determined.
Neurotransmitter release through synaptic vesicle exocytosis is an active and tightly regulated process involving numerous biochemical mediators of vesicle trafficking, filling, priming, docking at the plasma membrane, fusion, release, and recycling. 11 , 12 Loss of SV2A leads to impairments in neurotransmission, 13 but its precise functional role in these processes is not yet clear. SV2A appears to be important in regulating vesicle exocytosis triggered by Ca2+ influx, in part through interactions with synaptotagmin or regulation of presynaptic Ca2+ levels. 7 , 14 , 15 Accordingly, SV2A can be presumed to have varying binding partners, 16 physical conformations, 17 or electrostatic properties 18 at different stages of the vesicle release process. Each of these could affect accessibility or affinity of the [11C]UCB-J binding site, which would result in variation in radiotracer binding measures related to the level of synaptic activity during scanning.
Regional changes in cerebral blood flow associated with heightened neuronal activity underlie the use of [15O]water PET and functional magnetic resonance imaging (fMRI) to measure brain response to stimuli including sensory, motor, or cognitive challenges. In PET studies assessing protein targets, differential effects of tracer delivery and binding can be accurately separated using kinetic modeling. Previous PET studies using neuroreceptor-binding radiotracers have demonstrated that changes in blood flow only are reflected in the tissue influx constant, K1, and do not influence measures related to target binding such as volume of distribution, VT, and binding potential, BPND. 19 , 20 Therefore, changes in [11C]UCB-J binding measures during brain activation, if they occur, could be attributed to altered availability of the binding site itself, and thus would specifically reflect the influence of increased SV2A-mediated synaptic vesicle release during physiological brain stimulation. Visual activation is among the most robust and well-characterized behaviorally evoked brain responses, producing large increases in blood flow, oxygen metabolism, glucose metabolism, and electroencephalogram (EEG) activity within the primary visual cortex (V1).21–24
Stability of [11C]UCB-J binding is a crucial consideration in research and clinical applications. Activity-related changes in binding would mean that differences in brain state at the time of scan could induce an effect on [11C]UCB-J binding measurements in the absence of true differences in synaptic density. This would introduce a potential confound or source of variability, making it more difficult to identify true differences in synaptic density. The objective of this study was to assess whether physiological brain activation alters [11C]UCB-J binding measures. We hypothesized that during a visual activation task, increased neuronal activity would lead to higher K1 in the visual cortex due to flow increases, along with possible changes in VT due to altered availability of the SV2A binding site.
Materials and methods
Effects of brain stimulation on [11C]UCB-J tissue delivery and binding were compared in a two-scan baseline and activation paradigm using 8 Hz checkerboard visual stimulation to induce spatially restricted neuronal activation. 22 Previous studies using fMRI blood oxygen level dependent (BOLD) signal, cerebral blood flow measures, and EEG have found that neuronal and vascular responses to activation in the visual cortex habituate over time23–26 but that this effect is typically less pronounced with repeated intermittent blocks of stimulation compared to sustained stimulation in blocks longer than 2–5 min.24–26 Therefore, to achieve predictable, sustained responses across the 60-min scan length, visual stimulation was presented in 12 repeating 5-min blocks, each comprising a stimulation and a rest period. Given this intermittent stimulation, simulations were performed to evaluate sensitivity to time-varying changes in K1 and VT, and fMRI scans were performed with the same stimulus to assess response strength and time course.
PET simulations
[11C]UCB-J data, under steady state conditions, have been shown to be well-described by the one-tissue compartment model (1TCM). 27 To assess the impact of non-steady state conditions, PET data with time-varying rate constants were simulated and estimates of K1 and VT were determined using 1TCM methods. Sensitivity to changes in these values was assessed relative to a baseline scan. Changes during activation blocks were simulated to produce K1 changes (ΔK1) ranging from 0 to +50% and VT changes (ΔVT) from −50 to +50%, both in increments of 5%, for a total of 231 conditions. Changes in K1 and VT were modeled as square pulses, i.e. rate constants were assumed to change instantaneously at the beginning of stimulation blocks and return to the original baseline at the end of each block. Baseline values of K1 = 0.40 mL·cm−3·min−1 and k2 = 0.02 min−1 (where VT = K1/k2 = 20 mL·cm−3) were selected, in line with values in the occipital cortex from previous work. 27 Three stimulation timing conditions within the 5-min blocks were tested: 2.5 min stimulation, 2.5 min rest; 3 min stimulation, 2 min rest; 4 min stimulation, 1 min rest. To explore the effects of habituation on these results, for the 3-min on/2-min off condition, a set of data were simulated in which the initial magnitude of change was the same, but activation decreased exponentially to <5% above baseline in the final stimulation block.
Using these time-varying K1 and k2 values (sampled at 0.6 s time resolution) and a real [11C]UCB-J arterial input function, time-activity curves (TACs) were generated by computing tissue concentration (CT) from the 1TCM differential equation using the fourth-order Runge–Kutta method. TACs were binned into frames (6 × 30 s, 3 × 1 min, 2 × 2 min, 10 × 5 min). Normally-distributed noise was added to each TAC with zero mean and standard deviation increasing to account for radioactive decay, 28 scaled based on the residual sum of squares (RSS) for the occipital cortex TACs. One thousand replicates were produced for each combination of K1 and VT changes. TACs were fitted using the 1TCM to estimate single values for K1 and k2 for each TAC. Quality of fit was assessed by comparing average residual sum of squares of TACs with time-varying K1 and k2 values relative to simulated baseline (constant K1 and k2) curves. Mean estimated K1 and VT values were determined for each change condition and expressed as percent bias relative to (1) the true value of each during stimulation blocks (K1, stim and VT, stim) and (2) the true mean value across scan duration, a time-weighted average of the values during stimulation and rest blocks (K1, mean and VT, mean).
Experimental study design
Seven healthy participants (three men and four women; mean age 37.6 ± 10.8 years) completed two PET scans and one MRI session with adequate compliance (see below). PET scans were completed on the same day separated by at least 4 h with scan order counter-balanced across subjects. MRI was acquired on a separate day before (n = 3) or after (n = 4) the PET session. Participants provided written informed consent prior to completing any study procedures. The study was approved by the Yale University Human Investigation Committee and the Radioactive Drug Research Committee and was conducted in accordance with the World Medical Association Declaration of Helsinki.
The visual stimulus consisted of an 8 Hz alternating black and white radial checkerboard filling the field of view with a static fixation cross at the center. This was alternated with off blocks consisting of a white fixation cross on black background for fMRI and with rest blocks comprising a static, low-contrast grey and black rectangular checkerboard for PET.
MRI
Visual activation
Stimulus was presented on a screen visible in the scanner via a mirror. Two fMRI runs were acquired with the checkerboard stimulus presented according to two timing patterns. First, to allow comparison between PET results and typical fMRI visual activation responses, one run was acquired using blocks of 30-s off, 30-s on for 6 min. To specifically assess the time course of the BOLD response during the sustained activation used in the PET study, a second scan was acquired using the chosen on-off pattern based on the simulation results, i.e. three blocks of 180-s on, 120-s off for a total of 15 min. Participants were instructed to press a key when the fixation cross in the center of the field of view changed color during each activation block to ensure they were watching the presentation on the screen. The two task sessions were separated by 12 min during which participants rested in the scanner with a black screen presented.
Acquisition
Structural and functional MRI scans were acquired on a 3.0 T Prisma Fit scanner (Siemens Medical Solutions). A high resolution, three-dimensional magnetization prepared rapid acquisition gradient echo (MPRAGE) T1-weighted sequence was first acquired for co-registration with PET images (TR = 2530 ms, TE = 2.81 ms, FOV = 256 × 256 mm2, matrix = 256 × 256 mm2, slice thickness = 1.0 mm without gap, 176 slices, voxel size 1.0 × 1.0 × 1.0 mm3). Functional runs included 360 or 900 whole-brain volumes acquired using a multiband echo-planar imaging sequence with the following parameters: TR = 1 s, TE = 29.6 ms, flip angle = 60°, matrix = 84 × 84, in-plane resolution = 2.5 mm2, 60 axial-oblique slices parallel to the ac–pc line, slice thickness = 2 mm, multiband = 4, acceleration factor = 2.
Analysis
Anatomical images were registered to the MNI152 template using non-linear transformations and segmented into grey and white matter with CAT12 (http://www.neuro.uni-jena.de/cat/). fMRI data were pre-processed and analyzed using SPM12 (Wellcome Trust Centre for Neuroimaging, http://www.fil.ion.ucl.ac.uk/spm/software/spm12/). The first 15 volumes of each functional run were discarded to allow magnetization to reach a steady state. Images were then motion-corrected, linearly registered to subject’s anatomical image, then registered to the template and spatially smoothed with an 8 mm FWHM Gaussian kernel. A temporal high-pass filter with cutoff frequency equal to twice the block length was applied to remove low-frequency drifts. A general linear model was then produced for each subject with one task regressor convolved with the hemodynamic response function. Individual time course and percent signal change during activation blocks was extracted using MarsBaR (http://marsbar.sourceforge.net/) from V1 (Brodmann area 17) as defined in the Talaraich Daemon Brodmann area atlas in PickAtlas software (http://fmri.wfubmc.edu/software/PickAtlas). To identify voxels where the BOLD signal increased during activation blocks, activation/rest contrast images for each subject were compared in a one-sample t test using a cluster-level threshold of p < 0.05, corrected for family-wise error (pFWE).
PET
Visual activation
Stimuli were presented on video display glasses (z920VGHD, Zetronix, Boston MA) worn by the participant throughout both PET scans. During the activation scan, stimulation was initiated 30 s before the start of radiotracer injection, beginning with an ‘on’ block and continuing through the 60-min scan for a total of 12.1 5-min presentation cycles. As in fMRI, participants were instructed to press a key on a handheld keypad when the fixation cross in the center of the field of view changed color, which occurred at pseudorandom intervals of 3–6 min throughout the scan (15 occurrences total). One participant responded to less than 75% of these prompts and so was excluded from the analysis. The remaining seven participants responded to >90% of prompts. In the baseline PET scan, a static white cross on black background was shown throughout.
Acquisition
[11C]UCB-J was synthesized as previously described. 29 After positioning the video glasses, a 6-min transmission scan was performed for attenuation correction. [11C]UCB-J was then administered as a 1-min intravenous infusion. Dynamic PET data were acquired for 60 min on a high resolution research tomograph (HRRT; CTI/Siemens, Knoxville TN). Head motion was tracked using an optical detector (Vicra, NDI Systems, Waterloo, Ontario, Canada). Blood samples were drawn at intervals throughout the scan via an arterial cannula placed in the wrist of the subject’s nondominant hand. Radiometabolite analyses were performed using an automatic column-switching HPLC system as previously described. 29 The unmetabolized parent fraction was determined as the ratio of the radioactivity corresponding to the parent to the total amount of radioactivity collected. The parent fraction curve was fitted with an inverted integrated gamma function. Arterial plasma input function was calculated as the product of the total plasma activity, parent fraction curve, and extraction efficiency curve, which was determined from the ratio of filtered to original plasma concentrations fitted with an exponential function.
Analysis
Dynamic PET data were reconstructed with corrections for attenuation, normalization, scatter, randoms, deadtime and motion using the MOLAR algorithm 30 into 21 frames (6 × 30 s, 3 × 1 min, 2 × 2 min, 10 × 5 min). TACs were extracted from each ROI in the subject’s PET space to determine VT and K1 using the 1TCM with arterial input function. Grey matter ROIs were defined using the Brodmann area atlas as described above for visual areas and the automated anatomical labeling (AAL) atlas combined with the subject’s grey matter segmentation map for all other regions. Primary ROIs were the primary visual cortex, V1 (defined as Brodmann area 17), the temporal cortex as a negative control region, and the centrum semiovale to assess nonspecific binding. To explore the spatial extent of observed changes, the occipital cortex, visual area 2 (Brodmann area 18), and visual areas 3–5 (Brodmann area 19) were also analyzed and prefrontal cortex (PFC) subregions (ventromedial PFC, dorsolateral PFC, and anterior cingulate cortex) were included as additional control regions. The centrum semiovale shows low displaceable binding and can be used as a pseudoreference region for the calculation of [11C]UCB-J binding potential (BPND). 31 To assess the influence of visual activation on BPND determination in the absence of blood measurements, BPND was calculated in all other regions using SRTM232 with a fixed value for k2ʹ of 0.027 min−1, the mean k2 in the centrum semiovale from 1TCM in a previous sample of healthy volunteers. 33 The Shapiro–Wilk test was used to assess normality of outcome measures. Changes in ROI estimates of K1, VT, and BPND were each assessed using repeated measures analysis of variance (ANOVA) with region (V1, temporal cortex, centrum semiovale) and scan type (activation or baseline) as within-subject factors. For whole-brain comparisons, parametric images of K1, VT, and BPND were generated using the same methods, registered to the MNI template, smoothed at 8 mm, and compared in SPM using paired t-tests with a threshold of cluster-level pFWE<0.05.
Results
PET simulations
Three stimulation timing paradigms within the 5-min blocks were assessed. In all cases, model fits were good using the standard 1TCM (i.e. assuming constant K1 and k2) and K1 and VT were estimated with high precision (<2% and <4% standard error, respectively). Change in K1 was well-captured using the 3- and 4-min stimulation blocks, with percent change estimates at >75% of the true values in all cases, but was lower (≥61%) with the 2.5-min blocks. Because the 3- and 4-min stimulation lengths produced comparable results, the 3-min blocks were chosen for the experimental study in order to minimize response habituation and enhance participant comfort. Examples of simulated TACs with time-varying rate constants using the chosen activation timings of 3-min on, 2-min off are shown in Figure 1.
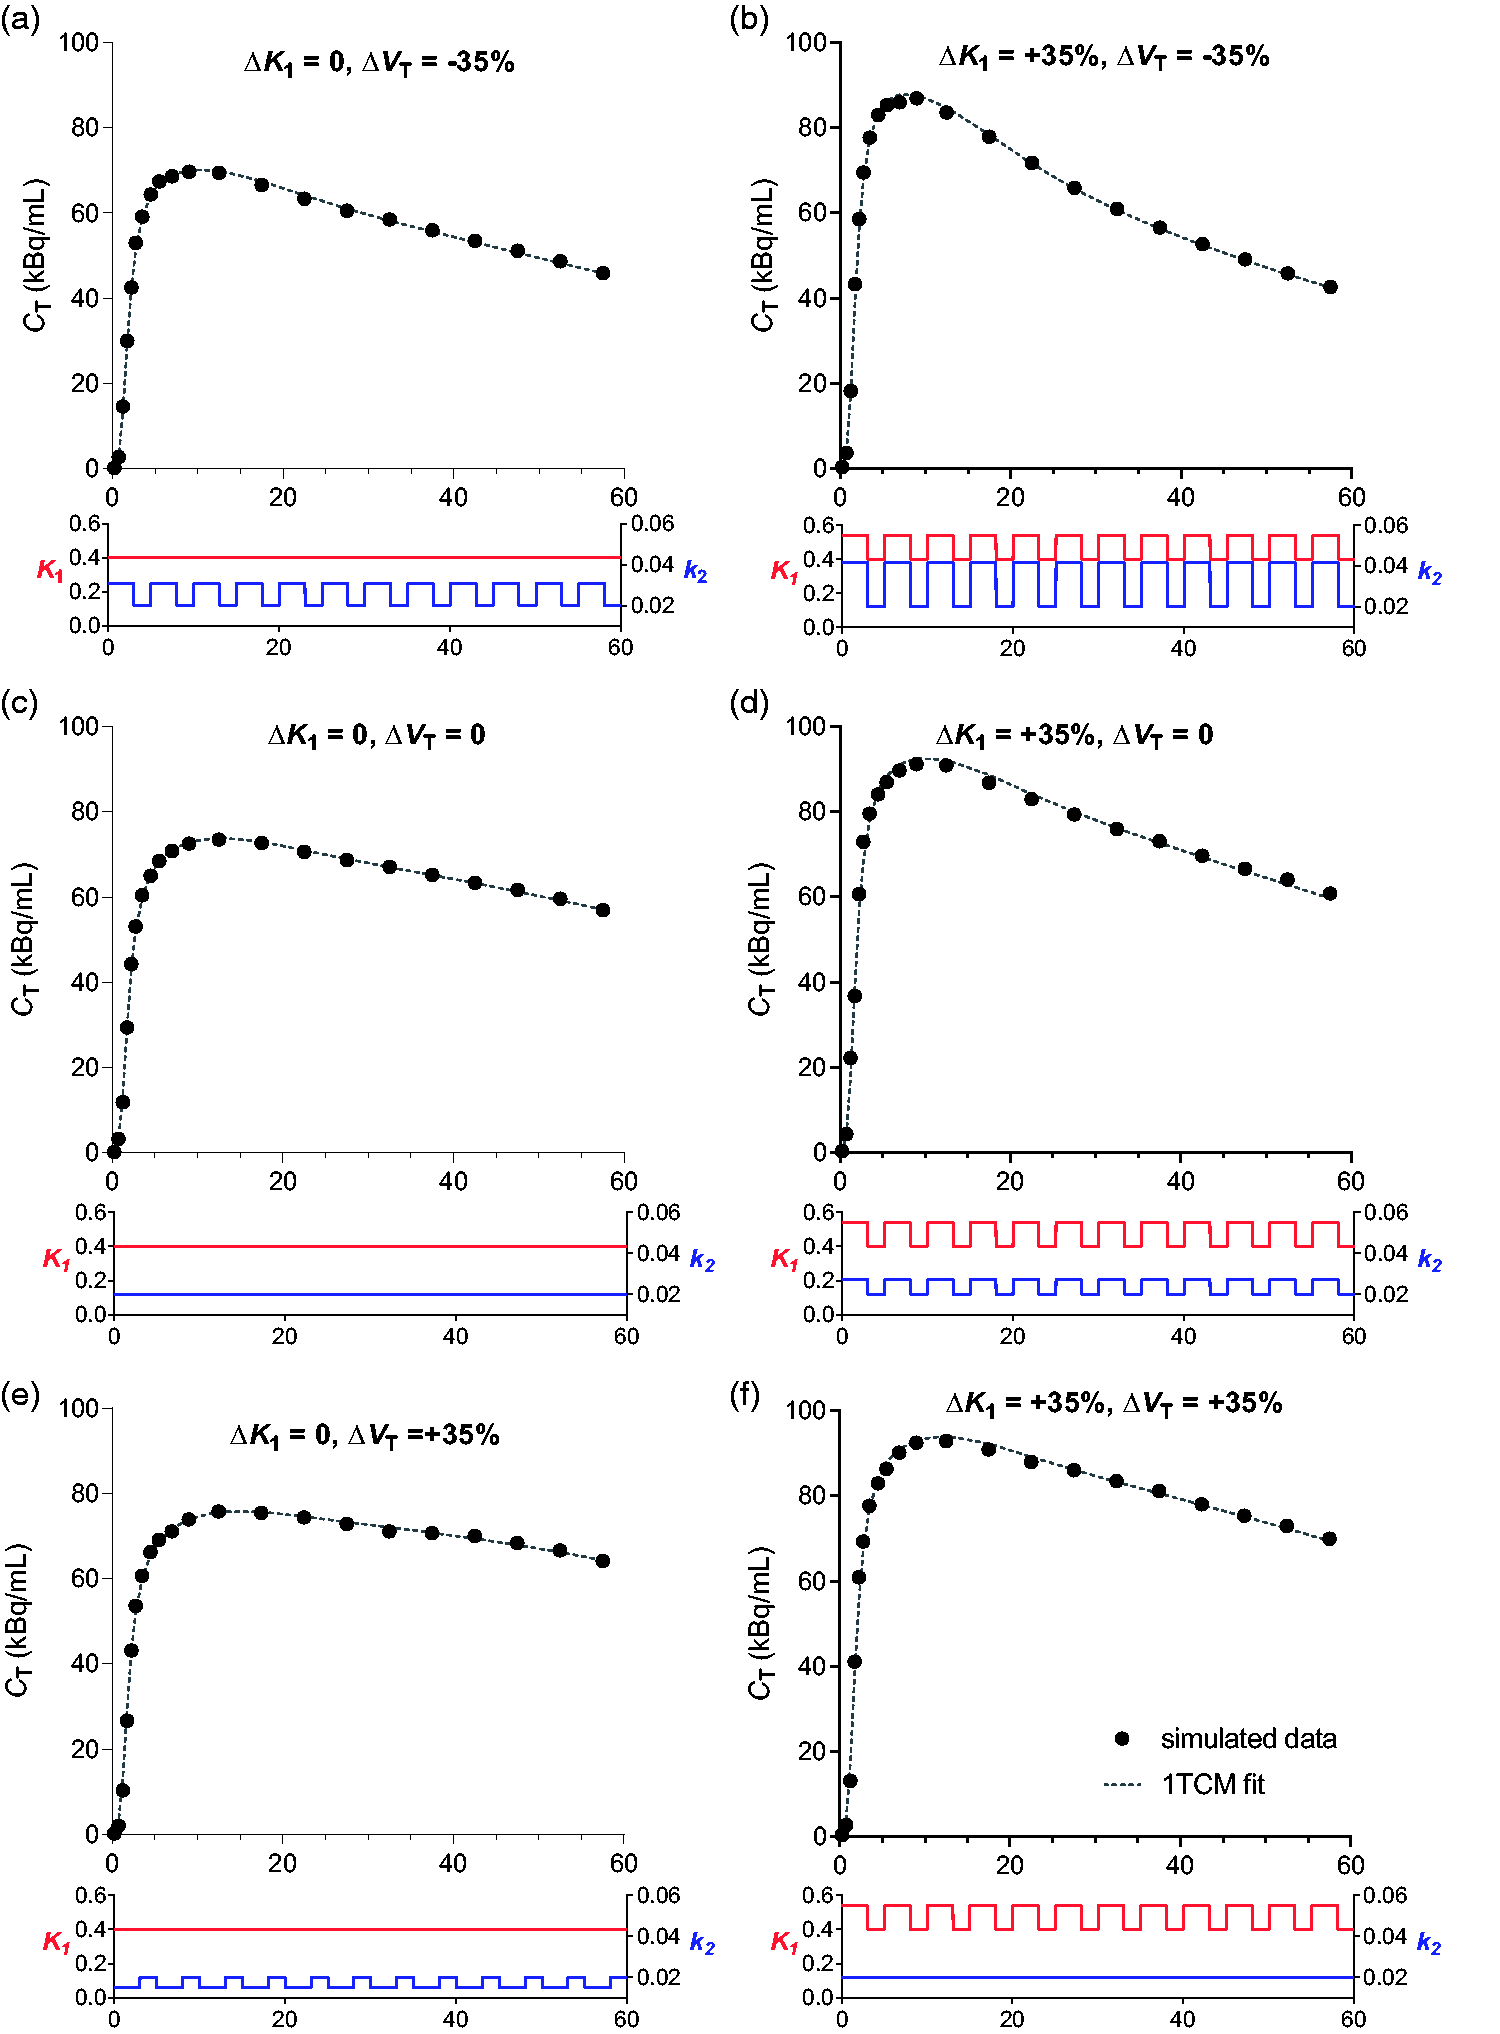
Simulated [11C]UCB-J time-activity curves with intermittent changes in K1 and k2 rate constants, as shown on the bottom of each graph. a,c,e, constant K1; b,d,f, K1 increase of 35% during stimulation blocks; a,b, −35% change in VT (K1/k2); c,d no change in VT; e,f, +35% change in VT during stimulation blocks.
K1 values in activation scans were well-quantified with <2% error relative to the K1 during the stimulation periods (K1,stim) in most cases (Figure 2, left panel). For example, in the condition where ΔK1 = +35% (K1,stim = 0.54 mL·cm−3·min−1) and ΔVT = −50% (marked with an asterisk in Figure 2), estimated K1 (
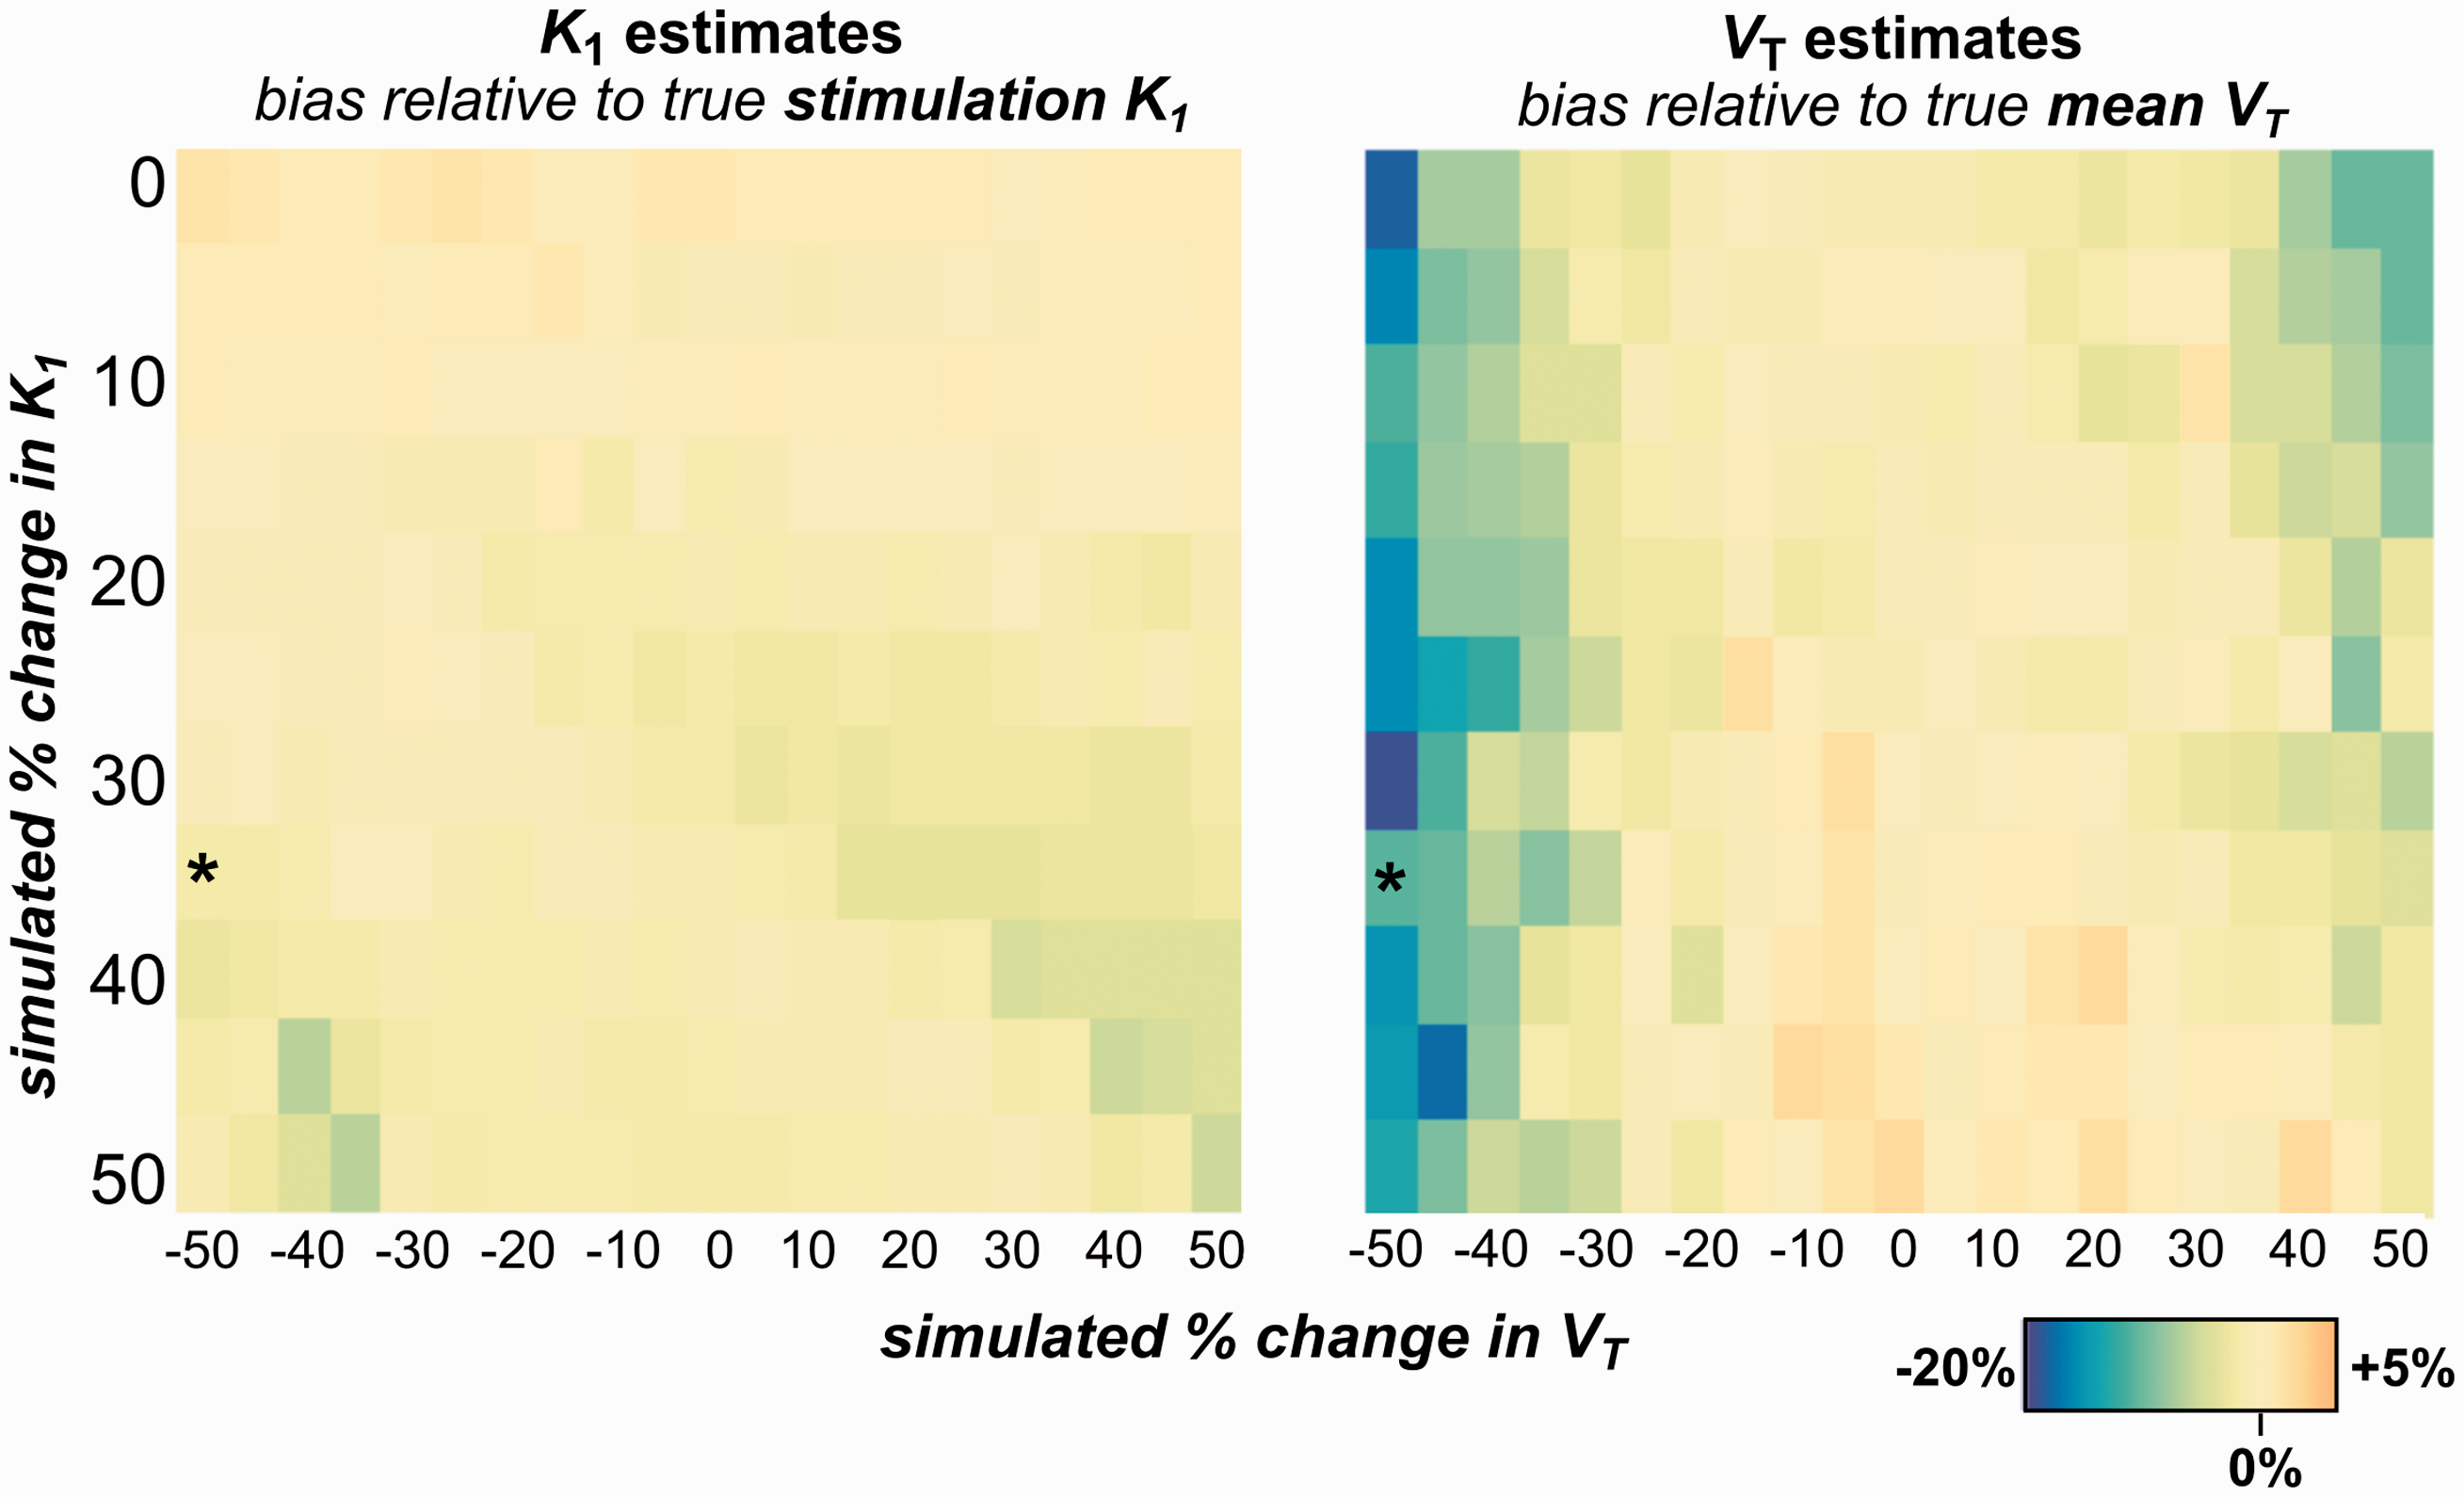
Estimates of K1 and VT from 1TCM using simulated TACs with intermittent changes in K1 and k2 (VT=K1/k2). Color bar value is percent bias in parameter estimate relative to value during stimulation (for K1) or scan mean value (for VT):
VT was misestimated relative to the value during the stimulation periods with error of up to 25%, meaning that
Overall, the simulations suggest that model estimates of K1 should accurately quantify change during the stimulation periods, while VT values will reflect or slightly underestimate the mean VT across the whole scan period. Results were similar when TACs were simulated with response to habituating visual stimulation. In this case, VT values again closely approximated the mean across scan time (<7% error relative to mean values across scan duration) and K1 values were similar to true values during stimulation periods with slightly larger error (<9%). Thus, with intermittently varying uptake and binding characteristics in tissue using a 3-min on, 2-min off visual stimulation paradigm, 1TCM modeling will be sufficient to detect changes in mean VT greater than 10–15% and to quantify even small changes in K1.
Experimental results
fMRI
Checkerboard visual stimulation increased fMRI BOLD signal in the occipital cortex (peak MNI coordinates x = −26, y = −74, z = −20; cluster size 4497 voxels; peak T = 16.3, pFWE < 0.001; Figure 3(a)) as well as in the right and left lateral geniculate nucleus (LGN) of the thalamus (x = 22, y = −18, z = −2; 181 voxels; peak T = 14.9, pFWE = 0.001; x = −12, y = −26, z = 0; 262 voxels; peak T = 14.8, pFWE < 0.001). Figure 3(b) and (c) show time courses of the BOLD signal within V1 during short (6 × 30 s) and long (3 × 180 s) stimulation periods. Average percent signal change was 2.11% ± 0.79% during the 30-s blocks, consistent with changes of 1–3% reported in previous studies using similar visual stimuli. 35 , 36 Percent change during the 180-s blocks was 0.91% ± 0.31%, reflecting a slight decrease in the response after an initial peak within the longer blocks (Figure 3(c)). Change from baseline appeared to be sustained across blocks in both cases, suggesting that habituation of the BOLD response was minimal within these 6- and 15-min scans.
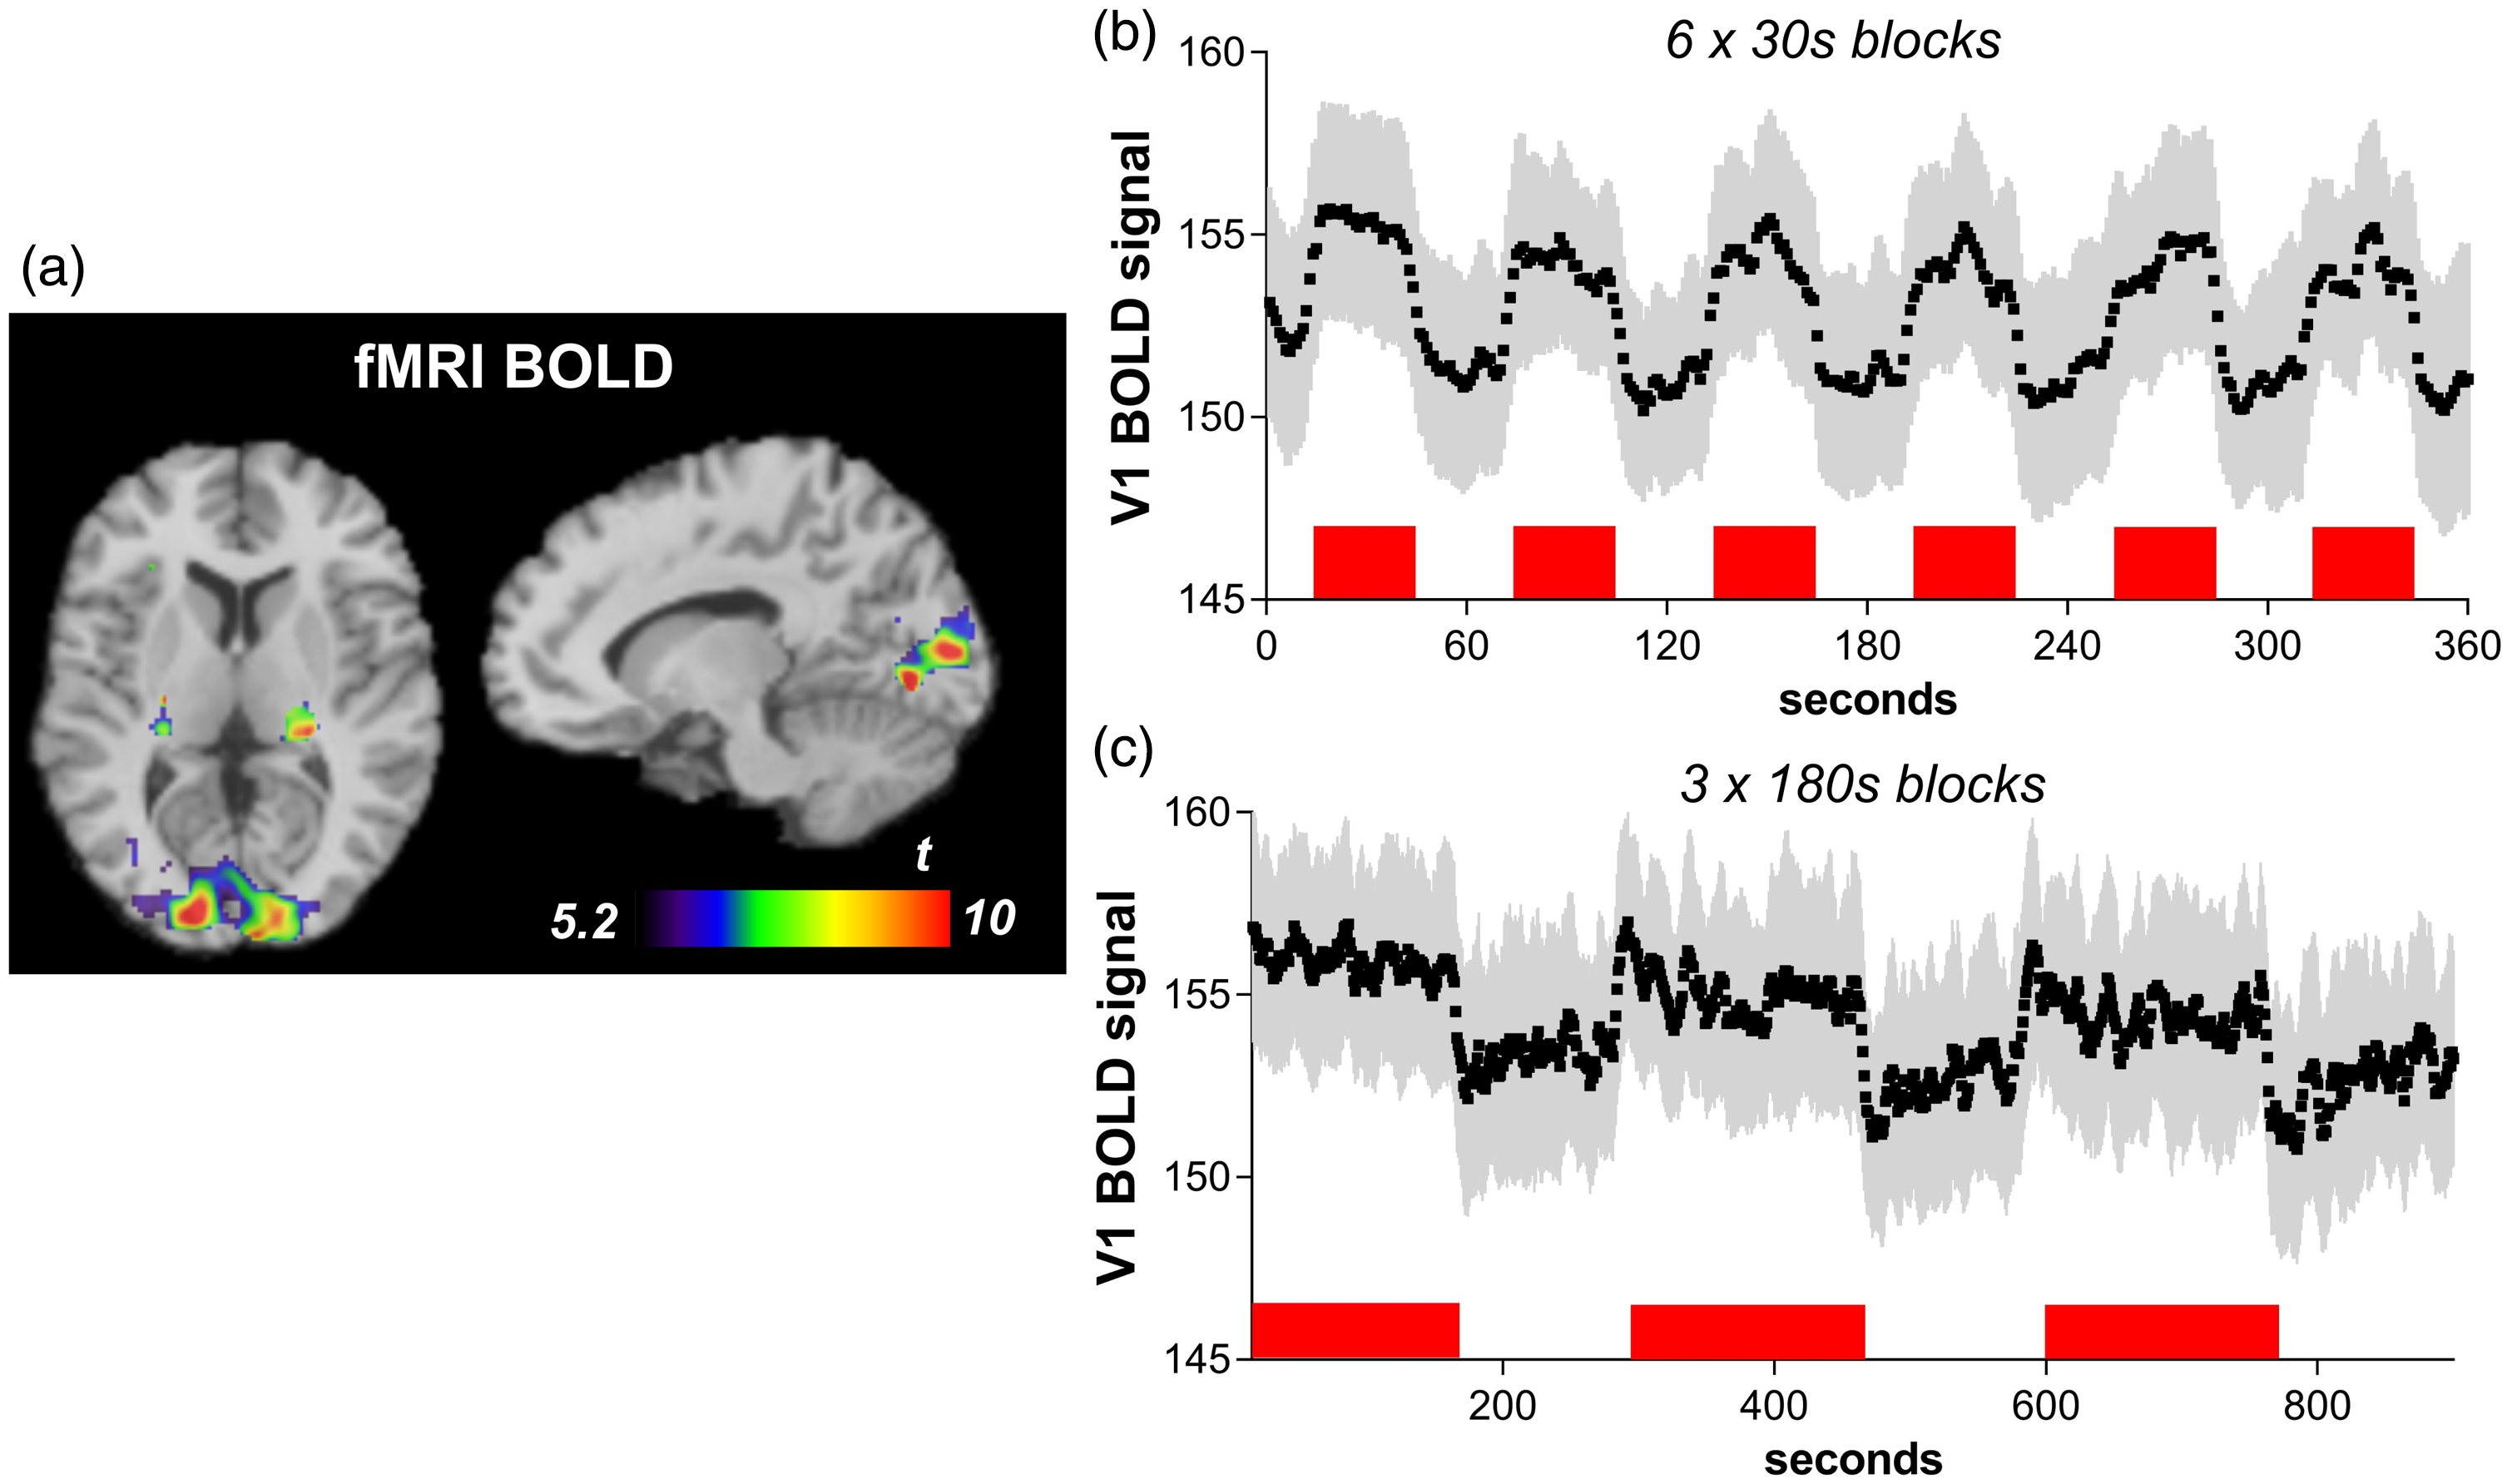
fMRI BOLD response to visual stimulation. (a) Increase in BOLD signal during 30-s stimulation blocks compared to rest (pFWE<0.05) in occipital cortex and lateral geniculate nucleus. (b–c) Time course of BOLD signal (mean ± SD) within V1 for 30-s (b) and 180-s (c) stimulation periods, shown in red.
PET
There were no differences between the baseline and activation scans in injected dose (baseline 649 ± 90.2 MBq, activation 660 ± 114 MBq, p = 0.85) or injected mass (baseline 18.9 ± 10.2 ng/kg, activation 22.3 ± 12.7 ng/kg, p = 0.59).
K 1
Visual stimulation induced a robust increase in K1 in the visual cortex relative to baseline (baseline, 0.34 ± 0.055 mL·cm−3·min−1; activation, 0.46 ± 0.078 mL·cm−3·min−1; region × scan type interaction, F1,12 = 35.6, p < 0.001; post hoc paired t-test in V1, t = 5.92, Bonferroni-adjusted p = 0.0083), with no change in the temporal cortex or centrum semiovale (temporal cortex t = 1.19, adjusted p = 1.0, centrum semiovale t = 1.79, adjusted p = 0.98) (Figure 4(a) and (d)). Mean K1 change was 34.3% ± 15.4% (95% CI [20.5,48.1%]) in V1, compared to −2.25% ± 5.91% (95% CI [−7.53,3.03%]) in the temporal cortex and −3.9% ± 5.99% (95% CI [−9.24,1.45%]) in the centrum semiovale. Exploratory analyses showed that in addition to V1, a K1 increase of smaller magnitude was detected in V2 (17.6% ± 10.9%, p = 0.0058), but not in visual areas 3–5, in the occipital grey matter as a whole, nor in the frontal cortex (Table 1). Whole-brain analysis confirmed the specificity of this difference, with a single cluster in the medial occipital cortex showing higher K1 in activation compared to baseline scans (peak MNI coordinates x = −11, y = −98, z = −2; cluster size 2161 voxels; peak T = 10.3, pFWE < 0.001; Figure 5(a)). There were no other clusters of significant change in K1 at pFWE < 0.05. Magnitude of difference was not affected by the order of scans (mean increase during activation when baseline scan was performed first, 33.1% ± 15.4%; activation first, 35.2% ± 15.1%). Across subjects, K1 change in V1 was correlated with change in fMRI BOLD signal during visual stimulation (r = 0.77, p = 0.043; Figure 5(b)).
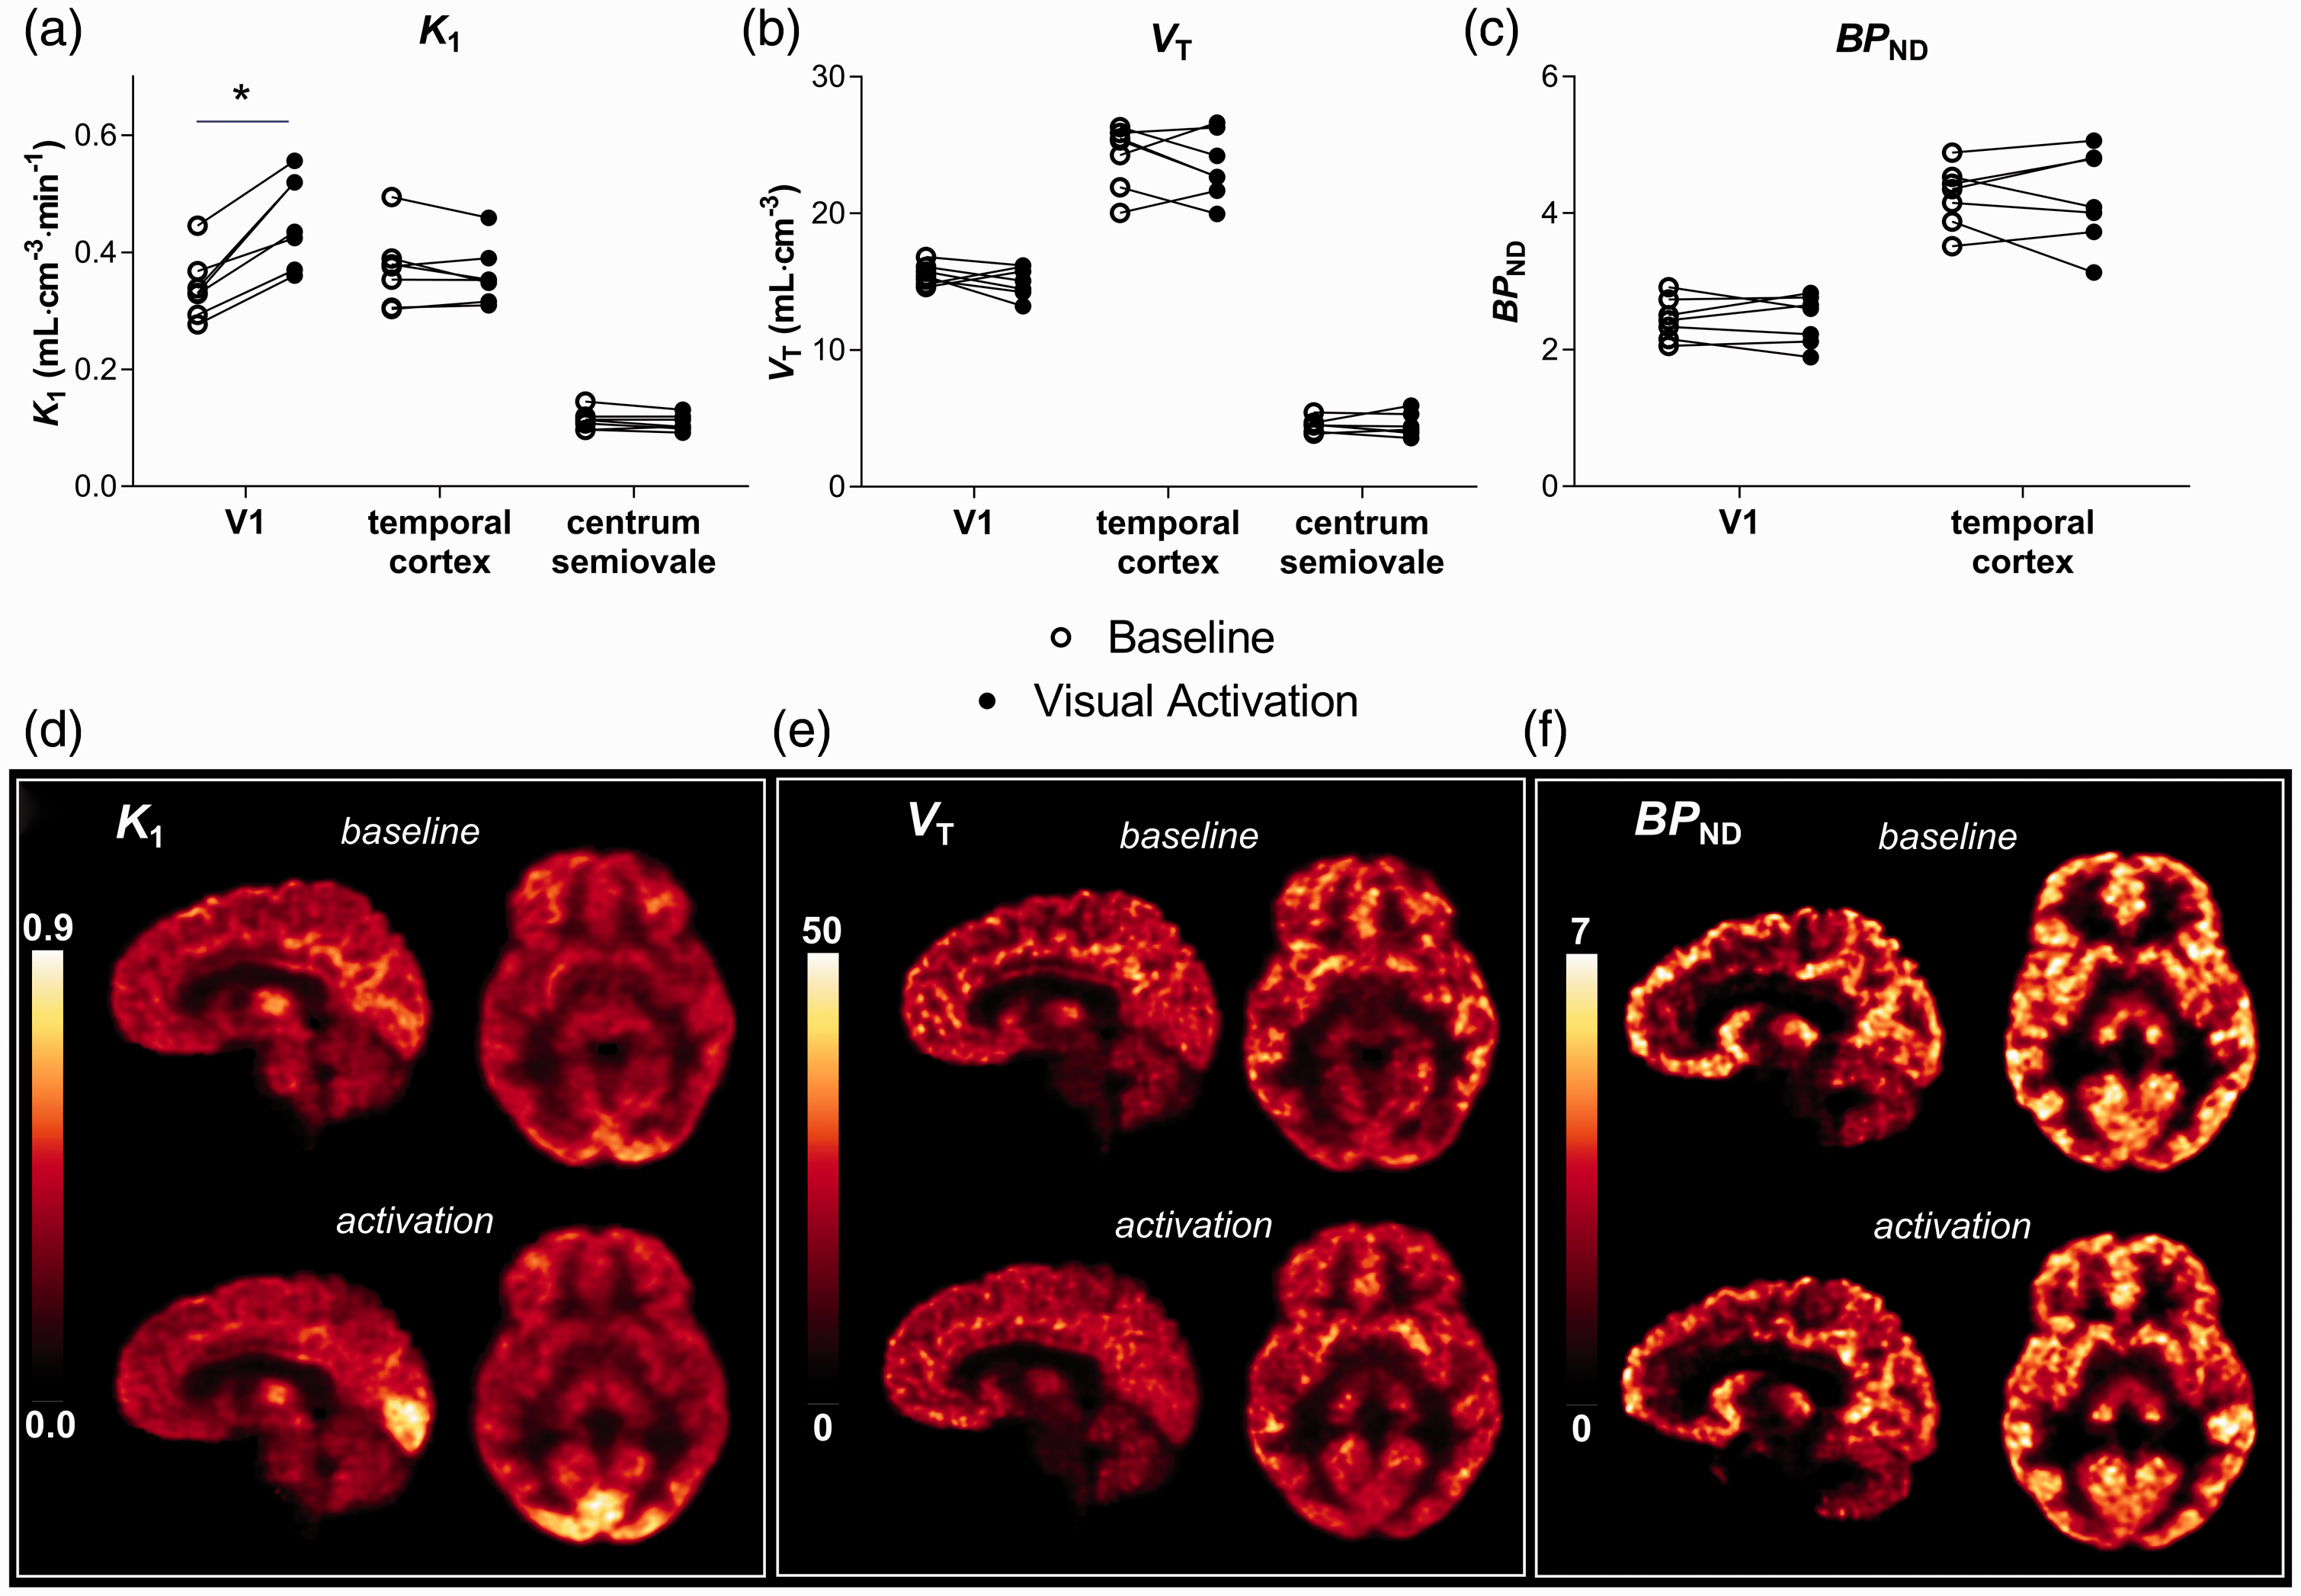
[11C]UCB-J tissue delivery and binding during visual stimulation. (a–c) K1 (a) was increased, while VT (b) and BPND (c) were unchanged in primary visual cortex during visual stimulation relative to a baseline scan. Values in temporal cortex and centrum semiovale were unchanged.*p = 0.008. (d–f) Parametric images of K1 (d), VT (e), and BPND (f) during baseline and visual activation scans in a representative subject (V1 ΔK1 = 32%).
Regional changes in K1, VT and BPND during visual activation.
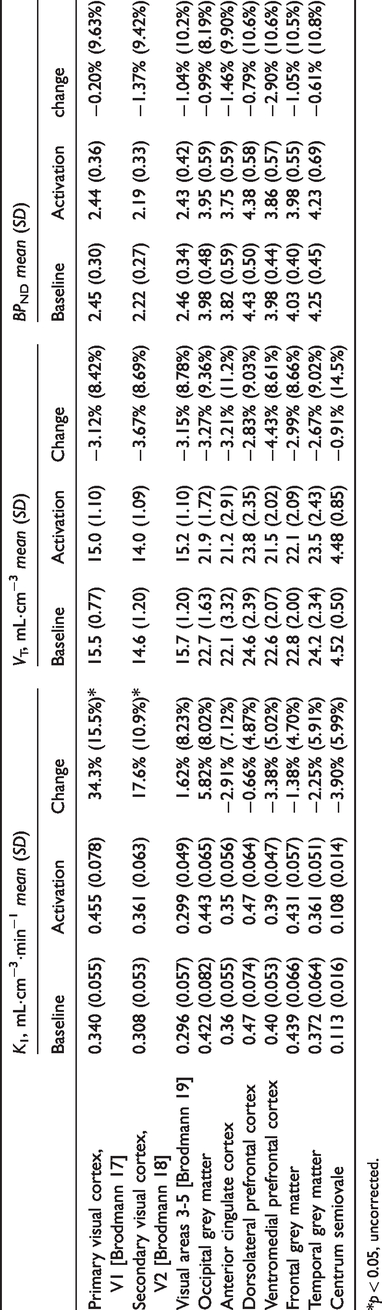
*p < 0.05, uncorrected.
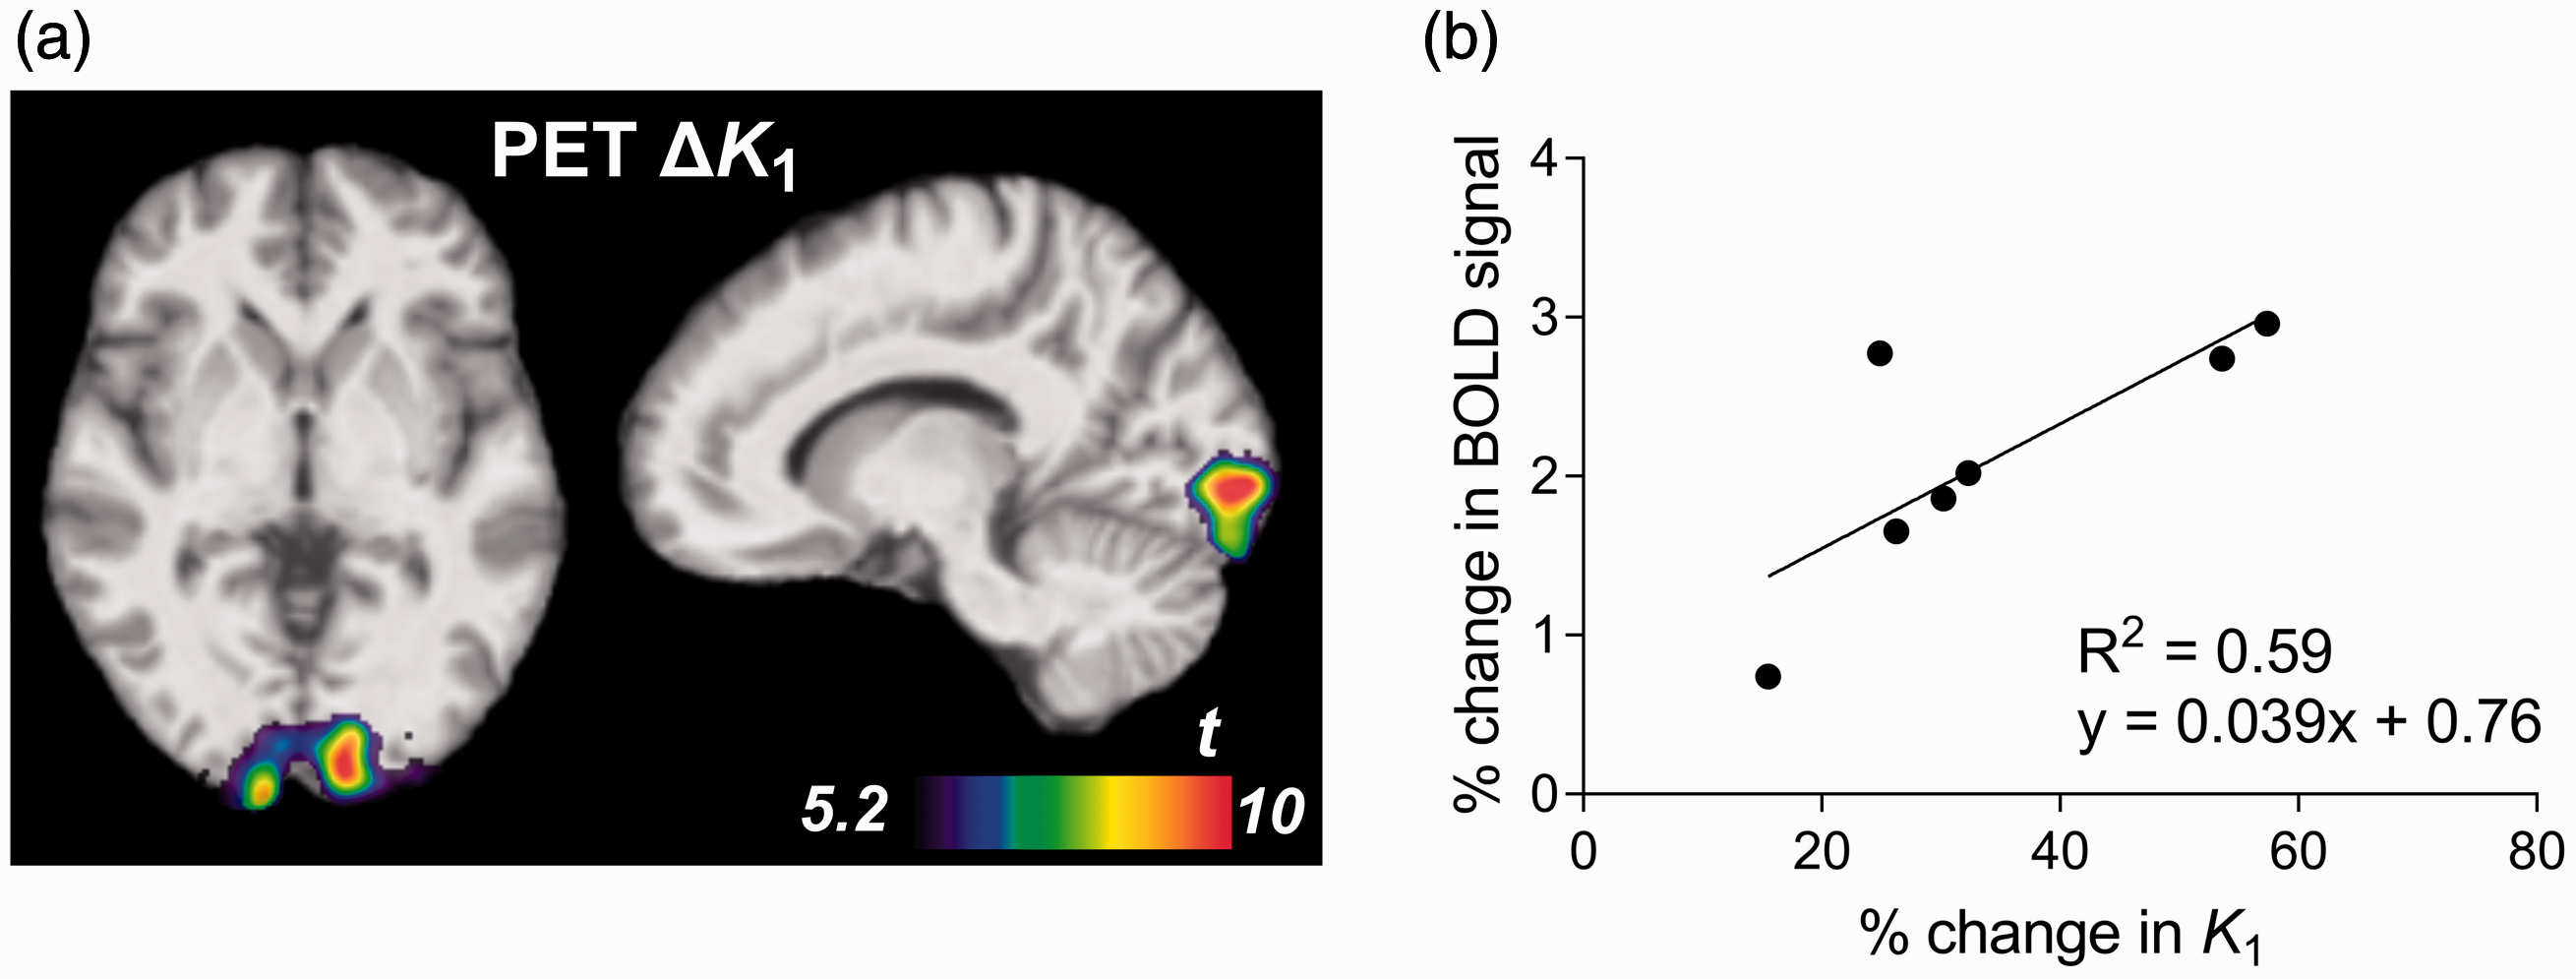
Change in [11C]UCB-J K1 during visual activation. (a) cluster of significant increase in K1 during visual stimulation scan relative to baseline (x = −11, z = −2; peak T = 10.3, cluster-level pFWE < 0.001). (b) change in fMRI BOLD signal during visual stimulation is correlated with change in K1 across subjects (r = 0.77, p = 0.043).
Binding measures
VT did not differ between baseline and activation scans in the primary ROIs (scan type, F1,18 = 1.69, p = 0.21, region, F2,18 = 364.2, p < 0.0001, region × scan type interaction F2,18 = 0.39, p = 0.69; Figure 4(b) and (e)). In V1, mean difference in VT from baseline to activation was −3.12% ± 8.42% (95% CI [−10.6,4.41%]). Corresponding values were −2.67 ± 9.02% (95% CI [−10.7,5.39%]) in the temporal cortex and −0.91% ± 14.5% (95% CI [−13.9,12.0%]) in the centrum semiovale. Similarly, there was no change in BPND from baseline to activation (scan type, F1,12 = 0.017, p = 0.90, region, F1,12 = 57.9, p < 0.0001, region × scan type interaction F1,12 = 0.0037, p = 0.95; Figure 4(c) and (f)). Mean BPND change in V1 was −0.20% ± 9.63% (95% CI [−8.81,8.41%]) and in the temporal cortex was −0.61% ± 10.8% (95% CI [−10.3,9.08%]). There were no regions with significant change in VT or BPND in the exploratory ROIs (uncorrected ps > 0.19; Table 1) and no regions of significant change in whole-brain analyses. Results were similar when BPND was determined using blood data and the 1TCM with VT in the centrum semiovale taken as an estimate of VND (change in V1, −2.20% ± 10.3%). There was no relationship between percent change in K1 within V1 and change in VT (r = −0.23, p = 0.62) or BPND (r = 0.42, p = 0.35) across subjects.
Discussion
This study assessed binding stability of the SV2A radiotracer [11C]UCB-J under conditions of elevated neuronal activity. Despite robust, regionally specific increases in tracer delivery to the primary visual cortex during the presentation of a visual stimulus, there was no apparent change in total or specific binding of [11C]UCB-J in this or any other brain region. This suggests that [11C]UCB-J VT and BPND are stable markers of synaptic density and thus unlikely to be sensitive to differences in brain state or activity level during PET scans.
Mean increase in [11C]UCB-J K1 within brain region V1 (Brodmann area 17) was 34% (range 15–57%). Simulations confirmed that K1 estimates are likely to be an accurate measure of the magnitude of tracer influx changes during the stimulation periods. More specifically, K1 changes are determined primarily by activation early in the scan (here, the first 1–2 stimulation periods), in line with prior [15O]water PET studies of cerebral blood flow. 37 Changes in radiotracer influx, as measured by K1, are directly related to changes in blood flow but will underestimate the magnitude of these due to finite extraction of the tracer. 38 , 39 Average increase in blood flow within V1 was therefore >34%, suggesting that blood flow increase in this study was larger than the approximately 25–35% increase in cerebral blood flow within V1 previously seen using checkerboard visual stimulation with [15O]water PET. 22 , 36 This likely reflects the reduced influence of partial volume effects with the improved scanner resolution in this study. 40 K1 changes observed in the present study were also in line with previous PET studies assessing receptor binding or enzyme activity during visual activation, 20 , 41 which found mean K1 increases of 20–40% in the occipital cortex when participants were shown videos during scans. The high contrast checkerboard stimulation used here activates neurons in V1 and V2 most strongly, while neurons in higher visual association areas are primarily responsive to other attributes such as color, motion, and depth.42–45 Accordingly, change in K1 was specific to the primary visual cortex, with a smaller but significant increase in the secondary visual cortex, <2% change in other visual association areas, and no significant change in the occipital cortex as a whole. A similar spatial pattern was present in the fMRI experiment, with the cluster of activated voxels extending into V2 (Figure 3), but with a smaller magnitude of change in that region (1.4% ± 0.57% compared to 2.1% ± 0.79% in V1).
Change in fMRI BOLD signal during visual activation within V1 was in line with previous studies using checkerboard visual stimulation. 24 , 35 , 36 In addition to activation in the visual cortex, BOLD signal increased in LGN (Figure 2(a)), an upstream relay nucleus for visual information. 46 , 47 Given this effect, we assessed PET K1 changes within the cluster of activated LGN voxels identified at the group level in the MR study. There was no significant change in K1 in this region (baseline, 0.26 ± 0.040 mL·cm−3·min−1; activation, 0.27 ± 0.045 mL·cm−3·min−1; p = 0.23), possibly due to the small magnitude of this effect (0.24% ± 0.074% increase in BOLD signal) and the high proportion of white matter in this region. Within V1, however, changes in K1 and fMRI BOLD signal were correlated across subjects (Figure 5(b)). This suggests that a substantial portion of the hemodynamic response to visual stimulation (either physiological or behavioral) was consistent within subjects even across sessions conducted on separate days and under different conditions, and underlines that K1 changes are closely related to conventional measures of brain activation.
Increases in cerebral blood flow and fMRI BOLD signals are correlated with synaptic activity, 48 reflecting the increased energy demands of vesicle-mediated neurotransmission. Previous studies have demonstrated that measures of specific binding from neuroreceptor-targeting radiotracers using kinetic modeling outcome measures are not sensitive to changes in blood flow. 19 , 20 , 48 Here, it was hypothesized that the nature of the SV2A target would lead to changes in binding parameters due to specific changes in tracer-target interactions. Contrary to this prediction, there was no significant change in VT or BPND during activation scans in the visual cortex or elsewhere in the brain, and the mean differences between baseline and stimulus conditions were very small. Quantification of SV2A binding availability in vivo with [11C]UCB-J shows high correlation with post-mortem measurements of protein density in vitro in non-human primates. 1 The findings presented here, in which VT and BPND values are unchanged despite strong increases in neuronal activation, are consistent with these results and imply that [11C]UCB-J binding provides a direct measure of protein density in vivo, with minimal influence of dynamic processes related to protein function or local environment.
Consistent with previous work exploring time-varying system kinetics, 34 model-derived VT estimates approximated a time-weighted average of VT across scan time, and we therefore conclude that average VT in the activation scan was unchanged relative to baseline. We note that sensitivity to change was therefore inherently lower for VT compared to K1, which closely tracked flow changes during the stimulation periods, and lower still for VT increases rather than decreases. Dose used in simulations (472 MBq) was within the range of scans performed here and average RSS for the 1TCM fits across conditions was similar, suggesting that noise levels were comparable. Sensitivity in the experimental study was therefore likely to be limited to VT changes greater than 10–15%. Based on the approximately linear relationship between estimated and true percent change values, the 95% confidence interval for changes in VT observed in the experimental data, −10% to +4%, may encompass changes in VT during stimulation periods of approximately −18% to +8%. It is possible that small changes in VT occurred that could not be detected in the present study. However, the lack of consistent direction in VT change across subjects and the similar magnitude and direction of change in unaffected brain regions suggest that this is unlikely to be the case. Absolute change of VT in V1 was 8.2 ± 3.6%, comparable to the absolute test–retest variability of 3–9% across the brain, 27 with similar results for BPND.
Altogether, results from the present study suggest that binding properties of [11C]UCB-J are not affected by increased vesicle release despite the crucial functional role of SV2A in these processes. There are several possible explanations for this. It may be the case that despite apparent interactions with other proteins or with Ca2+, the radiotracer binding site remains unaffected during vesicle trafficking and exocytosis. Alternately, studies in several model systems suggest that approximately 80–90% of vesicles are not actively recycled during stimulation and comprise instead a reserve pool whose physiological function and recruitment mechanisms are not yet well understood. 12 , 49 , 50 If vesicles involved in the release cycle are a small proportion of total SV2A-expressing vesicles, overall binding may not be measurably affected even if binding site availability is altered during these processes. It is also possible that binding changes may occur that were not captured by this study. There is some evidence that SV2A expression at excitatory and inhibitory terminals varies by brain region or developmental stage 51 or that the release mechanisms involving SV2A differ between glutamatergic and gamma-aminobutyric acid (GABA)-releasing neurons. 14 If this is the case, SV2A binding behavior (to radiotracer or other relevant proteins) could conceivably vary across neurochemical systems. Neuronal transmission activated by visual stimulation is largely but not entirely glutamatergic,52–54 with evidence for elevated release of GABA and modulatory transmitters including acetylcholine as well.55–57 We do not rule out the possibility that stimuli activating different systems or circuits could alter [11C]UCB-J binding properties. However, given the robust stimulus, ubiquity of SV2A expression across the brain, 6 and highly conserved nature of vesicle release machinery overall, 10 , 11 we conclude that [11C]UCB-J binding is unlikely to be strongly influenced by physiological variation in brain activity.
[11C]UCB-J has demonstrated utility in the assessment of a range of neurological 2 , 4 , 33 and psychiatric 3 , 5 conditions. The present data provide support for a promising advantage of the radiotracer in clinical and research applications, in that they suggest that comparisons between clinical groups or time points will not be confounded by differences in brain state at the time of scan. This is a notable distinction from [18F]FDG, which provides a measure of cerebral metabolic rate of glucose (CMRGlc) and can identify regional impairments in brain activity. [18F]FDG is used to diagnose and track progression of Alzheimer’s disease and other neurological conditions. 58 This is despite its parallel use in applications assessing brain activation, specifically exploiting its sensitivity to transient neural responses. [18F]FDG measurements of CMRGlc are sensitive to sensory stimulation at the time of scan, including the stimulus type used here, 21 , 59 among other physiological and technical factors. 60 , 61 Studies have reported intrasubject variability of up to 25% in test–retest comparisons even in healthy people scanned at close points in time under well-controlled research conditions. 62 As a result, [18F]FDG PET requires careful control of scanning conditions (for example, patient fasting) and its sensitivity is limited to detect only relatively large changes or group differences, approximately 25% or greater. 62 In contrast, our present results and previous test–retest data with [11C]UCB-J PET suggest that changes in synaptic density as small as 10% can be identified, which could allow for the detection of earlier or subtler disease effects. The data presented here support the assertion that in vivo [11C]UCB-J binding can be interpreted as a static measure of SV2A protein density with negligible influence of variability in brain function.
The large, consistent, and highly specific changes in K1, in addition to their correlation with fMRI BOLD signals, indicate that this measure reliably tracked acute brain activation. This raises the possibility that [11C]UCB-J K1 estimates could be leveraged as an index of local neural activity. This is particularly interesting in light of our initial observations that patients with Alzheimer’s disease show a regional pattern of K1 deficits relative to controls that is remarkably similar to the pattern of CMRGlc deficits characteristic of Alzheimer’s disease in [18F]FDG scans. 2 The present results suggest that [11C]UCB-J PET could conceivably provide a dynamic measure of local brain activity (K1) concurrent with a stable measure of synaptic density (VT) – that is, combined molecular and functional information in a single PET scan. A similar strategy has been proposed for the β-amyloid radiotracer [11C]PIB, where blood flow measures derived from kinetic modeling are correlated with [18F]FDG uptake in Alzheimer’s disease. 63 Further research is necessary to explore the application of [11C]UCB-J K1 values as an outcome measure in relation to acute or chronic impairments in brain function.
In summary, binding parameters of the SV2A-targeting radiotracer [11C]UCB-J were unaffected by a robust visual activation stimulus in healthy volunteers. Changes in [11C]UCB-J K1 closely tracked fMRI BOLD measures of brain activation, but VT and BPND within the visual cortex were unchanged. These results demonstrate that [11C]UCB-J PET provides a stable and reliable in vivo measure of synaptic density.
Supplemental Material
sj-pdf-1-jcb-10.1177_0271678X20946198 - Supplemental material for Binding of the synaptic vesicle radiotracer [11C]UCB-J is unchanged during functional brain activation using a visual stimulation task
Supplemental material, sj-pdf-1-jcb-10.1177_0271678X20946198 for Binding of the synaptic vesicle radiotracer [11C]UCB-J is unchanged during functional brain activation using a visual stimulation task by Kelly Smart, Heather Liu, David Matuskey, Ming-Kai Chen, Kristen Torres, Nabeel Nabulsi, David Labaree, Jim Ropchan, Ansel T Hillmer, Yiyun Huang and Richard E Carson in Journal of Cerebral Blood Flow & Metabolism
Footnotes
Funding
The author(s) disclosed receipt of the following financial support for the research, authorship, and/or publication of this article: This work was supported by NINDS R01NS094253 and NIAAA K01 AA024788.
Declaration of conflicting interests
The author(s) declared no potential conflicts of interest with respect to the research, authorship, and/or publication of this article.
Authors’ contributions
KS designed the study, analyzed data, and drafted the manuscript. HL performed data analysis. DM and M-KC carried out medical screening and supervision. KT oversaw participant recruitment and scanning. NN, DL, and JR performed PET experiments. ATH designed the study and assisted with interpretation of findings. YH designed and performed PET experiments. REC conceived and designed the study. All authors critically revised the manuscript.
Supplemental material
Supplemental material for this article is available online.
References
Supplementary Material
Please find the following supplemental material available below.
For Open Access articles published under a Creative Commons License, all supplemental material carries the same license as the article it is associated with.
For non-Open Access articles published, all supplemental material carries a non-exclusive license, and permission requests for re-use of supplemental material or any part of supplemental material shall be sent directly to the copyright owner as specified in the copyright notice associated with the article.