



Abstract

PP01-M01
A novel ligand “deschloroclozapine” selectively visualizes and activates chemogenetic receptors in non-human primates
1Functional Brain Imaging, National Institute of Radiological Sciences, National Institutes for Quantum and Radiological Science and Technology, Japan
2Department Pharmacology, University of North Carolina at Chapel Hill School of Medicine, USA
3Mount Sinai Center for Therapeutics Discovery, Departments of Pharmacological Sciences and Oncological Sciences, Tisch Cancer Institute, Icahn School of Medicine at Mount Sinai, USA
Abstract
Objectives
Designer Receptors Exclusively Activated by Designer Drug (DREADDs) is one of the chemogenetic technologies that afford a means to selectively and remotely control the activity of neuronal population expressing “designer receptor” by systemic delivery of the biologically inert compound. Muscarinic-based designer receptors, hM3Dq (excitatory) and hM4Di (inhibitory), can be activated by clozapine-N-oxide (CNO), are most widely used. DREADDs can be applicable for larger and discontinuous brain tissues, which non-human primate studies demand. For the application of DREADD to monkey study, it is desirable to monitor the DREADD expression in vivo. In addition, CNO has modest brain permeability and can be metabolized to clozapine, which is also a potent DREADD agonist. Since clozapine possesses activity at sites for numerous endogenous receptors, the CNO administration could be associated with off-target actions. In this study, we demonstrated that a novel ligand, deschloroclozapine (DCZ), served a dual purpose in chemogenetics: (1) as a selective compound for visualization of DREADD expression in vivo by positron emission tomography (PET) imaging and (2) as a selective agonist for muscarinic-based DREADDs.
Methods and Results
In vitro inhibition binding assay with 3H-QNB revealed that DCZ is a high DREADD selective ligand; it exhibited high affinity to hM3Dq and hM4Di (6.3 and 4.2 nM, respectively: comparable to clozapine and 100-fold stronger than CNO), while it had moderate or low affinities (>50 nM) for a large number of endogenous receptors. It was confirmed by 11C-DCZ with PET in monkeys; significant uptake of 11C-DCZ was specifically found in DREADD expressing regions, while uptakes in non-DREADD expression regions were small. Agonist efficacy of DCZ was examined by electrophysiological recording in a monkey received a hM3Dq-vector injection. After systemic DCZ administration, but not a vehicle, neuronal activity in the hM3Dq-positive area was rapidly and significantly increased, whereas the activity in the area outside hM3Dq-positive sites did not change. A pharmacokinetic study revealed that any major significant metabolites of DCZ were not detected in the plasma and CSF after DCZ administration.
Conclusions
These results indicate that (1) 11C-DCZ is a suitable and sensitive PET ligand for visualization of DREADD expression and (2) DCZ is a metabolically stable, extremely potent, highly brain-penetrable, and selective agonist for DREADDs, the combination of which provides clear benefits for non-human primates chemogenetics and future therapeutic applications.
PP01-M02
[89Zr]-Deferoxamine-EPO can target Erythropoietin receptors in human and rat stroke tissue
1Department of Preclinical Imaging and Radiopharmacy, Werner Siemens Imaging Center, Eberhard Karls University of Tuebingen, Germany
2Department of Neurology & Stroke, and Hertie Institute for Clinical Brain Research, Eberhard Karls University of Tuebingen, Germany
3Division of Neuropathology, Eberhard Karls University of Tuebingen, Germany
4Department of Nuclear Medicine and Clinical Molecular Imaging, Eberhard Karls University of Tuebingen, Germany
Abstract
Objectives
Ischemic stroke is caused by a sudden occlusion of an arterial segment. Previous studies have shown that Erythropoietin (EPO) has neuroprotective effects through neurogenesis, inhibition of apoptosis and induction of angiogenesis.1 Furthermore, EPO and EPO receptor (EPOr) expression are directly upregulated by hypoxia inducible factor in different tissues including brain and kidney. EPOr can therefore be predictive of a tissue’s response to hypoxia. In this study, we evaluated EPOr expression in human and rat stroke tissues using [89Zr]-Deferoxamine (DFO)-EPO.
Methods
To evaluate in vivo EPO binding in stroke tissue, middle cerebral artery occlusion stroke surgery (n = 9) or sham surgery (n = 7) was performed on rats. 3 h after stroke induction rats were injected with [89Zr]-DFO-EPO intravenously and scanned using PET-MRI 24, 48 and 72 h after injection.
Ex vivo binding experiments using autoradiography (AR) were performed using acute ischemic stroke tissue sections of humans and rats. Brain sections were incubated with 4.28 nM of [89Zr]-DFO-EPO for 60 min. On separate sections, blocking was performed using 1.3 µM of nonradioactive EPO. After washing, sections were dried and exposed to AR plates for 24 h and read-out using a phosphorimager at 50 µm resolution.
Additionally, serum stability tests in rat and human blood were performed and analyzed by instant thin layer chromatography. [89Zr]-Dfo-EPO was titrated into human and rat serum, respectively (50:50) and incubated at 37°C. Radiochemical purity was measured at seven different time points up to 168 h.
Results
In vivo, a significant accumulation of [89Zr]-DFO-EPO was detected starting at 24 h after occlusion in stroke areas of rats in comparison to contralateral hemispheres (p < 0.01) and to sham animals (p < 0.01). A significant accumulation followed at 48 and 72 h in comparison to contralateral hemispheres (p < 0.01) and sham (p < 0.01).
Ex vivo data showed specific binding to stroke regions in human samples (64.5 ± 18.9 fmol of [89Zr]-DFO-EPO per mg of tissue). A significantly lower binding (14.1 ± 4.0 fmol per mg of tissue, p < 0.01) was detected in blocked human stroke tissue. Moreover, a significantly increased binding was found in stroke areas in contrast to background and non-stroke brain tissue (p < 0.01) in humans. Consistent with these results, stroke regions in rats also showed significantly higher specific binding in contrast to non-stroke tissues.
The integrity of the [89Zr]-DFO-EPO was maintained in serum for a period of one week. Radiochemical purity after 0 h was 95.4% for human and 96.6% for rat serum. The purity decreased slightly over time and reached 89.0% for human and 88.1% for rat serum after 168 h incubation time.
Conclusion
In this study we could show for the first time that [89Zr]-DFO-EPO binds specifically to human stroke tissue. In addition, the radiotracer remains stable in serum for a period of one week, allowing a reliable in vivo evaluation of the stroke area in longitudinal studies. Together, this data demonstrates [89Zr]-DFO-EPO’s potential to evaluate tissue response to hypoxia.2
References
PP01-M03
Evaluation of [18F]FL2-b for detecting TDP-43 aggregates in amyotrophic lateral sclerosis
1Department of Medicinal Chemistry, University of Michigan
2Department of Radiology, University of Michigan
Abstract
Objectives
Physiological transition metals (Cu2+, Zn2+, and Fe3+) accumulate abnormally in the brain in neurodegenerative diseases (NDs), leading to the formation of metal-protein aggregates.1,2 Such complexes are the target of the radiotracer [11C]L2-b and its analogue [18F]FL2-b, which have been shown to interact with Cu2+-Aß aggregates.3 Previously, we have reported an improved synthesis and preclinical evaluation of [18F]FL2-b, showing good brain uptake and high binding potential in disease tissue over control.4 Autoradiography demonstrated that the binding potential in amyotrophic lateral sclerosis (ALS) motor cortex is 4.28 whereas in Lewy body dementia (DLB) it is 9.21. ALS and DLB are associated with iron accumulation, thus suggesting that [18F]FL2-b is general to metal-protein aggregates.3,5 It is the objective of this study to visually identify localization of [18F]FL2-b to other metal-protein aggregates such as TDP-43 through the use of autoradiography and immunohistochemical (IHC) staining.
Methods
ALS post-mortem brain sections obtained from the University of Michigan Brain Bank were sliced into 20 μ thick sections and fixed to histological slides. The samples were incubated with Anti-Human TDP-43/TARDP monoclonal mouse IgG2A antibody overnight at 4°C. After washing steps, the tissue was stained using a secondary antibody anti-mouse HRP conjugate and its substrate 3,3'-diaminobenzidine (DAB). Histological slides were visualized under a light microscope so that markers could be placed at locations corresponding to TDP-43.
Results
Overlaying of the TDP-43 IHC stain and the previously obtained autoradiograph image produced by [18F]FL2-b (same brain section) confirmed colocalization of the tracer to cells containing TDP-43 aggregates specific to the gray matter of the motor cortex (

Conclusions
With the ability to bind multiple metal-protein aggregates with varying binding potentials, it may be useful to use [18F]FL2-b as a radiotracer to differentiate NDs. In addition to imaging amyloid in Alzheimer’s disease and DLB, [18F]FL2-b represents a scaffold for potential development of a PET radiotracer for imaging metal-TDP-43 aggregates in ALS.
References
PP01-M04
Evaluation of radiobromine-labeled (SS)-BPBM for imaging of the brain norepinephrine transporter
1Biomedical Imaging Research Center, University of Fukui, Japan
2Dept. of Human and Artificial Intelligent Systems, University of Fukui, Japan
Abstract
Objectives
Abnormality of the brain norepinephrine transporter (NET) has been reported in several psychiatric and neuronal disorders. The NET is one of the important targets for the diagnosis of these disorders. Several PET probes for imaging brain NETs have been developed, but these have some disadvantages. Therefore, we synthesized a radiobromine-labeled reboxetine analogue, (S,S)-2-(α-(2-bromophenoxy)benzyl)morpholine ((SS)-BPBM) and evaluated its potential as a PET probe for brain NET imaging.
Methods
In this study, Br-77 was used in place of Br-76. Br-77 was produced via a 77Se(p, n)77Br reaction. The synthesis of no-carrier-added (SS)-[77Br]BPBM was carried out by an iodine-radiobromine exchange reaction. In vitro binding assays, in vivo biodistribution experiments, and ex vivo autoradiographic imaging studies were performed.
Results
The radiochemical yield of (SS)-[77Br]BPBM was approximately 45% and the radiochemical purity was greater than 99%. In vitro binding assays showed that the affinity of (SS)-BPBM to the NET was similar to that of the well-known NET binding agents, nisoxetine and desipramine. The biodistribution studies in rats showed a high accumulation in the brain (0.78%dose/g tissue at 5 min) with a fast washout (0.18%dose/g tissue at 3 hr post injection) and rapid clearance from the blood. In the ex vivo autoradiography, the regional cerebral distribution of (SS)-[77Br]BPBM significantly correlated with the reported NET density (r = 0.99). Administration of nisoxetine decreased the accumulation of (SS)-[77Br]BPBM in all brain regions except for the striatum. However, administration of dopamine and serotonin transporter binding agents caused no significant changes in the accumulation of (SS)-[77Br]BPBM in all brain regions. These results showed the accumulation of (SS)-[77Br]BPBM was NET specific in the brain.
Conclusion
Radiobromine-labeled (SS)-BPBM is a potential imaging agent for the brain NET.
PP01-M05
Extended pharmacokinetic evaluation of [18F]MK6240 for quantification of tau neurofibrillary tangles in human subjects
1Massachusetts General Hospital, Harvard Medical School, USA
2Pitié-Salpêtrière Hospital, Sorbonne University, France
Abstract
Objectives
[18F]MK6240 is a promising PET tracer with subnanomolar-affinity for neurofibrillary tangles (NFT) which are implicated in Alzheimer’s disease (AD). In this work, we extended previous in-human investigations of pharmacokinetic modeling strategies for in-vivo quantification of NFT.
Methods
Thirty-five participants underwent dynamic [18F]MK6240 PET scans for up to 135 min. Of those subjects, 18 were controls, 11 had mild cognitive impairment (MCI) and 6 were probable AD subjects. In a subset of 16 subjects (8 controls, 6 MCIs and 2 ADs), arterial blood sampling was performed to measure [18F]MK6240 concentration in whole blood and plasma. A subset of those plasma samples was selected for radiometabolite analysis using a column-switching radio-HPLC. Plasma free fraction (PFF) measurements were also performed in triplicate on a sample drawn prior to tracer injection. Reconstructed images were aligned to a stereotaxic template for delineation of volumes of interest and extraction of time activity curves (TACs). Blood-based kinetic analysis with compartmental models as well as Logan and multilinear analysis (MA1) graphical methods were performed. Simplified reference tissue methods such as Logan distribution volume ratio (DVR), multilinear reference tissue method (MRTM2) and static SUV ratio (SUVR) were investigated using the cerebellum as a reference region. DVR and SUVR parametric imaging of [18F]MK6240 were computed using the different methods for comparison and for evaluation of off-target binding.
Results
Whole-blood:plasma ratio reached a plateau at 15 min post injection (0.66 ± 0.01, range: 0.56–0.81). PFF was 0.18 ± 0.05 across all subjects and was similar between CTRL and MCI/AD groups. [18F]MK6240 was metabolized quickly with only 6.1 ± 2.3% attributable to the parent compound at 90 min. [18F]MK6240 in gray matter peaked quickly in the brain (SUV > 2 at ∼3 minutes) and was followed by fast washout in controls. In contrast, MCI/AD subjects demonstrated important inter-region as well as inter-subject heterogeneity in brain uptake. According to the Akaike information criterion, preferred compartmental model was a reversible two-tissue model with the blood contribution included as a model parameter (2Tv). VT in gray matter of controls ranged from 3.3–6.9 mL.cm−3 whereas MCI/AD subjects showed a wide dynamic rangewith a highest regional VTof 53.9 mL.cm−3. VT correlated strongly with BPND (R2 = 0.90) and only very weakly with VND (R2 = 0.03). DVR outcomes from simplified reference tissue methods were highly correlated with DVR obtained from the blood-based methods but showed an underestimation for DVR > 3. Parametric images demonstrated comparable features across quantification methods and off-target binding concordant with previous studies.

Conclusions
[18F]MK6240 shows a wide range of uptake across subjects and has favorable kinetic properties for quantification of NFT. More studies in subjects with high [18F]MK6240 binding will help to fully understand the relationship between SUVR and blood-based DVR outcomes for DVR > 3.
Acknowledgments
NIH R01AG046396, S10OD018035, P41EB022544, and T32EB005876
PP01-M06
A PET study with [18F]MNI-792 to determine cholesterol 24S-hydroxylase occupancy of TAK-935 in healthy subjects
1Takeda Pharmaceuticals International, Inc., Cambridge, MA, USA
2InviCRO, New Haven, CT, USA
Abstract
Objectives
The primary objective of this Phase-1 study was to determine brain cholesterol 24S-hydroxylase (CH24H) enzyme occupancy (EO) after single oral dosing of the CH24H inhibitor TAK-935 in healthy subjects using positron emission tomography (PET) and the specific CH24H ligand [18F]MNI-792. Secondary objectives were to describe the kinetics of TAK-935 in the brain; 24S-hydroxycholesterol (24HC) concentration in plasma after administration of TAK-935; and the relationship between plasma concentration of TAK-935 and CH24H EO.
Methods
Eleven subjects received single, oral doses of 50–600 mg TAK-935. Each subject underwent 3 dynamic PET scans using the CH24H ligand [18F]MNI-792 to assess brain CH24H EO of TAK-935. Serial 3D PET images were acquired on a Siemens ECAT EXACT HR+ camera. After a baseline scan, the 2nd scan occurred at approximately the time of TAK-935 Tmax. The 3rd PET scan was performed at either 10 or 24 hours post-TAK-935 dosing. A brain MRI was performed to delineate anatomical regions of interest (ROI). Brain CH24H EO was assessed as a function of TAK-935 plasma concentration, using displacement of [18F]MNI-792 in the putamen and other high uptake ROI, obtained from nondisplaceable binding potential (BPND) or by graphical analysis according to a global occupancy plot using total distribution volumes (VT). Blood samples were collected to measure concentrations of TAK-935, its metabolite M-I, and 24HC in plasma.
Results
After TAK-935 administration, plasma TAK-935 and M-I concentrations were quantifiable in all subjects during the 2nd PET scan and increased with TAK-935 dose. A trend of decreased plasma 24HC concentrations with time was observed. A total of 33 [18F]MNI-792 PET scans were performed (Baseline, and post-TAK-935 dosing on Day 1 and Day 2 in 11 subjects; for the first 2 subjects dosed at 600 mg, the second post-dose scan was done 10 hours post-dose). VT values were estimated in multiple brain regions with Logan graphical analysis (LGA) at baseline and for both post-TAK-935 dose scans. For the second post-dose scan where blood samples for tracer kinetic analyses were not collected, the arterial input function was built from baseline and first post-dose scan input functions. The global TAK-935 EO as a weighted average of regional occupancies ranged from 64 to 96% at 2-hours post-dose, and from 11–79% at 24 hours post-dose. The relationship between TAK-935 concentration and brain EO was best characterized by a sigmoidal Emax model using an effect-site compartment whereby the estimated 50% of maximal effect (EC50) value was 5.52 ng/mL.
Conclusions
We used the CH24H specific PET ligand [18F]MNI-792 to demonstrate that single, oral doses of 50–600 mg TAK-935 were centrally penetrant, and led to specific CH24H EO in a dose- and time-dependent manner. The relationship between CH24H brain EO and TAK-935 concentration was established, and will guide dose selection for further clinical trials with TAK-935. Plasma concentrations of TAK-935 and its primary metabolite M-I increased with TAK-935 dose. A trend of decreased plasma 24HC concentrations with time post-TAK-935 dosing was observed across the TAK-935 dose range evaluated.
PP01-M07
Formulation of 11C-labeled (R,S)-isoproterenol and pharmacokinetic studies in rats
1Department of Clinical and Experimental Neuroimaging, Center for Development of Advanced Medicine for Dementia, National Center for Geriatrics and Gerontology, Aichi, Japan
2United Graduate School of Drug Discovery and Medical Information Sciences, Gifu University, Gifu, Japan
3Department of Chemistry and Biomolecular Science, Faculty of Engineering, Gifu University, Gifu, Japan
Abstract
Objectives
(R,S)-Isoproterenol inhibits the formation of toxic granular tau oligomer preceding neurofibrillary tangles leading to neuronal loss, resulting in cognitive impairment1, and therefore, it has the potential for therapy against Alzheimer’s disease.
We here improved the synthesis of highly qualified 11C-labeled isoproterenol with an aim to elucidate its behavior in the human brain. We conducted 11C-labeled isoproterenol PET studies in small animals with radio-metabolites analysis.
Methods
Optimization of synthesis of 11C-labeled (R,S)-isoproterenol was conducted based on continuous two-pot reactions via the initial synthesis of [2-11C]acetone in the first vial and, then a reductive alkylation of (R,S)-norepinephrine with transferred [2-11C]acetone in the second vial. Then, the resulting 11C-isoproterenol radiotracer was submitted for animal PET studies.
Results
We found optimized conditions, particularly by accelerating reductive alkylation of (R,S)-norepinephrine with [2-11C]acetone through extensive comparison of the reactions between non-radioactive and radioactive reaction systems, yielding efficient synthesis of 11C-labeled (R,S)-isoproterenol by the use of benzoic acid as acid addend (pKa = 4.20).
HPLC purification using a cation exchange column and pharmaceutical formulation with tartaric acid to stabilize the radiotracer gave highly qualified 11C-labeled (R,S)-isoproterenol. Molar activity was enhanced by the following improvements (achieved molar activity: 99.5 GBq/μmol); (1) Pretreatment (neutralization) of (R,S)-norepinephrine hydrochloride was conducted in the presence of benzoic acid and DMSO; (2) NaBH(OAc)3 was added just prior to the end of bombardment to prevent the decomposition of the reducing agent with acid; (3) HPLC separation conditions was adjusted to shorten the retention time of (R,S)-isoproterenol. Our formulated tracer has a sufficiently high molar activity even after 20-minte quality testing (50 GBq/μmol), and therefore, a PET clinical study dosage of 185 MBq 11C-labeled (R,S)-isoproterenol (equivalent to 0.78 μg isoproterenol dose) would be expected to show only a slight, if any, pharmacologica response, because a bolus infusion of 0.5 μg isoproterenol in healthy individuals increases their heart rate by 3 beats per minute with an awareness of cardiac sensations2. In addition, we here improved the chemical purity of the formulation up to 71% by adjusting HPLC separation conditions (Figure.1).
Dynamic PET scans for healthy male Wistar rats revealed a fast peak (0.6 SUV) just after administration and a quick washout thereafter of the radioactivity from the brain. In the plasma, unmetabolized 11C-labeled isoproterenol rapidly disappeared in a few minutes. The total distribution volume in the whole brain was 3.6 ml/cm3 estimated by the Logan graphical analysis. The concentration ratio of isoproterenol in the brain to that in plasma at equilibrium might be smaller than 3.6, since a metabolized 11C-labeled isoproterenol was detected in the brain at 5 minutes after injection.
Conclusions
The highly-qualified formulation of 11C-labeled (R,S)-isoproterenol has been achieved in this study. Preclinical PET studies showed the penetration of isoproterenol into the rat brain, warranting human-PET studies with this radiotracer.
References
PP01-M08
Radioligands for tropomyosin receptor kinase (TRK) positron emission tomography
1McConnell Brain Imaging Centre, Montreal Neurological Institute, McGill University, 3801 University Street, Montreal, Quebec H3A 2B4, Canada
2Jewish General Hospital, Lady Davis Institute, Montreal, QC HT3 1E2, Canada
3Department of Oncology, Division of Oncological Imaging, University of Alberta, Edmonton, Alberta T6G 2R3, Canada
4Department of Nuclear Medicine, Ludwig-Maximilians-University of Munich, Marchioninistrasse 15, Munich 81377, Germany
5Division of Nuclear Medicine, Department of Radiology, The University of Michigan Medical School, Ann Arbor, MI, 48109, USA
Abstract
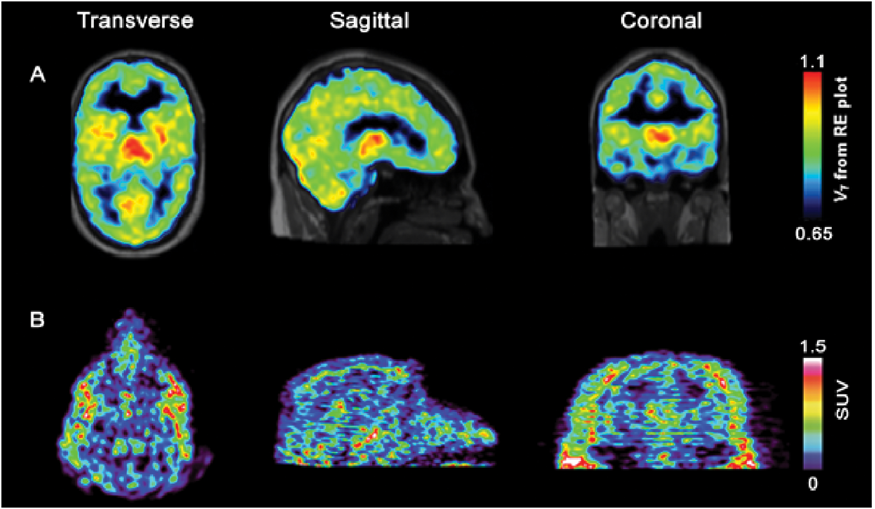
Tropomyosin receptor kinases TrkA/B/C family supports neuronal growth, survival and differentiation during development, adult life and ageing. Downregulation of TrkA/B/C is a prominent hallmark of numerous neurological disorders including Alzheimer disease (AD). Abnormally expressed or overexpressed full length or fusion TrkA/B/C proteins which bear oncogenic potential and were shown to drive tumorigenesis in a variety of neurogenic and nonneurogenic human cancers are currently the focus of intensive clinical research. The study, both in oncology and neurology, of the spatiotemporal alterations in TrkA/B/C expression and density or the determination of target engagement of emerging antineoplastic kinase inhibitor drugs with those receptors in normal and diseased tissue is crucially needed but has however remained largely unexplored due to the lack of suitable non-destructive analytic tools. Multi-species validation of carbon-11- and fluorine-18-labeled positron emission tomography (PET) radiotracers based on purposely designed small molecule kinase catalytic domain-binding inhibitors of TrkA/B/C were developed. It was demonstrated that pan-Trk selective inhibitor scaffolds which target both the active DFGin and inactive DFG-out kinase conformations can be rationally modified to yield suitable compounds for translation into PET radiotracers. In particular, the carbon-11 isotopologue of the preclinical 4-aza-2oxindole lead GW441756 was characterized as the first brain penetrant Trk radiotracer based on rodent PET experiments in vivo. It was demonstrated that impediments associated with the development of orthosteric tracers for intracellular in vivo neuroimaging of protein kinases can be addressed via thorough structure-activity relationship (SAR) screening such as generating a lead suitable for human use. From the screening of an imidazo[1,2-b]pyridazine-based pan-Trk inhibitors library, followed by the in vivo assessment of multiple radiotracers from this series, the detailed evaluation of [11C]-(R)-IPMICF16 as the first TrkB/C-targeted lead radiotracer with suitable properties for neuroimaging in human was provided. The evaluation included PET imaging studies in four species from mice to first-in-human as well as Trk kinase inhibitor target engagement confirmation using the phase II clinical inhibitor entrectinib in mice. Relying on extensive human kinome analyses, it was shown that (R)-IPMICF16 constituted both the most potent and most selective TrkB/C inhibitor known to date. It was furthermore demonstrated that this lead efficiently enables the discrimination of AD versus healthy control brains based on hippocampal binding in human in vitro. Finally, current work in the second generation optimization of the [11C]-(R)-IPMICF16 clinical lead is described. It is shown that a state-of-art copper mediated 18F-fluorination technique can be used to secure the inactivated 18F-arene moiety of our new lead tracer, [18F]TRACK. A first in human PET study was performed most recently. The Trk-targeted probes delineated here represent a novel class of molecular imaging radiotracers for the non-invasive and in-depth interrogation study of signal transduction at the interface of oncology and neurology.
PP01-M09
In vitro evaluation of small molecule compounds as potential PET tracers targeting α-synuclein
1Werner Siemens Imaging Center, Department of Preclinical Imaging and Radiopharmacy, Eberhard Karls Universitaet Tuebingen, Germany
2Max Planck Institute for Biophysical Chemistry, Goettingen, Germany
3Center for Neuropathology and Prion Research, Ludwig-Maximilians-University, Munich, Germany
4MODAG GmbH, Munich, Germany
Abstract
Objectives
Imaging α-synuclein (αSYN) pathology to distinguish synucleinopathies from other neurodegenerative disorders is challenging and relevant PET tracers are still missing. In our previous studies, we identified one compound, showing a very high affinity towards recombinant αSYN fibrils and good selectivity over amyloid beta (Aß1-42) and tau46 fibrils. Although it showed favorable in vivo kinetics with fast washout from the brain after C-11 labeling, we identified one lipophilic metabolite in the brain, which was the demethylated form of the parent compound, confounding the in vivo quantification. This metabolite was tritiated and also screened for its in vitro affinity towards αSYN fibrils as well as its selectivity over Aß1-42 and tau46 fibrils.
Material & Methods
Saturation binding assays were performed using recombinant human αSYN fibrils, Aß1-42 fibrils and tau46 fibrils. Fibrils were incubated with decreasing concentrations (24 nM–0.02 nM) of the tritiated metabolite to obtain total binding. Non-specific binding was measured using an excess of the cold compound. After vacuum filtration and washing, liquid scintillation counting was performed. Kd-values were calculated using non-linear regression.
Results
Our parent compound showed high affinity to pure αSYN fibrils (Kd < 4 nM) and moderate affinities towards tau46 (Kd < 10 nM) and Aß1-42 fibrils (Kd < 11 nM). In comparison, the metabolite showed a high affinity towards αSYN fibrils (Kd < 5 nM), only a moderate affinity towards tau46 fibrils (Kd < 24 nM) and a low affinity towards Aß1-42 fibrils (Kd < 70 nM).
Conclusion
In our in vitro binding assay, we determined the affinity and selectivity of our identified metabolite and compared it to the parent compound. It showed a similarly good affinity towards αSYN fibrils and a more favorable selectivity over tau46 fibrils and Aß1-42 fibrils. In further experiments, we will evaluate the specificity and selectivity of both compounds in human brain tissue with confirmed αSYN, Aß and tau pathology.
PP01-M10
Head-to-head comparison of 11C-PBR28 and 11C-ER176 for quantification of the translocator protein in the human brain
1Nantz National Alzheimer Center and Houston Methodist Neurological Institute, and Weill Cornell Medicine
2Department of Neuroimaging, Institute of Psychiatry, Psychology and Neuroscience, King’s College London
Abstract
11C-ER176 is a recent TSPO tracer with promising imaging characteristics, such as an excellent time-stability and the ability to image low-affinity binders thanks to its high specific binding. The aim of this study was to perform a head-to-head comparison between 11C-ER176 and the widely used 11C-PBR28.
Methods
Five healthy volunteers had a 90-minute PET scan and metabolite-corrected arterial input function with 11C-PBR28 in the morning and 11C-ER176 in the afternoon. Brain images were segmented with the Hammers’ probabilistic atlas. Binding was quantified at the regional level in terms of VT with a two-tissue compartmental model and at the voxel level in terms of impulse response function at 90 minutes with spectral analysis.
Results
11C-ER176 was more stable in arterial blood than 11C-PBR28 (the percentages of unmetabolized parent in plasma at 30 minutes were 54.7 ± 11.6% and 22.5 ± 10.0%, and at 90 minutes were 30.2 ± 9.8% and 8.6 ± 3.6%, respectively). The coefficient of variation (%COV) of the area under the parent curve, expressed in SUV, was higher for 11C-PBR28 than for 11C-ER176 (37.5% vs 21.3%). Similarly, the %COV of the area under the whole brain curve was higher with 11C-PBR28 (16.5% vs. 9.0%). The brain time-activity curves for both tracers were well fitted by the two-tissue model, but 11C-ER176 had higher VT values than 11C-PBR28 (5.74 ± 1.54 vs. 4.43 ± 1.99 mL/cm3), which suggests a higher specific binding. Similarly, voxel-wise SPM analysis showed a widespread higher binding with 11C-ER176.
Conclusion
11C-ER176 displays a smaller variability in the measurements in both plasma and brain and a higher binding potential. Thanks to these characteristics, clinical studies performed with 11C-ER176 are expected to have higher statistical power, so that fewer subjects can be used to find the same effect size.
PP01-N01
Visualization of MAGL in ischemia rat brain using PET probe 11C-SAR127303
1Department of Radiopharmaceuticals Development, National Institute of Radiological Sciences, National Institutes for Quantum and Radiological Science and Technology, Japan
Abstract
Objectives
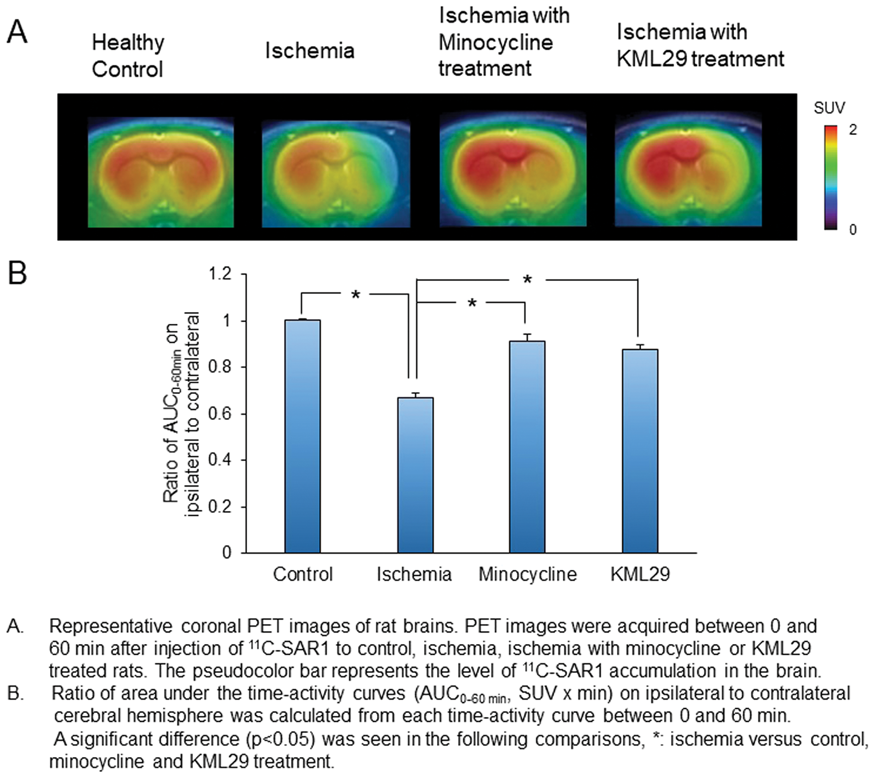
Monoacylglycerol lipase (MAGL) is a serine hydrolase that hydrolyzes the endocannabinoid 2-arachidonoylglycerol (2-AG) to arachidonic acid (AA) and glycerol in central nervous system. AA is the primary source for the synthesis of eicosanoid that are related to pro-inflammatory effects inducing neurotoxicity. 2-AG exhibits neuroprotective and anti-inflammatory properties. MAGL plays an important role for controlling levels of 2-AG and AA. Inhibition of MAGL causes a suppression of AA production and may control the neuroinflammation. We developed the PET probe 11C-SAR127303 (11C-SAR1) for MAGL and have reported its valuable imaging ability that high radioactivity distributed in cerebral cortex, striatum and hippocampus, where MAGL is highly expressed. The objective of this study was to investigate the relationship between brain uptake of 11C-SAR1 and disease state using ischemia model rats for imaging of MAGL in brain.
Methods
Mild focal ischemia in model rats was induced by 30 min intraluminal occlusion of the right middle cerebral artery (MCAO). Ischemia rats were divided into three groups: no treatment and treatment with minocycline or KML29. PET study was performed on day 4 after MCAO surgery. Healthy control group was also placed. The uptake of radioactivity in the rat brains was measured with PET after injection of 11C-SAR1 or 18F-FEBMP (a radiotracer specific for translocator protein: 18 kDa, TSPO). Immunohistochemical and cresyl violet staining was performed to elucidate the relation between the radioactivity uptake and distribution of MAGL and TSPO expression in ischemia brains.
Results
PET imaging of 11C-SAR1 using ischemia rats revealed that brain radioactivity uptake in ipsilateral side decreased to 67% compared with that in contralateral side. Whereas, those were improved to 91% and 88% by minocycline and KML29 treatment, respectively. Results of immunohistochemical and cresyl violet stainings show that MAGL in ipsilateral side of ischemia rats decreased depending on the degree of ischemia damage. Results of PET imaging of 18F-FEBMP (PET probe for TSPO as an inflammation marker) show that ischemia damage degree decreased, since the brain radioactivity uptake in ipsilateral side reduced in minocycline or KML29 treated rats.
Conclusions
11C-SAR1, a PET probe for MAGL, has considerable promise for the evaluation of relationship between MAGL in brain and brain damage.
Reference
PP01-N02
In vivo Imaging of adenosine A1 receptors in neuroinflammatory response after experimental stroke
1Achucarro Basque Center for Neuroscience, Leioa, Spain
2Ikerbasque Basque Foundation for Science, Bilbao, Spain
3Molecular Imaging Unit, CIC biomaGUNE, San Sebastian, Spain
Abstract
Objectives
Adenosine receptors are broadly expressed in the innate (microglia, macrophages, mast cells and neutrophils) and adaptive immunity (lymphocytes) suggesting its control in the neuroinflammatory response (Burnstock et al., 2014; Martín et al., 2018). However, the role of adenosine A1 receptors after brain diseases such as cerebral ischemia and its involvement in inflammatory reaction is still largely unknown. Therefore, in vivo imaging modalities can be promising tools for the evaluation of the involvement of A1 receptors in the inflammation after stroke.
Methods
The expression of A1 receptors was evaluated using Positron emission tomography (PET) with [18F]DPCPX-PET and immunohistochemistry (IHC) at 1, 3, 7, 14, 21 and 28 days after cerebral ischemia in rats (n = 76). The role of A1 receptors in inflammation was evaluated by pharmacological modulation with the daily administration of the antagonist DPCPX (2 mg/Kg) and the agonist ENBA (0,5 mg/Kg) during the following seven days after reperfusion. Inflammatory activation with [18F]DPA-714 (TSPO) and glial proliferation with [18F]FLT were evaluated at day 7 after ischemia together with IHC (TSPO, CD11d, GFAP and Ki67) studies. In addition, brain damage and neurofunctional progression after treatments were assessed with magnetic resonance imaging (MRI) and neurofunctional studies.
Results
In the ischemic territory, [18F]DPCPX signal and IHC showed a dramatic decrease of A1 receptor expression at day 1 after stroke that was followed by a significant expression increase at days 3 and 7 in both microglia and astrocytes. The role played by A1 receptors in neuroinflammatory reaction after stroke was evaluated using [18F]DPA-714 and [18F]FLT as markers of inflammatory activity and glial proliferation, respectively. Treated ischemia rats with the agonist ENBA showed a significant decrease in both [18F]DPA-714 and [18F]FLT signals at day 7 after cerebral ischemia that was supported by IHC results. Besides, the activation of A1 receptors promoted the reduction of the brain lesion measured with T2W-MRI and the improvement of the neurofunctional outcome. Likewise, the treatment with the antagonist showed a non-significant increase of microglial activation with [18F]DPA-714 and similar values of [18F]FLT signals in comparison to control ischemic rats.
Conclusions
In the present study, we show for the first time the in vivo imaging of adenosine A1 purinergic receptor after cerebral ischemia in rats and the use of the PET tracer [18F]FLT as a promising tool to evaluate glial proliferation. These results suggested that A1 receptors play a key role in the control of both the activation and the “novo” proliferation of microglia and astrocytes after experimental stroke in rats.
Keywords
[18F]DPCPX, [18F]DPA-714, [18F]FLT, PET, adenosine A1 receptor, cerebral ischemia, MRI, neuroinflammation
Acknowledgements
The authors would like to thank A. Leukona, X. Ríos, V. Salinas for technical support in radiosynthesis and technical assistance in the PET studies. This study was funded by MINECO SAF2014–54070-JIN.
References
PP01-N03
Evaluation of TSPO PET ligand binding characteristics todifferent cell types in neuroinflammation
1Department of Neuroimaging, Institute of Psychiatry, Psychology & Neuroscience, King's College London, London, United Kingdom
2GlaxoSmithKline, Stevenage, London, United Kingdom
3The Wellcome Trust Consortium for the Neuroimmunology of Mood Disorders and Alzheimer's Disease (NIMA)
Abstract
PET imaging with tracers binding to TSPO (18 kDa-Translocator protein) is a useful tool to assess neuroinflammation in the human brain. TSPO is commonly utilised as a biomarker of neuroinflammation or microglia activation. However this is controversial as TSPO is present in various CNS and non-CNS cell-types including microglia, astrocytes, endothelial cells, macrophages & platelets, which subsequently complicates the interpretation of data captured with TSPO PET imaging agents from a neuroinflammatory perspective (Turkheimer et al., 2015). We have recently confirmed that [18F]DPA714 PET, one of the second generation TSPO PET tracers, is a useful tool for imaging the effect of subtle neuroinflammatory responses in the CNS (Vicente-Rodriguez et al., Evaluation of[11C]PK11195 and [18F]DPA714 TSPO PET in a rat model of neuroinflammation. Abstract submitted to this meeting). The aim of this study was to characterise the contribution of different cell-types to the TSPO PET signal in a rat model of low neuroinflammation induced by a systemic injection of LPS. This study was ethically reviewed and conducted in accordance with Animals (Scientific Procedures) Act 1986 and the GSK Policy on the Care, Welfare and Treatment of Animals. Rats were injected with either LPS (0.5 mg/kg, ip.) or vehicle (saline) followed by imaging with [18F]DPA714 (24 hrs later). Quantitative RT-PCR was performed to measure the mRNA expression of different cell-types specific genes (Iba1, P2ry12, Sall1, MCP-1, ICAM-1, Ly6c and CCR2) to assess the neuroinflammatory markers induced by systemic LPS. Following LPS there was an increased widespread uptake of [18F]DPA714 across the brain compared to controls. Systemic administration of LPS significantly increased the expression of specific-microglial genes in the hippocampus. However, in other brain areas there was an increased expression of genes associated with infiltrating monocytes and monocyte-derived macrophages. These results suggest the increased [18F]DPA714 uptake in the hippocampus could be due to a proliferation or activation of microglia, whereas the increased [18F]DPA714 uptake observed in other areas (including thalamus, cortex and striatum) could also be related to the increased expression of infiltrated peripheral immune cells. RNAscope combined with immunofluorescence of different cell-types markers (Iba1, Ly6c and CCR2) was used to co-localise TSPO with microglia, macrophages, monocytes and endothelial cells to evaluate TSPO expression in the different cell-types and better understand the TSPO PET signal induced by systemic administration of LPS. We conclude that an important contribution of peripheral infiltrated cells needs to be considered when assessing neuroinflammation with TSPO PET tracers. This study was part funded by GSK and a grant from Wellcome Trust (Grant number: 104025/Z/14/Z).
References
PP01-N04
Evaluation of [11C]PK11195 and [18F]DPA714 TSPO PET in a rat model of neuroinflammation
1Department of Neuroimaging, Institute of Psychiatry, Psychology & Neuroscience, King's College London, London, United Kingdom
2GlaxoSmithKline, Stevenage, London, United Kingdom
3PET Centre, St Thomas' Hospital, London, United Kingdom
4The Wellcome Trust Consortium for the Neuroimmunology of Mood Disorders and Alzheimer's Disease (NIMA)
5Institute of Nuclear Medicine and Department of Chemistry – Radiochemistry, University College London, United Kingdom
Abstract
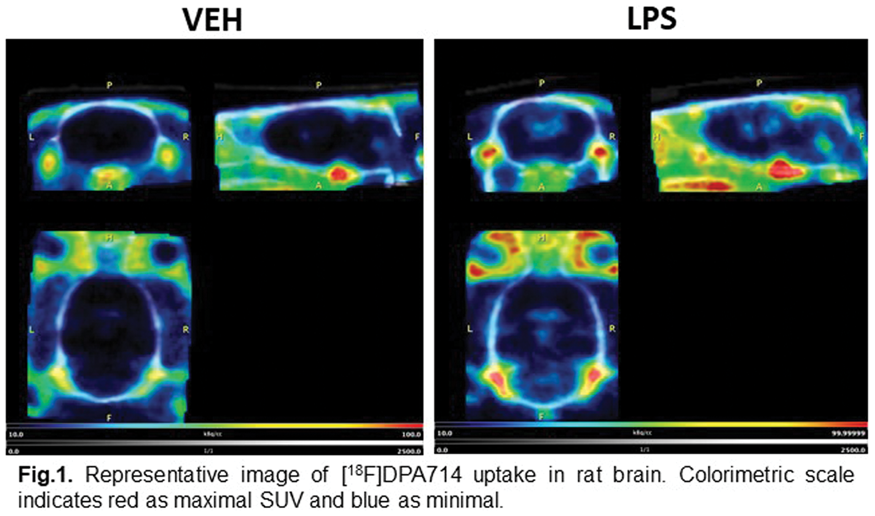
The aim of the study was to evaluate the utility of in vivo TSPO PET imaging in a rat model of low level neuroinflammation induced by a systemic injection of LPS. This study was ethically reviewed and conducted in accordance with Animals (Scientific Procedures) Act 1986 and the GSK Policy on the Care, Welfare and Treatment of Animals. To assess neuroinflammation we characterised two different TSPO tracers, [11C]PK11195 and [18F]DPA714, in both the rat model of intracranial LPS (icv; which is known to induce a robust focal neuroinflammatory reaction; Espinosa-Oliva et al., 2013), and in rats systemically injected with LPS. For the intracranial LPS model, rats were treated with unilateral stereotaxic injection of LPS (1ug) into the right striatum (n = 3), and for the systemic LPS model, rats were injected with either LPS (0.5 mg/kg, i.p. n = 4) or Vehicle (saline, n = 4). Animals were imaged in a microPET/CT scanner following intravenous administration of ∼10–15MBq [11C]PK11195 (40 mins) or [18F]DPA714 (60 mins). Following scanning, SUV values for various brain regions were determined. Blood and plasma samples were collected from the systemic LPS rat model to study peripheral tracer distribution. Four days following icv lesioning, in vivo microPET data demonstrated a significantly higher uptake of both [11C]PK11195 and [18F]DPA714 in the LPS-injected side vs the non-injected side, with the AUC being significantly higher for [18F]DPA714 compared to [11C]PK11195. Subsequently, [18F]DPA714 was selected to assess neuroinflammation in the systemic LPS rat model. An increased uptake in the LPS-treated group was found across all regions. Cerebellum, thalamus and olfactory bulb had higher activity in LPS-treated animals compared to vehicle (>20%), while the lowest difference was in amygdala (11%). No difference in peripheral distribution of the tracer was found between the LPS- and vehicle-treated groups. To conclude, imaging the effect of subtle neuroinflammatory responses in the CNS may be detected utilising [18F]DPA714 PET. Acknowledgements: This study was part funded by GSK and a grant from the Wellcome Trust (Grant number: 104025/Z/14/Z).
Reference
PP01-N05
Inflammation assessment after a clinical course of theta burst stimulation in non-human primates: a PBR28 study
1Department of Medicine/Neurology and Pacific Parkinson Research Center, University of British Columbia, Vancouver, Canada
2Department of Physical Therapy, Faculty of Medicine, University of British Columbia, Vancouver, Canada
3Faculty of Medicine, Graduate program of Rehabilitation Sciences, University of British Columbia, Vancouver, Canada
Abstract
Objective
Theta Burst Stimulation (TBS), a high-frequency type of repetitive transcranial magnetic stimulation, is currently used as a treatment tool for those with drug-resistant depression. To date, there is little work investigating the effects of TBS on the inflammatory response and whether a clinical course (multiple sessions) could induce an inflammatory response.
Thus, our objective is to assess the effect of a clinical course of TBS on inflammatory response measuring the non-displaceable binding potential (BPND) and distribution volume (VT) of 11C-PBR28, a translocator protein (TSPO) binder.
15 pairs (4 iTBS, 8 cTBS, and 3 sham) of 90-min 11C-PBR28 PET scans were acquired. Free fraction was measured in the majority of animals and proved very stable at around 10%. The BPND were obtained using a Logan analysis and white matter as the region of non-specific binding. For 6 scans, blood was drawn to obtain the total plasma activity. To investigate the validity of our reference region, volume of distribution (VT) using Logan linearization method, was computed using the whole blood and correlated with the corresponding BPND from 36 regions for each animal.
Results
All monkeys showed a significant increase in 11C-PBR28 binding after TBS administration as compared to sham. Changes in binding were also significantly different from with test-retest data. Similar increases in markers of inflammation were observed following both cTBS and iTBS. Therefore, we compared the data from the 2 stimulations paradigms to sham. The increase in PBR28 BPND was greater in all cortical regions compared to the striatum or thalamus.

VT and BPND comparison for each animal showed a strong correlation with a Pearson’s r range of 0.61 to 0.99 depending on the region.
Conclusion
Here, we demonstrated that a clinical course of TBS leads to an increase of TSPO binding, a marker of brain immune activation, as shown by the increase of
PP01-N06
Evaluation of the neuroprotective effect of the CSF-1R inhibitor in 6-OHDA rat model using 18F-FPCIT PET imaging
1Korea Institute Radiological and Medical Sciences, Seoul, Korea
Abstract
Objectives
Parkinson’s disease (PD) is one of the most common neurodegenerative disorders, which is caused by the loss of dopaminergic neurons in the substantia nigra (SN).1 It has been reported that CSF-1R inhibition can effectively deplete microglia and have neuroprotective functions by preserving blood brain barrier integrity.
Methods
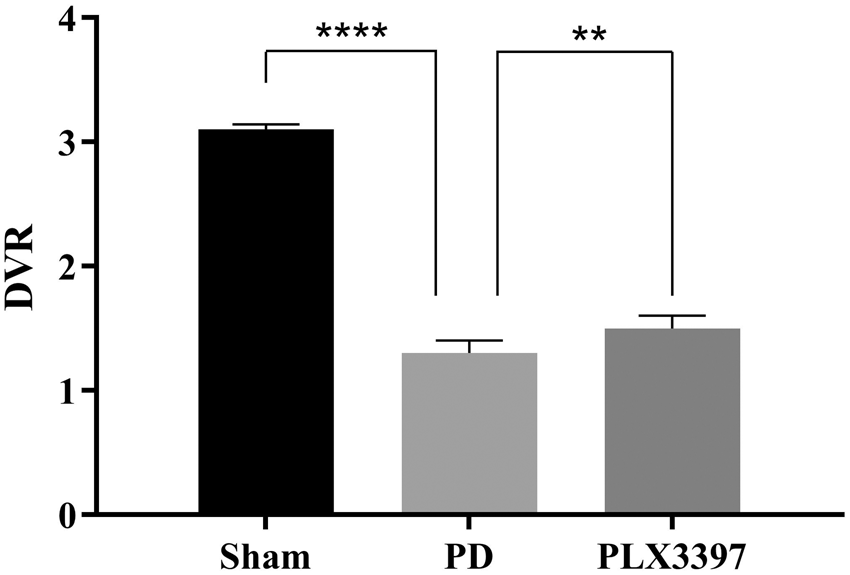
Three groups of SD rats were imaged with 18F-FPCIT; Sham (9 weeks, n = 6), 6-OHDA as non-PLX3397 treated group (PD, 9 weeks, n = 6) and 6-OHDA group in which PLX3397 was taken orally at 30 mg/kg (PLX3397, 9 weeks, n = 6) group. The brain PET images were spatially normalized to the M. Mirrione T2-weighted mouse brain MR template, and the volumes of interest were then automatically drawn on the striatum and cerebellum. The specific binding values were quantified as the distribution volume ratio using Logan graphical analysis with the cerebellum as a reference tissue. Behavior test (Adhesive removal test) was also performed to evaluate somatosensory and motor function improvement in PLX3397 treated rats.
Results
PD group showed 84% lower ipsilateral striatal binding values compared to those of Sham group (1.9 ± 0.1 vs 0.3 ± 0.1, respectively, p < 0.0001). Interestingly, the PLX3397 group showed 67% higher 18F-FPCIT binding values compare to those of PD group (0.5 ± 0.1 vs 0.3 ± 0.1, p < 0.01). In adhesive removal test, the removal time of the adhesive tape from their snout was significantly increased (116.3%) in PD group when compared to sham group (16.6 ± 7.9 vs. 35.9 ± 25.2 seconds, p < 0.01). In PLX3397 group, the removal time was found to significantly reduced (58%) as compared to PD group (14.9 ± 12.3 vs. 35.9 ± 25.2 seconds, p < 0.01).
Conclusions
Our data demonstrate that elimination of microglia through CSF-1R inhibition can ameliorate dopaminergic function in PD rat.
PP01-N07
Treatment effect of VEGF and VEGF inhibition in ischemic mice brains
1Department of Nuclear Medicine, Chonnam National University Hospital, Korea
2Department of Nuclear Medicine, Chonnam National University Hwasun Hospital
3Medical Photonics Research Center, Korea Photonics Technology Institue, Korea
4Department of Neurology, Chonnam National University Hwasun Hospital
Abstract
Background & Purpose
Vascular endothelial growth factor (VEGF) is associated with angiogenesis, which may stimulate the formation of blood vessels on the cerebral ischemia. However, there is growing evidence to demonstrate that early VEGF inhibition has a protective effect against cerebral ischemia. In this study, the effect of VEGF and VEGF inhibition in acute cerebral ischemia in mice was investigated by evaluation of functional outcome, the relative protein levels of VEGF and 18F-FDG PET/CT.
Materials & Methods
Nine week-old, male C57BL/6 mice (20–25 g) were induced transient middle cerebral artery occlusion. We divided 3 groups; sham, VEGF and anti-VEGF. Sham group was injected with 50 ug/kg of normal saline (IV) at 1 hr after reperfusion, VEGF group with the same dose of VEGF (IV), anti-VEGF group with the same dose of bevacizumab (IP). We checked neurological severity score (NSS) at 12 hr and every 24 hr in all mice. The cerebral glucose metabolism of the mice was evaluated by 18F-FDG PET/CT on the 1 week. The expression of proteins such as β-actin, VEGF, VEGFR1 and VEGFR2 was compared using qPCR and Western blot.
Results
NSS in early 3 days showed that VEGF group had a higher score than sham group, and anti-VEGF group lower score than sham group. On the 1 week, NSS in VEGF group was higher than sham group (p = 0.04), but no NSS difference was detected in the anti-VEGF group. 18F-FDG PET/CT showed also no significant difference between 3 groups. Infarct core site of VEGF group showed higher VEGFR1 expression than sham group (p = 0.1), peri-infarct site showed higher VEGFR2 expression than sham group (p = 0.1). Anti-VEGF group showed no difference in VEGF, VEGFR1 and VEGFR2 expression, compared to sham group.
Conclusion
VEGF treatment showed a worse functional outcome, but anti-VEGF treatment showed better functional outcome until early 3 days. VEGF treatment showed worse functional outcome on the 1 week, and higher VEGFR1 and VEGFR2 expression in the infarct core and peri-infarct site. However, anti-VEGF treatment showed no significant differences in cerebral glucose metabolism and protein expression on the 1 week. This study suggests that early VEGF treatment affect a worse outcome on the cerebral ischemia.
PP01-N08
The effect of nicotine on brain glucose metabolism in healthy rats: a pilot study to investigate the modulatory effect of nicotine on cognition
1Department of Clinical Research, University of Southern Denmark (SDU), Odense, Denmark (Shared first author between MNB and RP)
2Department of Nuclear Medicine, Odense University Hospital, Odense, Denmark
Abstract
Objective
Nicotine as a n-acetylcholine receptor (nAChR) agonist and pharmacological chaperone modulates cholinergic system in the brain. It exerts its neuroprotective and anti-inflammatory features via activation of α4β2 and α7 nAChR. This study aimed to evaluate the time and dose-dependent effect of nicotine on glucose metabolism.
Methods
Twenty-Four Norwegian rats were obtained and divided into 4 groups. While one of the groups was considered as the control group, 3 other groups were designated as intervention groups and were administered with 0.1 (group 1), 0.5 (group 2) and 1 mg/kg/day (group 3) of intraperitoneal nicotine injection for duration of time period of 14 days. The animals underwent two 18FDG-PET scans (INVEON multimodality scanner, Siemens pre-clinical solutions, Knoxville, TN, US) in two different sessions. The first scan was performed 30 min after the injection of tracer on the first day (acute phase) while the second scan was performed (also after 30 min of tracer injection) following fourteen days of daily nicotine injection (chronic phase). Cerebral metabolic rate of glucose (CMRglc) was calculated using both Patlak-Gjedde plot and 2-compartment method. CMRglc in different study groups and time points were compared with each other.
Results
In acute phase, CMRglc differences between the group 1 and 2 when compared to the control group were not significantly different regardless of the model employed. In group 3, although there was no significant difference when compared to the control group using Patlak-Gjedde plot (P = 0.1), but CMRglc was statistically lower compared to control group when 2-compartment model was used (P = 0.01). In chronic phase, the differences between group 1 and 2 when compared to the control group were not significant. In group 3, although the Patlak-Gjedde plot yielded no significant difference when compared to the control group (P = 0.26), but CMRglc was statistically lower compared to the control group using 2-compartment model (P = 0.03). Moreover, the Patlak-Gjedde yielded no significant CMRglc difference between acute and chronic phase neither in group 1 (P = 0.22) nor in group 3 (P = 0.91). Likewise, the CMRglc differences between acute and chronic exposure in group 1 and 3 were not significant using 2-compartment model, but the CMRglc after chronic nicotine exposure was significantly higher than acute nicotine exposure in group 2 (P = 0.04).
Conclusion
The current results demonstrate that nicotine when administered in optimal dose and time alters glucose metabolism and as a result ATP production. This in turn could have a direct effect on cognition through the ATP-dependent cAMPA receptors.
Keywords
Nicotine, Glucose, Metabolism, Positron Emission Tomography
PP01-O01
tDCS induced modulation of dopamine and GABA systems: a PET / MRS study
1Department of Biofunctional Imaging, Hamamatsu University School of Medicine
2Department of Psychiatry and Neurobiology, Kanazawa University
3Research Center for Child Mental Development, Kanazawa University
4Department of Psychiatry, Hamamatsu University School of Medicine
5Hamamatsu Photonics KK
Abstract
Objectives
Transcranial direct current stimulation (tDCS) to the dorsolateral prefrontal cortex (DLPFC) modulates cognitive functions. Nevertheless, the mechanisms for cognitive changes by tDCS remain largely unknown. Here, we investigated the mechanisms on the molecular basis using [11C]Raclopride PET and GABA-MRS.
Methods
This study used a randomized, placebo-controlled, double-blind, crossover design. Eighteen healthy male subjects underwent 26 min of active and sham tDCS with the anode placed at the left DLPFC and the cathode at the right DLPFC, followed by examinations with PET, MRS and cognitive tests. The binding potential (BPND) of [11C]Raclopride was estimated on the Logan plot method. Brain regions with significant BPND changes after tDCS were examined using regions of interest (ROIs) and SPM analyses. MRS voxels were set in the left DLPFC and bilateral striatum. Edited GABA spectra were acquired using the MEGA-PRESS sequence, and spectra were analysed using LCmodel software.
Results
The PET analyses showed significant reduction of [11C]Raclopride BPND (increase in dopamine release) in the right ventral striatum after active tDCS. MRS analysis showed significant elevation of GABA in the left striatum and reduction tendency in the right striatum after active tDCS. The striatal dopamine release and GABA elevation were positively correlated with reduction of GABA in the left DLPFC.
Conclusions
The present results reveal that tDCS to the DLPFC modulates dopamine-GABA systems, which may reflect molecular dynamics in the basal ganglia-cortical circuit.
PP01-O02
Serotonin 4 receptor binding is positively associated with brain response to reward
1Neurobiology Research Unit, Rigshospitalet, Copehagen, Denmark
2Faculty of Health and Medical Sciences, University of Copenhagen, Copenhagen, Denmark
3Department of Psychiatry, Psychiatric Centre Copenhagen, Copenhagen, Denmark
4Department of Public Health, Section of Biostatistics, University of Copenhagen, Copenhagen, Denmark
Abstract
Objectives
Serotonergic neurons innervate brain regions of the reward circuit. Ventral striatum (VS), which is a key hub involved in reward processing, contains particularly high concentrations of serotonin 4 receptors (5-HT4R). Recent molecular imaging methods have enabled mapping of the 5-HT4R binding in the living human brain with Positron Emission Tomography (PET) imaging using the radioligand [11C]SB207145. Recent studies demonstrate that 5- HT4R levels serves as an indirect marker for endogenous as well as pharmacologically induced long-term changes in brain 5-HT levels.1 Reward circuit recruitment can be probed by task-based functional magnetic resonance imaging (fMRI). With these methods, we now have a unique opportunity to advance the understanding of 5-HT modulation of reward experience by mapping the association between serotonergic neurotransmission in terms of 5-HT4R binding and VS activity during reward processing in healthy individuals.
In this study we aimed to investigate the association between baseline 5-HT4R binding and VS reward related activity in healthy women.
Method
Brain imaging data were available for 25 healthy women aged 19–40 years (25.3 ± 5.1) from the Center for Integrated Molecular Brain Imaging (CIMBI) database.2 Participants had no former history of psychiatric or neurological disorders. Participants underwent PET scanning using the tracer [11C]SB207145. The hemodynamic response in VS was imaged by fMRI based blood oxygen level dependency (BOLD) signals during a monetary reward paradigme.3 We quantified fMRI data for possible differences between a control condition and a reward condition of the paradigm. The association between extracted fMRI voxel means, from a predetermined striatal region of interest (ROI), and [11C]SB207145 binding was evaluate using multiple linear regression, while adjusting for age. All p-values were adjusted for multiple comparison using Holm’s method with p-values above 0.05 considered significant.
Results
We found that pallidostriatal 5-HT4R binding was positively associated with VS activity related to monetary reward (β = 0.54, padjusted = 0.045, 95% CI [0.14;0.94]); the association appeared primarily driven by right pallidostriatum (β = 0.75, padjusted = 0.003, 95% CI [0.36;1.14]) in an analysis adjusted for left pallidostriatum.

In addition, we found that whole brain 5HT4R binding was positively associated with VS activity during monetary gain (β = 3.04, padjusted = 0.006, 95% CI [1.30;4.80]). We found no significant association between n. caudati [11C] SB207145 binding and striatal reactivity to reward (β = 0.23, padjusted = 0.498, 95% CI [−0.17;0.64]).
Conclusion
We found that both striatal and global grey matter 5-HT4R was positively associated with reward related VS activity. We speculate that higher capacity for direct 5-HT4R agonism is associated with increased VS engagement in processing reward. Future studies should investigate the association in pathological states, e.g., depression where anhedonia is a prominent feature, and whether pharmacological stimulation of 5-HT4R support engagement of VS to positive stimuli.
References
PP01-O03
Healthy women who use oral contraceptives show lower brain serotonin 4 receptor binding relative to non-users
1Neurobiology Research Unit, Rigshospitalet, Copenhagen, Denmark
2Faculty of Health and Medical Sciences, University of Copenhagen, Copenhagen, Denmark
3Department of Psychiatry, Psychiatric Centre Copenhagen, Copenhagen, Denmark
4Department of Public Health, Section of Biostatistics, University of Copenhagen, Copenhagen, Denmark
Abstract
Objectives
The lifetime incidence of depression reaches 21% in women, which is about twice the incidence in men. Strong epidemiological evidence supports that women are at higher risk for depression during hormonal transitions, i.e. peripartum and perimenopause. This may extend to exogenous hormone exposure; a large register-based Danish study of more than one million women showed that initiating oral contraceptives (OCs) is associated with subsequent use of antidepressants targeting serotonin (5-HT) neurotransmission.1 The mechanisms behind remain elusive, however, OCs may affect 5-HT brain architecture, i.e. reproductive hormones can affect the level of 5-HT synthesis, reuptake, degradation and 5-HT receptor expression. No studies have addressed whether OCs affect serotonergic architecture in terms of 5-HT4 receptor (5-HT4R) binding, which is sensitive to 5-HT manipulation and provides an indirect biomarker for in vivo brain 5-HT levels.2
We investigate if brain 5-HT4R binding differs between OC users and non-users among healthy women. In a secondary analysis we explore if 5-HT4R binding differs between 2nd- and 3rd generation OCs.
Methods
[11C]-SB207145, ligand for 5-HT4R, PET imaging data were available from the Cimbi database for 55 healthy women, of which 17 used OCs (mean age of users = 25.5 vs. non-users = 26.1, p = 0.71). Five brain regions, considered important for depression pathophysiology, were co-registered to an MRI image and 5-HT4R non-displaceable binding potential (BPND) was determined using the simplified reference tissue model with cerebellum as a reference region.
The type of OC was known for 13 of the 17 users, all were combined oral contraceptives (COCs), mainly 2nd- and 3rd generation COCs. For this reason the secondary analysis was restricted to this subgroup.
The association between use of OC and regional BPND was evaluated using multiple linear regression models adjusting for age, scanner type (GE-Advance vs. HRRT Siemens PET scanner), injected [11C]-SB207145 mass per bodyweight and familial risk for depression.
Results
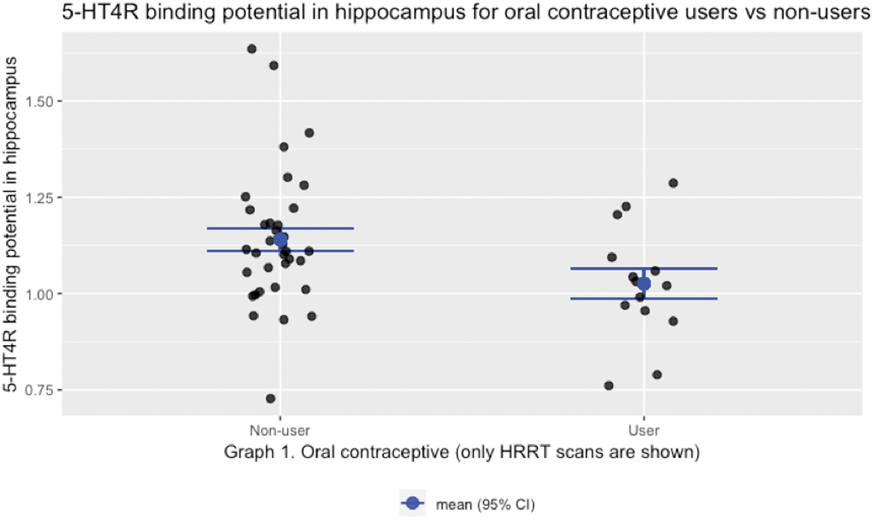
We found a negative association between BPND and use of OC in all explored regions with the following percentage difference to non-users; pallidostriatum: −7.2% (CI[−13.6:−0.3], p = 0.04), caudate nuclei: −8.6% (CI[−15.2:−1.4], p = 0.02), hippocampus (
Conclusions
Women using OCs have lower cerebral 5-HT4R binding compared to non-users. We propose that this reflects an effect of OC hormone exposure on 5-HT4R expression rather than a change in serotonergic tone. This offers a plausible link between OC exposure and subsequent risk of developing depression, particularly in hormone sensitive individuals. Future intervention studies must elucidate if withdrawal from OCs rescues 5-HT4R brain architecture and help identify women who are sensitive to OCs.
References
PP01-O04
Serotonin 4 receptor binding and oxytocin-promoted affective and social cognition in the healthy female brain
1Neurobiology Research Unit, Copenhagen University Hospital Rigshospitalet, Denmark
2Faculty of Health and Medical Sciences, University of Copenhagen, Denmark
3Section of Biostatistics, University of Copenhagen, Denmark
Abstract
Objectives
Oxytocin is a neuropeptide known for its prosocial properties and central role in human bonding. Studies have shown that administration of intranasal oxytocin modulates brain function in key neural circuits involved in processing of emotions1 and can influence affective and social cognition.2 The neurotransmitter serotonin (5-HT) is likewise strongly involved in the processing of affective and social information including the 5-HT 4 receptor (5-HT4R) which has been proposed as a proxy for synaptic 5-HT levels in the brain.3 Emerging evidence from human neuroimaging4 and animal studies5 suggest that crosstalk between oxytocin and 5-HT signaling may play a key role in emotional and social behaviors. However, the exact nature of this interaction remains elusive in humans. Therefore, we here aim to evaluate the relation between baseline 5-HT neurotransmission indexed by 5-HT4R binding and oxytocin-promoted affective and social cognition in the healthy female brain.
Methods
Using a double-blind, placebo-controlled, randomized crossover design, 35 healthy women aged 20–39 years (25.0 ± 4.7, mean ± SD) received a dose of 24 IU intranasal oxytocin or placebo. After a waiting period 40 minutes, participants completed a series of tasks from the novel affective and social cognitive EMOTICOM test battery. The tasks domains included emotional face recognition, affective memory, and moral emotions. Intervention days were placed one month apart during the follicular phase to control for hormonal fluctuations in the menstrual cycle. In a subgroup (n = 25), baseline 5-HT4R binding was assessed using [11C]SB207145 Positron Emission Tomography (PET). Main effect of oxytocin intervention on cognition was assessed used paired sample t-tests. Linear mixed models were used to investigate if oxytocin-promoted changes in affective and social cognition were dependent on baseline 5-HT4R binding in amygdala, hypothalamus, hippocampus, and whole brain.
Results
No main effect of oxytocin was observed for any of the cognitive outcomes (all p-values > 0.1). Nor did baseline 5-HT4R binding in any of the regions of interest predict cognitive response to oxytocin intervention (all p-values > 0.2; see Fig 1 for an example).

Conclusion
Our data did not corroborate previous reports that intranasal oxytocin alters affective and social cognition in healthy women. Furthermore, we found no association between baseline 5-HT4R binding (as a proxy of cerebral 5-HT levels) and oxytocin effects on affective and social cognition. However, based on the present study design we cannot rule out the presence of small effects which may be detectable in larger study populations or patient groups.
References
PP01-O05
Validation and noninvasive kinetic modeling of [11C]UCB-J PET imaging of synaptic density in mice
1Molecular Imaging Center Antwerp (MICA), University of Antwerp, Belgium
2Department of Nuclear Medicine, Antwerp University Hospital, Belgium
3CHDI Foundation, Los Angeles, California, USA
Abstract
Objectives
The synaptic vesicle glycoprotein 2A (SV2A) is an essential vesicle transmembrane protein expressed ubiquitously in all synapses. Since synaptic pathology has been associated with several neuropsychiatric and neurodegenerative disorders, PET imaging of SV2A may provide a unique tool to measure noninvasively synaptic density. In vivo SV2A imaging can be achieved using the radioligand [11C]UCB-J1, given its high selectivity and affinity for the target. [11C]UCB-J has been reported in non-humans primates and humans1,2, however, validation and kinetic modeling of the radioligand has not yet been described in rodents. Given the pivotal role of mouse models in studying neuropsychiatric and neurodegenerative disorders, this study aimed at filling this gap.
Methods
Ninety-minutes dynamic microPET/CT imaging was performed in adult (8 moths old) wild-type (WT) C57Bl/6 J mice (n = 10). A blocking study was performed using the antiepileptic drug levetiracetam, a high affinity ligand for SV2A, at 2 different concentrations (50 and 200 mg/kg i.p.; n = 4/dose) with Lassen plots used to estimate receptor occupancy. Regional time-activity curves (TACs) were analyzed with 1TCM, 2TCM, and Logan plot to estimate total volumes of distribution (VT), which was calculated noninvasively using an image-derived input function (IDIF). In vivo plasma radiometabolism was determined in separate WT animals (6 months old) at 5, 15, 30, and 45 min post-injection (p.i.) (n = 3/time point) for generation of a population-based curve.
Results
Levetiracetam pretreatment (50 and 200 mg/kg i.p.) resulted in a substantial blockade (79 ± 6% and 97.3 ± 3.5%, respectively, according to Lassen plots) of [11C]UCB-J and confirmed target engagement in a dose-dependent manner. VT values estimated with the different models were comparable (r > 0.990, p < 0.0001), with 1TCM slightly better than 2TCM or Logan plot according to the Akaike information criterion. Shortening the scan duration from 90 min up to 60 min did not affect the VT (r = 0.995, p < 0.0001) nor K1 (r = 0.998; p < 0.0001) estimations. Parametric VT and K1 images, and values obtained using 1TCM over a 60 min scan are reported in Fig. 1. In vivo metabolism of [11C]UCB-J was moderately rapid, with a parent fraction of 22.4 ± 4.1% at 15 min p.i. and 9.5 ± 3.3% at 45 min p.i.
Conclusions
Our findings showed that [11C]UCB-J selectively binds to SV2A with optimal kinetics in the mouse brain. [11C]UCB-J PET imaging is a promising tool to noninvasively measure synaptic density for comparative studies in mouse models of neuropsychiatric and neurodegenerative disorders. [11C]UCB-J PET imaging in healthy mice. (A) Average microPET parametric images for VT and K1 of [11C]UCB-J. Parametric microPET images are overlaid onto a MRI mouse brain template. 
References
PP01-O06
Dopamine-opioid interactions in the human reward system
1Department of Chronic Diseases, Metabolism, and Ageing; KU Leuven; Belgium
2Leuven Brain Institute, KU Leuven, Belgium
3Department of Neurosciences, KU Leuven, Belgium
4Department of Imaging and Pathology, KU Leuven, Belgium
Abstract
Objectives
The dopamine D2 receptor (DA2R) and μ-opioid receptor (MOR) systems play key roles in reward processing. Animal studies have demonstrated interactions between both neurotransmitter systems, but human evidence is limited to one study showing coupling of DA2R and MOR availability in the striatum using [11C]raclopride and [11C]carfentanil PET imaging, respectively (Tuominen, NeuroImage, 2015). Here, we used [18F]fallypride and [11C]carfentanil PET to study for the first time regional coupling of the DA2R and the MOR in striatal as well as extrastriatal reward regions in the human brain, as well as whole-brain associations between DA2R and MOR availability.
Methods
Nineteen healthy volunteers (9 women, age 19–47 y, BMI 18.4–28) participated. PET data were preprocessed and analyzed using MATLAB and SPM. Voxel-based parametric images of the Distribution Volume Ratio (DVR) were calculated with Logan graphical analysis, using cerebellar and calcarine grey matter as reference region for [18F]fallypride and [11C]carfentanil, respectively. Voxel-wise correlations were calculated on thresholded DVR images within a mask of reward regions. Further, seed-based correlations were calculated between the DA2R and MOR system, with seeds in the ventral tegmental area (VTA) and striatum.
Results
DA2R and MOR were mainly positively associated in the striatum (peak voxel values for caudate nucleus [CN] ρ = 0.84, p < 0.0001; putamen ρ = 0.6, p = 0.006; nucleus accumbens [NAc] ρ = 0.78, p < 0.0001) and VTA (peak voxel values ρ = 0.72, p = 0.0005), and mainly inversely associated in extrastriatal regions (peak voxel values for anterior cingulate cortex ρ = −0.69, p = 0.001; orbitofrontal cortex [OFC] ρ = −0.86, p < 0.0001). Further, we observed heterogeneity in correlation patterns within brain regions. The positive correlations in the CN and NAc are in line with Tuominen et al., but our data showed a mix of positive and negative correlations in different parts of the putamen, potentially explaining their lack of findings in this region. The striatum showed a ventromedial (negative ρ) to dorsolateral (positive ρ) gradient, overlapping with functional anatomical divisions. The anteromedial part of the OFC showed negative correlations, but positive correlations were present in posterior and lateral parts, overlapping with anterior-posterior and medio-lateral functional subdivisions of the OFC. Map of correlation values within a mask of reward regions, overlaid on a standard T1-weighted MRI image. Top color bar represents positive correlations (red; range 0 to 1); bottom color bar represents negative correlations (blue; range 0 to −1).
Seed-based analyses showed that CN and putamen DA2R availability was positively associated with VTA, striatal, and cerebellar MOR availability (all peak levels puncorr < 0.001, cluster levels pFWE-corr < 0.005). Additionally, we demonstrated for the first time that VTA MOR availability was positively correlated with DA2R availability in both striatal (putamen) and extrastriatal (insula) regions (peak level puncorr < 0.001, cluster level pFWE-corr = 0.034). This supports animal work demonstrating a strong influence of the MOR system on dopaminergic projections to other brain reward regions.
Conclusions
We demonstrated for the first time in humans that DA2R and MOR availability show mainly negative correlations in extrastriatal reward regions, and that MOR availability in the VTA is associated with DA2R availability in striatal and extrastriatal reward regions.
PP01-O07
Age-dependency of synaptic density in healthy human brain: a 11C-ucb-j PET-MR study
1Department of Neurology, University Hospitals Leuven, Belgium
2Laboratory for Neurobiology, KU Leuven, Belgium
3Center for Brain and Disease research, VIB-KU Leuven, Belgium
4Nuclear Medicine and Molecular Imaging, University Hospitals Leuven, Belgium
5Department of Imaging and Pathology, KU Leuven, Belgium
6Department of Old Age Psychiatry, University Psychiatric Centre, KU Leuven, Belgium
7Department of Translational MRI, KU Leuven, Belgium
Abstract
Objectives
Synaptic vesicle glycoprotein 2A (SV2A) is expressed ubiquitously in presynaptic nerve terminals and can be in vivo visualized and quantified by 11C-UCB-J as a proxy for synaptic density1. From recent in vivo and postmortem evidence, findings are still contradictory: while some data suggests a decrease of synaptic density with age2,3, other studies do not confirm this4–6. Therefore, we investigated the effect of healthy ageing on 11C-UCB-J binding, taking grey matter atrophy into account with simultaneous multiparametric PET-MR acquisitions.
Methods
Sixteen screened healthy subjects (26–76 years, 7M/9F, average age 54.8 ± 18.3 years) were scanned on a GE Signa PET-MR 60 min post-injection of 11C-UCB-J (235 ± 62 MBq), during 30 minutes. SV2A binding was quantified using SUVR with the centrum semiovale as a reference region7. First, grey matter concentration changes with ageing were assessed by voxel-based morphometry using T1 volumetric images (VBM; pheight < 0.001, uncorrected; Kext > 500 voxels). Age effects of 11C-UCB-J binding were assessed with both a voxelwise (SPM12) and volume-of-interest (VOI) based correlation analysis, with and without correction for partial volume effects (PVC), using Muller-Gartner and GTM method for voxelwise and VOI-based analysis respectively. VOIs were defined by the Hammers N30R83 atlas (PMOD v3.9) and VOI-based correlation analysis was performed in 10 composite bilateral VOIs (frontal, temporal, parietal and occipital lobes, cerebellum, cingulate cortex, mesotemporal cortex, putamen, caudate nucleus and thalamus).
Results
VBM showed known cortical and subcortical grey matter atrophy with healthy aging (e.g. superior medial frontal gyrus, orbitofrontal cortex, superior and middle temporal gyrus, caudate nucleus). Regional VOI-based correlation analysis without PVC showed significant decrease of 11C-UCB-J SUVR with age in the parietal cortex (rs = −0.68; p = 0.004), caudate nucleus (rs = −0.60; p = 0.01) and cingulate cortex (rs = −0.57; p = 0.02) (no corrections for multiple comparisons; Figure 1, in red). However, after PVC no significant correlation remained (range rs: −0.47–0.32, p > 0.05) (Figure 1, in black). This was confirmed by voxelwise correlation analysis even at a liberal threshold of pheight < 0.01.

Conclusions
Taking partial volume correction into account, there is no association between healthy aging and in vivo 11C-UCB-J binding as measured with SUVR. These data argue against a major effect of age on synaptic density per volume unit grey matter between the 3rd and 8th decade.
References
PP01-P01
Striatal dopamine transporter availability and D2 receptor density correlate to relative blood flow measured with [11C]PE2I, [18F]FE-PE2I and [11C]raclopride PET
1Uppsala University Hospital, Uppsala, Sweden
2Uppsala University, Uppsala, Sweden
3Karolinska Institutet, Stockholm, Sweden
Abstract
Objectives
[11C]PE2I and [18F]FE-PE2I are PET ligands with high affinity and selectivity for the dopamine transporter (DAT) and [11C]raclopride binds to dopamine D2 receptors. A dynamic PET scan with either of these tracers can give information of both binding potential (BPND) as a measure of DAT or dopamine D2 availability, and relative tracer delivery (R1) as a measure of relative cerebral blood flow. The purpose of this study was to investigate any relationship between R1 and BPND for [11C]PE2I, [18F]FE-PE2I and [11C]raclopride.
Methods
Data from 58 healthy controls (HC) were included. They received either an 80 min [11C]PE2I (n = 20), a 93 min [18F]FE-PE2I (n = 20) or a 50 min [11C]raclopride (n = 18) dynamic PET scan. [11C]PE2I and [18F]FE-PE2I were administered as a bolus injection while [11C]raclopride was given as a bolus and constant infusion during the whole scan. Volumes of interest (VOIs) were defined using a probabilistic VOI template. BPND and R1 were calculated using the simplified reference tissue model (SRTM) with grey matter cerebellum as reference region. Correlations between R1 and BPND were calculated in caudate and putamen, left and right side separately. In addition, simulations were performed to investigate any link between the parameters due to the modelling. One-hundred time activity curves (TACs) were simulated using the two tissue compartment model. Random R1 values between 0.5 and 1.5 and BPND values between 4 and 10 were used and the rate constants, K1-k4, were chosen to reflect the behaviour of striatal [11C]PE2I TACs. Various parameter combinations that violated the assumptions behind SRTM were also selected. SRTM was used to calculate BPND and R1.
Results
Significant correlations between R1 and BPND were found for all three ligands. Square of the correlation coefficient, R2, was 0.57, 0.72 and 0.59 for [11C]PE2I, [18F]FE-PE2I and [11C]raclopride respectively (p-value < 0.0001), Figure 1. No correlation was seen between R1 and BPND in the simulated data, R2 = 0.04. Violation of SRTM assumptions also did not affect the magnitude of the correlations.

Conclusions
These results indicate a relationship between relative blood flow and DAT availability and dopamine D2 receptor density in striatum. No relationship between neither BPND or R1 values and size of the VOIs has been observed, which precludes that the correlation is due to a correlated underestimation in both BPND and R1, induced by partial volume effects. In addition, but not included as a part of this abstract, a subgroup of the subjects receiving [11C]PE2I PET scans also underwent PET examinations with [11C]DASB, investigating serotonin transporter availability. The SRTM R1 values calculated from the [11C]DASB scans showed a similar correlation to [11C]PE2I BPND values as seen within the same scan. This finding further enhances the conclusion that this relationship most likely have a biological explanation suggesting that there is a coupling between blood flow and receptor/transporter availability in striatum. To assess the relevance of this finding, additional studies including quantitative measures of blood flow are needed.
PP01-P02
Lp-ntPET endogenous neurotransmitter release model: a novel estimation method in a bayesian context
1CERMEP-Imagerie du vivant, Lyon, France
2Siemens Healthcare France SAS, Saint-Denis, France
Abstract
Objectives
In dynamic PET imaging, the lp-ntPET model1 has been widely accepted to detect and characterize a transient endogenous neurotransmitter release in response to a stimulus or a pharmaceutical challenge. However, there is an interdependence of the 7 parameters of the model. Therefore, in a realistic context where the level of noise is high, robustness of the parameters estimation method is tricky.
The present work explores a novel estimation method based on a Markov-Chain Monte-Carlo (MCMC) sampling in a Bayesian context. This new methodology allows the integration of prior knowledge on parameters that constrain the available solutions, which alleviates the identifiability problem. It also quantifies the uncertainty of the parameters and does not rely on a set of chosen basis functions as the original method does.
Methods
The proposed method relies on a stochastic approach which consists in assessing the whole posterior distribution of the parameters, i.e. estimating the probability of the parameters given the measurements. According to Bayes rule, the posterior distribution is proportional to the product of the likelihood and the prior. The likelihood, which corresponds to the noise model, is here considered normally distributed with the variance at each time point scaled by the decay factor and the frame duration. The prior is a uniform distribution in an interval of plausible values for each parameter. The posterior distribution is then approximated with MCMC using a hybrid Metropolis-within-Gibbs sampler,2 where the step size of each chain is adjusted to ensure an optimal mixing behavior.
For performance evaluation of the method, realistic dynamic whole brain PET data of a 90-minute bolus-infusion [11C]raclopride protocol have been simulated using PET-SORTEO3 for 21 structurally different subjects. Time activity curves (TAC) used as input for simulations included a dopamine release at 40 minutes in specific regions (Caudate, Accumbens and Putamen), with four different magnitudes of TAC decrease (0, 5, 10 and 25% of the basal TAC, respectively named placebo, stim05, stim10, stim25). To fit the lp-ntPET model on the reconstructed TACs, 5000 samples have been drawn with the proposed MCMC sampler. This few amount of samples has been shown to be sufficient considering the early convergence of the chains.
Results
The maximum a-posteriori (MAP) estimates of each parameter have been derived from the marginal distributions for each condition and each region over the 21 subjects. Figure 1 shows the Displacement Ratio4 calculated from these estimates. Results show that the obtained

Conclusions
The early results show promising potential for estimating the parameters of the lp-ntPET model in a Bayesian framework. Current work explores the resolution of lp-ntPET at a voxel level, by integrating prior knowledge on spatial regularity with or without the use of anatomical MRI.
References
PP01-P03
Significant decreases in [11C]ABP688 binding after a mismatch negativity paradigm
1Institute of Neuroscience and Medicine, INM-4, Forschungszentrum Juelich, Germany
2Department of Psychiatry, Psychotherapy and Psychosomatics, RWTH Aachen University, Germany
3Institute of Neuroscience and Medicine, INM-11, Forschungszentrum Juelich, Germany
4Institute of Neuroscience and Medicine, INM-2, Forschungszentrum Juelich, Germany
5Department of Neurology, RWTH Aachen University, Germany
6JARA – BRAIN – Translational Medicine, Germany
Abstract
Objectives
The glutamatergic receptor (mGluR5) is under investigation in clinical neurology and of great interest in several lines of research [1–3]. We assessed the feasibility of using [11C]ABP688 to evaluate changes in glutamate levels through the Mismatch Negativity (MMN) auditory paradigm4 as a part of a multimodal study.5
Methods
Five healthy, male, non-smoking subjects were scanned with a Siemens 3 T MR-BrainPET insert. We analyzed the effect of MMN comparing the changes in non-displaceable binding potential (BPND) prior, during and after the MMN with a bolus/infusion protocol during the tracer steady-state (50% of the total injected activity (446.4 ± 106.0 MBq) was infused during 65 minutes after bolus injection). Image reconstruction was performed with 3D-OP-OSEM (2 subsets, 32 iterations), isotropic voxel = 1.25 mm3, 153 slices, matrix of 256 × 256 pixels, and a frame scheme of 2 minutes. PET frames were synchronized with the different acquisition moments. The images were corrected for attenuation [6], random and scattered coincidences, and dead time. Post processing with a 2.5 mm 3D Gaussian filter and motion correction were performed. Anatomical images were acquired with T1 MPRAGE sequence (TR = 2250 ms, TE = 3.03 ms, 176 slices, 1 mm slice thickness). The MMN paradigm consisted of changes in tone duration and was presented in alternating sequences. The deviant positions were pseudo-randomized and a silent video was presented to the subject. PMOD software was used to define the volumes of interest (VOIs) with T1 images serving as the anatomical reference. All images were finally processed in the PET subject’s space, and the Hammers atlas7 was used for activity concentration analysis. The maximum probability operation was applied to generate the VOIs in the grey matter cortex (GM). Furthermore, functional network regions,8 GM corrected, were also applied. Cerebellum GM was chosen as the reference region. Statistical analysis was performed using repeated ANOVA with inter-subject corrections.9
Results
There was a significant ΔBPND between conditions. On average, the reductions across all regions and subjects were of −11.46 ± 3.39%, F(2,6) = 7.471; P < 0.05 in anatomical [FIGURE 1 (a)] and −10.37 ± 4.33%, F(2,8) = 6.674; P < 0.05 in functional VOIs [FIGURE 1 (b)].

Conclusion
Significant decreases in [11C]ABP688 binding were observed in both anatomical and functional brain regions. Exploratory analyses suggest that the MMN paradigm affects the regulation of glutamate levels, and mGluR5 may indirect be modulated by these changes as an allosteric site.
References
PP01-P04
Differences between ABP688 binding in the human brain and cerebellum: interpretation and limitations
1McGill University
Abstract
Rationale
In vitro data from primates provide conflicting evidence regarding the suitability of cerebellum as a reference region for quantifying metabotropic glutamate receptor type five (mGLUR5) binding parameters with positron emission tomography (PET). To address this issue, we measured mGLUR5 density in postmortem human cerebellar cortex using [3H]ABP688 quantitative autoradiography (n = 5) and immunohistochemistry (n = 6).
Methods
Human frozen brain slices (n = 5) corresponding to the cerebellum and hippocampus regions were studied. Tissues were cryosectioned at 20 µm at −15°C (HM 500 M, Microm International) and thaw-mounted on poly-L-lysine pre-coated microscope slides. Brain sections were dried at room temperature for one hour, and then stored in a freezer at −80oC. Briefly, slides were warmed up to room temperature and pre-incubated for 20 min in buffer containing 30 mmol N2 HEPES, 110 nmol NaCl, 5 mmol KCl, 2.5 mmol CaCl2 and 1.2 mmol MgCl2 (pH 7.4). A [3H]ABP688 saturation binding study was performed using concentrations of 8, 4, 2, 1, 0.5, 0.25 and 0.125 nM in the same buffer for 60 min at room temperature. Non-specific binding was determined with the addition of the selective, non-competitive mGLUR5 antagonist 2-methyl-6-(phenylethynyl)-pyridine (MPEP, 10 µmol/L) in adjacent sections. After the incubation, and drying, tissues were fixed, desiccated by exposure to paraformaldehyde powder in vacuo overnight 22 and exposed along with [3H] microscales (GE Healthcare, UK) to tritium-sensitive radioluminographic imaging plates (BAS-TR, Fuji-Film, Japan) for five days. After exposition, imaging plates (BAS-TR2025, Fuji-Film) were scanned using BAS 5000 (Fuji-Film). Imaging plates were analyzed using the software ImageGauge 4.0 (FujiFilm). Specific radioactivity was calibrated using the [3H] microscales and measured in regions of interest (as described below). In a separate sample of 5 human brain slices covering the cortex(?) and the cerebellum were analyzed in the presence of 10 nmol/L to 10 mmol/L dithiothreitol (DTT), a reducing agent that disrupts disulfide bonds. DTT was added to the incubation buffer along with 22 nM [3H]ABP688 and autoradiography experiments and analyses proceeded as above.
Analysis of the saturation binding data was calculated by fitting a one site binding model to the specific binding data using the GraphPad Prism 4 Software (GraphPad Software, Inc, San Diego, USA).
Results
Compared to the hippocampus, postmortem data showed that the cerebellar cortex had 20% less mGLUR5 immunoreactivity, whereas [3H]ABP688 autoradiography revealed a 15-fold reduction in receptor density. In vivo [11C]ABP688
Discussion
Although immunohistochemistry supports the presence of cerebellar mGLUR5 protein, autoradiography data showed negligible availability of allosteric binding sites on cerebellum. Distinct mGLUR5 isoforms or conformational state might explain the absence of cerebellar allosteric binding sites. Overall, our data support the proposition that [11C]ABP688 provides quantification of mGLUR5 allosteric binding sites availability in vivo rather than total pool of mGluR5 receptors. The interpretation of molecular imaging agents targeting allosteric such as [11C]ABP688 might take into consideration the regional variability of receptor molecular conformations.
PP01-P05
Adenosine A1 Receptor Imaging with [11C]MPDX PET in mesial temporal lobe epilepsy patients
1Department of neurosurgery, Tokyo Medical and Dental University, Japan
2Positron Imaging Center, Tokyo Metropolitan Institute of Gerontology, Tokyo, Japan
Abstract
Background
Adenosine is an neuromodulator of synaptic functions in the brain. Adenosine exerts anticonvulsive and neuroprotective effect on the adenosine A1 receptor (A1R) by modulating ionic currents postsynaptically and reducing excitatory neurotransmitter release presynaptically. However, It is still unclear that adenosine A1R have anticonvulsive and neuroprotective. To clarify if A1R has any influence on epilepsy, we have developed a novel imaging technique with use of [1-methyl-11C]8-dicyclopropylmethyl-1-methyl-3-propylxanthine (MPDX) and positron emission tomography (PET). MPDX is a first PET tracer useble in human and has high affinity to A1R.
Material and Method
Patients with temporal lobe epilepsy patients (n = 14, mean age = 28.4 y) underwent MPDX PET.
Their PET data were statistically compared to the healthy controls using statistical parametric imaging software. They also underwent PET scanning with [18F]fluorodeoxyglucose (FDG) PET, an indicator of the cerebral metabolism glucose metabolism, and [11C]flumazenil (FMZ), an indicator of neuronal integritiy.
Results
Binding potential of A1R significantly increased among the neocortex other than epileptic temporal lobe. On the other hand, FDG PET and FMZ PET showed abnormality in some area among epileptic temoporal lobe.
Conclusion
A1 adenosine receptor binding potential in the inter-ictal period increased in the cerebral cortex surrounding the epileptic foci. It suggested that A1R system has some role in the restraint mechanism against seizure propagation. In the next study step, we are aiming at verifying the correlation between the clinical findings and MPDX PET.
PP01-P06
First in-human assessment of α4β2 nicotinic acetylcholine receptor (nAChR) availability in response to rewarding food-cues using simultaneous PET-MRI and the α4β2 nAChR ligand (-)-[18F]flubatine
1Dept. of Nuclear Medicine, University of Leipzig, Leipzig, Germany
2IFB AdiposityDiseases, University of Leipzig, Leipzig, Germany
Abstract
Objectives
Cholinergic modulation of basal forebrain and thalamocortical networks has a crucial role in cognitive function such as attention and information processing about salience. This implies that changes in acetylcholine (ACh) transmission may lead to altered behavioral control. The α4β2 nicotinic ACh receptors (nAChRs) are a specific target that can be quantified by means of PET and (-)-[18F]flubatine1 under baseline and for the sensitive assessment of ACh fluctuations2. In order to assess the effects of visual food stimuli on cholinergic activity in vivo, we applied simultaneous PET-MRI with (-)-[18F]flubatine in individuals with obesity (OB) and normal-weight (NW) with high or low disinhibited eating behavior. The primary hypothesis of the study was that α4β2 nAChR availability is higher in OB and high disinhibited eating behavior compared with NW and low disinhibited eating behavior.
Methods
Seventeen healthy individuals with OB (N = 4; 4 females; age 31 ± 2 years; BMI 38 ± 1 kg/m2) and NW (N = 13; 10 females; age 29 ± 7 years; BMI 22 ± 2 kg/m2) were included so far. Disinhibition score was rated based on the three-factor eating questionnaire. Each participant underwent PET-MRI (Siemens Biograph) twice on a separate day in a resting state (rest) and under stimulation (stim). (-)-[18F]flubatine was applied using a bolus-infusion protocol (198 ± 7 MBq) over 165 min with list mode acquisition (0–60 min and 120–165 min p.i.) paralleled by T1 MPRAGE for anatomical co-registration and functional EPI sequences during rest or stim. Distribution volumes VT were estimated as the ratio between mean (−)-[18F]flubatine radioactivity in tissue between 120 and 165 min and free parent (−)-[18F]flubatine in the plasma obtained from venous blood during the same time. During second scan, pictures presenting food-associated cues of different salient information (high and low calorie) were shown 120–135 min p.i. as part of an event-based fMRI task.
Results
As the primary outcome measure, VT for the nucleus accumbens were 10.5 ± 1.8 mL/cm3 in NW and 11.9 ± 0.6 mL/cm3 in OB (p = 0.3, n.s.) and during stim 10.5 ± 1.7 mL/cm3 in NW and 12.0 ± 1.8 mL/cm3 in OB (p = 0.2, n.s.). For the thalamus, corresponding VT were 20.3 ± 2.0 mL/cm3, 21.5.1 ± 0.7 mL/cm3 (p = 0.4, n.s.), 20.7 ± 1.5 mL/cm3, and 23.0 ± 2.3 mL/cm3 (p = 0.08). There was no significant difference between VT under rest vs. stim in both groups.
Conclusions
First data of our ongoing study suggest that a group of individuals with obesity and high disinhibited eating behavior showed a tendency to higher α4β2 nAChR availability (especially in the thalamus when food is presented). Whether this is associated with changes in neuronal activity and dependent on the specific information about salience is currently under investigation. If we are able to confirm these findings together with fMRI data, the study will give new insight into the mechanism by which α4β2 nAChR affects excitatory neurotransmission to the output neurons of the pathways that are critical for cognitive function and reward expectation in humans with the propensity to develop obesity. (The work was supported by the Federal Ministry of Education and Research, Germany, FKZ: 01E01001).
References
PP01-P07
Evaluation of the P-gp- and Bcrp-mediated brain penetration of [18F]FPEB in rodent brain
1Division of Applied RI, Korea Institute of Radiologial and Medical Sciences
Abstract
[18F]FPEB is a potent and specific radioligand for the mGluR5 in the brain. The purpose of this study was to determine whether the brain uptake of [18F]FPEB is influenced by efflux transporters in the rodent brain. For examination of this possible modulation PET studies were performed in pharmacological and genetic inhibition animal models. As a results, P-gp blocked with tariquidal (TQD) caused increment of brain uptake. In the genetic inhibition model induced considerable increase of brain uptake of [18F]FPEB compared with wild type. These studies demonstrated that [18F]FPEB is indeed a substrate of P-gp and that efflux pump modulates its brain uptake, but not Bcrp.
PP01-Q01
Reduced serotonin release in patients with major depression: a PET study with [11C]Cimbi-36 and d-amphetamine challenge
1Neuropsychopharmacology Unit, Dpt of Psychiatry, Division of Brain Sciences, Imperial College London
2University of Oxford, Oxford, UK
3Invicro, London, UK
4King’s College, London, UK
5Rigshospitalet and University of Copenhagen, Denmark
Abstract
Objectives
The “serotonin hypothesis” of clinical depression is almost 50 years old and proposes that diminished serotonergic (5-HT) neurotransmission plays a causal role in the pathophysiology of depression. While some pre-clinical and post-mortem human research is consistent with this hypothesis, it has not been possible, until recently, to measure brain 5-HT fluctuation in the living human brain. We have recently demonstrated that the binding of the 5-HT2A receptor agonist radioligand, [11C]Cimbi-36, is sensitive to increases in extracellular 5-HT induced by an acute d-amphetamine challenge. Here we present the first data comparing brain 5-HT release capacity in patients with major depressive disorder (MDD) to that of non-depressed healthy controls (HC).
Methods
Six medication-free MDDs (3 male, 3 female, 38 ± 11 y.o., BDI scores at screening 30 ± 8, range: 18–40) and 17 HC (all male, 30 ± 8 y.o.), underwent [11C]Cimbi-36 PET before and 3 hours after a single oral dose of d-amphetamine (0.5 mg/kg). Arterial blood samples were collected and a metabolite corrected arterial plasma input function was determined. Dynamic PET data were acquired over 90 minutes and the total volume of distribution (VT) in the frontal cortex (primary region of interest) and the cerebellum was derived using the MA1 model. The frontal cortex binding potential (BPNDfrontal) was calculated as VTfrontal/ VTcerebellum-1. 5-HT release capacity was quantified as Delta-BPND = 1- BPNDfrontal post-dose/ BPNDfrontal baseline. The severity of depressive symptoms among MDDs was rated at baseline using Beck’s Depression Inventory (BDI). BPNDfrontal was compared between baseline and post-dose scans for each group using a paired Student’s t-test. Delta-BPND was compared between MDD and HC group using a Students t-test, and linear regression was used to explore the association between BDI and Delta-BPND in the MDD group. BPND, Delta-BPND, age, and BDI scores are reported as means ± standard deviations.
Results
BPNDfrontal demonstrated a significant reduction in HC group following d-amphetamine administration (14 ± 12%, p = 0.002), whereas no effect was seen in the MDD group (−5 ± 27%, ns). The Delta-BPND, was significantly higher in the HC group (p = 0.029). Delta-BPND in other cortical areas (temporal, parietal and occipital cortices) were consistent with those seen in the frontal cortex (data not shown). There was a trend-level negative association between the baseline BDI scores in the MDD group and frontal cortex Delta-BPND (p = 0.061).

Conclusions
The first direct assessment of 5-HT release in the depressed brain provides support for the “serotonin hypothesis”, demonstrating a reduced 5-HT release capacity in patients with MDD. A larger study will seek to confirm these pilot data and explore the tentative association seen between 5-HT release capacity and severity of depressive symptoms, as well as explore the relationship with clinical response to pharmacological treatment.
PP01-Q02
A genetic polymorphism of HTR1B and serotonin transporter binding measured by PET enable accurate machine learning cassification of MDD and HC
1Department of Psychiatry and Psychotherapy, Medical University of Vienna
2Department of Biomedical Imaging and Image-guided Therapy, Medical University of Vienna
Abstract
Objectives
Single nucleotide polymorphisms (SNPs) associated with serotonergic transmission were demonstrated to impact MDD etiology and pathology.1 Here, we strove for a multivariate classification model for MDD and healthy controls.
Methods
12 patients with MDD and 28 healthy control subjects (HC) were scanned by positron emission tomography to determine serotonin transporter binding potential measured with [11C]DASB. All were genotyped for 5 SNPs within HTR1A and HTR1B genes. The collective and the genotyping technique has been described previously.2 20 cortical and subcortical regions of interest (ROI) were included. ROI with low average binding potential (<0.3) were excluded from the analysis in order not to confound variable importance with random variation that can be expected to be higher in low binding regions. RandomForest (RF) was used in a 5-fold cross-validation (CV) approach in a sequential design, restricting the analysis to ROI predictors or genetic predictors, respectively, as well as with application of the full predictor set. As we did not perform feature selection nor hyperparameter tuning, no nested CV was used. The CV was repeated 10 times and average results are reported.3
Results
Variable importance highlighted the fusiform and superior frontal gyrus as well as the parahippocampus as most discriminative ROI. Among the SNPs, rs130058 of HTR1B contributed the most to the classification results. The models showed balanced sensitivity and specificity. The mean accuracy was 0.84 ( ± 0.05) for ROI predictors only, 0.76 ( ± 0.09) for SNP predictors only and 0.88 ( ± 0.1) for combined predictors.
Conclusion
Our results support a role of rs130058 of the HTR1B gene in MDD and may allow the generation of a computer-aided diagnostic tool for MDD. Regarding the high rates of co-morbidities and difficult differential diagnosis for this most common mood disorder, a reliable classification model with above 0.85 prediction accuracy can be of significant clinical value.
References
PP01-Q03
Imaging the dopamine system with [11C]PHNO PET in recently abstinent tobacco smokers compared to nonsmokers
1Interdepartmental Neuroscience Program, Yale University, New Haven, CT, USA
2Department of Psychiatry, Yale University, New Haven, CT, USA
3Department of Radiology and Biomedical Imaging, Yale University, New Haven, CT, USA
4Yale PET Center, Yale University, New Haven, CT, USA
5Department of Neurology, Yale University, New Haven, CT, USA
6Department of Neuroscience, Yale University, New Haven, CT, USA
Abstract
Objectives
Tobacco smoking continues to be a leading cause of death in the U.S. Nicotine binds to and activates beta2 subunit-containing nicotinic acetylcholine receptors on mesolimbic dopaminergic neurons, which in turn triggers dopamine release in striatal regions. This nicotinic action underlies the reinforcing properties of tobacco smoking1. Most smokers who attempt to quit relapse within two weeks. This may be attributed to deficits in dopamine release, which are also exhibited by recently abstinent alcohol2 and cocaine3 users. The aim of this work was to compare amphetamine-induced dopamine release in recently abstinent smokers and nonsmokers using positron emission tomography (PET) imaging with [11C]PHNO, a D2/3 receptor agonist radioligand. It was hypothesized that abstinent smokers would exhibit lower magnitude striatal dopamine release than nonsmokers.
Methods
Smokers (n = 11, abstinent 5–15 days) and nonsmokers (n = 12) participated in two same-day [11C]PHNO scans. A baseline scan was acquired following bolus injection of [11C]PHNO (495.1 ± 37.3 MBq; 2.2 ± 0.3 μg). Amphetamine (0.5 mg/kg, PO) was then administered three hours before a second [11C]PHNO scan (480.6 ± 39.6 MBq; 2.4 ± 0.3 μg). There were no significant differences in injected mass of [11C]PHNO per kilogram of bodyweight for the baseline scan or in percent change of this measure between baseline and post-amphetamine scans across groups. PET data were analyzed with SRTM2 (reference region: cerebellum) to measure [11C]PHNO binding potential (BPND) in the caudate, putamen, ventral striatum, and pallidum. BPND is the steady state ratio of specifically bound to free tracer, which is proportional to D2/3 receptor availability. BPND was measured at baseline and post-amphetamine. Percent change in BPND (%ΔBPND) before and after amphetamine, an indirect measure of dopamine release, was calculated per region of interest (ROI) per subject. Differences in baseline BPND and %ΔBPND were tested using two 2-way ANOVAs with smoking status and ROI as between- and within-subjects factors, respectively. The two-stage Benjamini, Krieger, and Yekutieli (BKY) false discovery rate (FDR) correction for multiple comparisons was performed.
Results
Data reflect mean ± SEM. ‘Trending’ lower baseline BPND was observed in abstinent smokers compared to nonsmokers in the ventral striatum (nonsmokers: 4.10 ± 0.2, smokers: 3.71 ± 0.2, p = 0.06). Further, the magnitude of %ΔBPND, indicative of amphetamine-induced dopamine release, was significantly lower in abstinent smokers than nonsmokers in the ventral striatum (nonsmokers: 27.71 ± 1.7%, smokers: 20.06 ± 4.0%, p = 0.01); ‘trending’ differences emerged in the putamen (nonsmokers: 17.66 ± 1.5%, smokers: 12.59 ± 1.6%, p = 0.09). No differences in baseline BPND nor %ΔBPND were observed in the caudate and pallidum.

Conclusions
These preliminary findings are consistent with previous results showing lower D2/3 receptor availability in striatal regions of smokers compared to nonsmokers4, and are in line with evidence of lower magnitude dopamine release in individuals with other addictive disorders compared to controls5. Our findings suggest that deficits in dopamine release exist during tobacco smoking withdrawal, which may underlie difficulty in quitting smoking.
References
PP01-Q04
Dopamine D2/3receptor availability in obese and normal weight cocaine use disorder individuals as measured by [11c](+)PHNO PET
1PET Center, Department of Radiology and Biomedical Imaging, Yale University
2Dept. of Psychiatry, Yale University
3Dept. of Neurology, Yale University
Abstract
Background
Previous positron emission tomography (PET) work by our group with the dopamine D3-preferring ligand [11C](+)PHNO has shown that binding is higher in obese (OB) individuals as compared to normal weight controls and is positively correlated with body mass index (BMI) (1). This pattern was observed in D3-rich brain regions implicated in reward, including the substantia nigra/ventral tegmental area (SN/VTA), ventral striatum (VS) and pallidum. In cocaine use disorder (CUD), similar increases in [11C](+)PHNO binding have been observed in the SN/VTA relative to healthy controls (2,3,4). To date, however, it is unknown whether BMI-receptor relationships are preserved in individuals with CUD. Thus, we examined D2/3R availability in OB vs. non-obese (NOB) individuals with CUD as measured by [11C](+)PHNO PET.
Methods
NOB CUD subjects (mean BMI = 24; N = 13) were compared to age-matched OB CUD subjects (mean BMI = 35; N = 14). All subjects underwent [11C](+)PHNO PET scans on a High Resolution Research Tomograph scanner. Regions of interest (ROIs) investigated included the amygdala, caudate, hypothalamus, pallidum, putamen, SN/VTA, thalamus and VS. Parametric images were computed using the simplified reference tissue model with cerebellum as the reference region. [11C](+)PHNO measures of receptor availability were calculated and expressed as non-displaceable binding potential (BPND).
Results
No significant differences in D2/3R availability were observed between OB and NOB CUD subjects in any of the investigated ROIs. In contrast, BMI was significantly negatively correlated with D2/3R availability in the SN/VTA (r = −0.39, p = 0.05 uncorrected for multiple comparisons) in all CUD subjects (N = 27). This contrasts with our previous findings in non-CUD OB individuals (N = 14) where D2/3R availability was higher in SN/VTA (20%; p = 0.02), VS (14%; p < 0.01), and pallidum (11%; p = 0.02) as compared to normal weight controls (N = 14). Similarly, BMI was positively correlated with D2/3R availability in SN/VTA (r = 0.34, p = 0.03), VS (r = 0.36, p = 0.02), and pallidum (r = 0.30, p = 0.05) across all non-CUD subjects (N = 42).
Conclusion
These data suggest that relationships between D2/3Ravailability and obesity or BMI are either absent/obscured in CUD or possibly negatively related in SN/VTA, respectively. This stands in contrast to previous findings in otherwise healthy individuals with OB. Findings suggest that D3 dysregulation by the combination of disordered food and drug intake is more complex than predicted by simple summative models.
PP01-Q05
Antipsychotic discontinuation in first-episode psychosis: a prospective study with [18F]DOPA and [11C]raclopride PET
1Dept. of Psychiatry, Seoul National University College of Medicine
2Dept. of Neuropsychaitry, Seoul National University Bundang Hospital
Abstract
Objectives
Psychotic disorders include various kinds of mental illnesses and each psychotic disorder is believed to have a different underlying neurobiology. Nonetheless, the treatment of psychotic disorders is based on dimensional approach with antipsychotic drugs.
Recent meta-analysis revealed that elevated presynaptic striatal dopaminergic function is a robust feature of psychotic disorders. It is not surprising that antipsychotic drugs, which primarily block dopaminergic neurotransmission, are mostly effective in the treatment of psychosis and prevention of relapse. However, prolonged exposure to antipsychotic drugs can cause several side effects which can cause serious effects in patients' quality of life.
Therefore a key issue is how long the antipsychotic treatment should be maintained in first episode psychosis, which necessitates developing biomarkers to predict psychotic relapse after antipsychotic discontinuation in first episode psychosis.we aimed to evaluate the relationship between dopaminergic dysfunction and psychotic relapse after antipsychotic discontinuation in patients with first episode psychosis.
Methods
We recruited 26 patients with first episode psychosis and 14 healthy controls. We measured presynaptic dopamine synthesis capacity using [18F]DOPA PET before and after antipsychotic discontinuation in first episode psychosis. The postsynaptic D2 receptor densities were measured with [11C]raclopride PET after antipsychotic discontinuation. Heathy controls had [18F]DOPA and [11C]raclopride scans according to the corresponding schedule. The psychotic relapse was determined 6 months after antipsychotic discontinuation in patients with first episode psychosis.
Results
The demographic data was not different between healthy controls and patients with first episode psychosis. The relapse rate was around 50% at 6 months after antipsychotic discontinuation. The demographic data did not differ according to whether the patients relapsed or not. Ki values from [18F]DOPA PET were not different before and after antipsychotic discontinuation. However, relapsed patients showed significantly lower Ki values (Week: F = 1.467, df = 1,418.9, p = 0.226; Relapse: F = 2.061, df = 2,418.9, p = 0.129; Week*Relapse: F = 4.444, df = 2,418.9, p = 0.012). Binding potentials from [11C]raclopride PET were not significantly different between healthy controls, patients with relapse and patients without relapse (Relapse: F = 1.402, df = 2,32.000, p = 0.261).
Conclusions
The dopaminergic activity may predict psychotic relapse in remitted first episode psychosis after antipsychotic discontinuation.
References
PP01-Q06
Fear conditioning induces dopamine release in the human striatum
1Department of Psychology, Stockholm University, Stockholm, Sweden
2Department of Clinical Neuroscience, Karolinska Institutet, Stockholm, Sweden
3Department of Neuroscience, Uppsala University, Uppsala, Sweden
4Department of Psychology, Uppsala University, Uppsala, Sweden
5Department of Nuclear Medicine and PET, Uppsala University, Uppsala, Sweden
Abstract
Objectives
Animal studies suggest that dopamine transmission is crucial for aversive learning. However, studies on the importance of dopamine release in human fear conditioning are lacking. The aim of the present study was to investigate dopamine release in the striatum during fear conditioning. We hypothesized that dopamine release would increase as a function of fear conditioning.
Methods
Eighteen volunteers participated. Positron emission tomography data were collected for 90 minutes using the radio-tracer [11C]raclopride. Fifty minutes post bolus injection (p.i.), participants underwent a 20 minute differential fear conditioning paradigm, pairing one cue (CS+) with an aversive electrical shock while another cue (CS-) was never paired with a shock. Specific [11C] raclopride binding potential in the caudate nucleus and putamen during baseline before conditioning (30–50 minutes p.i.) was subtracted from binding post conditioning (70–90 minutes p.i.) and used as a measure of change in dopamine levels. Skin conductance response (SCR) to CS+ minus CS- served as the autonomic fear conditioning index.
Results
Binding potential of [11C]raclopride was reduced with 5.1% in the caudate and 5.4% in the putamen following fear conditioning.
Conclusions
Findings suggest that fear conditioning stimulates dopamine release in the striatum. These results are relevant for understanding dopaminergic mechanisms in fear and anxiety.
PP01-Q07
Association of dopamine D1-type receptors in prefrontal cortex with cognitive impulsivity: Impact of methamphetamine use
1Integrative Brain Imaging Center, National Center of Neurology and Psychiatry, Japan
2University of California, Irvine
3Veterans Affairs Greater Los Angeles Healthcare System
4University of California, Los Angeles
Withdrawn
PP01-R01
Imaging corticotrophin releasing factor (CRF) and nociceptin receptor (NOP) interactions with [11C]NOP-1a and PET
1Department of Radiology, University of Pittsburgh, United States
2Department of Psychiatry, University of Pittsburgh, United States
Abstract
Objectives
An imbalance between neuropeptides that promote stress and resilience such as CRF and nociceptin has been postulated to lead to relapse in individuals with substance use disorders. Consistent with this notion, [11C]NOP-1A studies by our group have shown increased NOP receptor availability in individuals with cocaine use disorder compared to controls. The objective of this study was to develop a paradigm to image the in vivo interaction between CRF and NOP in humans. [11C]NOP-1A PET was used to measure the in vivo binding to NOP receptors before and after an acute intravenous hydrocortisone challenge. We hypothesized that hydrocortisone-induced increases in brain CRF will result in increased NOP receptor availability, as detected by higher [11C]NOP-1A receptor binding. Such a finding would suggest that one of the brain's adaptive responses to counteract increased CRF/stress is to enhance downstream nociceptin signaling via increasing the number of NOP receptors1.
Methods
[11C]NOP-1A and PET were used to measure the in vivo binding to NOP receptors, once at baseline (BASE) and once 3.5 hours following an acute 1 mg/kg intravenous hydrocortisone challenge (POST-CORT) in 19 healthy controls (9 males and 10 females). [11C]NOP-1A total distribution volume (VT) in regions of interest (ROI) including the amygdala, hippocampus, midbrain, cerebellum, striatal (ventral striatum, caudate and putamen), and prefrontal cortical (anterior cingulate, dorsolateral, orbitofrontal, and medial prefrontal cortex) subdivisions were measured using a two-tissue compartment kinetic analysis with a metabolite-corrected arterial input function. The primary outcome measure was hydrocortisone-induced change in VT (ΔVT) calculated as (VT POST-CORT-VTBASE)/VT BASE.
Results
There were no significant differences in [11C]NOP-1A injected dose (BASE 12.3 ± 1.3 and POST-CORT 12.7 ± 1.2 mCi), injected mass (BASE 2.7 ± 0.9 and POST-CORT 2.3 ± 0.8 mg), and plasma clearance (BASE 142 ± 36 and POST-CORT 168 ± 49 L/h) between the conditions. The hydrocortisone challenge increased baseline plasma cortisol levels by ∼ 7-fold. [11C]NOP-1A VT was significantly higher in the POST-CORT compared to BASE condition (linear mixed model, condition, p = 0.005; region, p < 0.001, condition*region, p < 0.001, see graph 1). Independent paired t-tests in all eleven ROI examined were statistically significant, and survived the false discovery rate (FDR) multiple comparison correction. Hydrocortisone-induced ΔVT was negatively correlated with BASE VT in the ROIs. This inverse relationship survived the FDR correction in the ventral striatum (r2 = 0.41), caudate (r2 = 0.34), putamen (r2 = 0.37), and amygdala (r2 = 0.30).

Conclusions
NOP receptor availability (VT) increased following an acute intravenous hydrocortisone challenge. The magnitude of this increase in subjects was inversely related to their baseline NOP receptor availability. Pending further validation, the [11C]NOP-1A -hydrocortisone imaging paradigm provides an opportunity to examine CRF-NOP interactions in health and disease. The results of this study also suggest that the increased NOP receptor availability previously reported in individuals with cocaine use disorders is an adaptive response to stress-induced increases in cortisol, and by extension CRF.
Acknowledgements
National Institute on Drug Abuse
Reference
PP01-R02
Changes in cerebral glucose metabolism and neuroinflammation in young females with functional somatic syndrome: a PET study
1Dept. of Neurology, National Epilepsy Center, NHO Shizuoka Institute of Epilepsy and Neurological Disorders, Japan
2Dept. of Biofunctional Imaging, Preeminent Medical Photonics Education & Research Center, Hamamatsu University School of Medicine, Japan
3Dept. of Psychiatry, Hamamatsu University School of Medicine, Japan
4Dept. of Pediatrics, National Epilepsy Center, NHO Shizuoka Institute of Epilepsy and Neurological Disorders, Japan
Abstract
Objectives
Functional somatic syndrome (FSS) is characterized by various clusters of persistent somatic symptoms that are difficult to be accounted for in its etiology. In Japan, the incidence of a certain number of patients who suffered from various somatic symptoms after human papillomavirus (HPV) vaccination drew attention socially and medically. Although clinical features are well explored so far in FSS, the pathophysiology of the syndrome remains unclear. Our present study focused on changes in cerebral glucose metabolism and neuroinflammation in FSS young females by examining these aspects with positron emission tomography (PET) to disclose its pathophysiology.
Methods
We evaluated cerebral glucose metabolism and neuroimmflamation quantitatively in twelve FSS females with a history of HPV vaccination (FSS group: mean age ± SD, 19.3 ± 1.5 years) using PET with [18F]FDG and [11C]DPA713. Twelve normal females (Control F: mean age ± SD, 32.8 ± 9.5 years) underwent [18F]FDG PET scan and 16 normal females (Control D: mean age ± SD, 20.6 ± 1.6 years) underwent [11C]DPA713 PET scan. The standardized uptake value (SUV) of [18F]FDG was divided by the whole brain SUV to generate the SUV ratio (SUVR) image. The binding potential (BPND) values of [11C]DPA713 were estimated with the simplified reference tissue model using PMOD software. Statistical Parametric Mapping analysis was used to compare the [18F]FDG SUVR images between the FSS and control F groups voxelwise, and to compare the [11C]DPA713 BPND images between the FSS and control D groups. The present study was approved by the ethics committee of our university and the imaging center. Written informed consent was obtained from all participants.
Results
Significant reduction in [18F]FDG uptake was found in the deep brain regions particularly in the grey matter surrounding the third ventricle, bilateral mesial temporal region and tegmentum of midbrain and pons. In contrast, significant increase of [11C]DPA713 binding was found in the diffuse whole brain regions, highlighted in the grey matter surrounding the third ventricle, thalamus, hippocampus, amygdala, temporal lobe, midbrain, pons, the medulla and cerebellum in the FSS group. An interesting finding was that the third ventricle grey matter, mesial temporal and brainstem were regions commonly highlighted with glucose hypometabolism and increased microglial activation. A close look at the extent of two measures showed wider distribution of increased [11C]DPA713 binding than that of glucose hypometabolism in the FSS brain.
Conclusions
Our study showed that both cerebral glucose hypometabolism and neuroinflammation were present in the regions covering the limbic and brainstem reticular activating systems in the FSS group. This provides a new insight that the dysfunction of the neural network in these consciousness- and emotion-related brain regions, which may account for various behavioral and emotional symptoms, is one of the pathophysiology of FSS.
Reference
PP01-R03
Effects of chronic alcohol self-administration on striatal phosphodiesterase 10A availability
1Department of Neurosciences, KU Leuven; Experimental Neurology and Leuven Brain Institute (LBI), Leuven, Belgium
2Center for Brain & Disease Research, Laboratory of Neurobiology, VIB, Belgium, Leuven, Belgium
3Department of Nuclear Medicine and Molecular Imaging, University Hospitals Leuven, Belgium; MoSAIC, Molecular Small Animal Imaging Center, KU Leuven, Leuven, Belgium
4Department of Imaging and Pathology, KU Leuven, Leuven, Belgium
5Radiopharmaceutical Research Laboratory, KU Leuven, Leuven, Belgium
Abstract
Objectives
Phosphodiesterase 10A (PDE10A) is a dual substrate enzyme highly enriched within dopaminoreceptive striatal medium spiny neurons, which are involved in several psychiatric disorders such as drug addiction. Preclinical studies suggested the involvement of PDE10A in neuronal and behavioral responses to alcohol intake and preference (1–2). However, little is known about the effects of alcohol exposure on PDE10A enzymatic activity.
Here, we performed a longitudinal microPET [18F]JNJ42259152 study to directly evaluate changes on PDE10A availability in rats subjected to different stages of alcoholization.
Methods
Nine adult Wistar rats were monitored over a 10 week alcohol abuse reinstatement model. During the first six weeks, animals were subjected to an alternating 24-hour access two-bottle-choice paradigm to induce alcohol consumption (3), where experimental solution bottles containing 20% ethanol were replaced by water bottles every other day. Subsequently, rats underwent two weeks of forced withdrawal, followed by a week of relapse.
Alcohol preference, calculated as the ratio between alcohol and water consumption, was used as outcome. Animals who reported an alcohol preference ≥30% during the first phase of the model were defined as alcohol-preferring rats.
Dynamic 60-minute PDE10A [18F]JNJ42259152 microPET scans were performed in the same animals at alcohol exposure week 2, 4 and after one week of relapse. In order to evaluate the effects of 6 weeks of alcohol exposure, a sham control group of 9 rats was added to the experiment. Parametric PDE10A BPND images were generated using a Logan reference tissue model with the cerebellum as reference region (4). BPND images were anatomically standardized to Paxinos space and analyzed using volume-of-interest and voxel-based approach with a flexible factorial design in SPM12.
Results
Animals consumed on average 4.4 ± 2.5 g/kg alcohol per 24-hour session with an average alcohol preference of 19 ± 9%. The latter increased over time (P < 0.0001) with significantly higher preference during the third (32 ± 14%) and sixth (22 ± 7%) week of alcohol exposure, and during the short relapse period (33 ± 19%), compared to the first week (P = 0.009).
The first two weeks of alcohol exposure resulted in an increased striatal PDE10A binding (12 ± 16%), as compared to controls (Figure A). Comparing the parametric maps after 4 weeks of alcohol exposure with those after 2 weeks of exposure, SPM analysis showed a decreased PDE10A availability in a cluster located in the bilateral caudate-putamen and nucleus accumbens (PFWE-corrected:0.02–0.003). This striatal PDE10A decrease was mostly present in alcohol-preferring rats (range alcohol preference: 30–70%). A similar regional decrease in PDE10A availability towards normalization was observed after one week of relapse (PFWE-corrected:0.002–0.008) (Figure B).

Conclusions
We showed that chronic alcohol self-administration induces a reversible increased PDE10A enzymatic availability in the striatum that is related to higher alcohol preference. Taken together, these data provide further evidence that PDE10A mediated signaling plays an important role in modulating the reinforcing effects of alcohol, suggesting that inhibition of PDE10A may have beneficial behavioral effects on alcohol intake.
References
PP01-R04
Hypometabolism and metabolic connectivity in internet gaming disorder and alcohol use disorder
1Dept. of Nuclear Medicine, Seoul National University Boramae Medical Center, Republic of Korea
2Dept. of Psychiatry, Seoul National University Boramae Medical Center, Republic of Korea
3Dept. of Psychiatry, Seoul St. Mary's Hospital, The Catholic University of Korea College of Medicine, Republic of Korea
Abstract
Internet gaming disorder (IGD) has become the subject of growing concern as an addictive behavior resulting from compulsive and uncontrolled, excessive use of internet games. Although IGD does not directly involve intoxicating substances, patients with IGD show loss of control, lack of inhibition, reward system problems, craving, and psychological problems, leading to clinically significant social dysfunction. Many neuroimaging studies have shown that IGD have altered function or functional connectivity in frontal and striatal regions, which are associated with inhibition and loss of executive control and in sensory regions, associated with sensory information. However, neurobiological metabolic alterations in IGD have not been clearly elucidated. In this study we aim to explore regional metabolic differences and metabolic connectivity by FDG-PET, as a marker of brain function of IGD compared with alcohol use disorder (AUD) and healthy control (HC).
We used 18F-FDG PET to investigate differences in glucose metabolism and metabolic connectivity in young men [36 patients with IGD, 26 patients with alcohol use disorder (AUD), and 39 healthy controls]. We conducted a voxel-wise group comparison analysis to investigate significant differences in regional glucose metabolism. And we explored metabolic connectivity within the whole brain using ROI-based connectivity using AAL template.3 Age, BDI and BAI scores were included as nuisance variables.
Compared with the HCs, the IGD showed hypometabolism in the anterior cingulate cortex, right superior temporal gyrus, left temporal pole, left striatum, left inferior frontal gyrus, left superior parietal lobule, and right precentral gyrus and the AUD exhibited hypometabolism in the left superior occipital cortex, right inferior parietal lobule, and left middle temporal cortex (Figure A). Furthermore, negative correlations were observed between the anterior cingulate cortex and duration of internet gaming and between the orbitofrontal cortex and impulsivity score in the IGD. Compared with healthy controls, IGD had lower metabolic connectivity with prefrontal regions in temporal, striatal and limbic and between the motor area and occipital region. And the AUD showed greater metabolic connectivity between the frontal and parietal or occipital regions, and between the parietal and temporal regions, but lower metabolic connectivity between the prefrontal and limbic regions (Figure B)
These results suggest that regional metabolic changes in IGD might be related to the neurobiological or pathophysiological characteristics and addiction-related dysfunction through metabolic connectivity in IGD. Although it is unclear whether the increase or decrease in cerebral glucose metabolism is a primary consequence of the addiction itself or a secondary reaction to compensate for addiction-induced brain damage, our results suggest that the changes in glucose metabolism in the ACC are likely to be related to the state marker in IGD. That is, the decreased metabolism in the ACC may change during the course of IGD, and altered metabolic connectivity of limbic regions, including the ACC, OFC, temporal and striatal regions may share some characteristics, during the course of IGD, with those of AUD.

PP01-R05
Brain aromatase imaging and human personality
1RIKEN Center for Biosystems Dynamics Research, Japan
2Institute of Biomaterials and Bioengineering, Tokyo Medical and Dental University, Japan
Abstract
Aromatase, an enzyme that converts androgens to estrogens, has been reported to be involved in several brain functions, including synaptic plasticity, neurogenesis, neuroprotection, and regulation of sexual and emotional behaviors in rodents, pathophysiology of Alzheimer’s disease and autism spectrum disorders in humans. Animal experiments also showed the involvements of aromatase to aggressive or depressive behaviors. To investigate the association between aromatase and human personality traits, we performed a positron emission tomography (PET) study in 21 healthy subjects using 11C-cetrozole, which has high selectivity and affinity for aromatase. Before performing PET scans, subjects answered the Buss-Perry Aggression Questionnaire and Temperament and Character Inventory to measure their aggression and personality traits, respectively. High accumulation of 11C-cetrozole was detected in the thalamus, hypothalamus, amygdala, and medulla. Males showed tendency to have higher aromatase expression in these brain regions than females. Females showed associations between aromatase levels in subcortical regions, such as the amygdala and supraoptic nucleus of the hypothalamus, and personality traits such as aggression, novelty seeking, and self-transcendence. In contrast, males exhibited associations between aromatase levels in the cortices and harm avoidance, persistence, and self-transcendence. The association of aromatase levels in the thalamus with cooperativeness was common to both sexes. The present study suggests that there might exist associations between aromatase in the brain and human personality.
PP01-R06
Increased microglial activation in Attention-deficit/hyperactivity disorder: a [11C]PK11195 PET study
1Dept. of Psychiatry, Hamamatsu University School of Medicine, Japan
2Yamaguchi University, Japan
3Dept of Biofunctional Imaging, Preeminent Medical Photonics Education & Research Center, Hamamatsu University School of Medicine, Japan
4Hamamatsu Photonics KK, Japan
5Hamamatsu Medical Photonics Foundation, Japan
Abstract
Attention-deficit/hyperactivity disorder (ADHD) is one of major neurodevelopmental disorders characterized by inattentiveness and hyperactivity/impulsivity. Although a lot of genetic, clinical, and neuroimaging studies in ADHD have been reported, the precise neurobiological mechanisms underlying this disorder remain poorly understood. Biochemical studies on peripheral cytokines suggested possibility of altered immunological process in ADHD. Recently, neuroinflammation in central nervous system (CNS) has been reported to be involved in the pathophysiology of many psychiatric disorders. Especially, a number of studies have focused on a role of activated microglia in the neuroinflammatory response in a living human brain. Previous in vivo positron emission tomography (PET) studies have revealed elevated microglial activation in other psychiatric and developmental disorders (e.g. Alzheimer’s disease, Autism spectrum disorder, Major depressive disorder, and Obsessive-compulsive disorder). To test a contribution of activated microglia to the pathophysiology of ADHD, by employing PET measurement.
We investigated the microglial activation in individuals with ADHD compared with healthy subjects and any associations between the microglial activation and severity of ADHD symptoms. We recruited drug-naive individuals with ADHD (mean age ± SD, 30.3 ± 7.0 years old) and age- and sex- matched healthy subjects (30.2 ± 6.6years old). All participants underwent PET measurement with radioligand [11C]PK11195. Binding potential (BPND) of [11C]PK11195 was estimated based on the simplified reference tissue model. We examined the whole brain using a voxel-wise analysis, SPM8 (Wellcome Department of Cognitive Neurology, London, UK). We assessed symptom severities by using Conner’s adult ADHD rating scale (CARRS), Wechsler adult intelligence scale 3rd edition (WAIS-III), and cognitive tasks for sustained attention, spatial working memory, and response inhibition from the Cambridge neuropsychological test automated battery (CANTAB).
We tested a potential difference between microglial activation in the adults with ADHD and those in the healthy subjects and investigated any associations between the microglial activation and severity measures of ADHD. Our study might propose the involvement of activated microglia in the pathophysiology of ADHD and specific role of activated microglia on severity of ADHD symptoms.
PP01-R07
Endogenous opioid release capacity in adult ADHD patients: a pilot study with PET and [11C]carfentanil
1Dept. of Neuroscience, Brighton and Sussex Medical School, University of Sussex, UK
2Centre for Psychiatry, Brain Sciences, Imperial College London
3Department of Child and Adolescent Psychiatry, IoPPN, King's College London
4Social Genetic and Developmental Psychiatry, IoPPN, King's College London
5Invicro London
6Centre for Neuroimaging Sciences, IoPPN, King’s College London
Abstract
Objectives
Psychostimulant medications such as dexamphetamines are the most commonly used and effective treatment for Attention-Deficit/Hyperactivity Disorder (ADHD). We have previously demonstrated, using the selective Mu-Opioid receptor (MOR) radioligand [11C]carfentanil that the administration of the stimulant dexamphetamine (d-AMPH) induces the release of endogenous opioids (EO) in healthy human subjects, in brain regions implicated in reward, motivation, and affective regulation1,2. In this pilot study, we compared stimulant-induced endogenous opioid release and baseline MOR availability, of ADHD adults to that of healthy controls (HC). We hypothesised that EO neurotransmission is altered in ADHD.
Methods
Five adult men with ADHD [Median age (range): 33 (38–47) years], drug abuse and medication-free, and 20 age-matched healthy male volunteers underwent two [11C]carfentanil PET scans, once before and once 3 hours following a 0.5 mg/kg oral dose of d-AMPH to measure baseline MOR availability and endogenous opioid release. Regional binding potential (BPND) values were derived using a simplified reference tissue model with the occipital cortex as the reference region. Baseline [11C]carfentanil BPND, and differences in BPND between baseline and post-amphetamine scans (ΔBPND), in predefined frontal and limbic grey matter-masked regions of interest, were compared between ADHD and controls using Repeated Measures ANOVA.
Results
We found reduced baseline [11C]carfentanil BPND in ADHD relative to healthy adults in frontal (dorsolateral, medial, orbitofrontal) regions (uncorrected p < 0.01), cingulate and hippocampus (uncorrected p < 0.05). Amphetamine-induced [11C]Carfentanil ΔBPND was reduced in the posterior cingulate (uncorrected p < 0.01) and anterior cingulate (uncorrected p < 0.05), and trend-level reduced in the medial frontal cortex (uncorrected p = 0.08)
 .
.
Conclusions
These preliminary findings suggest blunted stimulant-induced opioid release in regions of the mesolimbic reward system in adult ADHD. Similar observations have been previously made in patients with behavioural and substance addictive disorders3,4. These alterations might underlie known ADHD deficits in reward processing and motivation, and vulnerability to addiction, that are co-mediated by the opioid system. If confirmed in a larger cohort, these findings might implicate the endogenous opioid system as a novel neurotransmitter system involved in ADHD, with critical relevance to its pathophysiology and therapeutic mechanisms of stimulants.
References
PP02-J01
PET imagingof tau deposition in tauopathy model mice with [18F]PM-PBB3
1National Institutes for Quantum and Radiological Science and Technology, Japan
Abstract
Objective
Tau pathology is a hallmark of Alzheimer’s disease and other neurodegenerative disorders. [18F]PM-PBB3 is an analogue of our previously reported tau PET ligand, [11C]PBB3, and has been developed as a radioprobe for high-contrast imaging of diverse tau deposits in humans and animal models. In this study, we aimed to determine a method to quantify [18F]PM-PBB3 binding in the brains of rTg4510 mice overexpressing human tau proteins with a familial tauopathy mutation. We then examined age- and gender-dependent alterations of [18F]PM-PBB3 bindings in these mice. Methods: Seventy-six rTg4510 mice consisting of 37 males aged 2.0–12.3months and 39 females aged 1.8–11months and their 14 non-transgenic littermates consisting of 10 males aged 2.7–9.9 monthsand 4 females aged 6.5–8.6 monthswere used. All mice underwent 60-minute dynamic PET scans and volumetric MRI. PET images were merged to individual MRI images and regions of interest were determined in the neocortex, hippocampus, striatum and cerebellum to obtain regional time-activity curves (TACs). Regional distribution volume ratios (DVRs) were estimated from TACs by Logan’s graphical analysis with the cerebellar TAC as a reference tissue input. As a handier binding index, standardized uptake value ratio (SUVR) was also quantified by calculating an averaged radioactivity ratio between the target region to the cerebellum at 40–60 minutes post-injection. One of the female rTg4510 mice aged 7.6 months underwent [11C]PBB3-PET 5 days after [18F]PM-PBB3-PET to compare in-vivo performances of these radioligands. PM-PBB3 fluorescent labeling and immunohistochemical staining with AT8, an anti-phospho-tau antibody, were also conducted using brain sections collected from the scanned animals to further validate the specificity of the radioligand binding.
Results
SUVR at 40–60 min and DVR were in good agreement with each other (y = 1.082 x–0.106, R2 = 0.974). SUVR values of [18F]PM-PBB3 were 1.6-fold higher than those of [11C]PBB3 in the corresponding regions. SUVRs of [18F]PM-PBB3 in neocortex and hippocampus of female rTg4510 mice became significantly higher than those of non-tg mice from 5 months of age, which was 1-month earlier than changes in males. [18F]PM-PBB3 binding in rTg4510 mice of both genders subsequently increased with age, and was intimately correlated with local brain atrophy. Fluorescence labeling of neuronal aggregates with PM-PBB3 in brain sections derived from scanned mice were well overlapped with AT8-positive tau deposits, and were correlated with SUVR in the corresponding region estimated by [18F]PM-PBB3-PET.
Conclusion
We established a feasible method to quantify tau depositions in a living tauopathy model using [18F]PM-PBB3-PET. The current non-clinical PET imaging system would provide a powerful tool for evaluation of candidate anti-tau therapeutics.
PP02-J02
Establishment of a simplified method to quantify [18F]PM-PBB3 ([18F]APN-1607) binding in the brains of living human subjects
1National Institute of Radiological Sciences, National Institutes for Quantum and Radiological Science and Technology
2Dept. of Psychiatry, Jikei University School of Medicine
3Dept. of Neurology, Graduate School of Medicine, Chiba University
4Neurology Clinic Chiba
Abstract
Aim
PET imaging with [18F]PM-PBB3 (a.k.a.[18F]APN-1607) has demonstrated the capability of this radioligand for high-contrast visualization of tau deposits in the brains of Alzheimer’s disease (AD) and diverse other neurodegenerative disorders. Though it is desirable to perform sufficient duration of a dynamic PET scan to estimate accurate non-displaceable binding potential (BPND), imaging over 1 hour is impractical for a clinical setting. This study was aimed at optimizing a protocol for a 20-min static emission scan to obtain a reliable target-to-reference ratio of radioligand concentrations in comparison with analytical models with dynamic scan data and an arterial input function.
Methods
Ten subjects consisting of 5 healthy controls (HCs) and 3 AD and 2 progressive supranuclear palsy (PSP) patients underwent dynamic PET scans over 150 or 180 minutes with a break between 60 and 90 min or 120 min after intravenous injection of [18F]PM-PBB3. Serial arterial blood samples were withdrawn during the scan to determine a metabolite-corrected plasma input function. Regional time-activity curves were analyzed with 1 - and 2-tissue compartment models (TCMs) and Logan’s graphical analysis (LGA). Time-stability of total distribution volume (VT) values was examined to estimate scan duration sufficient for robust determination of VT. BPND of [18F]PM-PBB3 was calculated using VT obtained with LGA with the cerebellum as a reference. An averaged target-to-cerebellum ratio in a 20-min frame beginning at different time points after radioligand injection was calculated as standardized uptake value ratio (SUVR). SUVR-1 values were then compared with BPND to determine an optimal time frame to initiate the static scan.
Results
A peak [18F]PM-PBB3 SUV in the brain approximated 2.5 at < 5 minutes, followed by rapid radioactivity washout. Radioligand retentions in the lateral temporal cortex of AD patients and midbrain of PSP patients were characteristically increased relative to HCs. All radiometabolites in plasma were polar than unmetabolized [18F]PM-PBB3. The parent fraction was decreased gradually to 20% at 60 min and 9% at 150 min. Two-TCM better described the radioligand kinetics in target regions than 1-TCM. VT values obtained with LGA presented the highest time-stability, and SUVR-1 values at 90–110 min showed higher correlation with BPND than any other time frame.

Conclusions
[18F]PM-PBB3 showed reversible binding kinetics, which could be described without radiometabolite compartments in the brain. Estimation of SUVR at 90–110 min can be employed as a simplified means to quantify the radioligand retention with sufficient robustness.
PP02-J03
[18F]MK-6240 PET identifies neurofibrillary tangle pathology in prodromal alzhiemer’s disease patients from a phase 3 (APECS) trial
1MRL, Merck & Co., Inc., Kenilworth, NJ, USA
2Bioclinica, Newark, CA, USA
Abstract
Objectives
A recent trial with the β-site APP cleaving enzyme 1 (BACE1) inhibitor verubecestat was associated with poorer clinical outcomes compared with placebo in prodromal Alzheimer’s disease (AD) patients. This study reports evaluation of [18F]MK-6240, a selective 2nd generation tau PET tracer (1,2) in a subset of AD patients enrolled in the APECS study trial.
Methods
Thirteen participants (55–87 y old, 3 females and 10 males) with prodromal AD/amnestic mild cognitive impairment due to AD were randomized to receive 12 or 40 mg verubecestat or a placebo. Each participant underwent a 30 min (80–110 min post-tracer injection) brain PET scan after intravenous injection of ∼185 MBq [18F]MK-6240 at 52 weeks post-treatment. PET scans were obtained at multiple sites, but centrally collected and quality controlled by Bioclinica. The image processing including motion correction, spatial coregistration to 3D T1 MRI, normalization and smoothing were performed consistently across subjects. Cortical and subcortical SUVRs were calculated with cerebellar gray matter as reference. Correlations were performed with age and cognitive scores.
Results
In all patients, cortical and/or subcortical distribution of [18F]MK-6240 signal were observed in typical brain regions known for neurofibrillary tangle accumulation with SUVR ranging from 1 to > 3. In this limited sample size, higher SUVRs at both global and regional levels tended to correlate with worse cognitive scores. The SUVRs correlated negatively with age with younger subjects showing higher brain signal. There was no significant difference in SUVRs between three treatment groups.
Conclusions
Since [18F]MK-6240 PET can characterize neurofibrillary tangle pathology with high detection sensitivity, the observed distribution patterns suggest that the enrolled prodromal subjects were at different stages on the AD pathological continuum. Use of [18F]MK-6240 appears feasible in AD longitudinal trials, offering the potential to more precisely define study populations and assess disease progression.
References
PP02-J04
11C-PBR28 and 18F-AV-1451 PET findings in semantic variant frontotemporal dementia
1Nantz National Alzheimer Center, Stanley H. Appel Department of Neurology, Houston Methodist Research Institute, Houston, TX, USA
2Department of Neurology, Weill Cornell Medicine, Cornell University, NY, USA
3Department of Neurology, UT Health, Houston, TX, USA
Abstract
Objetives
Semantic dementia (SD) or semantic variant of frontotemporal dementia is a progressive naming disorder with atrophy in the anterior portion of the left temporal lobe most often associated with longTAR DNA-binding protein (TDP)-43-positive neuropil threads and dystrophic neuritis (type C), and only rarely due to a primary tauopathy. However patients with SD show elevated uptake of the tau PET tracer 18F-AV-1451 in anterior temporal regions. This uptake could be related to non-specific binding, perhaps caused by inflammation, as SD is associated with a propensity for autoimmune disease and increased inflammation in peripheral blood. We studied whether there was an association between [18F]AV-1451 uptake and inflammation, measured with the TSPO tracer 11C-PBR28, in anterior temporal regions.
Methods
Six SD patients, all PET amyloid-negative, had 11C-PBR28 and 18F-AV-1451 PET. Fourteen healthy controls underwent 11C-PBR28 PET (10 controls) or 18F-AV-1451 PET (8 controls). Patients (4/6 women, mean age 69 ± 8.5 years) did not differ significantly in age from the controls (10/18 women, mean age 69 ± 6.7 years). The VT values for 11C-PBR28 were calculated at the regional level with a Logan plot and a metabolite-corrected arterial input function. The SUV ratio over the cerebellar gray matter for 18F-AV-1451 was calculated for t = 80–100 min. All images were corrected for partial volume effect. A linear regression analysis was performed of VT and SUVr values in the 64 hemispheric cortical regions of the Hammer’s atlas.
Results
Compared to controls, patients showed increased VT and SUVr values in left temporal regions, and in anterior right temporal lobe (p < 0.05), as well as in regions of the orbitofrontal cortex adjoining anterior temporal cortex (p < 0.05). However, the distribution of 18F-AV-1451 SUVr and 11C-PBR28 VT differed in these regions. The uptake of 18F-AV-1451 was higher in the anterior portion of the left temporal lobe, while the uptake of 11C-PBR28 that was higher in posterior left temporal lobe and orbitofrontal cortex.
Conclusions
Although 18F-AV-1451 and 11C-PBR28 were increased in similar regions, the distribution in these regions differed for each tracer. Therefore, inflammation does not explain the 18F-AV-1451 signal in semantic dementia. Our findings leave the door open for neurobiological processes other than inflammation, such as binding to TDP-43 Type C aggregates, to explain the increased 18F-AV-1451 SUVr values in anterior temporal regions in semantic dementia.
PP02-J05
Regional changes in the type 1 cannabinoid receptor are associated with cognitive dysfunction in Parkinson's disease
1Nuclear Medicine and Molecular Imaging, University Hospitals Leuven, Leuven, Belgium
2Department of Imaging and Pathology, KU Leuven, Belgium
3Department of Old Age Psychiatry, University Psychiatric Centre, KU Leuven, Belgium
4Department of Neurosciences, KU Leuven, Belgium
5Department of Neurology, University Hospitals Leuven, Belgium
Abstract
Objectives
Parkinson's disease (PD) can be considered a multisystem disease rather than a pure movement disorder, comprising various behavioral and psychiatric manifestations such as sleep disturbances, anxiety, depression, psychotic symptoms and cognitive deficits occurring even in early stages (1). The endocannabinoid system plays a regulatory role in a number of physiological functions, including motor control but also mood, emotion and cognition. A number of preclinical studies in experimental PD models demonstrated that modulating the type 1 cannabinoid receptor (CB1R) may improve motor symptoms and components of cognitive processing (2). However, the relation between CB1R, cognitive decline and behavioural symptoms has not been investigated in PD patients so far.
The objective of this study was to examine whether regional CB1R availability is associated with measures of cognitive and behavioural function in PD patients.
Methods
A total of 38 PD patients (14 F/24 M; age 63.7 ± 8.7 years; MMSE 28.3 ± 2.9), with a diagnosis according to the UK Parkinson's Disease Society Brain Bank criteria, underwent a 60 min [18F]MK-9470 PET scan (180 ± 20 MBq) on a HiRez Biograph16 PET-CT camera to assess CB1R availability. A group of 10 age- and gender-matched healthy subjects (4 F/6 M; age 59.2 ± 11.7 years; MMSE 29.0 ± 1.2) were used as control group. Parametric maps of CB1R availability were calculated using modified standardized uptake values (mSUV) (3).
All PET processing procedures were automatically performed using the brain PNEURO tool of PMOD v3.7. All subjects also underwent MR imaging for volumetric grey matter assessment. Neuropsychological symptoms were evaluated using an extensive cognitive and behavioural battery covering the five cognitive domains (episodic memory, executive functioning, attention/working memory, visuospatial function, language function), depression, anxiety, apathy and psychiatric complications. Voxel-wise correlation analyses were assessed using SPM12 (Pheight < 0.001; Kext > 200 voxels), controlling for age and disease duration.
Results
PD patients showed cognitive impairment in episodic memory, executive functioning, speed and mental flexibility (range P: 0.003–0.03), which was associated with a decrease in CB1R availability in predominantly the midcingulate cortex and middle to superior frontal gyrus (Tpeak-level > 4.0) (Figure A). Also, PD patients with more severe visuospatial dysfunction showed decreased CB1R availability in a wide cluster in the precuneus, midcingulate cortex (Tpeak-level = 5.5), supplementary motor cortex, inferior orbitofrontal gyrus and thalamus (Tpeak-level > 4.6) (Figure B). No relationship was found between CB1R availability and mood or behavioural symptom scores.

Conclusions
Decreased CB1R availability in the prefrontal and midcingulate cortex in PD patients is strongly correlated with disturbances in executive functioning, episodic memory and visuospatial function. Further investigation of regional CB1R expression in groups of PD patients with mild cognitive impairment or dementia is warranted in order to further investigate the role of CB1R expression in different levels of cognitive impairment in PD.
References
PP02-J06
Effect of age, gender and BMI on in-vivo CB1 receptor availability in humans measured with [11C]OMAR PET
1Dept. of Psychiatry, Yale University School of Medicine, USA
2Dept. of Radiology and Biomedical Imaging, Yale University School of Medicine, USA
Abstract
Objectives
Cannabinoid 1 receptor (CB1R) is the most abundant G-protein-coupled receptor in the brain, and plays a critical role in the regulation of autonomic tone, appetite, mood and cognition. Multiple in-vivo PET imaging studies using different ligands have yielded discrepant results for the effects of age, gender and body mass index (BMI) on CB1 receptor availability in humans (1–5). The purpose of this work was to examine these factors in the largest study to date with a CB1 receptor ligand.
Methods
67 healthy individuals (
Results
The sample comprised of 50 male (mean age = 30.82 ± 8.76 years, range = 18–55 years, mean BMI = 27.95 ± 5.63, range = 20.4–42.4) and 17 females (mean age = 29.00 ± 7.82 years, range = 21–47 years, mean BMI = 25.21 ± 4.42, range = 20.1–35.3). The injected activity dose was 565.73 ± 130.61MBq (15.29 ± 3.53mCi) and mass dose was 0.04 ± 0.03 μg/kg. There were significant effects for age x ROI (F(18,63) = 3.02, p < 0.001) and gender x ROI (F(18,63) = 2.31, p = 0.006), but not BMI. VT was higher in females compared to males across all ROIs (mean absolute difference = 5%, range = 1.3–8.9%). There was a significant effect of age on VT in caudate (r = −0.26, p = 0.04; relative change per decade (RCD) = −6%), pallidum (r = −0.28, p = 0.02; RCD = −7%), and posterior cingulate (r = −0.27, p = 0.03; RCD = −7%). Gender x ROI interaction was driven by greater regional effect among males.
Conclusions
The study found significant age effects on regional CB1 availability and significant gender x ROI interaction. A previous study using [18F]MK-9470 (n = 50)(1) found higher CB1 with age only in women. Gender differences were smaller in this larger sample compared to earlier studies (2,3). In contrast, another work (4), found 41% higher CB1 availability in males using [18F]FMPEP-d2 (n = 22). The association between BMI and CB1 availability in hypothalamus and brainstem using [18F]MK-9470 (5) (n = 26) was not replicated. Although the reasons for these divergent findings are unclear, the choice of tracer (2) and range of BMI in the current dataset likely contributes to our observed differences.
References
PP02-J07
Metabolism of astrocyte in the patients of multiple sclerosis investigated by 1-C-11 acetate PET
1Dept. of Nuclear Medicine and Tracer Kinetics, Osaka University Graduate School of Medicine, Japan
2Dept. of Neurology, Osaka University Graduate School of Medicine, Japan
3Dept. of Neurology, Toyama University Hospital, Japan
Abstract
Multiple sclerosis (MS) is an inflammatory disease of the central nervous system causing axonal degeneration. Reactive astrocytes have been reported to contribute the pathological process of MS. 1-C-11 acetate PET has been suggested to visualize reactivity of astrocyte in vivo. This study aimed to evaluate metabolism of reactive astrocyte in brain of the patients with MS by using quantitative 1-C-11 acetate PET.
Method
The eight patients with MS and the 10 normal controls (NC) underwent MRI and 1-C-11 dynamic PET. For the purpose of measurement of input function, arterialized-venous blood was repeatedly sampled. The efflux rate (k2) of 1-C-11 acetate was calculated based on one tissue compartmental model, which reportedly reflected the metabolic rate of 1-C-11 acetate. Fractional anisotropy (FA) was also acquired to evaluate the integrity of neuronal tracts. The parametric images of the k2 and FA were statistically compared in voxel-based fashion between MS and NC.
Results
The k2 of MS was significantly higher than that of NC in both white matter (p = 0.003) and gray matter (p = 0.02). In addition, White matter/gray matter ratio of the k2 was significantly higher in MS than in NC (p = 0.02). Significant FA reduction was found in MS compared with NC (p = 0.009). Voxel based statistical analysis showed a significantly increased k2 in MS almost exclusively on the neuronal fiber tracts as well as significantly decreased FA in MS. As for tract-based distributions of the significant pathological change in the parameters, moderate concordance was found between the k2 and FA (kappa = 0.432, p = 0.02).
Conclusions
The present study clarified that pathological changes in relation to astrocytic reactivation in MS patients could be visualized by quantitative 1-C-11 acetate PET.
PP02-J08
Modulation of metabolic network activity with deep brain stimulation in Parkinson’s disease
1PET Center, Department of Nuclear Medicine, Huashan Hospital, Shanghai Medical College, Fudan University, Shanghai 200040, China
2Department of Neurosurgery, 904 Hospital of People's Liberation Army, School of Medicine, Anhui Medical University, 101 Xingyuan Road, Wuxi, 214044, Jiangsu, People's Republic of China
Abstract
Objectives
Subthalamic (STN) deep brain stimulation (DBS) has proven to be an efficient treatment for Parkinson disease (PD). Functional imaging with 18F-FDG PET has been applied to discover PD-related cerebral metabolic networks that are associated with disease evolvement and underlying therapeutic outcomes. However, the discoveries concerning metabolic network changes with STN DBS in PD patients remained unclear.
Methods
We investigated two independent cohorts of subjects with 18F-FDG PET imaging in this study. The cohort 1 was comprised of 33 PD patients and 33 healthy controls recruited from Huashan Hospital, Shanghai, China. The scans from cohort 1 were used for the identification of a region-of-interest(ROI)-based PD-related cerebral metabolic pattern (PDRP). The cohort 2 included 9 PD patients and 9 healthy controls recruited from 904 Hospital, Wuxi, China. Each PD patient from cohort 2 underwent bilateral STN DBS implantation. Four of the 9 patients were scanned 3 times with 18F-FDG PET imaging (preoperative baseline, 3 months post-operation and 12 months post-operation), while the other 5 patients were scanned twice (pre-operation and 3 months post-operation). Imaging data from the cohort 2 were used to assess the effects of clinically effective STN DBS on the PDRP metabolic modulation in PD patients. Moreover, graphical network measures of inter-ROI coherence were analyzed for PD patients from cohort 2 and were subsequently compared among each follow-up timepoint.
Results
Pattern analysis of individual 18F-FDG PET imaging in cohort 1 identified ROI-based PDRP with the first principal component, which accounted for 17.99% of subject×voxel variance. This pattern was characterized by relative metabolic increase in the putamen, pallidum, caudate, thalamus, cerebellum and pons, associated with metabolic decrease in the posterior parietal-occipital cortices (Fig.1A). Scores of PDRP expression were abnormally elevated in PD patients from cohort 1 compared with corresponding healthy subjects (P < 0.001; two-sample t-tests; Fig.1B) and correlated with UPDRS motor ratings in PD patients (r = 0.624, P < 0.001; Spearman correlations; Fig.1C). For the PD patients from cohort 2, trend of UPDRS motor rating and prospectively computed PDRP scores at three timepoints (preoperative baseline, 3 months post-operation and 12 months post-operation) exhibited significant changes in activity over time (UPDRS: F(2,6) = 11.101, P = 0.010; PDRP: F(2,6) = 10.596, P = 0.011; RMANOVA). Indeed, we observed a significant decrease in UPDRS (P = 0.028, post hoc test; Fig.1D) and PDRP scores (P = 0.039, post hoc test; Fig.1E) from baseline to the second timepoints, but a slight increase between the second and third timepoints (UPDRS: P = 0.016, Fig.1D; PDRP: P = 0.094, Fig.1E; post hoc test). Moreover, the graphical network analysis demonstrated the small-worldness coefficient (S) for PD patients from cohort 2 was a decrease from baseline to the second timepoint, but an increase between the second and third timepoints (baseline: S = 1.877; 3 months post-operation: S = 1.667; 12 months post-operation: S = 2.016), with sparsity threshold at 25%.

Conclusions
The effective therapeutic outcomes of STN DBS in PD patients were associated with the metabolic modulation of network dysfunction in the cortico-striatopallido-thalamo-cortical neurocircuitry. While the network abnormality was significantly corrected by STN DBS at early stage after surgery, the long-term effects of this intervention were likely to be less promising.
PP02-J09
Diagnostic implications of neuronal network diaschisis in patients with Parkinson’s disease
1Neurosciences Research Center (NSRC), Tabriz University of Medical Sciences, Tabriz, Iran
2Department of Nuclear Medicine, Odense University Hospital, Odense, Denmark
3Dementia Clinic, Department of Neurology, Odense University Hospital, Odense, Denmark
4Department of Clinical Research, Faculty of Health Sciences, University of Southern Denmark, Odense, Denmark
5Neurosciences Research Center, Tabriz University of Medical, Sciences, Tabriz, Iran
6Department of Neuroscience, Panum Institute, University of Copenhagen, Copenhagen, Denmark
Abstract
Aim
We tested the claim that neuronal network diaschisis has diagnostic manifestations in patients with Parkinson’s disease.
Materials and methods
Ten patients with Parkinson’s disease (PD) diagnosed according to ICD-10 criteria (mean age 67.5 years, range 61–75, 3 women) under targeted pulsed electromagnetic field(tPEMF) therapy were included. Ten neurologically healthy individuals (HI) (mean age 62.5 years, range 43–75, 5 women) served as controls. Dedicated 3D-segmentation software (ROVER, ABX, Germany) provided total hemispheric glucose metabolism ratio indices (THGr) for cerebellum (Cb) and cerebrum (Ce). We applied a previously developed network diaschisis test from patients with Alzheimer’s disease (AD) or mild cognitive impairment (MCI) to the current group of patients.
Results
THGr values of forebrain of patients with PD differed significantly from values of the HI group (p = 0.028) with medians of THGr(Ce) of 0.91 (0.38–0.97) and 0.97 (0.65–0.99). Also, THGr values of hindbrain of patients with PD differed significantly from values of the HI group (p = 0.056) with medians of THGr(Cb) of 0.77 (0.33–0.99) and 0.84 (0.75–0.96). The network diaschisis test provided 100% (Ce) and 86% (Cb) positive predictive values (PPVs) for PD, and 80% negative predictive value (NPV) for neurologically healthy brains.

Conclusion
The network diaschisis test identified patients with PD and control HI with 100% PPV and 80% NPV, respectively. We also found that the lateralized glucose metabolism index of cerebellum alone had 86% PPV for PD. THGr is a straightforward measure of disconnection in human brain neuronal networks of patients with PD.
PP02-J10
Lipopolysaccharide increases translocator protein availability and impairs memory function in healthy volunteers
1Department of Psychiatry, Yale University School of Medicine, New Haven, CT, USA
2U.S. Department of Veterans Affairs National Center for Posttraumatic Stress Disorder, Clinical Neurosciences Division, VA Connecticut Healthcare System, West Haven, CT, USA
3Department of Radiology and Biomedical Imaging, Yale University School of Medicine, New Haven, CT, USA
4Cogstate, Ltd. and The Florey Institute of Neuroscience and Mental Health, University of Melbourne, Australia
Abstract
Objectives
Neuroimmune challenges, such as lipopolysaccharide (LPS), that activate microglia and increase proinflammatory cytokines have been shown to impair cognitive function, especially memory function, in rodents1,2. However, tasks that probe rodent memory are confounded by hedonic motivation (e.g., fear learning) and locomotion (e.g., Morris Water Maze)3, factors independently affected by immune challenges4. In humans, memory findings are mixed5–7; likely due to LPS dose-response effects5. Moreover, human studies to date have suggested, but have not measured, in vivo neuroimmune responses. Herein, we used an established PET imaging paradigm to quantify LPS-induced changes in 18 kDa translocator protein levels (TSPO; a neuroimmune marker associated with microglia8,9) in healthy humans. We hypothesized that LPS would increase whole-brain TSPO levels and impair memory function.
Methods
In one day, healthy volunteers (N = 14; 12M, M = 25yrs) completed two Cogstate cognitive batteries and two 120-minute [11C]PBR28 PET scans (1-minute bolus); one before and one 3-hours after LPS administration (1.0 ng/kg IV). The [11C]PBR28 radiotracer binds to TSPO8–10. Arterial blood was acquired to measure the metabolite-corrected input function. Volume of distribution (VT) was calculated using multilinear analysis–1 for 10 regions of interest (ROIs; t* = 30 min)11. Cogstate is a battery of computerized cognitive measures, including visual and verbal memory, working memory, and psychomotor processing speed12. LPS effects on [11C]PBR28 VT were evaluated using a repeated-measures analysis of covariance (rmANCOVA), controlling for rs6971 genotype (which alters [11C]PBR28 binding affinity13; Bonferroni-corrected). LPS effects on Cogstate performance were evaluated using a rmANOVA (Bonferroni-corrected). Exploratory partial correlations, controlling for rs6971 genotype, were conducted to evaluate relationships between LPS-induced change in ROI [11C]PBR28 VT and Cogstate performance (p < .05; uncorrected).
Results
Radiotracer activity and injected mass did not differ between pre-LPS and post-LPS scans (ps > .50). LPS challenge significantly increased [11C]PBR28 VT across all ROIs (ps < .01; range: 30–50% increase; Bonferroni-corrected; Figure 1A). LPS challenge also impaired performance on measures of verbal learning, verbal recall, and visual learning/memory (ps < .05; range: 9–23% decrement; Bonferroni-corrected; Figure 1B), but did not affect attention, working memory, or psychomotor processing speed (ps > .10). Partial correlations indicated that greater LPS-induced increases in hippocampal TSPO availability were significantly associated with greater decreases in verbal learning (r = -.68, p = .014; Figure 1C). LPS-induced TSPO increases in the putamen exhibited a ‘trend-level’ relationship with verbal learning decreases (r = -.57, p = .056; Figure 1D).

Conclusions
Our findings indicate LPS robustly increased whole-brain TSPO availability, signifying a neuroimmune response, and concurrently impaired verbal learning, verbal recall, and visual learning/memory performance: cognitive processes associated with hippocampal function14,15. LPS challenge did not significantly affect working memory, attention, or psychomotor processing speed. Partial correlations suggest that greater neuroimmune response in the hippocampus was linearly associated with greater decrements in verbal learning. These preliminary findings suggest memory function is selectively impaired by a whole-brain neuroimmune challenge. Future research is needed to investigate these effects in clinical populations and evaluate the potential utility of anti-inflammatory medications.
References
PP02-J11
Graph analysis of 18F-AV1451 PET data in elderly normal subjects
1Laboratory for cognitive neurology, department of neurosciences, KU Leuven, Belgium
2Radiopharmaceutical Research, department of pharmaceutical and pharmacological sciences, KU Leuven, Belgium
3Nuclear Medicine and Molecular Imaging, Department of Imaging and Pathology, KU Leuven, Belgium
4Neurology, UZ Leuven, Belgium
Abstract
Objectives
To perform a graph analysis of the network constructed from tau PET data in healthy subjects and to identify regions that can be considered the major hubs of the network.
Methods
40 elderly cognitively normal subjects (17 male) aged between 59 and 83 years (mean +/- std: 71.8 +/- 5.7 years) were included. Subjects underwent a dynamic PET with 18F-AV1451 on a Siemens Biograph PET-CT (mean injected activity: 182 MBq) and a structural MRI on a 3T Philips. After correction for small movements, the summed image of the first 5 min was used to coregister PET and MRI data. Based on the MRI, all frames were warped into MNI space. SUV images between 60 and 100 min were calculated. Based on the segmentation of the structural MRI, a partial volume correction (Muller-Gartner) was applied. We used the Brainnetome atlas1 to define 232 cortical and subcortical regions, which served as the nodes of the network. Tau uptake in each node was defined as the ratio of the median value of the PVC corrected SUV image in that node and the mean value in the superior cerebellar cortex (reference region). The weight of the connection between nodes was defined as the correlation coefficient between tau uptake in these nodes across subjects. Only positive correlations were used. Weights for connections with a negative correlation (which occurred mainly between cortical and subcortical regions), were set to 0. We considered both weighted graphs and binary graphs with densities ranging from 5%–30%. For each node we calculated the hub score which is the sum of dummy values (0 or 1) for four criteria based on whether the node belongs to the top 20% of nodes 1) showing the highest degree, 2) showing the lowest path length, 3) showing the lowest local cluster coefficient and 4) showing the highest betweenness centrality. Hubs were those nodes that had a hub score of 4 across a range of densities.
Results
From these 40 subjects, 6 subjects showed a higher tau uptake in at least three nodes based on outlier detection, mainly caudal hippocampus, fusiform and inferior temporal gyrus.
Graph analysis identified a number of hubs in the tau PET based network: bilateral orbital gyrus (Brodmann area 13), precuneus (area 31), and left superior (medial area 10) and middle (area 9/46) frontal gyrus, left fusiform gyrus (area 37), right inferior parietal lobule (area 40) and the cingulate gyrus (area 32), all areas that also showed high 18F-AV1451 retention. Unexpectedly, precentral gyrus (area 4) and left postcentral gyrus (area 1/2/3) also fulfilled the pre-set hub criteria despite low tracer binding in these regions.
Conclusions
Graph analysis of a tau PET based network is able to identify major hubs and these hubs correspond partly with known regions vulnerable for tau pathology in AD.
Reference
PP02-J12
Sensitivity of mGluR5 PET in diagnosing Alzheimer’s disease severity
1Division of Applied RI, Korea Institute of Radiological and Medical Sciences, Korea
2Department of Nuclear Medicine, Inha University Hospital, Inha University, Korea
3Division of Radiation Effects, Korea Institute of Radiological and Medical Sciences, Korea
4Department of Nuclear Medicine, Gangnam Severance Hospital, Korea
Abstract
Early diagnosis of Alzheimer’s disease (AD) requires understanding of the mechanism underlying synaptic neurotransmission change with disease progression. Specifically, glutamate is the most abundant neurotransmitter and plays an important role in synaptic plasticity. In terms of AD, the metabotropic glutamate receptor 5 (mGluR5) is highly affected by amyloid pathology. Therefore, to further elucidate the role of mGluR5 in AD model, we performed serial behavioral tests, longitudinal imaging studies, and histopathological immunoassay on both the 5xFAD (n = 15) mouse model of AD and age-matched wild-type mice (WT, n = 15). We found the 5xFAD mice to show severe hyperactivity and memory impairment starting at 7 months of age. In addition, mGluR5 positron emission tomography (PET) revealed that while WT mice showed similar binding values over time, those in 5xFAD mice fluctuated from 5 months of age. Furthermore, 5xFAD mice presented a 35% decrease in their cortical and sub-cortical area binding values at 9 months of age when compared to those at 3 months of age. These changes were also observed in both the MRS and histopathology data. From these perspectives, mGluR5 PET could successfully detect mGluR5 synaptic change in this AD mouse model and it may serve as a sensitive in vivo imaging indicator of AD. Further, our understanding of mGluR5 PET will be applied to determine the appropriate intervention time in AD.
PP02-J13
Discrepancy in cerebrovascular and cerebrometabolic phenotype between two mouse models of Alzheimer’s disease
1Department of Pharmacology, Physiology & Neuroscience, Rutgers, The State University of New Jersey, USA
2Patricia and John Rosenwald Laboratory of Neurobiology and Genetics, The Rockefeller University, New York, USA
3Citigroup Biomedical Imaging Center, Department of Radiology, Weill Cornell Medicine, New York, New York, USA
Abstract
Alzheimer’s disease (AD) is a fatal neurodegenerative disorder with complex pathogenesis leading to neuron loss, cognitive impairment and behavioral abnormalities. Vascular perturbations and cerebral hypometabolism have recently emerged as important components of the disease. These abnormalities have shown much promise as diagnostic targets, with various in vivo imaging modalities being designed to detect decreased cerebral perfusion and hypometabolism in AD patients. Transgenic mice are the primary animal model for human Alzheimer’s disease and several imaging modalities have also been employed in these mice with mixed results. As studies are often heterogenous with respect to imaging techniques and animal models, we evaluated two commonly used AD mouse strains under identical conditions. Arterial spin labeling was used to measure cerebral blood flow, dynamic contrast enhanced MRI to measure blood volume, and 18F-FDG-PET to measure cerebral glucose metabolism. Results revealed disparate findings in these two strains, with both displaying important aspects of the disease. Specifically, TgCRND8 mice showed decreased blood flow and metabolism with no change in blood volume compared to control mice whereas Tg6799 mice showed no change in metabolism but a significant increase in blood volume and a biphasic pattern of early hypoperfusion followed by a rebound to normoperfusion in late disease. These findings provide new implications for the use of these animals as models and also provide new insights into disease progression with respect to cerebrovascular disturbances.
PP02-J14
Correlation between neuronal function measured by FDG PET and synaptic density measured by 11C-UCB-J PET in Alzheimer’s disease
1Dept of Radiology and Biomedical Imaging, Yale University, USA
2Dept of Psychiatry, Yale University, USA
Abstract
Objectives
11C-UCB-J is a specific PET ligand for synaptic vesicle glycoprotein2A(SV2A) and a potential biomarker for synaptic density. Previously, we found significant reduction (∼40%) of hippocampal SV2A binding in Alzheimer’s disease(AD) compared to age-matched cognitively normal(CN) participants1. We also found a good correlation between 11C-UCB-J and FDG in the hippocampus and susceptible regions in the same AD and CN participants. Here we explore the use of the simplified SUVratio(SUVR) to cerebellum(CB) reference for 11C-UCB-J in correlation with SUVR of FDG.
Methods
Nine AD and 8CN participants were enrolled for 11C-UCB-J and FDG PET scans on the HRRT. All AD participants were Aβ+ by 11C-PiB from amnestic mild cognitive impairment(MCI, n = 4) to mild dementia(n = 5). CN participants were all Aβ–. SUV images(60–90 min) were generated for 11C-UCB-J and FDG. Multiple ROIs were taken using AAL and FreeSurfer(FS) templates from individual MRI: hippocampus, caudate, putamen, thalamus, entorhinal, anterior and posterior cingulate, and frontal, temporal, parietal, and occipital cortices. Regional SUVRs were calculated with the CB as reference region. Separate comparisons of regional SUVRs for 11C-UCB-J and FDG between AD and CN groups were performed with two-tailed, unpaired t-test with P < 0.05 for significance. Correlation of SUVs between AAL and FS ROIs and correlation of SUVRs between 11C-UCB-J and FDG were analyzed with Pearson correlation coefficients(R).
Results
There was an excellent correlation between SUVs from FS and AAL in most cortical regions for 11C-UCB-J and FDG (R = 0.96–0.99), with the SUVs from FS ROIs being higher than SUVs from AAL for both tracers. Using FS ROIs with CB reference, we found significant reduction of 11C-UCB-J SUVR in the hippocampus (16.0%, P < 0.004), thalamus (10.1%, P < 0.01), and posterior cingulate (7.3%, P < 0.05) of AD compared to CN. In contrast, we found significant reduction of FDG SUVRs in the hippocampus (16.2%, P < 0.003), posterior cingulate (11.5%, P < 0.05), entorhinal (15.7%, P < 0.006) and temporal cortices (11.2%, P < 0.05) in AD, but not in the thalamus (3.8%, P = 0.4). There was an overall good correlation (R > 0.5 with P < 0.05, n = 17) between FDG and 11C-UCB-J SUVRs with higher R in the hippocampus (R = 0.93), caudate (R = 0.90), posterior cingulate (R = 0.84), entorhinal (R = 0.76), temporal (R = 0.84), and parietal cortices (R = 0.79). There was no significant correlation between FDG and 11C-UCB-J SUVRs found in the thalamus (R = 0.44,P > 0.05). The correlation values between 11C-UCB-J and FDG were larger than our previous findings using centrum semiovale as reference.

Conclusions
We demonstrated significant reduction of 11C-UCB-J SUVRs in the hippocampus, thalamus and posterior cingulate of AD. The simplified SUVRs for 11C-UCB-J with no arterial blood sampling could provide a reliable alternative for large scale clinical trials in AD. There was an overall better correlation between 11C-UCB-J and FDG using SUVRs with the same CB reference region, which could be due to lower noise from a larger reference region or artifactual correlation by using the same region. Further exploration in a large scale cohort study is needed to better elucidate these relationships and their significance in AD pathophysiology.
Funding
Dana Foundation, NIHP50AG047270, R01AG52560.
Reference
PP02-J15
Brain PET-retina reflectance correlation for the presence of amyloid deposits in normal and Alzheimer’s disease human subjects
1McConnell Brain Imaging Centre, MNI, McGill University, Canada
2Optina Diagnostics, Montreal, Canada
3Médecine nucléaire, Hôpital Maisonneuve-Rosemont, Montreal, Canada
4Translational Neuroimaging Laboratory, McGill Centre for Studies in Aging, Douglas Mental Health University Institute, Montreal, Canada
5Neurologie, Hôpital Maisonneuve-Rosemont, Montreal, Canada
6MoCA Clinic and Institute, Greenfield Park, Canada
7Alzheimer’s Disease Research Unit, McGill University Research Centre for Studies in Aging, Montreal, Canada
Abstract
Background
Failures of treatment protocols in patients with Alzheimer’s disease (AD) presenting at an advanced stage make it clear that therapy cannot be expected to be effective in the presence of extensive neural tissue damage. Populations of subjects in early clinical phases of the disease or even in the pre-clinical stages of the Alzheimer’s continuum should instead be targeted. Diagnosis in such patients cannot be reliably based on clinical assessment only, and requires the demonstration of the presence of one or more AD biomarker(s).
Abnormal levels of brain beta amyloid (Ab) is a reliable marker of AD. Direct demonstration by PET imaging using radiopharmaceuticals binding specifically to amyloid plaques is a powerful tool to ascertain if a cognitively normal/near-normal subject is on the way to developing clinical AD. However, PET imaging with those agents is costly and not widely applicable, and an accessible, inexpensive approach to identify amyloid positive subjects at early stages could simplify clinical trials of new AD therapies by reducing the number of cerebral PET amyloid studies necessary to recruit cognitively normal, Ab positive cases through pre-selection of such subjects. Here, a non-invasive retina (an extension of the central nervous system) imaging approach is evaluated as a mean to identify biomarkers correlating with the cerebral load of amyloid plaques determined with PET.
Methods
We studied 45 subjects (16 probable AD cases, 29 age-matched controls), 53 to 85 years, without retinal disease or significant ocular media opacity. Hyperspectral retinal reflectance measurements were obtained. Image texture analysis of the spatial/spectral dimensions over segmented vessels generated 16 usable parameters. An AI classifier was trained using 112 datasets (1–3 per subject) to establish the predictive value of those parameters, based on cerebral amyloid status determined from binary reads by 3 expert raters of 18F-Florbetaben PET studies. A leave-one-out approach determined sensitivity/specificity values of the method. Vascular metrics such as vessel tortuosity and diameter were also evaluated in the retinal images for possible correlation with cerebral amyloid status.
Results
Consistent with literature reports, 2/16 clinically probable AD cases were amyloid negative, while 5/29 cognitively normal subjects were amyloid positive. Retinal scanning results correspondence with PET amyloid status was high, independently of cognition, using texture features extracted from retinal vessels (sensitivity: 84%, specificity: 86%). The arteriolar diameter and the arteriovenous ratio were statistically different between the amyloid negative and positive subjects, but not between clinical AD and control cases.
Conclusions
Using a machine learning approach to classify results of a non-invasive hyperspectral retinal imaging technique which does not require amyloid labeling, we were able to reliably predict cerebral amyloid PET status. This technique could thus serve as a screening tool to identify subjects in the early stages of the AD continuum, for instance in a drug development context. We are currently testing this approach and other retinal measures in additional subjects. We are also working on deconvolutive approaches which should make it possible to study patients with conditions such as cataracts, a not infrequent occurence in the age group of interest for AD evaluation.
PP02-J16
Novel tau-PET tracer 18F-s16 combined with amyloid deposition and hypometabolism in tauopathies disease
1Department of PET/CT Diagnostic,Tianjin Medical University General Hospital, China
2Department of Neurology, Tianjin Medical University General Hospital, China
3Key Laboratory of Radiopharmaceuticals, Ministry of Education, Beijing Normal University, China
Abstract
Objectives
Aggregated tau protein is a major neuropathology to the pathophysiology of neurodegenerative diseases such as Alzheimer’s disease (AD), behavioural variant frontotemporal dementia (BvFTD), semantic dementia (SD), progressive supranuclear palsy (PSP) and corticobasal degeneration (CBD). The recent development of selective in vivo tau positron emission tomography (PET) imaging ligands have provided information about the role of tau in the early phases of neurodegenerative diseases. In this study, we have presented a novel tracer 18F-S16(18F-(S)-1-(4-(6-(dimethylamino)quinoxalin-2-yl)phenoxy)-3- fluoropropan-2-ol), for the in vivo tau-PET imaging. Based on the success preclinical study results reported by Prof. Cui [1], we have established an optimized automated radiosynthesis method of 18F-S16, finished its stability (in vivo and in vitro) tests, partition coefficient determination, biodistribution study in healthy mice and the first-in-human evaluation. In this study, we used 18F-S16 (tau), 11C-PiB (β-amyloid) and 18F-FDG (glucose metabolism) to assessed the spatial relationship among in vivo tau pathology, amyloid distribution, and hypometabolism in tauopathies disease using multimodal PET imaging techniques.
Methods
We included twelve subjects, including seven patients and five age mached normal controls. In the patient group, we enrolled two AD, two BvFTD, one SD, one PSP and one CBD. All of these subjects underwent 18F-S16, 11C-PiB and 18F-FDG PET scan, and neuropsychological testing. Voxel-wise statistical analysis was used for FDG analysis by using Statistical Parametric Mapping software. The kinetic evaluation of 11C-PiB and 18F-S16 uptake was performed by using the software package PMOD (version 3.7, PMOD Technologies Ltd., Zurich, Switzerland). We calculated non-displaceable binding potential (BPND) of global cortex and generated parametric maps. We calculated (Pearson) correlations between SUVRs in each modality across 30 predefined brain regions for each subject[2].
Results
Tau pathology was primarily observed in brain regions related to clinical symptoms and overlapped with areas of hypometabolism. In contrast, β-amyloid deposition was diffusely distributed over the entire cortex in AD, but negative in BvFTD and the other 3 diseases. There was a strong negative association between 18F-S16 and 18F-FDG uptake (Pearson’s r = 0.52 ± 0.09, p < 0.001).

Conclusions
We conclude that the pathological aggregation of tau is closely linked to patterns of neurodegeneration and clinical manifestations of tauopathies disease. These findings further underline the excellent characteristics of 18F-S16 for PET imaging of tau in vivo.
References
PP02-J17
In vivo alterations in tau deposition and neuroinflammation in Alzheimer spectrum disorders
1Department of Biofunctional Imaging, Hamamatsu University School of Medicine
2Department of Neurology, Shizuoka Institute of Epilepsy and Neurological Disorders
3Department of Psychiatry, Hamamatsu University School of Medicine
4Department of Functional Brain Imaging Research, National Institute of Radiological Sciences, National Institutes for Quantum and Radiological Science and Technology
Abstract
Objective
Besides β-amyloid, tau and neuroinflammation are worth noticing as pathological culprits in Alzheimer’s disease (AD), which are well delineated in many biomarker imaging studies, However, it remains unclear about the mutual relationship among tau deposition, neuroinflammation and clinical manifestations within the same patients. The purpose of the present study was to clarify this unsolved issue using positron emission tomography (PET).
Methods
Twenty AD spectrum disorder patients (mild cognitive impairment (MCI) and early AD) and age-matched twenty cognitively healthy controls underwent a series of PET measurements with [11C]PBB3 for tau accumulation and [11C]DPA713 for neuroinflammation. Inter- and intrasubject comparisons were performed regarding the levels of binding of those PET tracers and cognitive functions.
Results
The degree of binding potential (BPND) of [11C]PBB3 became significantly greater in the temporo-parieto-frontal region in AD patients, and the similar incremental pattern of [11C]DPA713 BPND was found according to the disease severity (form MCI to AD). A positive correlation of [11C]PBB3 BPND with [11C]DPA713 BPND in the parahippocampus was shown in AD patients. Cognitive decline was found to correlate significantly with the level of [11C]PBB3 BPND, not with the [11C]DPA713 BPND level.
Conclusions
Tau deposition with neuroinflammation in the parahippocampus is an early pathophysiological sign of AD. The extent of tau deposition reflects the degree of neuronal demise causing cognitive deterioration while neuroinflammation reflects impaired homeostasis in the regions affected by misfolded proteins such as tau. The current in vivo illustration of mutual pathophysiological events helps understand the dynamics of affected brain milieu of AD.
References
PP02-J18
Comparison of the amyloid brain PET/MR to that of simultaneous PET/CT
1Dept. of Nuclear Medicine, Yeungnam University Hospital, Republic of Korea
Abstract
Purpose
Amyloid PET imaging has recently become available in clinical practice to evaluate subregional changes in the amyloid accumulation. MR enables PET/MR provide wealth of information. We evaluate the performance of amyloid brain PET/CT in comparison to that of simultaneous PET/MR.
Methods
The study population comprised patients whom suspected dementia underwent a single-injection dual imaging protocol with brain PET/CT and subsequent brain PET/MR. PET/CT (Discovery VCT, GE) scans were performed applying standard clinical protocols (90 min after injection of 185 MBq 18F-flutemetamol (Vizamyl). Subsequently PET/MR (Biograph mMR, SIEMENS) was performed. The images were interpreted by visually and quantitatively using maximum and average standardized uptake values (SUVmax, SUVavg) of the subregional ROIs (bilateral frontal and lateral temporal lobes) in 8 patients (male 2, female 6, mean age: 78 yr).
Results
The quality of PET/CT images was better to that of the respective PET scan of the PET/MR, but comparable to that of PET/CT in discriminating positive or negative scan. The SUVavg values in 4 subregions (right frontal, left frontal, right lateral temporal and left lateral temporal) were 1.08/1.07/1.11/1.07, each for PET/CT and 0.88/0.9/0.92/0.9, each for PET/MR. There are good linear correlations between the SUVavg of PET/CT and PET/MR in 4 subregions (r = 0.91/0.94/0.95/0.97, each).
Conclusion
The performance of simultaneous PET/MR was comparable to that of PET/CT. Amyloid PET/MR may have a diagnostic benefit compared to PET/CT, because MR could provide more informations about anatomical changes of brain diseases and anatomical allocation of subregions. Further study is needed including more patients.
Reference
PP02-K01
Initial assessment of a reference-based non-invasive hybrid PET/MRI method for imaging CMRO2
1Lawson Health Research Institute, London, Canada
2Department of Medical Biophysics, Western University, London, Canada
3University of Turku and Turku PET Centre, Turku, Finland
4National Cerebral and Cardiovascular Center, Osaka, Japan
Abstract
Objectives
The gold standard for imaging the cerebral metabolic rate of oxygen (CMRO2) in humans is PET using 15O-labelled tracers1: 15O2 to measure oxygen extraction fraction (E), H215O to measure cerebral blood flow (f) and C15O to correct for activity from the cerebral blood volume (VB). It is a complex and lengthy procedure that requires invasive arterial blood sampling2,3. With a hybrid PET/MRI approach, MRI techniques are used to image f, as well as whole-brain (WB) CMRO24, which acts as a reference region, similar to the hybrid PET/MR method developed by our group to measure f5. This proposed method avoids arterial sampling and reduces PET imaging to 15O2 only. The aim of this work was to conduct an initial assessment of a non-invasive, reference-based method to image CMRO2 by a hybrid PET/MR approach.
Methods
The reference method is based on the one-compartment model of 15O2 uptake in brain tissue (Fig.1A), which ignores two common sources of error with the standard PET-alone method: recirculating H215O (RW) created by metabolism and VB. To assess the sensitivity to these potential errors, simulated time activity curves including RW6,7 and VB (Fig.1A) were generated over a range of f values (10 to 100 mL/100g/min) with WB E and f fixed (0.40 and 50 mL/100g/min, respectively) and analyzed with the model solution for the reference-based method. To demonstrate the method feasibility, it was applied to a standard 15O-PET human dataset (young healthy volunteers, n = 10, 23.2 ± 1.3years, 64.3 ± 5.3 kg, 1 female) acquired at NCVC8 (Osaka, Japan). Values of f and E, local and global, were obtained from H215O and 15O2 PET-alone images8, respectively. WB, grey matter and white matter were used as regions of interest (ROIs), obtained from T1-weighted MRI images segmented with SPM (v.12, www.fil.ion.ucl.ac.uk/spm).
Results
Simulations indicated that neglecting RW resulted in negligible error in CMRO2 estimates (0.03 ± 0.16‰), and errors associated with VB could be reduced by increasing the integration time to 5 min (0.3 ± 0.6%). Applying the reference-based method to the PET dataset produced similar CMRO2 images compared to the PET-alone method (Fig.1B, Bland-Altman presented in Fig.1C). Regression analysis indicated a significant correlation between reference-based and PET-alone CMRO2 values (p < .01, R2 = .997, slope = .98).

Conclusions
The insensitivity to RW and VB predicted from the simulations indicates the potential of the hybrid PET/MR method for non-invasive CMRO2 imaging without the need to correct for such sources of error. This was confirmed by the strong agreement between CMRO2 images obtained using WB CMRO2 as a reference region and by stand-alone PET. Major vessels and non-brain regions presented the most significant error (Fig.1B), which can be removed in a PET/MRI experiment, since larger vessels and WB structures are easily identified and segmented by MRI.
References
PP02-K02
A non-invasive hybrid PET/MR approach to quantify CBF: translating to clinical studies
1Lawson Health Research Institute, London, Canada
2Dept. of Medical Biophysics, Western University, London, Canada
3Fraunhofer Institute for Medical Image Computing MEVIS, Bremen, Germany
Abstract
Objectives
While PET with radiolabeled water (15O-water) remains the gold standard for imaging CBF, widespread use is limited by the requirement of arterial sampling. Arterial spin labeling (ASL) MRI is non-invasive and quantitative; however, its sensitivity to the arterial transit time reduces its accuracy, making it challenging to image patients with cerebrovascular diseases (CVD). We previously proposed a non-invasive hybrid PET/MR approach that uses a measurement of global CBF (gCBF) by phase contrast (PC) MRI to convert PET activity into quantitative CBF images without the need for arterial sampling1. The technique was initially validated in a large animal model, and the next step is to adapt it to human studies. Although the PET imaging will be similar, the PC sequence needs to be optimized for measuring gCBF in humans. In this study, we assess the variability in gCBF due to slice location and gating, and as a proof of concept, we present the first CBF images from one participant obtained using this non-invasive hybrid PET/MR approach.
Methods
Data were acquired using the Siemens Biograph mMR in 6 healthy volunteers (age: 31 ± 10, 2 females). PC images (4 averages, VENC: 70 cm/s, retrospective-gating) were acquired at the level of the first/second cervical vertebrae (gCBFlow) and basilar artery (gCBFhigh). Global CBFlow was repeated using a non-gated sequence. In 3 volunteers, PC data were acquired on 2 occasions separated by 1–2 months. Global CBF was quantified by scaling the blood velocity by vessel area and brain volume. For hybrid PET/MR-CBF1, 5 minutes of PET list-mode data were acquired after rapid intravenous bolus injection of 15O-water (800 MBq). Raw PET data were reconstructed using an MR-based attenuation correction map. For comparison, ASL (PCASL-GRASE) data were acquired with PLD = 2 s, LD = 1.8 s.
Results
Global CBF was 53.9 ± 7.4 (gCBFlow) and 57.5 ± 12.6 ml/100g/min (gCBFhigh) (ns). Repeat measurements were within 9.0% (gCBFlow) and 6.1% (gCBFhigh) of each other. Non-gated gCBF was 24% lower than the gated sequence (ns). CBF images obtained by PET/MR and ASL are shown in Figure 1.

Conclusions
The gCBF estimates were similar2 but lower than previous studies3. Differences could be attributed to increased noise resulting from a high VENC4. The 6.5% difference between gCBFhigh and gCBFlow, which may be significant with a larger sample size, could be related to partial volume errors due to contributions from stationary tissue5,6. PC-CBF measurements were reproducible, with <9% difference between measurements. Although gCBF generated by the two approaches were similar, the ratio of grey-to-white mater CBF appears to be higher in the ASL-CBF map (Figure 1). Our future goal is to use this hybrid approach to image CBF in CVD patients in order to evaluate its ability to quantify perfusion abnormalities.
References
PP02-K03
Comparison of perfusion MRI parameters to best identify PET penumbra and final infarct: a PET/MRI simultaneous study in a stroke model
1Univ Lyon, CarMeN Laboratory, INSERM, INRA, INSA Lyon, Université Claude Bernard Lyon 1 – Lyon, France
2Siemens Healthineers – Saint-Denis, France
3CREATIS, CNRS UMR 5220, INSERM U1206, Université Claude Bernard Lyon 1, INSA Lyon, Université Jean Monnet Saint-Etienne – Lyon, France
4Hospices Civils de Lyon – Lyon, France
5Cynbiose SAS – Marcy-L'Etoile, France
6CERMEP – Imagerie du vivant – Lyon, France
7Université Claude Bernard Lyon 1, Pathophysiology of Injury-Induced Immunosuppression, PI3, EA 7426 – Lyon, France
Abstract
Objectives
In stroke, MRI perfusion weighted imaging (PWI) is used to identify the tissue at risk. In patients without reperfusion therapy, accuracy of PWI parameters has been evaluated in several studies ([1],,23) using successively MRI and PET reference. With the development of PET-MRI scanner, it is now possible to simultaneously assess brain perfusion using both modalities. In a non-human primate (NHP) model of ischemic stroke with recanalization of the occluded artery, we compared PWI MRI to PET perfusion to identify the best estimate of penumbra, and to FLAIR MRI the best predictor of infarcted area.
Methods
Six NHP were scanned during occlusion, after recanalization and at day+7. Simultaneous MRI and PET perfusion data were acquired on a Siemens Biograph mMR (Siemens Healthcare) PET-MRI system. PWI was evaluated using a 3-min EPI DSC-MRI, and PET perfusion was assessed with a 6-min [15O]H2O acquisition. PWI data were processed using Olea Sphere v3.0 (Olea Medical). The TTP (time to peak) and Tmax maps were obtained at the voxel level. TTP maps were normalized by subtraction of the median contralateral value. PET quantitative cerebral blood flow maps (PET-CBF) were obtained with a one-tissue-compartment voxel kinetic modeling. The performance of Tmax- and TTP-PWI to define per-ischemia penumbra and final infarct was evaluated with individual receiving operator curve (ROC) analysis. For each time threshold on TTP and Tmax maps, the sensitivity and the specificity of PWI parameter were computed. Per occlusion penumbra reference was the PET penumbra defined by a PET-CBF voxels<20 ml/100g/min. The final infarct size reference was the visible lesion extend on FLAIR day+7. Area under the ROC curve (AUC) and median and interquartile range (IQR) of best thresholds were compared across all NHP. Younden index was used to define best thresholds.
Results
Summary of lesion volumes (median [IQR1-IQR3]) are showed in Table A. Three NHP out of 6 completely reperfused (i.e. no PET hypoperfusion after recanalization). A representative ROC of one NHP is showed in FigB. ROC statistics and optimized thresholds are summarized in Table C. For predicting penumbra, the highest AUC was found for TTP with an optimal threshold of 1.1 sec. For predicting final infarct, the highest AUC was also found for TTP with an optimal threshold of 1.2 sec. No significant differences were found between TTP and Tmax results, but a trend suggests that TTP performs better with this dataset. Interestingly, non-deconvolved parameter TTP seems to perform better than deconvolved Tmax, confirming results previously found and discussed (Zaro-Weber, 2010).

Conclusions
This preliminary study is the first to simultaneously assess PET and MRI perfusion in an ischemia-reperfusion stroke model. A trend suggests that TTP maps performed best to define both penumbra lesion and final infarct. In a clinical context where more and more patients can beneficiate thrombectomy and reperfusion therapies, it is crucial to identify the best determinants of infarct growth.
Acknowledgements
Funding from ANR CYCLOPS (ANR-15-CE17-0020) and RHU MARVELOUS (ANR-16-RHUS-0009)
References
PP02-K04
Long-term high-sugar diet increases reward-related neural responses to an acute glucose challenge as revealed by simultaneous [18F]FDG PET/fMRI
1Department for Preclinical Imaging and Radiopharmacy, Werner Siemens Imaging Center, Eberhard Karls University Tuebingen, Germany
2Institute for Medical Psychology and Behavioural Neurobiology, Eberhard Karls University Tuebingen, Germany
3German Center for Diabetes Research (DZD), Tuebingen, Germany
4Institute for Diabetes Research and Metabolic Diseases of the Helmholtz Center Munich at the University of Tuebingen, Germany
Abstract
Objectives
High sugar consumption is a main attribute of Western diets and associated with a number of systemic pathologies. However, long-term central nervous effects of high-sugar nutrition are poorly understood. By reflecting neural activity on both a hemodynamic and a metabolic scale simultaneous [18F]FDG PET/fMRI may potentially offer an extensive insight into brain function and its alterations. In this study we aimed to investigate such effects by determining the neural response to glucose administration following a sucrose diet using simultaneous [18F]FDG PET/fMRI scans.
Methods
A total of 64 healthy male Lewis rats received standardized chow diet for 8 weeks. During this time period, the animals of the high-sugar diet cohort (n = 32) were offered drinking water containing 30% sucrose, while the control cohort (n = 32) received pure drinking water. In 16 animals of each cohort, 60-minute PET/fMRI scans were recorded. For the other 16 rats of each cohort 10 additional minutes of fMRI were acquired as baseline before a glucose challenge (1.5 g/kg) was applied and PET was started for 60 minutes of simultaneous acquisition. Simultaneous [18F]FDG PET/MRI scans were obtained using a 7T small-animal MRI with a PET insert during anesthesia (30 mg/kg/h α-chloralose + 1 mg/kg/h pancuronium bromide) and artificial ventilation. An EPI-BOLD sequence (TR = 2.5 s, TE = 18 ms) was employed for fMRI data acquisition. For PET a bolus (850 µCi / 31.45 MBq) was applied, the data were reconstructed using a 2D-OSEM algorithm and the final 10 minutes were included in the analysis. Following preprocessing and exclusion of erroneous datasets (e.g. due to motion) voxel-wise group-level analysis was performed using SPM12 to reveal the neural response to the glucose challenge (p < 0.001 for fMRI; p < 0.01 for PET). Additionally, resting-state functional connectivity analysis was performed.
Results
Regionally confined increases in neural activation were revealed in the control cohort (n = 14 baseline vs n = 13 glucose challenge scans) following acute glucose administration. Both fMRI and PET indicated increased neural activity around the midbrain, while PET also showed a neural response in the prefrontal cortex. The sucrose diet cohort (n = 15 baseline vs n = 13 glucose challenge scans) exhibited stronger responses in the midbrain along with increased spatial extent across different regions in fMRI and PET. Both modalities indicated additional activation areas in the striatum (caudate putamen, nucleus accumbens). The fMRI recordings additionally revealed increased responses in wide-spread cortical areas and parts of the hippocampus and thalamus. Cortical responses in the PET dataset were restricted to frontal regions including prefrontal, orbitofrontal, cingulate and motor cortices. Resting-state connectivity analysis revealed increased connectivity across the mesolimbic pathway, primarily between midbrain and striatal areas of the brain.

Conclusions
Our findings indicate high-sugar diet leads to a stronger and more widespread response to an acute glucose challenge in brain regions involved in reward processing. The increased activity in prefrontal cortical regions moreover indicates stronger, potentially compensatory recruitment of pathways that exert a regulatory effect on calorie intake. The results of PET and fMRI are coherent, yet also complementary, fMRI revealing large-scale responses across the cortex, while PET findings appear to pinpoint particularly affected regions.
PP02-K05
No effects of a working memory training on functional and metabolic brain networks – a simultaneous PET/MRI study
1Nuclear Medicine, Technical University Munich, Munich, Germany
2Neuroradiology, Technical University of Munich, Munich, Germany
Abstract
Objectives
Working memory (WM) training was found to improve processing capacities and has therefore been suggested as a potential intervention to delay age- and disease-related cognitive decline. Neuroimaging studies, investigating training induced neural plasticity (NP), associated cognitive improvement with alterations of intrinsic brain activity. WM training effects on the network level remain unclear.
Methods
In this study 45 middle-aged healthy participants underwent a two months online supervised training and neuroimaging including PET and fMRI. Using a hybrid PET/MR system, we simultaneously measured 18F-fluorodeoxyglucose (FDG) PET and MRI data to study potential changes in metabolic and functional characteristics at a network and a single voxel level. Altered connectivity of neurocognitive networks (NCN), as the default mode network (DMN) and central executive network (CEN), was hypothesized. To extract NCN a spatial independent component analysis (ICA) was applied independently to fMRI and PET data. Loading coefficients as a measure of network integrity was calculated for each imaging modality and network of interest. To estimate potential training induced changes in FDG uptake and amplitude of low frequency fluctuations (ALFF) on the voxel level a univariate analysis was applied to PET and respectively to fMRI data.
Results
We identified in both FDG-PET and fMRI data the anterior and posterior DMN, CEN and salience network. No difference in network integrity measures was found. FDG-PET univariate analysis at the voxel level did not reveal significant training induced changes in FDG uptake. ALFF analysis at the voxel level for fMRI data revealed a significant increase in right Putamen extending into Caudate (PFWE < 0.001; cluster-level correction). Analysis of a set of nine different neuropsychological tests assessed before and after the training revealed a significant practice effect, but no transfer effects, i.e. an improvement in tasks other than the trained tasks.
Conclusion
In summary, our multimodal neuroimaging approach did not show working memory induced changes on the network level. On voxel level, we didn’t find differences in FDG uptake after the training period, but a significant increase in ALFF in parts of basal ganglia. In accordance, our behavioural results reveal no transfer effects following a training suggesting to revise the concept of WM training.
PP02-K06
Regional alterations in relative FDG uptake during an apparent steady state
1Nuclear Medicine, Technical University of Munich, Munich, Germany
2Neuroradiology, Technical University of Munich, Munich, Germany
Abstract
Objectives
Guidelines for 18-FDG-PET imaging recommend a start of data acquisition 30–60 min post injection (p.i.). After 30 min p.i. FDG uptake is supposed to be in a steady state.
Methods
Here, we studied regional FDG uptake over an imaging period of 30 to 90 min p.i. in a cohort of 84 healthy middle-aged subjects. First, we performed an SPM analysis contrasting summed images for time frames 30–60 vs. 60–90 min p.i. Using global mean normalization, we found higher relative FDG uptake in the cerebellum, parts of the primary visual cortex and pons in the earlier timeframe (figure A; red clusters, p < 0.001 FWE corrected). Lower FDG uptake was detected within extensive parts of the frontal, parietal, and lateral temporal cortex, as well as in the striatum (figure A; blue clusters, p < 0.001 FWE corrected). Further, raw PET data were reconstructed as twelve 5 minute timeframes. In a regions-of-interest analysis, we found a number of regions with significant, nearly linear alterations of relative FDG uptake over time. Figure B shows temporal dynamics for two representative regions, the inferior frontal gyrus (red line, 2,78% increase relative to the baseline) and the cerebellum (green line, 5,56% decrease relative to the baseline).
Results
In sum, we found significant alterations in relative FDG uptake during an apparent steady state.

Conclusion
The direction and magnitude of these alterations seem to be region specific, eventually reflecting differences in physiological tissue properties (e.g. neuron to glia ratio). The results agree with recently reported anti-correlated metabolic cortical and cerebellar networks.
PP02-K07
Exploration of oxygen to glucose index (OGI) as diagnostic basis for neurological diseases with a combined PET/MR system
1iHuman Institute, ShanghaiTech University, China
2School of Life Science and Technology, ShanghaiTech University, China
3Department of Nuclear Medicine, Ruijin Hospital, Shanghai Jiao Tong University School of Medicine, China
4Department of Functional Neurosurgery, Ruijin Hospital, Shanghai Jiao Tong University School of Medicine, China
5Institute of Neuroscience, CAS Center for Excellence in Brain Science and Intelligence Technology, Chinese Academy of Sciences, China
Abstract
Objectives
Conventional diagnostic methods for neurological diseases are limited due to the difficulties of precise localization of impacted brain regions, or lack of novel biomarkers. Since many neurological diseases, including epilepsy, are related to oxidative metabolism,1 the oxygen to glucose index (OGI) could be a potential indicator. Preliminary data from healthy subjects would help the establishment of OGI-based diagnosis.
Methods
OGI reflects the quantity of glucose that has undergone both glycolysis and aerobic respiration, as opposed to glucose that has only undergone glycolysis. All subjects underwent brain scans with PET/MRI. Using MRI, a CBF (cerebral blood flow) map was based on ASL, and the relative CMRO2 (cerebral metabolic rate of oxygen) was calculated using the independent mapping of R2’ and CBF, where R2’ is directly measurable by the difference between 1/T2* and 1/T2.2,3 The relative CMRglc was measured using PET with 18F-FDG. In this study, rCMRO2 and rCMRglc were scaled to known results from Hyder et al. (2016)4 and thus are relative and not absolute. Relative OGI was calculated by dividing rCMRO2 by rCMRglc.4
Results
The healthy subjects demonstrated rOGI across the neocortex consistent with prior studies4,5 and no lateralization was observed in the healthy subjects. However, epileptic patients displayed a large reduction in rOGI at a focal point on the affected hemisphere. Results from the healthy subject and a representative epileptic patient are shown in OGI Map.

Conclusion
Beyond the reduced metabolism seen in epilepsy with CBF and CMRglc,6 we have provided preliminary evidence that the relative levels of metabolic reduction are asynchronous, thus leading to a decrease in rOGI. This finding corresponds to the proposed mechanisms of increased glycolysis and lactate efflux in epilepsy. Our results demonstrate a promising marker, rOGI/OGI, with clear pathophysiological grounds, to spatially pinpoint epileptic foci in clinical patients more precisely than using CMRglc PET methods alone. We assume the high values in mean OGI map are due to the disturbance of CSF. Future work will focus on improved quantification of CMRO2 model parameters and the CMRglc input function to enable fully quantitative OGI use with combined PET/MRI.
References
PP02-K08
Reduced hypoxic tissue and cognitive improvement after revascularization surgery for chronic cerebral ischemia
1Department of Neurosurgery, Iwate Medical University
2Cyclotron Research Center, Iwate Medical University
Abstract
Objectives
Hypoxic but viable neural tissue is seen on 1-(2-18F-fluoro-1-[hydroxymethyl]ethoxy) methyl-2-nitroimidazole (18F-FRP170) positron emission tomography (PET) in patients with chronic cerebral ischemia with a combination of misery perfusion and moderately reduced oxygen metabolism1. Cognitive function sometimes improves after revascularization surgery in patients with chronic cerebral ischemia. We used brain perfusion single-photon emission computed tomography (SPECT) and 18F-FRP170 PET to determine whether hypoxic tissue was reduced following restoration of cerebral perfusion after carotid endarterectomy (CEA) or anastomosis of the superficial temporal artery (STA) to the middle cerebral artery (MCA) in adults with severe stenosis of the cervical internal carotid artery (ICA) or symptomatic ischemic moyamoya disease, respectively, and whether the reduction in hypoxic tissue was associated with cognitive improvement.
Method
Fourteen and 16 adult patients with abnormally reduced cerebral blood flow (CBF) in the affected cerebral hemispheres on a preoperative brain N-isopropyl-p-[123I]-iodoamphetamine SPECT underwent CEA and STA–MCA anastomosis, respectively. They underwent 18F-FRP170 PET and neuropsychological tests2 (WAIS-R verbal IQ, WAIS-R performance IQ, WMS MQ, Rey copy and Rey recall) preoperatively and 6 months postoperatively. The cutoff value of each neuropsychological test defined in the previous work2 was used for identifying the cognitive improvement. SPECT was also performed 6 months postoperatively. Regions of interest were automatically placed in the bilateral MCA territories on SPECT and PET images using a three-dimensional stereotaxic ROI template with SPM21, and the ratio of values in the affected versus contralateral hemispheres was calculated.
Results
The CBF ratio (p < 0.0001) and 18F-FRP170 ratio (p = 0.0016) were significantly increased and reduced, respectively, after surgery compared to before. The difference in the 18F-FRP170 ratio (postoperative – preoperative value) was negatively correlated with the difference in the CBF ratio (ρ = −0.645; p = 0.0005). The difference in the 18F-FRP170 ratio was significantly lower in patients with postoperative improved cognition compared to those without (p < 0.0001). The area under the receiver operating characteristics curve for the difference in the 18F-FRP170 ratio for detecting postoperative improved cognition was significantly greater than that for the difference in the CBF ratio (difference between areas, 0.201; p = 0.0147).
Conclusions
Hypoxic tissue is reduced following restoration of cerebral perfusion with revascularization surgery in adults with severe atherosclerotic stenosis of the cervical ICA or symptomatic ischemic moyamoya disease. The reduction in hypoxic tissue is associated with cognitive improvement in such patients.
References
PP02-K09
Feasibility of apparent brain temperature map by 1H-MRS to detect hemodynamic abnormality in patients with unilateral chronic major cerebral artery steno-occlusive disease
1Department of Neurosurgery, Iwate Medical University, Japan
2Institute for Open and Transdisciplinary Research Initiative, Osaka University, Suita, Japan
3Division of Ultra-High Field MRI, Iwate Medical University, Japan
4Cyclotron Research Center, Iwate Medical University, Japan
Abstract
Objectives
In a previous work, it has been reported that apparent brain temperature (BT) was associated with the cerebral hemodynamic abnormalities in patients with chronic ischemia1. In particular, multi-voxel 1H-MRS can show the BT distribution as a topography, it thus may be able to help us to assess the hemodynamic abnormalities in the cerebral white matter (CWM) region in such patients. Here, we investigated whether the BT in the CWM region by multi-voxel 1H-MRS correlated with the cerebral hemodynamic abnormalities assessed by positron emission tomography (PET) in patients with unilateral chronic major cerebral artery steno-occlusive disease.
Methods
MRI acquisitions were performed in 35 patients with unilateral middle cerebral or internal carotid artery steno-occlusive disease using a 3 Tesla MRI. For multi-voxel 1H-MRS, 5×5-voxel regions of interest (ROIs) were manually and symmetrically placed at the central semiovale on the T2-weighted (T2W) image, as locating the central row of voxels on the cerebral interhemispheric fissure (Figure 1a). As the results, rows of voxels at left and right side edge of the ROIs covered the CWM region in each cerebral hemisphere. After the BT calculation in all voxels, BT map was generated (Figure 1a). 15O-gas PET was also performed in all patients. All PET images were reformatted into the slices coregistered to a corresponding T2W image with the 5×5-voxel ROIs. In each voxel-pair that was composed of two voxels on the affected and contralateral sides at the corresponding position in rows at the ROIs’ edge (Figure 1b), ΔBT (BT on the affected side – BT on the contralateral side) and the ratios of the value of each PET image in the affected hemisphere to that in the contralateral hemisphere was calculated using the same voxel-pair (Figure 1c). Finally, ΔBT and PET ratio were obtained in 5 voxel-pairs. Additionally, the mean values of the 5 voxel-pairs of all data were also calculated in each patient. In each group, mean of ΔBT, CBF, CBV, CMRO2 or OEF ratio was calculated with defining the left cerebral hemisphere as the affected side.
A typical brain temperature (BT) map (a), a location of 5 pairs of the ROIs in the cerebral white matter region for quantitative assessments (b) and a oxygen extraction fraction (OEF) map with the 5 pairs of the ROIs co-registered from a multi-voxel magnetic resonance spectroscopy (c).
Results
ΔBT significantly correlated with CBV ratio (r = 0.57, p < 0.0001), CMRO2 ratio (r = 0.39, p < 0.0001) and OEF ratio (r = 0.64, p < 0.0001) with 175 voxel-pairs (5 voxel-pairs×35 patients). Then, mean ΔBT, which is the mean values of 5 voxel-pairs in each patient, correlated with mean CBV (r = 0.70, p < 0.0001), mean CMRO2 (r = 0.50, p = 0.0017) and mean OEF ratio (r = 0.78, p < 0.0001).
Conclusion
BT map in the CWM by multi-voxel 1H-MRS can detect the cerebral hemodynamic abnormalities, which were determined by 15O-gas PET in patients with unilateral chronic major cerebral artery steno-occlusive disease.
Reference
PP02-K10
Preserved cerebral oxygen metabolism against astrocytic dysfunction: a combination study of 15O-gas PET with 14C-acetate autoradiography
1Dept of Nuclear Medicine and Tracer Kinetics, Osaka University Graduate School of Medicine, Japan
2Dept of Molecular Imaging in Medicine, Osaka University Graduate School of Medicine, Japan
Abstract
Objectives
Fluorocitrate (FC) is a metabolic inhibitor of tricarbonic acid (TCA) cycle specifically in the astrocytes. In the previous studies, intrastriatal injection of FC induced significant reduction in 14C-acetate uptake, indicating reduced activity of astrocytic TCA cycle in the brain. Oxygen-15 (15O) gas PET is the reference standard for quantitative assessment of cerebral blood flow (CBF) and cerebral metabolic rate of oxygen (CMRO2). The purpose of this study was to evaluate whether the inhibition of astrocytic TCA cycle metabolism by FC will affect the oxygen metabolism in the rat brain.
Methods
A total of 9 male Wistar rats (BW: 198 ± 20 g) under anesthesia were investigated. All rats were injected with FC solution intrastriatally [0.33 nmol/ul (low dose, n = 3) and 1.0 nmol/ul (high dose, n = 6) in the unilateral striatum]. Saline solution was also infused into the contralateral side. After 4 hours of intrastriatal FC infusion, the rats were investigated by 15O labeled gas PET with arterial blood sampling. CBF, CMRO2, oxygen extraction fraction (OEF), and cerebral blood volume (CBV) were measured with 15O-CO2, 15O-O2, and 15O-CO gases. After 15O-gas PET (six hours later from the time of FC injection), the rats were given 14C-acetate intravenously. Five minutes later, the rats were sacrificed by euthanasiaand the brains were removed and frozen. Coronal sections were prepared using a cryostat and placed in contact with an imaging plate for autoradiography. Quantitative values of 15O-gas PET (CBF, CMRO2, OEF, and CBV) and 14C-acetate uptakes were compared between ipsilateral and contralateral sides by paired t-test.
Results
There were no significant differences between the ipsilateral and contralateral striatum in each parameter using the 15O-gas PET. The following are the results of the high dose group: [Ipsilateral and contralateral striatum: CBF (75.1 ± 38.8 and 64.1 ± 15.3 mL/100mL/min), CMRO2(8.61 ± 2.70 and 8.28 ± 1.82 mL/100mL/min), OEF (71.0 ± 9.6 and 72.6 ± 7.6 %), and CBV (4.10 ± 0.53 and 4.09 ± 0.64 mL/100mL), respectively]. In 14C-acetate autoradiography results, there is a significant inhibition in the astrocyte metabolism after FC injection in the ipsilateral striatum. The percentage reduction rates in low and high doses of FC were 17.5 ± 2.0% and 37.6 ± 6.2%, respectively.

Conclusions
Regional cerebral oxygen consumption as well as hemodynamic parameters was maintained against the inhibition of astrocytic TCA cycle metabolism in the rat brain.
References
PP02-K11
Insights into the improvement of neurocognitive dysfunction after indirect bypass surgery in adult Moyamoya disease; 15O-gas positron emission tomography study
1Department of Neurosurgery, Tokyo Medical and Dental University, Tokyo, Japan
2Department of Radiology, Juntendo University, Tokyo, Japan
3Research Team for Neuroimaging, Tokyo Metropolitan Institute of Gerontology, Tokyo, Japan
Abstract
Objectives
To investigate how to identify the adult patients with Moyamoya disease who would improve their declined neurocognition after the indirect bypass surgery, we analyzed the relationship between neurocognition and the hemodynamic parameters measured with 15O-gas positron emission tomography (PET) before and after the operation.
Methods
We retrospectively analyzed 19 patients with Moyamoya disease who were evaluated withWechsler Adult Intelligence Scale (WAIS), and PET, before and after indirect bypass surgery in our institute. Preoperative neurocognitive decline was defined as Verbal intelligent quotient (VIQ) <80 or performance IQ (PIQ)<80, and postoperative improvement was defined as the increase of VIQ≥10 or PIQ ≥10.
PET parametrical maps of cerebral blood flow (CBF), cerebral blood volume (CBV), oxygen extraction fraction (OEF) and cerebral metabolic ratio of oxygen (CMRO2) were created using scanned images and amounts of radioactivity in the arterial blood after inhalation of C15O2, 15O2 and C15O. Regional PET values were calculated using Dr. View R2.5 (Infocom, Tokyo) by manually drawn regions of interests on the cerebral areas and the cerebellum. To control the measurement error, cerebellar normalization was applied to cerebral regional values.
We assessed the difference between preoperative and postoperative values of PET parameters (CBF, CBV, OEF, and CMRO2) and VIQ/PIQ using paired T test. We also compared the PET parameters in patients with preoperative neurocognitive decline who showed postoperative neurocognitive improvement, and those with preoperative decline who do not improve their neurocognition after operation using unpaired T test. P < 0.05 was regarded as statistically significant.
Results
Of 19 surgically treated patients, 14 patients (74%) exhibited preoperative neurocognitive decline (9 for VIQ and 10 for PIQ). Among these 14 patients, 9 patients showed postoperative neurocognitive improvement (4 for VIQ and 5 for PIQ).
Although VIQ and PIQ were not significantly different before and after operation (p = 0.62 and 0.32), many cerebral regions showed significant improvement of PET parameters postoperatively (i.e. increased CBF, decreased CBV, decreased OEF and increased CMRO2), especially in the left rolandic area (p = 0.001–0.015 for all PET parameters).
In patients who showed postoperative neurocognitive improvement, preoperative OEF values and postoperative increase of CMRO2 was significantly higher than those who did not improve their neurocognition after operation (p = 0.03 and p = 0.02).

Conclusions
Neurocognitive dysfunction is common among adult moyamoya patients1, and is correlated with low cerebrovascular reserve2 and low regional CMRO23. However, only small number of patients improved their neurocognition after bypass surgery4, and how to identify these patients is still unknown.
Our study suggested that selected patients with strong hemodyamic impairment characterized by higher preoperative OEF might improve their neurocognitive decline after the improvement of heomodynamic status.
References
PP02-K12
Generation of OEF-like image using H215O PET scan data applying machine learning
1Medical Physics, Facl of Medicine, Kagawa University, Japan
2Clinical Radiology, Kagawa University Hospital, Japan
3Radiology, Kagawa University, Japan
4Neurological Surgery, Kagawa University, Japan
Abstract
Objective
PET with 15O-labeled tracers is capable of providing unique and essential information in patients with cerebro-vascular disorders, by means of quantitative of cerebral blood flow (CBF), oxygen extraction fraction (OEF), and metabolic rate of oxygen images. A novel DBFM method allows extremely short examination period of <10 min scan for CBF and OEF.1 Also a computation method for imaging of appearance time of blood (ATB) was developed.2 The study suggested that ATB delayed regions were similar to those OEF elevated. It would be of interest to generate a similar image to OEF as OEF-like image from ATB image, namely only from a scan for CBF. This study was intended to generate an OEF-like image using CBF and ATB images applying the machine learning technique.
Method
The study was consisted with two patient groups, namely, PET DBFM examination performed was during 2009 to 2017 (n = 375) as Group-1 and 2017 to 2018 (n = 57) as Group-2, involving suspected disorders (n = 375), involving ICA or MCA occulusion/stenosis, aneurism, and Moyamoya disease. Using the scan data, OEF, CBF and ATB images were obtained. Brain regions were separated into 108 segments using Free Surfer Program.3 For each segment, OEF, CBF and ATB values were extracted. Then, machine learning was applied to Group-1 date for predicting OEF difference in each segment against mean of whole brain region, CBF values and ATB difference. The data was separated to 80% for learning and to 20% for testing score of OEF prediction. Using the obtained machine learning weight data, OEF-like image was generated from CBF and ATB images for Group-2, and that was compared to the measured OEF image.
Result
The correlation coefficient between the differences of the measured OEF and predicted OEF values in test were 0.82, during the machine learning in Group-1 study. The generated OEF-like images were similar distribution to that by the PET measurement (Figure). Between the OEF and OEF-like images, correlation of differences between hemispheres was 0.59 in Group-2 study.

Conclusion
The present results suggest that OEF-like image could provide similar information as the measured OEF.
References
PP02-K13
The feature of 99mTc- ethyl cysteinate dimer dynamic SPECT for the screening of cerebral circulation in ischemic cerebrovascular disease based on the comparison with 15O-PET
1Dept. of Neurosurgery, Yamagata University Faculty of Meidicine, Japan
Abstract
Objectives
99mTc-ethyl cysteinate dimer (ECD) is using worldwide as a brain perfusion tracer for SPECT to evaluate cerebral circulation in various neurological diseases such as stroke, dementia, etc. Although the linearity of 99mECD SPECT is not as much as 15O-PET or N-isopropyl-(123I)-p-iodoamphetamine (IMP), 99mTc-ECD SPECT is more convenient and higher resolution compared to 123I-IMP SPECT. The purpose of this study is to establish one of the methods for the screening of cerebral circulation in ischemic cerebrovascular disease.
Methods
Eighty-four patients with pre-operative cerebrovascular disease were included in this study from April 2013 to July 2017. The patients were 56 males and 28 females. The mean age was 58.4 ± 19.85 years (5–80). Forty-eight patients were pre carotid endarterectomy (CEA)/ carotid arterial stent (CAS) disease. Twenty-nine patients were pre superficial temporal artery (STA) – middle cerebral artery (MCA) bypass. Seven patients are others. 99mTc-dynamic ECD SPECT images were acquired at 30–60 s, 60–90 s, 90–120 s, 2–4 min, 14–16 min, 58–60 min following tracer injection. To compare between dynamic 99mTc-ECD SPECT and each parameter of PET, asymmetry index (AI) (%) define as (right MCA value – left MCA value) / ([right MCA value + left MCA value] / 2) ×100 was calculated.
Results
We revealed the most significant correlation between ECD images at 30–60 s and 15O-PET, CBF (r = 0.77, p < 0.001). On the other hand, the most significant correlation between ECD images at 58–60 min and 15O-PET CBF (r = 0.628, p = 0.001) was observed. The sensitivity and specificity of the 10% or more change of AI in ECD images at 30–60 s against to detect 15% or more change of AI in 15O-PET CBF were 47.1%, 100%, respectively. There was no significant correlation between ECD at 60–90 s, 90–120 s and 15O-PET CBV. Since several cases demonstrated the increase of CBV in ischemic hemisphere, ECD images at early phase could be affected by blood pooling in a vessel which caused by the increase of CBV. The dynamic ECD images after 14–16 min were not substantially different from the images at 58–60 min.
Conclusions
99mTc-ECD dynamic SPECT is useful as a screening for cerebral circulation, especially, at 30–60 s which showed the most significant correlation with 15O-PET CBF. We need to realize the possibility to get an unexpected result at an early phase in the cases with CBV elevation. This dynamic study until 15 min could be enough to evaluate cerebral circulation in cerebrovascular disease.
PP02-K14
Mismatching effects of antihistamines on regional brain glucose metabolism and blood flow in human brain: A combined study with [18F]FDG PET and NIRS
1Div. of Cyclotron Nuclear Medicine, Cyclotron and Radioisotope Center, Tohoku University, Japan
2Div. of Radiation Safety, Cyclotron and Radioisotope Center, Tohoku University, Japan
3Dept. of Pharmacology, Graduate School of Medicine, Tohoku University, Japan
Abstract
Background and aim
Antihistamines have been routinely used to treat various allergic disorders. These therapeutic drugs often cause sedative side effects in patients. Effects of these antihistamines on cerebral blood flow has been studied using PET and [15O]H2O and near infra-red spectroscopy (NIRS). There were, however, no study on glucose metabolism. Therefore, this study aimed at the first PET measurement of the regional cerebral glucose metabolic changes during cognitive tasks following antihistamines treatment, using PET and [18F]fluorodeoxyglucose (FDG).
Subjects and method
In this double-blind, placebo-controlled, three-way crossover study, 18 healthy young Japanese men received single doses of levocetirizine 5 mg and diphenhydramine 50 mg at intervals of at least six days. Subjective feeling and task performances were evaluated before and during the following cognitive tasks (word fluency, two-back, and Stroop). Simultaneously brain hemodynamic change was measured using NIRS. Prior to the task initiation, FDG was injected and the brain activity were also evaluated by scanning the brain of subjects with FDG PET just after the cognitive tasks. For PET mesurement, we used FDG double injection method (PET). To date, FDG double injection method had been sometimes applied to certain clinical studies using FDG PET. We also examined its reliability in clinical trials in terms of standardized uptake value (SUV) ratios as an index of the tissue glucose consumption.
Results
The study indicated that energy consumption in the prefrontal regions was significantly increased after sedative antihistamine administration (diphenhydramine), whereas the prefrontal hemodynamic responses (evaluated with oxygenated hemoglobin levels) were significantly lower with sedative antihistamine (diphenhydramine)treatment. Stroop test accuracy was significantly impaired by the sedative antihistamine (diphenhydramine), but not by non-sedative antihistamine (levocetirizine). There was no significant difference in subjective sleepiness. These results didn't come in accordance with our assumption based on neurovascular coupling.
In addition, we demonstrated that FDG PET had a sufficient sensitivity to meausure cerebral metabolic change due to antihistamines and that FDG PET could successfully demonstrate the effects of different antihistamines with differnet sedative profiles. And we demonstrated that FDG double injection method was able to be applied to various clinical studies using various drugs.
Discussion and Conclusions
There might be a possibility that neurovascular "coupling" between glucose metabolism and perfusion in physiological condition may not be maintained even in healthy human brain under certain pharmacological influence due to antihistamines. This uncoupling might be induced by a combination of increased energy demands in the prefrontal regions and suppression of vascular permeability in brain capillaries due to antihistamine treatment. Further research would be needed to validate this hypothesis.
PP02-K15
Differentiating primacy CNS lymphoma from glioblastoma -Diagnostic value of combination using 18F-fluorodeoxglucose positron emission tomography and arterial spin labeling
1Department of Neurosurgery, Akita University Graduate School of Medicine
Abstract
Introduction
Using conventional magnetic resonance imaging (MRI) methods, the differentiation of primary central nervous system lymphomas (PCNSL) and glioblastomas is difficult due to overlapping imaging characteristics. The aim of this study is to evaluate the diagnostic value of 18F-fluorodeoxyglucose positron emission tomography (FDG-PET) and arterial spin labeling (ASL) in differentiating PCNSL from glioblastoma.
Methods
70 patients including 17 with PCNSL and 53 with glioblastoma were retrospectively studied. From the FDG-PET data, the maximum standard uptake value (SUVmax) were obtained within the enhancing portion of each tumor. The ratio of tumor to normal contralateral cortex (T/NT ratio) was also calculated. From the ASL data, an absolute maximum tumor blood flow (TBFmax) and its T/NT ratio were obtained. In discriminating between PCNSL and glioblastoma, the statistical significance of each parameter was analysed using a logistic regression analysis. The cutoff value, sensitivity, and specificity were evaluated using the receiver-operating characteristics (ROC) analysis. The significant parameters showing higher sensitivity and specificity were selected and their independence were tested using a multivariate logistic regression analysis. Then, the diagnostic performance using combining independent factors was calculated.
Results
The SUVmax and T/NT ratio of SUVmax were significantly higher in PCNSL than in glioblastoma. The cutoff value, sensitivity, and specificity were 16.7, 100%, 84.9% in SUVmax, 2.07, 100%, 90.6% in T/NT ratio of SUVmax, respectively. T/NT ratio of SUV max was selected as a diagnostic indicator from the FDG-PET data. The TBFmax and T/NT ratio of TBFmax were significantly lower in PCNSL than in glioblastoma. The cutoff value, sensitivity, and specificity were 110 (ml/100 g/min), 82.4%, 81.1% in TBFmax, 1.5, 76.5%, 75.5% in T/NT ratio of TBFmax, respectively. TBFmax were selected as the indicators from the ASL data. The multivariate logistic regression analysis showed statistical independence between T/NT ratio of SUV max and TBFmax. When the 2 factors were combined with the cutoff value with the maximum sensitivity, the patient group with high T/NT of SUVmax (≥2.07) and low TBFmax (≤140 (ml/100 g/min)) indicated PCNSL, and the sensitivity and specificity were 100% and 98,1%, respectively.
Conclusion
Combination using FDG-PET and ASL imaging is useful for differentiating PCNSL from glioblastoma.
PP02-K16
Alterations in cerebral blood flow evoked by dynamic exercise in post-stroke patients implies a mechanism for cerebral autoregulation: a PET study
1Center for Brain and Health Sciences, Aomori University, Japan
2Research Team for Neuroimaging, Tokyo Metropolitan Institute of Gerontology, Japan
3Dept. of Neurosurgery, Tokyo Medical and Dental University, Japan
Abstract
Objectives
In the present study we examined whether changes in cerebral blood flow (CBF) evoked by dynamic exercise are different between healthy volunteers and patients with occlusive lesions in main cerebral arteries. To observe cerebral autoregulation (CA) in these different groups, alterations in CBF were investigated while exercise caused increase and decrease in blood pressure (BP).
Methods
Ten healthy male volunteers (HV) and five male patients who had experienced ischemic cerebrovascular diseases with occlusive changes in the major arteries but were tolerable for regular exercise habit (IP) participated in this study. They performed 20 min cycling exercise and rCBF were measured using oxygen-15-labeled water (H215O) and PET (Discovery PET/CT, GE) at the baseline (Rest), onset (Ex1), continued phase (Ex2) and 10, 20 and 30 min after the cessation of exercise (Post 10, 20 and 30 min). Heart rate (HR) and mean blood pressure (MBP) were monitored. With the accumulated image and the measured arterial input function, rCBF was calculated using the autoradiographic method. The image data were analyzed using SPM and Dr. View software
Results
MBP at rest was higher in IP compared with HV (105 ± 10 and 91 ± 8 mmHg, P < 0.02). At Ex1, HR and MBP increased to 102 ± 6 and 112 ± 8 bpm and 104 ± 10 and 132 ± 11 mmHg, in HV and IP respectively. Compared with HV, HR and MBP at Ex1 were higher in IP (P < 0.05 and P < 0.001). At Post 10, MBP significantly decreased compared to Rest, 86 ± 10 mmHg in HV (P < 0.05) but did not changed in IP, 103 ± 14 mmHg. By analysis with absolute values, global CBF (gCBF) increased by 10.5% (P < 0.05) at Ex1 and tended to decrease at post 10 in HV, while this changeing pattern in gCBF was not identified in IP. In both groups gCBF recovered to the level of Rest at Ex2. Alterations in CBF d by exercise were similar when grey and white matters were analyzed separately (Figure). Brain areas where regional CBF (rCBF) increased at Ex1 and decreased at post 10 were larger in HV compared with IP. For most of brain regions in the both groups, rCBF changed as the same manner in grey and white matters except for ischemic lesions in IP where rCBF did not changed during exercise.

Conclusions
These findings suggest that CA was identified at Ex2 in both HV and IP while CBF fluctuated at Ex1. Although BP increased greater in IP compared with HV, this fluctuation of CBF in IP was not larger than that in HV. Because of hypertensive characteristics and ischemic changes among IP, alteration in cardiac output during exercise would not cause enough effect on the fluctuation of CBF at Ex1 and post 10 in IP. Considering occlusive lesions of cerebral arteries in IP, it is speculated that large extracranial cerebral arteries, innervated by extrinsic perivascular postganglionic neurons, would not impede CA. Instead, parenchymal arterioles, regulated by intrinsic factors which are associated with neuronal activation and astrocytic modulation, might have a role for the underlining mechanisms for changes in vascular resistance.
References
PP02-K17
The combined effects of capillary transit time heterogeneity and hematocrit on brain oxygenation
1CFIN – Center of Functionally Integrative Neuroscience, Aarhus University Hospital, Denmark
2Dept. of Neuroradiology, Aarhus University Hospital, Denmark
Abstract
Objectives
In the brain, capillary transit time heterogeneity (CTH) has been proposed to play an important role in the regulation of brain tissue oxygenation.1 Modeling studies have shown that flow homogenization improves tissue oxygenation by counteracting the inherent reduction in oxygen extraction fraction as cerebral blood flow increases1,2.
Capillary tube hematocrit has been observed to show large heterogeneity in capillary networks3,4 and to vary between physiological states.3 Systemic hematocrit has also been shown to increase e.g., during altitude adaptation. Modeling studies have examined the effects of such changes in hematocrit, although only at the single capillary scale. They have shown that hematocrit has a large influence on tissue oxygenation, even larger than that of red blood cell (RBC) velocity.5
Here, we develop a model to study the combined effects of a change in CTH and hematocrit on brain tissue oxygenation at the capillary network scale.
Methods
Based on a four-compartment (red blood cell, plasma, endothelium, tissue) model, and treating tissue compartment as a Krogh cylinder, the mean oxygen extraction fraction and tissue oxygen tension over the capillary network are computed by summing the contribution of each capillary weighted by the assumed capillary transit time distribution.
We compared the influence of hematocrit on cerebral tissue oxygenation to that of CTH under conditions of fixed oxygen supply. Moreover, we examined the influence of the relation between RBC flux and hematocrit that tend to be correlated, as observed experimentally.3,4
Results
The figure shows the effects of a change in blood flow heterogeneity (RTH) and hematocrit on brain tissue oxygen tension (PtO2) for a given blood supply under conditions of resting state and stimulation. The influence of a change in hematocrit is comparable to that of blood flow heterogeneity under both conditions. Importantly, the influence of hematocrit is predicted to increase at high oxygen consumption rate relative to that of blood flow heterogeneity. While a change in blood flow heterogeneity is predicted to have a substantial effect on both oxygen extraction and PtO2, a change in hematocrit is predicted to be limited to PtO2.
Our new model shows a good agreement with other models for oxygen extraction developed earlier [1,2,5], in spite of substantial framework differences. In particular, it predicts that for large CTH values, a blood flow increase fails to cause significant improvements in oxygen delivery, and can even lower it.

Conclusion
Hematocrit and flow heterogeneity are both involved in the regulation of brain tissue oxygenation.
Moreover, the relation between blood supply, blood flow heterogeneity and hematocrit is robust across the different models used in this study. They highlight the importance of examining further the mechanisms involved in oxygen transport in the microcirculation and its regulation.
References
PP02-L01
Genetically encoded reporter for bimodal optical and PET imaging in the mammalian brain
1Dept. of Functional Brain Imaging, National Institutes for Quantum and Radiological Science and Technology, Chiba, Japan
2Dept. of Radiopharmaceuticals Development, National Institutes for Quantum and Radiological Science and Technology, Chiba, Japan
3Dept. of Neurology, Keio University School of Medicine, Tokyo, Japan
4Dept. of Neuroscience, The Scripps Research Institute, La Jolla, USA
Abstract
In vivo neuroimaging with a gene reporter is a fundamental technology for real-time and longitudinal tracking of molecular dynamics in the mammalian brain. Among various imaging modalities, positron emission tomography (PET) offers superior advantage to monitor disposition of a biosynthesized molecule in living animal and human. However, visualization of a genetically targeted reporter protein in the nervous system by PET has been hampered due to the lack of radioactive ligand capable of penetrating blood-brain barrier. In the present study, we demonstrate that E.coli dihydrofolate reductase (ecDHFR) and its small chemical antagonist trimethoprim (TMP) serve a technical platform for in vivo fluorescence and PET reporter imaging in living animal brains. In mice, Individual neurons expressing ecDHFR can be visualized by two-photon laser microscopy after intravenous administration of TMP conjugated to a fluorophore, and the macroscopic distribution of ecDHFR in these animal brains was successfully imaged by PET following administration of radioactive 11C-labeled TMP ([11C]TMP) or new 18F-labeled TMP analogue ([18F]FE-TMP). We also demonstrate the utility of TMP analogs for a PET analysis of aggregation and turnover of proteins tagged with wild-type ecDHFR or its mutant that mediates protein decay in the absence of the chemical. Finally, utilizing this techniques, neuronal tract in deep brain regions of a non-human primate can be clearly visualized. Our findings indicate the crucial advantage of bimodal optical and PET reporter imaging for the microscopic to macroscopic visualization of the expression, turnover, and complex formation of genetically targeted proteins in the living animal brain.
PP02-L02
Prediction of rat brain PET image with [11C]Raclopride based on biomathematical modelling approach
1Dept. of Quantum Science and Energy Engineering, Tohoku University, Japan
2Cyclotron radioisotope center, Tohoku University, Japan
3Shionogi & Co., ltd., Japan
Abstract
Objectives
Toward radioligand discovery and development, to predict pharmacokinetic of candidate PET radioligand before going to positron-labelling would be helpful information for decision-making. However, conventional predictions based on biomathematical modeling approach were only limited to the time-course of the radioactivity concentration (1-dimension, 1D).1,2 Real PET study provides the biositrtibution of administrated radioligand in the body as an 3D image or 4D in case of dynamic study and these are used for understanding mechanisms and diagnosis of target disease, treatment efficacy and so on. In this study, we extend the biomathematical model and proposed the concept to predict brain PET image without PET measurement but with only the structures of radioligand. The concept was preliminary investigated with rat brain PET with [11C]Raclopride and predicted PET image were compared with measured PET images.
Methods
To predict pseudo rat brain PET image, we classified brain regions of Sprague Dawley rat brain atlas (www.nitrc.org/projects/whs-sd-atlas) into striatum and remainder of brain. For each region, time-activity curves (TACs) with [11C]Raclopride were predicted using previously proposed our method2 which required only structure of radioligand, affinity (Kd) of [11C]Raclopride and densities of D2 receptor (Bmax), and arterial input function. Kd and Bmax of [11C]Raclopride were referred from publications3,4. As arterial input function, PK-based (PK) and the combination of exponential (EXP) functions [
Results
Different shapes between two arterial input functions (PK and EXP) were observed (Fig. 1A) and then propagated into different predicted TACs in both striatum and other regions (Fig. 1B). Compared with measured rat PET data, TACs with EXP input functions were visually similar but PK-input function was not. As a result of predicted PET image, Pseudo SUVR image with EXP input function was comparable to that with PK-input function (Fig. 1C).
Conclusions
We performed preliminal proof-of-concept study to predict PET image from structure of radioligand. Our approach may have a potential to contribute on the radiotracer development in CNS but further investigation would be necessary. (A) Arterial input functions, (B) measured and predicted TACs, (C) Measured and Predicted SUVR maps.
References
PP02-L03
High-throughput rat brain PET imaging and automatic spatial normalization of the dopamine D2/3 receptor ligand [18F]fallypride
1Neurobiology Research Unit, Copenhagen University Hospital, Copenhagen, Denmark
2Institute of Aerospace Medicine, German Aerospace Center (DLR), Cologne, Germany
3TH Köln, University of Applied Sciences, Faculty of Information, Media and Electrical Engineering (IME), Cologne, Germany
4Department of Drug Design and Pharmacology, University of Copenhagen, Copenhagen, Denmark
5Department of Clinical Physiology, Nuclear Medicine and PET, Copenhagen University Hospital, Copenhagen, Denmark
6Center for Translational Neuromedicine, University of Copenhagen, Copenhagen, Denmark
Abstract
Objectives
Rat brain PET-imaging is often quite labor- and time intensive, as only single animals are scanned at a time and isotopic decay offers a limited window of optimal scan time. To optimize the throughput, we created a 2x2 rat holder into the High-Resolution Research Tomography (HRRT) scanner, enabling the scanning of four animals at a time. This higher throughput shifts the bottle-neck towards the analysis of the PET images. There is an unmet need in preclinical brain PET analysis to create reliable automated methods of spatial normalization, because manual alignment and normalization is time-consuming and inevitably operator biased. We present a non-biased standardized method for automatic spatial normalization of multimodal (CT, MR and PET) scans for the radioligand [18F]fallypride. Similar approaches are already done ([18F]FDG) or are planned ([18F]MHMZ).
Methods
[18F]Fallypride was synthesized using standard procedures and obtained a molar radioactivity of over 40 GBq/µmol. Rats were anesthetized with isoflurane, placed in the holder, injected with [18F]fallypride and scanned for 45 min post injection. Up to 12 rats (three times four) were scanned with the same tracer production. Using brain PET, and a standard MR and CT image, an image template in standard space was created. In combination with this template, we created an automatic spatial normalization and VOI extraction algorithm based on MATLAB, FSL and PMOD. The non-displaceable binding potential (BPND) was calculated using a delayed scan logan plot (Tantawy et al. 2009). The automated algorithm was further assessed by transforming the PET template back to the original image, calculating the mean voxel displacement. Lastly, we used the holder and automatic procedure to measure drug induced occupancy at the dopamine D2 receptor. Values are reported ± standard deviation.
Results
Nine [18F]fallypride baseline PET Scans were used to generate the PET template, which were the basis for the automatic procedure for spatial normalization. The BPND of 18 [18F]fallypride baseline scans were then compared between manually and automated spatial normalization. By using the same VOI-template the correlation between the automated and manual analyzed BPNDs in the ventral and dorsal striatum as well as mPFC (Medial Prefrontal Cortex) was R2 = 0.8 (ventral striatum: 2.40 ± 0.44 automatic and 3.33 ± 1.39 manual, dorsal striatum 3.70 ± 0.80 automatic and 5.23 ± 2.41 manual, mPFC: 1.01 ± 0.23 automatic and 0.83 ± 0.64 manual). The back transformation gave a mean voxel displacement of −0.44 ± 0.83 mm, however three out of 18 transformations failed.

Conclusions
The automated analysis underestimated the BPND compared with the manual analysis, however the manually analyzed scans have a higher standard deviation, suggesting some degree of operator bias. The voxel-displacement succeeded since it is far lower than the voxel size (1.21875 mm3). In summary, it can be stated that we generated a fast and reliable procedure for reproducible spatial normalization of rat PET images for [18F]fallypride. The method has a high potential for being applicable to images from other radioligands with sufficient spatial information in the future like [18F]MHMZ.
Reference
PP02-L04
Evaluation of two signal multiplexing readouts for a brain PET
1Shenzhen Institutes of Advanced Technology
Abstract
A high-resolution (∼1.5 mm) and high-sensitivity (>10%) brain-dedicated PET insert is under development at the Shenzhen Institutes of Advanced Technology, China. The brain PET will be inserted in a MRI systems to obtain simultaneous PET/MRI brain images. Dual-ended readout detector modules based on SiPM arrays coupled to both ends of LYSO arrays will be used to obtain the gamma photons’ depth-of-interaction (DOI) information to maintain a uniform high-resolution across the field-of-view (FOV). As the PET system will have > 40,000 SiPMs, to simplify the readout electronics, two signal multiplexing readouts (figure 1 (top row)) were evaluated using 10 × 10 arrays of SiPMs and a 20 × 20 array of 1.42 × 1.42 × 20 mm3 polished LYSOs. The 10 × 10 SiPM arrays have a pitch size of 3.36 mm and were fabricated using SensL MicroFJ-30035-TSV SiPMs. The LYSO array has a pitch size of 1.5 mm and BaSO4 with a thickness of 80 µm was used as inter-crystal reflector.
Figure 1 (top row) shows the schematics of the two signal multiplexing readouts. One readout uses capacitors to split the current signal of the SiPMs (named as capacitive charge-division readout) and the other uses resistors to split the current signal of the SiPMs (named as resistive charge-division readout).
To compare the two signal multiplexing readouts, the performance in terms of flood histogram, energy resolution, DOI resolution and timing resolution of two dual-ended readout detectors were evaluated and compared. Each detector has two same SiPM arrays coupled to both ends of the same LYSO array using BC-630 optical grease. Clear acrylic sheets with a thickness of 0.9 mm were used as light guides. All the experiments were done at a bias voltage of 29.5 V and a temperature of 22.8 ± 0.3°C.
The results show that the flood histogram obtained using the resistive charge-division readout is better than the flood histogram obtained using the capacitive charge-division readout (figure 1 (bottom row)). The energy resolution, DOI resolution and timing resolution obtained using the resistive charge-division readout are 16.9 ± 6.5%, 1.96 ± 0.23 mm and 1.22 ± 0.07 ns respectively, and those obtained using the capacitive charge-division readout are 18.9 ± 6.2%, 1.93 ± 0.20 mm and 1.25 ± 0.11 ns, respectively.

In conclusion, the overall performance obtained using the detector module based on the resistive charge-division readout are better than that obtained using the detector module based on the capacitive charge-division readout, and resistive charge-division readout will be used for our brain PET.
PP02-L05
A method to create images of occupancy and nondisplaceable binding: a voxel-level extension of the Lassen plot
1Department of Radiology, Yale University, USA
2Department of Psychiatry, Yale University, USA
3Department of Biomedical Engineering, Yale University, USA
Abstract
Objectives
PET can be used to estimate receptor occupancy (RO) by an exogenous drug. For radiotracers without a reference region, a modified Lassen plot is typically applied to estimate occupancy.1 However, this approach assumes homogenous RO throughout the brain or a priori knowledge of regional differences in occupancy (Figure A). A valuable test-case of regional heterogeneity occurs when a selective exogenous drug is used to block a non-selective radiotracer. The radiotracer [11C]PF-04171252 binds to both the serotonin-6 (5-HT6) and 5-HT2 receptor. Blocking with a selective 5-HT6 antagonist should result in an appreciable reduction in available receptors in 5-HT6 rich regions (e.g. striatum), but little to no reduction in regions with only 5-HT2 (e.g. frontal cortex). We propose a voxel-wise approach, which will allow estimation of RO without a priori knowledge about regional differences in occupancy or receptor subtype heterogeneity.
Methods
Images of specific (VS) and nonspecific (VND) binding, and RO were created with varying levels of spatial heterogeneity. A Lassen plot was constructed for every voxel (i,j,k) and its 26-nearest-neighbour voxels. The estimated RO and VND were assigned to the (i,j,k) voxel in respective RO and VND images. Data were also analyzed from a drug occupancy study in humans. 12 participants underwent three PET scans with [11C]PF-04171252. After the baseline scan, participants received 2 to 60 mg of a selective 5-HT6 antagonist before the second PET scan (4 hours after administration) and the third scan (24–168 hours later). We used voxel-level RO maps to determine regional occupancy of 5-HT6 by the antagonist in the caudate, putamen, and frontal cortex.
Results
Voxelwise Lassen plot analysis of simulated VT images produced unbiased RO and VND estimates, independent of local variation in RO or VS. A small negative bias was evident when the variance was much greater in VND than VS. In the [11C]PF-04171252 dataset, no significant RO was observed in the frontal cortex for any drug doses. No occupancy was observed after the lowest dose (2 mg) in caudate and putamen at any timepoint. Higher doses (3–60 mg) achieved an average RO (mean ± SEM) of 0.65 ± 0.04 in the caudate and 0.71 ± 0.03 in the putamen at 4 hours and 0.75 ± 0.04 and 0.79 ± 0.04 at 24 hours respectively (Figure B). No evaluated dose achieved significant occupancy after 24 hours.

Conclusions
The voxelwise Lassen plot method provided robust and unbiased estimates of RO and VND, with small negative bias in RO that depended on local variability in VND. In the [11C]PF-04171252 dataset, significant occupancy was observed in regions where the exogenous drug was known to bind, but not in other regions (where the tracer but not the drug bound, specifically). Voxel-wise RO estimation is therefore suitable to quantify blocking of a non-selective tracer by a selective compound. This method should be generally applicable in quantification of most RO studies even in the absence of prior knowledge about regional variation in receptor subtype or occupancy.
Reference
PP02-L06
Sert binding used as a regressor in modeling the acute pharmacological response to ssris in the human brain using hybrid PET/MR imaging
1Department of Psychiatry and Psychotherapy, Medical University of Vienna, Austria
2Department of Biomedical Imaging and Image-guided Therapy, Division of Nuclear Medicine, Medical University of Vienna, Austria
Abstract
Objectives
Selective serotonin transporter (SERT) reuptake inhibitors (SSRIs) are considered as first-line pharmacotherapy in several psychiatric disorders,e.g. major depressive disorder. Hybrid PET/MR might aid to clarify neurobiological mechanisms of their efficacy and acute pharmacological effects may be associated with treatment response. However, the establishment of a baseline to which data can be compared after drug application is a main challenge in imaging acute pharmacological effects since the resting-state functional MRI (fMRI) signal is non-stationary and effects are rarely known a priori. Thus, external information such as drug plasma concentrations and the use of linear ramp functions were used to detect changes in brain activation after drug challenge1,2. We aimed to model pharmacological fMRI (phMRI) response by using the simultaneously acquired time course of SERT binding from PET as regressor.
Methods
38 healthy subjects(29.1 ± 9.4 y,21female) underwent two [11C]DASB bolus plus constant infusion hybrid PET/MR scans during which pharmacological challenge with the SSRI citalopram (8 mg) or placebo was performed following a double-blind cross-over study design as described previously.3 Pharmacological challenge was applied intravenously over 8 min starting 70 min after tracer bolus. Resting-state fMRI data was acquired for 40 min at least 5 min before drug application. List-mode PET data was reconstructed into three frames à 5 min before drug challenge, five frames à 2 min and nine frames à 5 min starting with the application of the study medication and 10 min frames thereafter. Time activity curves were extracted from thalamus and cerebellar grey matter. Activity of brain regions was divided by metabolite-corrected plasma activity and thalamus binding potentials (BPP) were calculated by subtraction of cerebellar gray matter. Average BPP were calculated for frames acquired before drug challenge equal between placebo and SSRI scans in order to remove deviations of occupancy from 0 due to random variability. For each subject a regressor for changes in SERT binding was obtained by fitting three exponentials to relative difference in BPP between conditions calculated for each frame(t) using the following formula: Occupancy(t) = (BPP-Placebo(t)–BPP-SSRI(t))/BPP-Placebo(t). Individual time courses of relative change in SERT binding was tested by applying it as regressor to fMRI data and calculating paired t-tests between regression coefficients obtained for placebo and SSRI scans.
Results
Exclusion of 2 subjects was necessary due to technical difficulties. Successful application of the study medication was confirmed by SERT occupancy (48–81%) in all subjects (mean ± SD = 69 ± 7%). Using paired t-tests no significant differences in regression coefficients between placebo and SSRI scans was detected after family-wise error (FWE) correction.
Conclusions
We could not replicate previously reported pharmacological effects of SSRIs4 using a novel approach of pharmacological modeling of phMRI data. Our findings highlight the importance of appropriate correction for FWE and cast doubt if the detection of acute effects of SSRIs should be sought in absolute changes in resting-state fMRI signal. However, future studies applying data driven methods which take regional specialization and non-stationarity of brain activity into account may capture these effects with higher sensitivity.
References
PP02-L07
Clustering-based data reduction algorithm with simplified reference tissue model to generate parametric images in amyloid imaging
1Graduate School of Biology-Oriented Science and Technology, Kindai University, Wakayama, Japan
2Research Team for Neuroimaging, Tokyo Metropolitan Institute of Gerontology, Tokyo, Japan
3Faculty of Biology-Oriented Science and Technology, Kindai University, Wakayana, Japan
4Division of Positron Emission Tomography, Institute of Advanced Clinical Medicine, Kindai University, Osakasayama, Osaka, Japan
5Department of Radiology, Kindai University Faculty of Medicine, Osakasayama, Osaka, Japan
Abstract
Objectives
This study aims at proposing an algorithm to apply Simplified Reference Tissue Model (SRTM) voxel-by-voxel for amyloid imaging. SRTM generally estimates parametric images using the linearization method.1 We proposed a new estimation method combined with clustering analysis for kinetics (CAKS)2 as an alternative version SRTM. CAKS clusters voxels based on the kinetics of administered radiopharmaceutical. The cluster contains some hundreds of voxels, and the averaging of tissue TACs in a cluster reduces the noise. Its applicability combined with SRTM has been presented.3 In this study, the BPND image is quantitatively evaluated using a contrast between gray and white matters. The contrast is the key feature to diagnose AD.
Methods
BPND images were computed using the original SRTM and the proposed algorithm to PiB dynamic clinical data (in details, 5 negative and 5 positive cases). We set the ROI both on white matter and gray matter to calculate the contrast. corona radiata in white matter, and frontal lobe in gray matter. The contrast is defined as the difference of BPND between gray and white matters considering their deviation.
Results
There was no significant difference between the two contrast of the only SRTM (contrast: 1.21 ± 0.44) and SRTM with CAKS (contrast: 1.31 ± 0.42). The typical images are presented in Fig. 1. The computational time of SRTM2 with CAKS was just 15 sec.

Conclusions
By using SRTM2 with CAKS, the similar image that with that with SRTM2 was obtained, within a practical computational time. Further investigation will be conducted to compare the performance with linearized SRTM2 of the conventional method.
References
PP02-M01
Comparison of MR attenuation correction methods using CT-atlas vs. zero-TE on quantitative H215O-PET/MRI
1Biomedical Imaging Research Center, University of Fukui, Japan
2Dept. of Neurosurgery, University of Fukui, Japan
Abstract
Objectives
Accurate attenuation correction (AC) is one of the most important issues to be addressed in quantitative brain PET/MRI imaging. CT atlas (CTA) based MRI AC (MRAC), one of the representative MRAC methods, has been used to estimate the skull attenuation in brain scans. The zero echo time (ZTE) pulse sequence is also expected to provide a better MRAC estimation in brain PET scans. The difference in quantitative measurements of CBF using H215O
Methods
Twelve patients with cerebrovascular disease (4 males, 43.2 ± 11.7 y) underwent H215O
Results
The mean differences of IDIF curves at each point obtained from CTA- and ZTE-MRAC dynamic data were less than 5%, and the differences in time-activity curves were very small. The means of CBF from CTA- and ZTE-MRAC reconstructions calculated using each IDIF showed differences of less than 4% for all cortical regions. A scatter plot of the regional CBF values from the 310 ROIs used for CBF measurement showed a good correlation. CBF images from CTA-MRAC tended to show greater values in the parietal region and smaller values in the skull base region.

Conclusion
The CBF images from CTA- and ZTE-MRAC reconstruction showed no significant differences in regional values, although the parietal region tended to show greater values in CTA-MRAC reconstruction. Quantitative values in the skull base region were very close, and almost the same IDIFs were obtained.
PP02-M02
The impact of clinical atlas-based MR attenuation correction on the diagnosis of FDG-PET/MR for Alzheimer’s diseases— simulation study combining multi-center data and ADNI-data
1Department of Radiology, Nippon Medical School, Japan
2Department of nuclear medicine, University Hospital Zurich, Swiztzerland
3GE Healthcare, Waukesha, WI, USA
4Department of Radiology, Mayo Clinic, Rochester, MN, USA
5Department Joint Medical Imaging, Toronto General Hospital, Toronto, Canada
Abstract
Introduction
PET/MR systems are increasingly used for clinical neurodegenerative evaluation and research. One paradigmatic PET/MR application is the assessment of dementia. However, suboptimal MR-based attenuation correction (MRAC) on clinical PET/MR causes quantification errors in PET images, which may degrade diagnostic accuracy. The purpose of this study was to assess the impact of clinical MRAC on the evaluation of Alzheimer’s disease (AD).
Methods
We recruited 47 patients from two institutions who underwent PET/CT and PET/MR (GE SIGNA) examination for oncological staging. From the PET raw data acquired on PET/MR, two FDG-PET series were generated, based on clinical MRAC (atlas-based method) and CTAC. The following simulation steps were performed in MNI space: After spatial normalization and smoothing of the PET datasets, we calculated the error map for each patient, as PET based on MRAC divided by that based on CTAC. We multiplied each of these 47 error maps with each of the 203 Alzheimer’s Disease Neuroimaging Initiative (ADNI) cases after the identical normalization and smoothing. This resulted in 203*47 = 9541 datasets. To assess the diagnostic accuracy of the resulting images in AD, an AD PET score was calculated automatically by using a standard software (PMOD PALZ) which incorporates a method published by Herholz et al. (2002).
Results
The accuracy, specificity for the discrimination of AD-patients from normal controls was not substantially impaired but sensitivity was slightly impaired in 5 out of 47 dataset (original vs. error; 83.2% [CI 75.0%–89.0%], 83.3% [CI 74.2%–89.8%] and 83.1% [CI 75.6%–88.3%] vs. 82.7% [range 80.4–85.0%], 78.5% [range 72.9–83.3%,] and 86.1% [range 81.4–89.8%]). The accuracy, sensitivity and specificity for predicting progression from MCI to AD during 2-year follow-up was not impaired in any of the 47 dataset (original vs. error; 62.5% [CI 53.3%–69.3%], 78.8% [CI 65.4%–88.6%] and 54.0% [CI 47.0%–69.1%] vs. 64.8% [range 61.5–66.7%], 75.7% [range 66.7–81.8%,] and 59.0% [range 50.8–63.5%]). The worst 3 error maps show a tendency towards underestimation of PET scores.
Conclusion
Clinical atlas-based MR attenuation correction is expected to have sufficient diagnostic accuracy for the diagnosis of Alzheimer’s disease and for the prediction of mild cognitive impairment progression to Alzheimer’s disease, although sensitivity is slightly impaired.
PP02-M03
Gap filling and rebinning algorithms for 3D PET data
1Lauterbur Research Center for Biomedical Imaging, Shenzhen Institutes of Advanced Technology, Chinese Academy of Sciences, China
Withdrawn
PP02-M04
SPM statistical analysis in focus side diagnosis of temporal lobe epilepsy with PET
1Dept. of Neurosurgery, Tokyo Medical and Dental University, Japan
2Research Team for Neuroimaging, Tokyo Metropolitan Institute of Gerontoloty, Japan
3Dept. of Neurosurgery, Tokyo-Kita Medical Center, Japan
Abstract
Objectives
18F-Fluorodeoxyglucose (FDG) positron emission tomography (PET), 11C-Flumazenil (FMZ) PET has been established as one of means for diagnosing epilepsy focus point. By comparing visual diagnosis of conventional PET with focus diagnosis which statistically analyzed image by executing SPM (Statistical Parametric Mapping) analysis on PET, SPM analysis of FDG-PETand FMZ-PET Whether it contributes to improvement of the diagnostic rate or not was evaluated by focus side diagnosis of temporal lobe epilepsy.
Methods
52 patients with temporal lobe epilepsy who underwent surgery at our hospital (average age 30.1 years old, male 23, female 29). All patients performed FDG-PET and FMZ-PET before surgery and focus side was diagnosed visually. In the SPM analysis, SPM 8 software was used to normalize and smooth the target PET images, t-tests were performed on each images and voxels with age matched healthy group, and sites with significant differences were mapped (P < 0.05)(Figure).
A site where glucose metabolism (FDG-PET) and central benzodiazepine receptor binding ability (FMZ-PET) was significantly reduced as compared with the healthy subject group was visualized as a positive image. We compared the consistency with the definitive diagnosis after surgery for the case where the focal side was visually examined by PET and the case where the diagnosis was made using statistically analyzed images by SPM.
Results
As a result of visual examination of the focal side of 52 cases of preoperative FDG-PET, the concordance rate with the definitive diagnosis after surgery was 65.4%, the concordance rate of FMZ-PET was 51.9%. On the other hand, when SPM analysis was used, the concordance rate of FDG-PET was 94.2% and the coincidence rate of FMZ-PET was 92.3%.

Conclusions
Epilepsy focal diagnosis is performed diversely by multiple modalities. PET is one of important tools, but the coincidence ratio on the focus side markedly increased by using SPM analysis for both FDG-PET and FMZ-PET. SPM analysis of PET was considered to be a very useful tool in focus side diagnosis of temporal lobe epilepsy before surgery.
References
PP02-M05
Super-resolution PET/CT image based on dictionary learning and random forests
1Shenzhen Institutes of Advanced Technology, Chinese Academy of Sciences
Withdrawn
PP02-M06
Dictionary learning and patch-based regularization image reconstruction for positron emission tomography
1Shenzhen Institutes of Advanced Technology, Chinese Academy of Sciences
Abstract
Objectives
Positron emission tomography (PET) is an important tool for nuclear medical imaging. It has been widely used in clinical diagnosis, scientific research, drug testing and other fields.1 PET is a kind of emission computed tomography. Its basic imaging principle is to use the positron annihilation radiation generated by radionuclide decay to generate gamma photon images [2–3]. However, in practical applications, due to the low gamma photon counting rate, the limited acquisition time, inconsistent detector characteristics and electronic noise, the measured PET projection data often contain considerable noise, which results in ill-conditioned PET images. Therefore, the question of how to obtain high-quality reconstructed PET images suitable for clinical applications is a very valuable research topic. In this context, this paper presents an image reconstruction algorithm based on patch-based regularization and dictionary learning (DL), called the patch-dl algorithm. The proposed algorithm can retain more image details while suppressing noise.
Methods
Each iteration of the algorithm consists of four simple steps: an expectation maximization (EM)-like image update step, an image smoothing step, a pixel-by-pixel image fusion step and a dictionary learning step. We used a 2-D brain phantom to evaluate the proposed algorithm by simulating sinograms that contained Poisson random noise. Since the patch-based regularization is more robust than the conventional pixel-based regularization in differentiating sharp edges from random fluctuations due to noise, dictionary learning can preserve the best features of an image to reduce feature dimension and noise, and thus a better reconstruction quality is achieved.
Results
The images reconstructed with the different algorithms are shown in Fig. 1. The results show that patch-dl methods has better performance than pixel- and patch-based methods. Through computer simulations, we demonstrated the advantages of the patch-dl method compared to the pixel- and patch-based methods in terms of the tradeoff between noise suppression and detail retention in the reconstructed images.

Conclusions
The results show that the proposed algorithm has great potential to improve the quality of PET image reconstruction.
References
PP02-M07
Improving analysis of neuroimaging applications of PET/CT scanners with CT-driven information
1Dept. of Radiology, Johns Hopkins University, USA
Abstract
Objectives
Combined PET-CT scanners are widely employed in studies of rodent models of brain diseases due to availability and cost. In neuroimaging applications, tracer-specific standard PET volumes (e.g., Casteel et al, 2006) appeared to successfully overcome the paucity of anatomical information from CT. We tested whether CT-derived scaling factors could improve adjustment of individual brains’ dimensions, compared to conventional direct PET-to-standard PET coregistration approaches.
Methods
PET and CT data were obtained from a historical PET study in which 16 wildtype mice were scanned for 60 min after a bolus injection of [18F]-FPEB (200–250 µCi). Two mice were scanned in single sessions in ‘best-fit’ positions.
Ten raters manually aligned individual animal’s CT to our standard skull outlines to refine with SPM12’s coregistration module (a 9-parameter fit) subsequently. The same procedures were repeated for PET with our standard FPEB PET scaled to the subject’s dimensions by the CT-derived scaling factors (thus, 6-parameters fit). The same CT procedures were used to generate standard, averaged CT and skull outlines using a single mouse MRI and CT that were manually oriented in a standard orientation. For PET, individuals’ PET volumes were scaled to the standard dimensions via CT, averaged across mice, and coregistered to the MRI to be a FPEB-specific standard PET. For comparison, individual PET volumes were coregistered to the standard PET with 9- and affine 12-parameter fits (p9 and p12) without and with initial guesses. TACs were generated for 9 brain regions to obtain BPND values (target-cerebellum ratios less one) for proposed (PA), and p9 and p12 approaches. For evaluation of special registration, coordinates of standard skull outlines were displaced to native CT or PET spaces using manual and automated parameters. Mean deviations from rater mean coordinates for PA and mean distances from PA-derived coordinates for p9 and p12 approaches were obtained.
Results
All approaches failed in all cases without initial guesses from manual alignments. For PA, mean deviations of skull outline coordinates decreased to negligible levels (CT: < 0.015; PET: < 0.034 mm) after refinements, despite substantial inter-rater variabilities with manual alignments (CT: 0.13; PET: 0.49 mm, medians). Mean distances from PA were < 0.23 mm for p9 and < 0.26 mm for p12 (PET alone). Observed differences could be explained by estimates of y- and z-scaling factors (Figure A; y-ratio > 1 with t > 153.8 and p < 10−14; z-ratio < 1 with t > 157.7 and p < 10−15). While observed mean SUV values (30–60 min) correlated (p9 or p12 verses PA; slope: 1.01; R2 > 0.999), regional BPND values scattered mainly below identity lines (Figure B for p9 versus PA) with lesser R2 values (0.963–0.965).

Conclusion
Observed robust coregistration and visual inspection results strongly suggested that CT-derived scaling factors successfully adjusted brain dimensions across individual animals. Under this assertion, PET-to-standard PET coregistration could be error prone in the dimension adjustment, which could in turn result in underestimation of BPND values in [18F]-FPEB scans.
Acknowledgments
We thank Gary Wand and Mary E McCaul for providing data. Grant Support: 1R01AA023483, R01DA042094
PP02-M08
The impact of different preprocessing strategies in PET neuroimaging: A [11C]DASB-PET study
1Neurobiology Research Unit, Copenhagen University Hospital, Denmark
2Faculty of Health and Medical Sciences, University of Copenhagen, Copenhagen, Denmark
3Department of Computer Science, University of Copenhagen, Copenhagen, Denmark
4Rotman Research Institute at Baycrest, and Department of Medical Biophysics, University of Toronto, Toronto, Canada
5Athinoula A. Martinos Center for Biomedical Imaging, Massachusetts General Hospital, Harvard Medical School, Boston, MA, USA
Abstract
Objectives
Investigate in a double-blind, randomized, placebo-controlled [11C]DASB-PET study how the choice of preprocessing strategy affects the outcome of the study.
Introduction
Positron Emission Tomography (PET) neuroimaging provides unique possibilities to study biological processes in vivo under baseline conditions and across interventions. For quantification of PET data, researchers apply different arrays of sequential data analytic methods (“preprocessing strategy”, also referred to as “pipeline”), but it is unknown how the choice of preprocessing strategy affects the final outcome (Nørgaard et al. 2018).
Methods
We tested the impact of 384 commonly used preprocessing strategies on a previously reported positive association between the change from baseline in neocortical serotonin transporter binding determined with [11C]DASB-PET, and change in depression score, following a pharmacological sex steroid manipulation in 30 women (Frokjaer et al. 2015).
The preprocessing strategies included a fixed sequence of five preprocessing steps, each with varying parameter choices: (1) motion correction (with/without), (2) co-registration (four choices), (3) delineation of volumes-of-interest (three choices), (4) partial volume correction (four choices), and (5) kinetic modeling for quantification of SERT binding (MRTM, SRTM, Non-invasive Logan and MRTM2).
Results
We find that 36% of our preprocessing strategies replicate the originally reported finding (p < 0.05), meaning that 64% of preprocessing strategies do not result in a statistically significant association. Effect sizes (Pearson’s r) ranged from −0.06 to 0.45. The two preprocessing steps that were most critical for the outcome were motion correction and kinetic modeling of the dynamic PET data.

Conclusion
The preprocessing framework may be used to estimate the expected conclusion conditioned over preprocessing strategies for establishing confidence (i.e. 36%) in the extent to which the produced conclusions are preprocessing independent. This should help to produce reproducible conclusions, avoid biased solutions and reduce both type I and type II errors. In conclusion, the choice of preprocessing strategy can have a major impact on a study outcome.
References
PP02-M09
Edge artifacts attributable to point spread function correction included in regularized reconstruction for brain PET imaging
1Research Team for Neuroimaging, Tokyo Metropolitan Institute of Gerontology
2GE Healthcare
Abstract
Objective
Image reconstruction software which uses block sequential regularized expectation maximization (BSREM) algorithm[1] (e.g. Q. Clear in GE PET/CT) is beginning to be installed in the commercial PET scanner. BSREM controls noise at iterative reconstruction by applying a relative difference penalty function. It enables more iterations, and better contrast recovery, without noise amplification. Software packages of the BSREM-based reconstruction generally include point spread function (PSF) correction. Although the PSF correction improves spatial resolution, it has hardly been used for the brain PET imaging because it also caused the edge artifacts[2]. In this study, the influences of the PSF correction included in the BSREM-based reconstruction in brain PET imaging were investigated.
Methods
The data of Hoffman phantom study and clinical [18F]FDG brain PET study with a normal volunteer (male, 51 y.o.) were used. In the clinical study, 10-min brain PET scan was performed after administration of [18F]FDG (138 MBq). The approximately equivalent conditions (8-min scan, 13 MBq of [18F] in the phantom at scan start) were set in the phantom study. Discovery MI (GE Healthcare) was used in the both studies. The PET images were reconstructed using conventional 3D-OSEM (4 iterations, 16 subsets, without PSF correction, 2 mm Gaussian post filter), and regularized reconstruction (beta = 200) with and without PSF correction. The images and the voxel value profiles along the x-axis were reviewed and compared.
Result
From the images of phantom study, the edge artifacts were observed in the images with PSF correction. In the both images with and without PSF correction, the reproducibilities of the “true” edges of the BSREM were better than those of the 3D-OSEM. PSF correction in the BSREM slightly affected to the smoothness of the images. Figure shows the comparison of the images of the clinical study. Unnatural edge artifacts were observed in the images of BSREM with PSF correction. The comparisons of the images of a clinical FDG-PET study (male, 51 y.o., normal volunteer). Unnatural edge artifacts were observed in the images of BSREM with PSF correction.
Conclusion
BSREM without PSF correction has the potential to use in the brain PET imaging.
References
PP02-M10
Quantitative validation of standardized uptake value ratio derived from [18F]Florbetapir images acquired over a short duration
1Research Team for Neuroimaging, Tokyo Metropolitan Institute of Gerontology, Japan
2School of Health Science, International University of Health and Welfare, Japan
Abstract
Objective
The uptake time and the duration of positron emission tomography (PET) image acquisition using the amyloid tracer [18F]Florbetapir differs according to whether the procedure will be used for medical purposes or clinical trials. The uptake time after intravenous injection is defined as 30–50 min and the scan duration is defined as10–20 min after uptake time. Motion artifacts are likely to arise when images of older patients and in those with dementia are acquired by PET over longer periods. A shorter acquisition duration would be useful for amyloid PET although image noise increased by a shorter duration. Newer PET detectors have silicon photomultipliers (SiPM) instead of photomultiplier tubes. The wider axial field of view offered by SiPM-PET contributes to a shorter duration with good timing resolution and high sensitivity. The present study aimed to quantify the accuracy of PET images acquired over a shorter duration using [18F]Florbetapir.
Methods
Images were acquired from eight participants (age, 77.3 ± 11.9 y; height, 150.1 ± 11.21 cm; weight, 48.2 ± 6.2 kg [means ± standard deviation, SD;]) during a period of 20 min using a Discovery MI PET/computed tomography scanner (GE Healthcare). The mean ( ± SD) injected dose of [18F]Florbetapir was 365.0 ± 24.0 MBq and uptake required 50.0 ± 0.0 min. The list data of [18F]Florbetapir acquired for 20 min were reprocessed to produce the following sets of sinograms: 0–5, 0–10 and 0–20 min after scan start, and the images were reconstructedunder clinical conditions. All [18F]Florbetapir images were separately normalized to a standard [18F] Florbetapir PET template using Amygo neuro (FUJIFILM Toyama Chemical Co. Ltd.) software that was developed based on Statistical Parametric Mapping (SPM) 8 (Wellcome Trust Center for Neuroimaging). The anatomical volumes of interest (VOI) were automatically placed on the cerebellum, precuneus, anterior and posterior cingulate cortices, parietal, temporal, and medial frontal lobes. The reference region for calculating the standardized uptake value ratio (SUVR) was the cerebellum. The mean cortical SUVR (cSUVR) and regional SUVR (rSUVR) were calculated. A cSUVR of > 1.10 was defined as amyloid positive. We used repeated measures one-way analysis of variance and Tukey multiple comparisons tests to determine the significant difference among cSUVR and rSUVR. Values with P < 0.05 were considered significant.
Results
Four participants were amyloid positive (cSUVR > 1.10). The mean ( ± SD) cSUVR in participants with amyloid negative and positive for 5, 10 and 20 min were 0.95 ± 0.07, 0.95 ± 0.07, and 0.95 ± 0.07 and 1.40 ± 0.08, 1.40 ± 0.08, and 1.42 ± 0.09, respectively. The cSUVR in amyloid-positive patients increased slightly over the scan duration. The mean cSUVR and rSUVR in all participants did not differ significantly according using multiple comparisons.

Conclusions
The accuracy of images acquired using [18F]Florbetapir and PET with SiPM have good quantify even over a duration as short of 5 min because the standard protocol of [18F]Florbetapir includes a larger dose and shorter uptake time than other [18F] labelled amyloid PET imaging.
PP02-M11
The primary visual cortex is a potential pseudo-reference region for in vivo imaging of activated microglia in frontotemporal dementia using 18 F-FEPPA PET
1Lawson Health Research Institute
2Dept. of Medical Biophysics, Western University, London, ON, Canada
3Research Imaging Centre, Centre for Addiction and Mental Health, Toronto, Ontaio
4Clinical Neurological Sciences, Western University, London ON, Canada
Abstract
Objectives
Frontotemporal dementia (FTD) is the second most common form of presenile dementia, affecting primarily the frontal and temporal lobes and characterized by impairments in behaviour and language.1 The heterogenous complex pathological and behavioural presentations of FTD makes clinical diagnosis challenging. This, and the lack of approved disease modifying therapies underscores the need for concerted efforts to identify clinically relevant diagnostic and therapeutic targets. Inflammation is emerging as a potential critical contributor to FTD pathogenesis and/or progression, given that FTD genetic mutations are linked to altered microglial function and taupathies can induce inflammation.2 Since little is known of the cortical patterns of inflammation in FTD, we examined the regional pattern of activated microglia in the behavioural variant of FTD, using PET imaging and 18F-FEPPA, a PET ligand targeted to translocator proteins (TSPO) over expressed by activated microglia. Because there are no brain regions free of TSPO binding, we first explored whether the primary visual cortex (V1) can be a suitable pseudo-reference region for TSPO-PET quantification in FTD, in lieu of invasive kinetics modelling techniques and given known cerebellar degeneration in FTD.3
Methods
PET/MRI were acquired in 8 FTD patients and 11 healthy controls on a Biograph mMR system (Siemens Healthcare, Germany) immediately after 18F-FEPPA injection (∼5 MBbq/kg), for 90 mins. Prior to conversion to SUV, the PET data were corrected for attenuation, decay, and scatter, and reconstructed to 51 timepoints (OSEM; 3 iterations 21 subsets, 2 mm FWHM). Mean SUV images were generated by averaging over the last 30-min timepoints. The V1 mask was created by combining the V1 probability map from the Harvard-Oxford Atlas (fsl.fmrib.ox.ac.uk) and the Brodmann area 17 mask from WFUPickAtlas (fmri.wfubmc.edu), and edge-eroded. Each subject’s SUV timeseries and mean image were registered to the MNI template. The mean SUV were smoothed by a 10 mm FWHM Gaussian filter. Differences in SUV time-activity curve (TAC) and mean SUV in the V1 were compared between TSPO binding affinities and between groups. SUV images were then scaled by the mean V1 activity (SUVR) and compared voxelwise between groups controlling for TSPO binding affinities (one-way ANOVA; p < 0.05).
Results
The SUV TAC and mean SUV in the V1 were similar regardless of group or TSPO binding affinity (Fig.1). On average, patients had higher SUVR in fronto-temporal and cerebellum regions (see Fig.1b-c for voxelwise and post-hoc results).

Conclusions
Considering cerebellar degeneration in FTD,3 the V1 can be a potential input region for TSPO-PET quantification, although the cerebellum could be suitable in other dementias.4 Although preliminary, the pattern of elevated microglial activation in our FTD cohort overlaps with pathologically confirmed patterns.5 Using the V1 and the simplified reference tissue model, we will further confirm evidence of 18F-FEPPA binding in a larger cohort of FTD patients.
References
PP02-M12
Brain PET-MR attenuation correction with deep learning
1School of Biomedical Engineering and Imaging Sciences, King's College London, London, UK
2King's College London & Guy's and St Thomas' PET Centre, St Thomas' Hospital, London, UK
3Department of Psychosis Studies, Institute of Psychiatry, Psychology, and Neuroscience, King’s College London, London, UK
4CERMEP-Imagerie du vivant, Lyon, France
Abstract
Objectives
The best-performing methods for PET-MR attenuation correction (AC) give average PET quantification errors within ± 3% of CT-based AC[1], but are time consuming and less able than CT to capture inter-subject variability and model abnormalities. Deep learning methods have not yet been evaluated in large clinical cohorts with multiple tracers[2,3]. We use deep learning for PET-MR AC and compare it to the PET/CT used as gold standard and a well-performing[1] multi-atlas-based AC method[4] implemented on a CPU cluster.
Methods
Forty-three participants were scanned with [18F]fallypride PET (N = 13) or [18F]GE-179 PET (N = 30). Simultaneous PET-MR data were acquired on a 3T Siemens Biograph mMR PET-MR system, including a 3D T1-weighted MPRAGE sequence acquired in sagittal orientation (N = 13: 1mm3 voxels, 240×256×256 matrix; N = 30: ∼1.1mm3 voxels, 176×224×256 matrix). A separate low-dose reference CT image of the head with 30 cm field of view (140kVp, 8mAs) was acquired for each participant on a whole-body GE Discovery 710 PET/CT system on the same day.
Each participant’s CT image was aligned and resampled to their T1-weighted image using the SPM12 software. The bed was edited out of CT images, and T1-weighted images were normalised to have a zero mean and unit standard deviation.
We trained a convolutional neural network to produce pseudo-CTs. The network was implemented in NiftyNet[5] using the 3D high-resolution compact architecture[6] on an NVIDIA Quadro M4000 GPU. The T1-weighted images were randomly sampled into patches of 64×64×64 voxels, which were augmented by randomly rotating ( ± 10°) and scaling ( ± 10%). Thirty cases were used for training, 7 for validation and 6 for testing. We trained the network using the Adam optimiser and root mean squared error loss function for a total of 30,000 iterations, starting with a learning rate of 0.001, and reducing the learning rate by a factor of 10 after each block of 10,000 iterations. The pseudo-CTs were rescaled between the average minimum and maximum values of all reference CTs.
We computed the relative mean absolute error (MAE)[7] between reference CTs and pseudo-CTs from both methods within a head mask for each subject after conversion to μ-maps[8] with a paired t-test.
Results
Figure 1 shows the reference CT μ-map and example μ-maps and difference maps from the two methods. The processing time and rMAEs for pseudo-CTs generated by our method were significantly lower than those of the multi-atlas method (time/rMAE: ∼2mins/8.7 ± 1.2% and ∼2hours/12.1 ± 0.9% respectively; p = 0.003).

Conclusions
The proposed method represents an improvement over the current multi-atlas method in terms of both MAE and processing time. Future work will involve validation on our full research dataset (∼n = 80) and will compare differences in radioactivity concentration in reconstructed PET images.
References
PP02-M13
Non-invasive simplified metrics as a surrogate for validation of reference regions for [18F]Flortaucipir and [18F]Florbetapir brain PET studies
1Department of Radiology & Nuclear Medicine, VU University Medical Center, Amsterdam, Netherlands
2Alzheimer Center & Department of Neurology, VU University Medical Center, Amsterdam, Netherlands
Abstract
Objective
Simplified reference tissue methods(SRTM) are applied for quantification of brain PET studies, particularly because they eliminate the need to perform arterial cannulation. SRTM requires a validated reference region. Ideally, a proper validation of a reference region would be to perform blocking or displacement studies along with histopathological assessments on post-mortem tissue samples. This is rarely being executed due to expenses, and complex study designs. An alternative validation process is to assess if the reference region has similar kinetics irrespective of subject clinical status or (patho-) physiological conditions. This is done by comparing the distribution volume (VT) of the reference region between patients and controls. However, performing dynamic scans and arterial sampling is not always possible, specifically in elderly subjects and advanced disease stages. The aim of this study was therefore to determine if simplified non-invasive approaches could be used to verify a previously validated reference region for amyloid and tau PET imaging is still valid for use in subjects groups, where verification using plasma input is not feasible.
Methods
Dynamic 130 minutes [18F]Flortaucipir and 90 minutes [18F]Florbetapir PET scans were obtained from biomarker confirmed Alzheimer’s disease patients (AD; [18F]Flortaucipir n = 10, [18F]Florbetapir n = 8) and controls (C; [18F]Flortaucipir n = 9, [18F]Florbetapir n = 6) with arterial blood sampling. Regional time-activity-curves were generated using PVElab and Hammers template. Regional VT's were estimated from a reversible-two-tissue-compartmental model with blood volume parameter for both tracers and was considered as standard for validating an optimal reference region. Semi-quantitative measures (standardised uptake value corrected for body weight (SUVBW), lean body mass (SUL) and body surface area (SUVBSA)) were obtained by using a part (early, middle, or late) of dynamic scans and subject demographics. Simulations were also performed to evaluate the effect of flow and specific binding on the semi-quantitative metrics.
Results
Late uptake SUVBW, SUL and SUVBSA correlated well with VT for [18F]Flortaucipir and [18F]Florbetapir. SUL(80–100 min) (AD: r2 = 0.97; C: r2 = 0.95) and SUVBSA(50–70 min) (AD: r2 = 0.96; C: r2 = 0.77) correlated best with VT for [18F]Flortaucipir and [18F]Florbetapir respectively. A SUL(80–100 min) less than 1 for [18F]Flortaucipir and SUVBSA(50–70 min) less than 0.03 for [18F]Florbetapir suggest absence of specific binding. In addition, for [18F]Flortaucipir clear regional differences between AD patients and C's were obtained with the simplified metrics, however, in case of [18F]Florbetapir these differences were less explicit. Even then, validation of the reference regions seems to be possible using SUV metrics (Figure1). Simulations confirmed that SUL and SUVBSA were only slightly (<5%) effected, even with flow changes of 30%. Yet, change in SUL and SUVBSA are predominantly related to the presence of specific binding and thus suggesting that these SUV metrics can be used to assess absence of specific binding in reference regions.

Conclusion
In situations where dynamic scanning and arterial sampling is not feasible, SUL derived at 80 to 100 min for [18F]Flortaucipir and SUVBSA at 50 to 70 min for [18F]Florbetapir can be used to evaluate the use of previously validated reference region.
PP02-M14
Controlling the false positive rate for lp-ntPET: a correction to goodness of fit metrics for "effective" number of parameters
1Dept. Biomedical Engineering, Yale University, USA
2Dept. Radiology and Biomedical Imaging, Yale University, USA
3Dept. Psychiatry, Yale University, USA
Abstract
Objectives
Linear parametric neurotransmitter PET1 (lp-ntPET) is a novel kinetic model that uses discrete basis functions to estimate the temporal characteristics of neurotransmitter (NT) release. The model contains seven total parameters: three describing tracer delivery—identical to the multilinear reference tissue model2 (MRTM)—and four implicitly describing NT release through basis functions. Goodness of fit (GOF) metrics evaluate the significance of improvement in a fit by lp-ntPET over MRTM. These metrics expect precise knowledge of the number of parameters in lp-ntPET. However, the basis function implementation means that NT parameters do not span the entire parameter space. We assert that proper use of GOF metrics requires formulation using an ‘effective number of parameters’ (ENP). We hypothesize ENP increases with number of basis functions. We used model selection metrics to determine the ENP of lp-ntPET for a stipulated false positive rate (FPR).
Methods
We performed null simulations of PET data using the MRTM model (mean values: R1 = 1, k2 = 0.42 min−1, BP = 3), which included no NT effect. We applied varying levels of measurement noise within the scan. 10,000 time-activity curves (TACs) were simulated for each noise level, with 10% population variance in kinetic parameters. All TACs were fitted with MRTM and lp-ntPET using 4 different basis function libraries containing 1, 12, 84, and 396 curves. Because all data were generated by MRTM, any significant improvement in fit by lp-ntPET must be overfitting. An F-statistic was computed from each pair of fits, assuming 7 full parameters in lp-ntPET. We compared the 95th percentile F-statistic from all TACs to the theoretical Fcritical threshold for p < 0.05, assuming 7 full parameters. We determined FPR from the Fcritical threshold, for each noise level. To determine ENP, we solved for plpntPET iteratively from the formulas for the Akaike and Bayesian information criterion (AIC, BIC) such that lp-ntPET was selected as the superior model 5% of the time (i.e., FPR = 5%).
Results
The FPR calculated from F-values ranged from 7–31%, increasing with noise and number of bases. The 95th percentile of calculated F-values was consistently greater than the Fcritical threshold (p < 0.05) assuming 7 lp-ntPET parameters (Fig. A). For both AIC and BIC, the “effective” number of parameters increased with more noise and more basis functions (Fig. B).

Discussion
When fitting null data, we expect a 5% FPR if the Fcritical threshold is set at p < 0.05; that is: lp-ntPET should emerge as the superior model by chance for 5% of fitted curves. Our finding of a consistently higher FPR suggests the need for a more stringent threshold when using the F-test with lp-ntPET. Further, in order to properly use GOF metrics as a means of model selection, one must determine the ENP, which may not be equal to the number of parameters in the model. For models using a basis function implementation, the number of bases must be considered as well as the noise. Our results caution against naïve application of model selection criteria when considering models implemented with discrete numbers of basis functions.
References
PP02-N01
Progress in spatial resolution for imaging the human brain
1Dept. of Nuclear Medicine and Radiobiology, Université de Sherbrooke, Sherbrooke, QC, Canada
2Sherbrooke Molecular Imaging Center, CRCHUS, Sherbrooke, QC, Canada
3Dept. of Computer Science, Université de Sherbrooke, Sherbrooke, QC, Canada
4IR&T Inc., Sherbrooke, QC, Canada
5Novalgo Inc., Sherbrooke, QC, Canada
6Interdisciplinary Institute for Technological Innovation – 3IT, Sherbrooke, QC, Canada
7Dept. of Electrical and Computer Engineering, Université de Sherbrooke, Sherbrooke, QC, Canada
Abstract
Rationale
For the past 20 years, the HRRT, achieving 2.5 mm spatial resolution, has been the workhorse for state-of-the-art PET imaging in neuroscience. Nevertheless, this spatial resolution is far beyond the theoretical limit achievable in PET for imaging the brain.
Objectives
The aim of this work is to develop an ultra-high resolution (UHR) human brain-dedicated PET scanner reaching a resolution close to the physical limit imposed by the positron range and annihilation photon non-collinearity.
Method
The proposed UHR brain scanner relies on the LabPET II™ technology recently developed for small animal high-resolution imaging.1 The basic detector elements consist of 4×8 arrays of 1.12×1.12×12 mm3 Lu1.9Y0.1SiO5:Ce (LYSO) scintillators read out by 4×8 pixelated monolithic APD arrays, featuring one-to-one coupling between individual crystal and photodetector pixels. The signal from each individual pixel is processed using fully-parallel integrated front-end electronics based on a dual-threshold time-over-threshold (TOT) method implemented in 64-channel mixed-signal application specific integrated circuits (ASIC). The UHR brain scanner uses 4032 of these detector arrays, forming a 39-cm diameter by 23.5-cm axial length cylinder with 144 rings of 896 pixel detectors, defining a 26-cm diameter FOV. Simulations of the UHR scanner performance were carried out following NEMA standards using the Geant4 Application for Tomographic Emission (GATE) software.2 Images of hot-spot resolution phantoms and of 3-D voxelized human brain phantoms were reconstructed using the Customizable and Advanced Software for Tomographic Reconstruction (CASToR)3 with a system matrix implementing an accurate description of the physical detection processes. Initial experiments were performed using a single detector ring prototype having an axial length of 10.8 mm.
Results
From simulations, a reconstructed nearly isotropic spatial resolution of 1.35 mm FWHM is obtained at 10 mm from the center of the FOV and the resolution remains below 3 mm FWHM up to 90 mm from the FOV center. With an energy window of 250–650 keV, the system absolute sensitivity is estimated at 3.5%, the maximum NECR reaches 16.4 kcps at 12 kBq/cc and the scatter fraction is 67%. The reconstructed images of an ultra-high resolution hot spot phantom illustrates the expected imaging capabilities of the scanner for small structures where 1.0 (2.4) mm objects can be resolved with a high contrast at ≈1 (≈10) cm from the center. Preliminary experimental data and the reconstructed images of 3-D voxelized human brain phantoms show that the UHR scanner will be particularly useful to investigate the radiotracer uptake in important subcortical regions and small deep structures of the brain, enabling the potential differentiation of details in the medial temporal lobe, known to be involved in the onset of Alzheimer’s disease.

Conclusion
A new ultra-high resolution PET scanner featuring small truly pixelated detectors is being developed to reach spatial resolution in the millimeter range for imaging the human brain. Simulation results and preliminary experimental data provide evidence of the promising capabilities of the scanner for high performance brain imaging applications such as β-amyloid deposition, tau protein accumulation and neuroreceptor distribution.
References
PP02-N02
Imaging HDACs in vivo: cross-validation of the [11C]martinostat radiotracer in the pig brain
1Neurobiology Research Unit, Copenhagen University Hospital Rigshospitalet, Copenhagen, Denmark
2Faculty of Health and Medical Sciences, University of Copenhagen, Copenhagen, Denmark
3PET and Cyclotron Unit, Copenhagen University Hospital Rigshospitalet, Copenhagen, Denmark
4MGH/HST A. A. Martinos Center for Biomedical Imaging, Massachusetts General Hospital, Charlestown, Massachusetts, USA
Abstract
Objectives
The interplay between the genome and the environment, termed epigenetics, has been recognized for its role in a large variety of psychiatric disorders. The study of epigenetic alterations was until recently limited to in vitro methodologies1 but with the introduction of the novel PET-radiotracer [11C]Martinostat, histone deacetylase (HDAC) levels can now be measured in vivo2. Here we present the in vivo – in vitro cross-validation and quantification of [11C]Martinostat for visualization of epigenetic proteins in the pig brain, more specifically the HDAC 1–3 proteins.
Methods
Nine female Danish landrace pigs were PET-scanned in a HRRT scanner using [11C]Martinostat. One pig was used for a self-block experiment where 0.5 mg/kg Martinostat was administered simultaneously with the radiolabeled compound. We computed both standardized uptake value (SUV) ratio (SUVR) and BPND as well as distribution volumes (VT) from kinetic models with full arterial input (1TC, 2TC, Logan and Ichise MA1) as measures of the [11C]Martinostat binding. We used a region-specific t* for Logan and Ichise MA1 modelling, and the Akaike information criterion (AIC) was used to assess the most suitable quantification method across regions. The brain tissue was, post mortem, used for direct cross-validation of the in vivo findings, by quantitative Stain-Free™ western blotting with antibodies directed against HDAC1-3.
Results
The [11C]Martinostat radiotracer distributed widely across brain regions, with the highest uptake in cerebellum vermis and the lowest in olfactory bulbs. We found that SUVR can be used as a surrogate for VT, since the radiotracer displayed very slow kinetics, with hardly any washout during the 121 min acquisition time. We found good correlation between the in vivo SUVR measures and the in vitro HDAC1-3 amounts determined by western blot (p = 0.001). Although no region is completely devoid of tracer target in the pig brain, we found that quantification is most reliably performed by Ichise MA1 modelling with full arterial input, as assessed by the AIC. VT ranged from 46 mL/cm3 ± 10 in high binding regions, to 19 mL/cm3 ± 4 in low binding regions (n = 13). However, we did not find any correlation between the Ichise MA1 determined VTs and the western blot determined HDAC amounts (p = 0.16). We determined 0.5 mg/kg Martinostat to occupy 89% of targets, and the VND was 2.87 mL/cm3.

Conclusions
The wide distribution of HDAC1-3 proteins is in line with the highly conserved nature of epigenetic modifying proteins, however, this poses a challenge for quantification of the tracer, since no region is depleted of [11C]Martinostat target. Therefore, simplified quantification by SUVR is appropriate for non-intervention scans, but if we apply interventions that change tracer kinetics, full arterial input is necessary, and modelling can be performed by Ichise MA1. Based upon the present cross-validation, in vivo imaging with [11C]Martinostat reflects the cumulative levels of HDAC1-3 measured in vitro.
References
PP02-N03
Human biodistribution and radiation dosimetry of the 5-HT2A receptor agonist Cimbi-36 labeled with carbon-11 in two positions
1Neurobiology Research Unit, Copenhagen University Hospital, Rigshospitalet, Copenhagen, Denmark
2Faculty of Health and Medical Sciences, University of Copenhagen, Copenhagen, Denmark
3PET & Cyclotron Unit, Copenhagen University Hospital, Rigshospitalet, Copenhagen, Denmark
4Department of Drug Design and Pharmacology, Faculty of Health and Medical Sciences, University of Copenhagen, Copenhagen, Denmark
Abstract
Cimbi-36 can be 11C-labeled to form an agonist radioligand used for positron emission tomography (PET) imaging of the 5-HT2A receptor. In its non-labeled form (25B-NBOMe) it is used as a recreational drug, that can lead to severe adverse effects, in some cases with fatal outcome. We investigated human biodistribution and radiation dosimetry of the radioligand with two different radiolabeling positions.
Methods
Seven healthy volunteers underwent dynamic 120 min whole-body PET scans (injection of 581 ± 16 MBq, n = 5 for 11C-Cimbi-36; 593 ± 14 MBq, n = 2 for 11C-Cimbi-36_5). Residence times from time-activity curves (TACs) of selected organs were used as input into the OLINDA/EXM software to obtain dosimetry information for both 11C-labeling position of Cimbi-36.
Results
Effective dose was slightly higher for 11C-Cimbi-36 (5.3 mSv/MBq) than for 11C-Cimbi-36_5 (4.7 mSv/MBq), with the highest absorbed dose found in the spleen (17.1 mGy/MBq for 11C-Cimbi-36). Decay corrected TACs showed higher uptake of 11C-Cimbi-36 in the pancreas, small intestines, liver, kidney, gallbladder, and urinary bladder compared with 11C-Cimbi-36_5, reflecting differences in radiometabolism for the two radioligands. Variability in uptake in excretory organs for 11C-Cimbi-36 points to inter-individual differences with regards to metabolic rate and route. Surprisingly, moderate uptake was found in brown adipose tissue (BAT) in four subjects, possibly representing specific 5-HT2A/2C receptor binding.

Conclusion
The low effective dose of 5.3 mSv/MBq allows for injection of up to 1,890 MBq for individual participants per study (equivalent to 3 scans if injecting 600 MBq) and still stay below the international guidelines of 10 mSv, making 11C-Cimbi-36 eligible for studies involving a series of PET scans in a single subject. The biodistribution of Cimbi-36 (and its metabolites) may also help to shed light on the toxic effects of 25B-NBOMe when used in pharmacological doses in recreational settings.
PP02-N04
Transient modulation of cerebral blood flow does not alter [11C]PBR28 radiotracer binding
1Athinoula A. Martinos Center for Biomedical Imaging, Department of Radiology, Massachusetts General Hospital, Charlestown, MA, USA
2Harvard Medical School, Boston, MA, USA
3University of Padua, Padua, Italy
Abstract
Objectives
Brain PET imaging studies have used the radiotracer [11C]PBR28 to image the translocator protein (TSPO) as a putative target for neuroinflammation1,2. This has been of interest across patient populations with potentially varying physiology, e.g. perfusion. While several analysis approaches have been proposed to quantify [11C]PBR28 signal and TSPO binding3, the comparison of standardized uptake values (SUV) or ratios are a popular metric to measure TSPO binding. In this context, an open question has been whether changes in cerebral blood flow (CBF) can affect [11C]PBR28 binding. The goal of this study was to experimentally test whether large transient changes in CBF affect [11C]PBR28 measurements by increasing flow through a hypercapnia challenge in non-human primates (NHP).
Methods
Two female baboons were imaged for 90 min on a PET/MRI scanner after a bolus injection of [11C]PBR28, with three repeated sessions in each animal. The baboons were anesthetized (1.5% isoflurane) and ventilated during hypercapnia sessions. Each animal was imaged with a baseline [11C]PBR28 scan and a scan where hypercapnia (7% CO2) was induced during intervals of 0–12 min, 30–45 min, 65–80 min after TOI. CBF was measured simultaneously during [11C]PBR28 acquisition with pseudo-continuous arterial spin labelling (pCASL). Images were registered to standardized NHP space and ROIs were extracted. %CBF changes were calculated relative to the first 5 min of acquisition and absolute CBF values were computed with known methods4.
Results
Among the three hypercapnia experiments, no visible changes in the time-activity curves (TACs) between baseline and hypercapnia sessions were observed, even though increases in %CBF up to 100% were recorded. Absolute whole-brain CBF values were on average 92 ± 14 mL/100g/min during baseline and 121 ± 15 mL/100g/min during hypercapnia intervals. Baseline and hypercapnia [11C]PBR28 TACs were overall similar without observable changes that matched any CBF change pattern. Mean SUV values for 65–80 min were on average 1.25 ± 0.28 (thalamus), 0.98 ± 0.32 (prefrontal), 1.07 ± 0.24 (whole brain) during baseline and 1.07 ± 0.15 (thalamus), 0.88 ± 0.14 (prefrontal), 0.97 ± 0.11 (whole brain) during hypercapnia sessions. Corresponding mean tissue ratios were 1.16 ± 0.0 (thalamus/whole brain), 0.9 ± 0.1 (prefrontal/whole brain) during baseline and 1.10 ± 0.04 (thalamus/whole brain), 0.9 ± 0.07 (prefrontal/whole brain) during hypercapnia. Figure 1A-B shows representative [11C]PBR28 time-activity curves (TACs) from one baboon for a baseline (blue) and a hypercapnia session (red) for the thalamus and the whole brain. The corresponding %CBF changes are shown C-D, with the hypercapnia intervals are clearly visible through elevated %CBF. Despite large changes in %CBF, the raw TACs are very similar. For these two scans, [11C]PBR28 tissue ratios from 65–80 min for thalamus/whole brain are 1.16 at baseline and 1.10 during the hypercapnia scan. Absolute CBF values during this interval were 73 mL/100g/min (thalamus), 104 mL/100g/min (whole brain) at baseline and 100 ± 4 mL/100g/min (thalamus), 115 ± 10 mL/100g/min (prefrontal).

Conclusions
The results from this study suggest that CBF changes do not affect [11C]PBR28 signal. This supports that findings of [11C]PBR28 signal elevations1–2 are not driven by blood flow effects, thereby reflecting genuine changes in TSPO binding.
References
PP02-N05
Imaging microglia activation in humans, with TSPO PET, after Interferon-alpha administration
1Department of Psychological Medicine, IoPPN, King’s College London, London, UK
2Department of Neuroimaging, IoPPN, King’s College London, London, UK
Abstract
Objectives
The recent evidence on the involvement of the immune system in the pathogenesis of depression offers a unique opportunity to identify new therapeutic targets. There is strong evidence demonstrating increased levels of peripheral inflammatory biomarkers in patients with depression[1]: what remains unclear is whether this peripheral inflammation is also associated with inflammation in the brain. The main objective of this project was to use the Positron Emission Tomography (PET) tracer for activated microglia, [11C]PBR28, in conjunction with an assessment of peripheral inflammatory biomarkers, to examine if microglia are activated in healthy controls by a peripheral immune challenge, Interferon-alpha (IFN-a), which has consistently been associated with development of depressive symptoms in humans.2 We also aimed to investigate the association between changes in levels of peripheral cytokines and changes in microglia activation before and after IFN-a administration to test whether increased microglia activation will be associated with onset of depressive-like symptoms.
Methods
5 healthy males have been recruited so far (mean age: 32 ± 6.8) in this longitudinal study. Participants were screened for thers6971 polymorphism in the TSPO gene and only high-affinity binders were recruited. Each participant had 2PET scans, before and ∼24 hours after theIFN-a2a, 3 million units, challenge. The radioligand volume of distribution (VT) was then calculated with 2-tissue compartmental model with and without endothelial correction (2TCM1K and 2TCM respectively).3 Blood samples, to measure inflammatory biomarkers (IFN-gamma, IL-1beta, IL2, IL-4, IL6, IL-8, IL-10, IL12p70, IL-13, TNF-alpha, high sensitivity C-reactive protein-hsCRP-acute inflammatory response biomarker) and mood state questionnaires were also collected at different timepoints during the study.
Results
Changes of [11C]PBR28 brain PET signal were variable across subjects (Figure 1, B&C). From baseline to 24 hours after the challenge, both the standard 2TCM and 2TCM1K showed an average decrease in VT (DVT = −19% and −25%, respectively), even after correction for the free plasma fraction (DVT/fp = −18% and −13%, respectively). A paired t-test resulted significant for 2TCM only (t = −3.4, p = 0.028), without fp correction.
On the contrary, peripheral inflammation biomarkers showed a consistent pattern between subjects, with a steady hsCRP trend from baseline to 6 hours after IFN-a administration (average 0.7 ± 0.1 mg/L) and increasing by more than 15 folds at 24 hours, on average (mean ± SD: 9.4 ± 5.3 mg/L) (Figure 1, A). However, no correlation was found between changes in hsCRP (DhsCRP) and DVT.

Conclusions
Preliminary data from this study show that while peripheral inflammation (as measured by hsCRP) is activated by the immune challenge IFN-a, neuroinflammatory response (as measured by TSPO PET) is quite heterogeneous. Moreover, changes of TSPO brain PET are quite sensitive to plasma tracer biding. More studies are needed to clarify the link between peripheral and central inflammation and the utility of TSPO targeting radioligands to investigate neuroinflammation.
References
PP02-N06
Biodistribution, dosimetry and brain kinetics of [11C]-JNJ-63779586, a bace inhibitor and sensitive P-gp and BCRP substrate
1Nuclear Medicine and Molecular Imaging, KU Leuven, Belgium
2Janssen Research and Development, Beerse, Belgium
3Department of Pharmaceutical and Pharmacological Sciences, KU Leuven, Belgium
Abstract
Objectives
JNJ-63779586 is a β-site amyloid precursor protein cleaving enzyme (β-secretase, BACE) inhibitor and a substrate of P-glycoprotein (P-gp) and breast cancer resistance protein (BCRP) that shows lysosome storage. [11C]-JNJ-63779586 has been developed as a PET-ligand to study blood-brain barrier (BBB) efflux transporter activity. The access to the brain for potential small-molecule therapeutics of Alzheimer’s disease may depend on interindividual differences in functional expression of these efflux-transporters.
Methods
A biodistribution and dosimetry PET study with [11C]-JNJ-63779586 was performed in 3 healthy male subjects (age 40 ± 13 yrs). In each subject, 9 serial whole-body PET scans were acquired on a Siemens Biograph PET-CT camera (up to 2 hours post injection). Volumes of interest (VOI) were drawn to estimate the percentage of injected activity in each organ with significant and visually assessable tracer uptake. As such, the normalized cumulative activity (NCA) of these source organs was used to determine the organ absorbed doses and effective dose (ED) (OLINDA v1.2). In the second part of the study, 4 healthy volunteers (3 M/1F; age 72 ± 9 yrs) underwent a 90-min dynamic [11C]-JNJ-63779586 PET scan with full arterial blood sampling on a GE Signa integrated PET-MR system. Regional time-activity curves (TAC) were extracted by MR-based spatial normalization and atlas-based VOI delineation (PMOD v4.0). One- and two-tissue compartmental models (1-2TCM) were used to evaluate tracer kinetics. The Akaike information criterion (AIC) was used to select the most appropriate model. Based on the assumption of irreversible tracer kinetics, a Patlak graphical analysis was also considered to determine the net influx constant (Ki) in the brain.
Results
The mean ED for [11C]-JNJ-63779586 was 4.67 ± 0.10 µSv/MBq, with the highest organ absorbed doses for the small intestine (19 µGy/MBq), liver (17 µGy/MBq) and kidneys (12 µGy/MBq). In terms of tracer kinetics, brain uptake was low and showed irreversible behavior for all brain regions. The AIC of an irreversible 1TCM with blood volume fraction as additional parameter was consistently lower for all brain regions than a reversible 1TCM and irreversible 2TCM approach, identifying the latter model as the most appropriate. Corresponding cortical K1 values were 0.0023 ± 0.0005 ml/cm3/min, while a Patlak plot provided robust Ki values for all brain regions, with cortical Ki = 0.0039 ± 0.0010 ml/cm3/min.
Conclusions
The ED of [11C]-JNJ-63779586 is in the typical range for 11C-radiolabelled ligands.1 An irreversible 1TCM was identified as the most suitable model to describe [11C]-JNJ-63779586 tracer kinetics. Based on a Patlak graphical analysis, Ki values were obtained which were consistently higher than 1TCM K1 values. The latter shows that brain uptake is not only mediated by K1 and warrants further investigation possibly linked to tracer metabolites entering the brain.
Reference
PP02-N07
Detection of multiple embolic infarctions caused by endocarditis using 18F-FDG PET/CT
1Dept. of Neurology, Chonnam National University Hospital, Korea
2Dept. of Nuclear Medicine, Chonnam National University Hospital, Korea
Abstract
Background & Significance
Various complications including endocarditis and embolic infarctions in multiple organs can occur in a patient with a prosthetic valve. However, it is difficult to identify the various complications that may occur at the same time. Here, we report a patient with prosthetic valve endocarditis and neurologic complication revealed on 18F-FDG PET/CT as a one-stop shop.
Case
A 59-year-old male with a modified Bentall operation for aortic valve and mitral ring annuloplasty with modified MAZE operation 7 years previously presented with high fever and 4 consecutive blood cultures positive for Staphylococcus aureus. Despite a high clinical suspicion for endocarditis, echocardiography was unremarkable. Modified Duke criteria were not fulfilled. He showed decreased awareness suddenly, and initial brain CT and MRI demonstrated multifocal acute infarctions in both cerebral and both cerebellar hemispheres, acute SAH along both high frontal sulci, and small ICH in the left occipital lobe. Two weeks from initial MRI study, PET/CT revealed that high uptake was demonstrated around the prosthetic aortic valve and aortic root. Moreover, PET/CT showed high metabolic activity around the cerebral infarctions and low metabolic activity in the splenic infarction. Brain PET/CT showed reduced FDG uptake in the ischemic core, whereas increased FDG uptake in the peri-ischemic regions in the left frontal and occipital lobes.
Conclusion
This case showed that enhanced glucose metabolism on PET/CT could detect neuroinflammation at peri-infarct regions in the subacute stage of embolic stroke as well as complicated infection in prosthetic valve endocarditis missed on echocardiography.