
Abstract
Small vessel disease is characterized by sporadic obstruction of small vessels leading to neuronal cell death. These microinfarcts often escape detection by conventional magnetic resonance imaging and are identified only upon postmortem examination. Our work explores a brain-wide microinfarct model in awake head-fixed mice, where occlusions of small penetrating arterioles are reproduced by endovascular injection of fluorescent microspheres. Mesoscopic functional connectivity was mapped longitudinally in awake GCaMP6 mice using genetically encoded calcium indicators for transcranial wide-field calcium imaging. Microsphere occlusions were quantified and changes in cerebral blood flow were measured with laser speckle imaging. The neurodeficit score in microinfarct mice was significantly higher than in sham, indicating impairment in motor function. The novel object recognition test showed a reduction in the discrimination index in microinfarct mice compared to sham. Graph-theoretic analysis of functional connectivity did not reveal significant differences in functional connectivity between sham and microinfarct mice. While behavioral tasks revealed impairments following microinfarct induction, the absence of measurable functional alterations in cortical activity has a less straightforward interpretation. The behavioral alterations produced by this model are consistent with alterations observed in human patients suffering from microinfarcts and support the validity of microsphere injection as a microinfarct model.
Introduction
Obstruction of small penetrating vessels leads to cell death and contributes to vascular dementia.1,2 Small vessel diseases (SVDs) comprise the majority of cases of vascular dementia, itself the second most common form of dementia 3 following Alzheimer disease. Diffuse arteriopathy of small penetrating arteries results in damage in the cerebral white matter and deep grey matter. 4 Because of their limited size (100 µm to few mm), these microinfarcts usually escape detection by conventional magnetic resonance imaging (MRI) and are only identified upon postmortem examination. 2 The symptomatology of vascular dementia, including SVDs, variably includes impairments in executive functions such as attention, working and episodic memory, affective disturbances, and gait abnormalities.5,6 A large number of brain autopsy studies showed that vascular brain damage caused by microinfarcts also contributes to impaired cognition in patients with Alzheimer’s disease (AD) without apparent macroscopic vascular pathology.7,8 Furthermore, alterations in brain network connectivity have been associated with cognitive decline in patients with SVDs.9,10
In order to examine whether subcortical microinfarcts characteristic of SVDs can affect cortical function, reliable animal models that allow for high-resolution functional imaging without anesthetic-induced alterations are needed. Our work employs awake imaging of headfixed mice to examine a recently published microinfarct model where occlusions of small penetrating arterioles are reproduced in mice by unilateral endovascular injection of small fluorescent microspheres (∼20 µm diameter) through the internal carotid artery. 11 This model allows the identification of occluded vessels by localizing the fluorescent microspheres in histological sections. Occlusions in this model have been shown to cause gross motor impairment, as well as cell loss and axonal disruption throughout the brain. 11 While the cortex itself is relatively spared from structural damage in both SVDs and the present model –less than 1% of occlusions resulted in microinfarcts 11 – damage to subcortical nuclei or white matter tracts may disrupt cortical function. Hence, we longitudinally mapped mesoscopic cortical function in awake head-fixed mice using a transcranial wide-field imaging of genetically encoded calcium sensors (GCaMP6) through a bilateral chronic window12,13 to determine whether these histologically silent occlusions alter gross network properties.
Spontaneous cortical activity, cerebral blood flow and behavioral assessments were recorded periodically over four weeks before and four weeks after red fluorescent microspheres injection, and occlusions were quantified in histological sections (Figure 1(a)). Seed pixel correlation and standard deviation maps of neuronal activity within somatosensory, visual and motor cortices as well as network parameters of functional integration (local and global efficiency) and segregation (clustering coefficient, modularity)
14
were analyzed. Changes in cerebral blood flow were assessed with laser speckle imaging, and behavioral tests were performed to detect functional impairments in the motor cortex, striatum and hippocampus. Our approach combines a convenient method to generate a mouse model of microinfarcts with a reliable preparation for longitudinal imaging of cortical activity as a potential future model to assess therapeutic interventions and their linkage with measures of connectivity.
Experimental procedure and microsphere quantification. (a) Timeline of experimental procedure. (b) GCaMP6 mice received a transcranial window implant and recovered for seven days; 2000 fluorescent microspheres measuring around 20 µm are injected through the common carotid artery into the brain where they occlude blood vessels. (c–d) Representative images of green (Ca2+ imaging) and red (for beads cortical visualization) fluorescence. (e) Representation of lodged microspheres through the brain surface. Scale bar 1 mm. (f) Excitation (dotted lines) and emission spectra (continuous lines) of GCaMP (cyan) and the microspheres (red). Blue-filled region represents the excitation light used and green-filled region is the emission light collected by the camera. This spectrum was made using Thermofisher Fluorescence SpectraViewer https://www.thermofisher.com/ca/en/home/life-science/cell-analysis/labeling-chemistry/fluorescence-spectraviewer.html. (g) Microsphere distribution across various brain regions.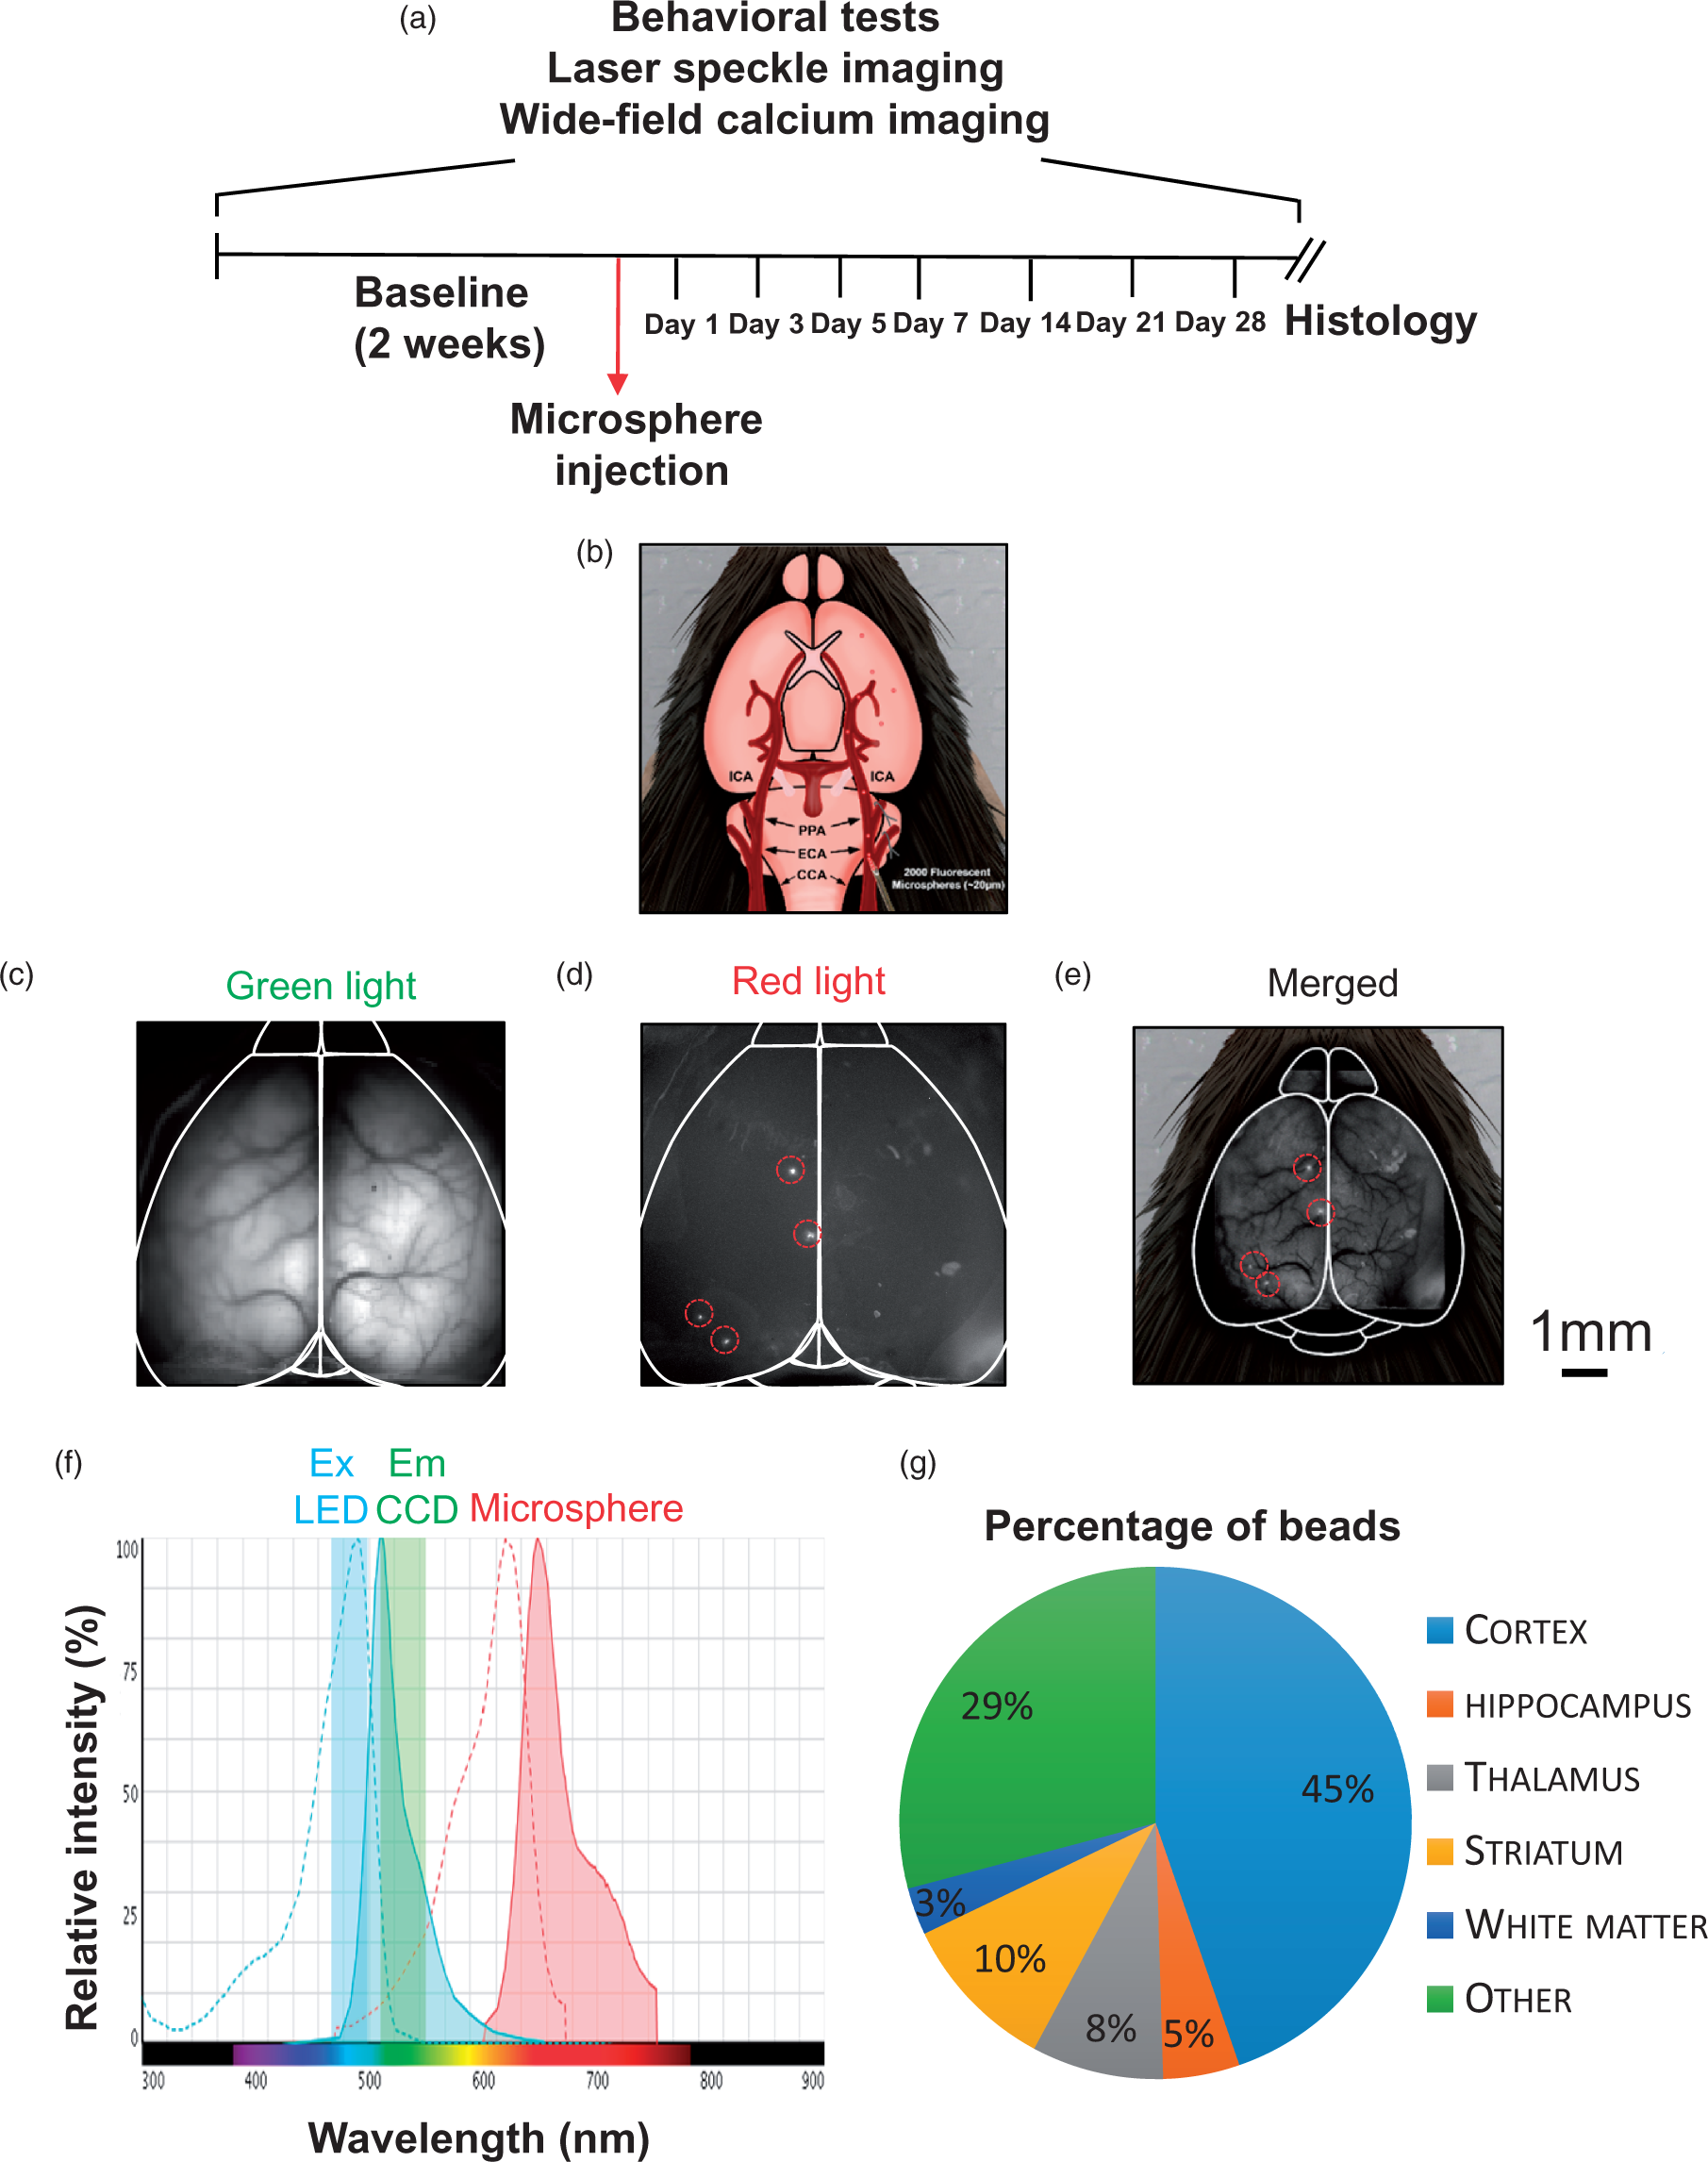
Materials and methods
All procedures were approved by the University of British Columbia and conformed to the Canadian Council on Animal Care and Use guidelines and reported according to the ARRIVE (Animal Research: Reporting in vivo Experiments) guidelines. 15 All mice were randomly assigned to the procedures. A researcher blind to the treatment applied performed the surgical preparation, behavioral tests and data analysis.
Transgenic GCaMP6 mice of either sex (n = 16; 11 female and 5 male) four to five months of age at the time of microsphere injection were produced by crossing Emx1-cre (B6.129S2- Emx1tm1(cre)Krj/J, Jax no. 005628), CaMK2-tTA (B6.Cg-Tg (Camk2a-tTA) 1Mmay/DboJ,Jax no 007004) and either TITL-GCaMP6s (Ai94; B6.Cg-Igs7 tm94.1(tetO-GCaMP6s) Hze/J, Jax no 024104) or TITL-GCaMP6f (Ai93; B6.Cg Igs7 tm93.1(tetO-GCaMP6f)Hze/J, Jax no 024103) strains. 16 This crossing is expected to produce a stable expression of GCaMP6 within all excitatory neurons across all layers of the cortex. For the imaging procedure, two cohorts of mice of comparable age and genotype were pooled together.
Chronic transcranial window implant
The window preparation was performed as previously described. 13 Briefly, mice received isoflurane anesthesia (4% induction, 1.5% maintenance in air) and were mounted in a stereotactic frame. Eyes were covered with eye lubricant (Lacrilube; www.well.ca) in order to maintain corneal moisture and body temperature was kept at 37℃ using a feedback-regulated heating pad monitored by a rectal probe. Mice received an injection of Lidocaine (0.1 ml, 0.2%) beneath the scalp and a subcutaneous injection of saline solution containing a mix of buprenorphine (2 mg/ml), atropine (3 µm/ml), and glucose (20 mM). The skin between the ears and eyes was gently shaved and properly cleaned with Betadine dissolved in water and ethanol.
The surgical procedure started with the removal of the skin covering the occipital, parietal and frontal bones. The fascia and any connective tissue on the skull surface were carefully wiped off. A head-fixing screw was glued to the cerebellar plate using C&B-Metabond transparent dental cement (Parkell, Edgewood NY, USA; Product: C&B Metabond). Dental adhesive was applied on the skull. A coverglass (Marien-feld, Lauda-Konigshofen, Germany) previously cut to fit the size of the cranial window (11 mm by 9 mm) was placed on top of the dental cement before it solidified, avoiding the formation of bubbles. The cement remains transparent after it solidifies and the surface vasculature is readily observed through the final result.
Recovery and post-operative monitoring
At the end of the surgical procedure, mice received a subcutaneous injection of saline (0.5 ml) with 20 mM of glucose and were allowed to recover in their home cages with an overhead heat lamp. Activity level was monitored hourly for the first 4 h and every 4–8 h thereafter. Mice were allowed to recover for seven days after window implantation before performing baseline measurements periodically over the next four weeks
Microsphere injection
The surgical procedure for microsphere injection was performed as previously described. 11 Red fluorescent microspheres (FluoroSpheres polystyrene, Life technologies) of ∼20 µm in diameter (2000 in 100 µl PBS) were unilaterally injected into the common carotid artery and subsequently lodged into brain vessels to induce microocclusion formation Figure 1(b). The size of the microspheres was chosen to approximate the size of rodent penetrating arterioles that range from 10 to 20 µm. 17 The use of red crimson microsphere in the study was motivated to avoid any contamination of the GCaMP fluorescence as shown in Figure 1(c) to (f).
Twenty-four hours following microsphere injections, awake mice were head-fixed using an apparatus previously described for imaging awake mice 11 and measurements were performed over 4 weeks after injection on days 1, 3, 5, 7, 14, 21, 28.
Neurodeficit score evaluation
Motor impairment was assessed using the neurodeficit score, a standardized qualitative assessment for measuring the degree of motor impairment. 18 Briefly, the mouse was placed on a flat surface and gently lifted by the base of the tail until the forepaws were no longer touching the surface. Forelimb and hindlimb flexion were evaluated assigning a score (range 0 to 2) to mice based on their adduction and flexion capability. Subsequently, the mouse was lifted by its tail and held 15 cm above the flat surface to evaluate C-shaped bending of the body towards one side, bringing their snout close to their hindlimb (score range 0 to 2). Forepaw grasping was evaluated lifting the mouse by its tail and having it to grasp a horizontal metal wire of a diameter of 2 mm with the forelimbs (score range 0 to 3). Before concluding the test procedure, the mouse was placed on a surface and the hindlimbs were gently displaced 1–2 cm laterally. The mouse was scored on the amount of time needed to reposition its hindlimb (score range 0 to 3). After the testing, the mouse was placed back in his home cage until the next evaluation.
Measurement of clasping reflex
To analyze limb dystonia, the clasping test was performed as previously reported.19,20 The clasping behavior was induced by tail-suspension (10 cm above the cage for 30 s) and evaluated giving a score of 0 for no clasp, 1 when the fore or hindlimb presses on the stomach (mild clasp), 2 when both fore and hindlimbs touch and press on the stomach (severe clasp) Figure 2(a).
Behavioral tests. (a) Representative pictures of mice during clasping reflex. A score of 0 was assigned to mice with no clasping reflex, 1 when the fore or hindlimb presses on the stomach, 2 when both fore- and hindlimbs touch and press on the stomach. (b) Scheme of novel object recognition test: habituation with an empty arena, familiarization with two novel objects, and testing with a new object replacing one of the familiar objects. (c) Neurological deficit score. Microinfarct mice scored significantly higher than sham (p < 0.001). (d) Clasping reflex revealed a tendency to higher clasping behavior in microinfarct mice compared to sham (p = 0.0754). Microinfarct mice showed significantly lower novel object exploration time ratio (e, p = 0.0321) and discrimination index (f, p = 0.0207). Box represents median ±75/25 percentile, while whiskers show minimum and maximum data points.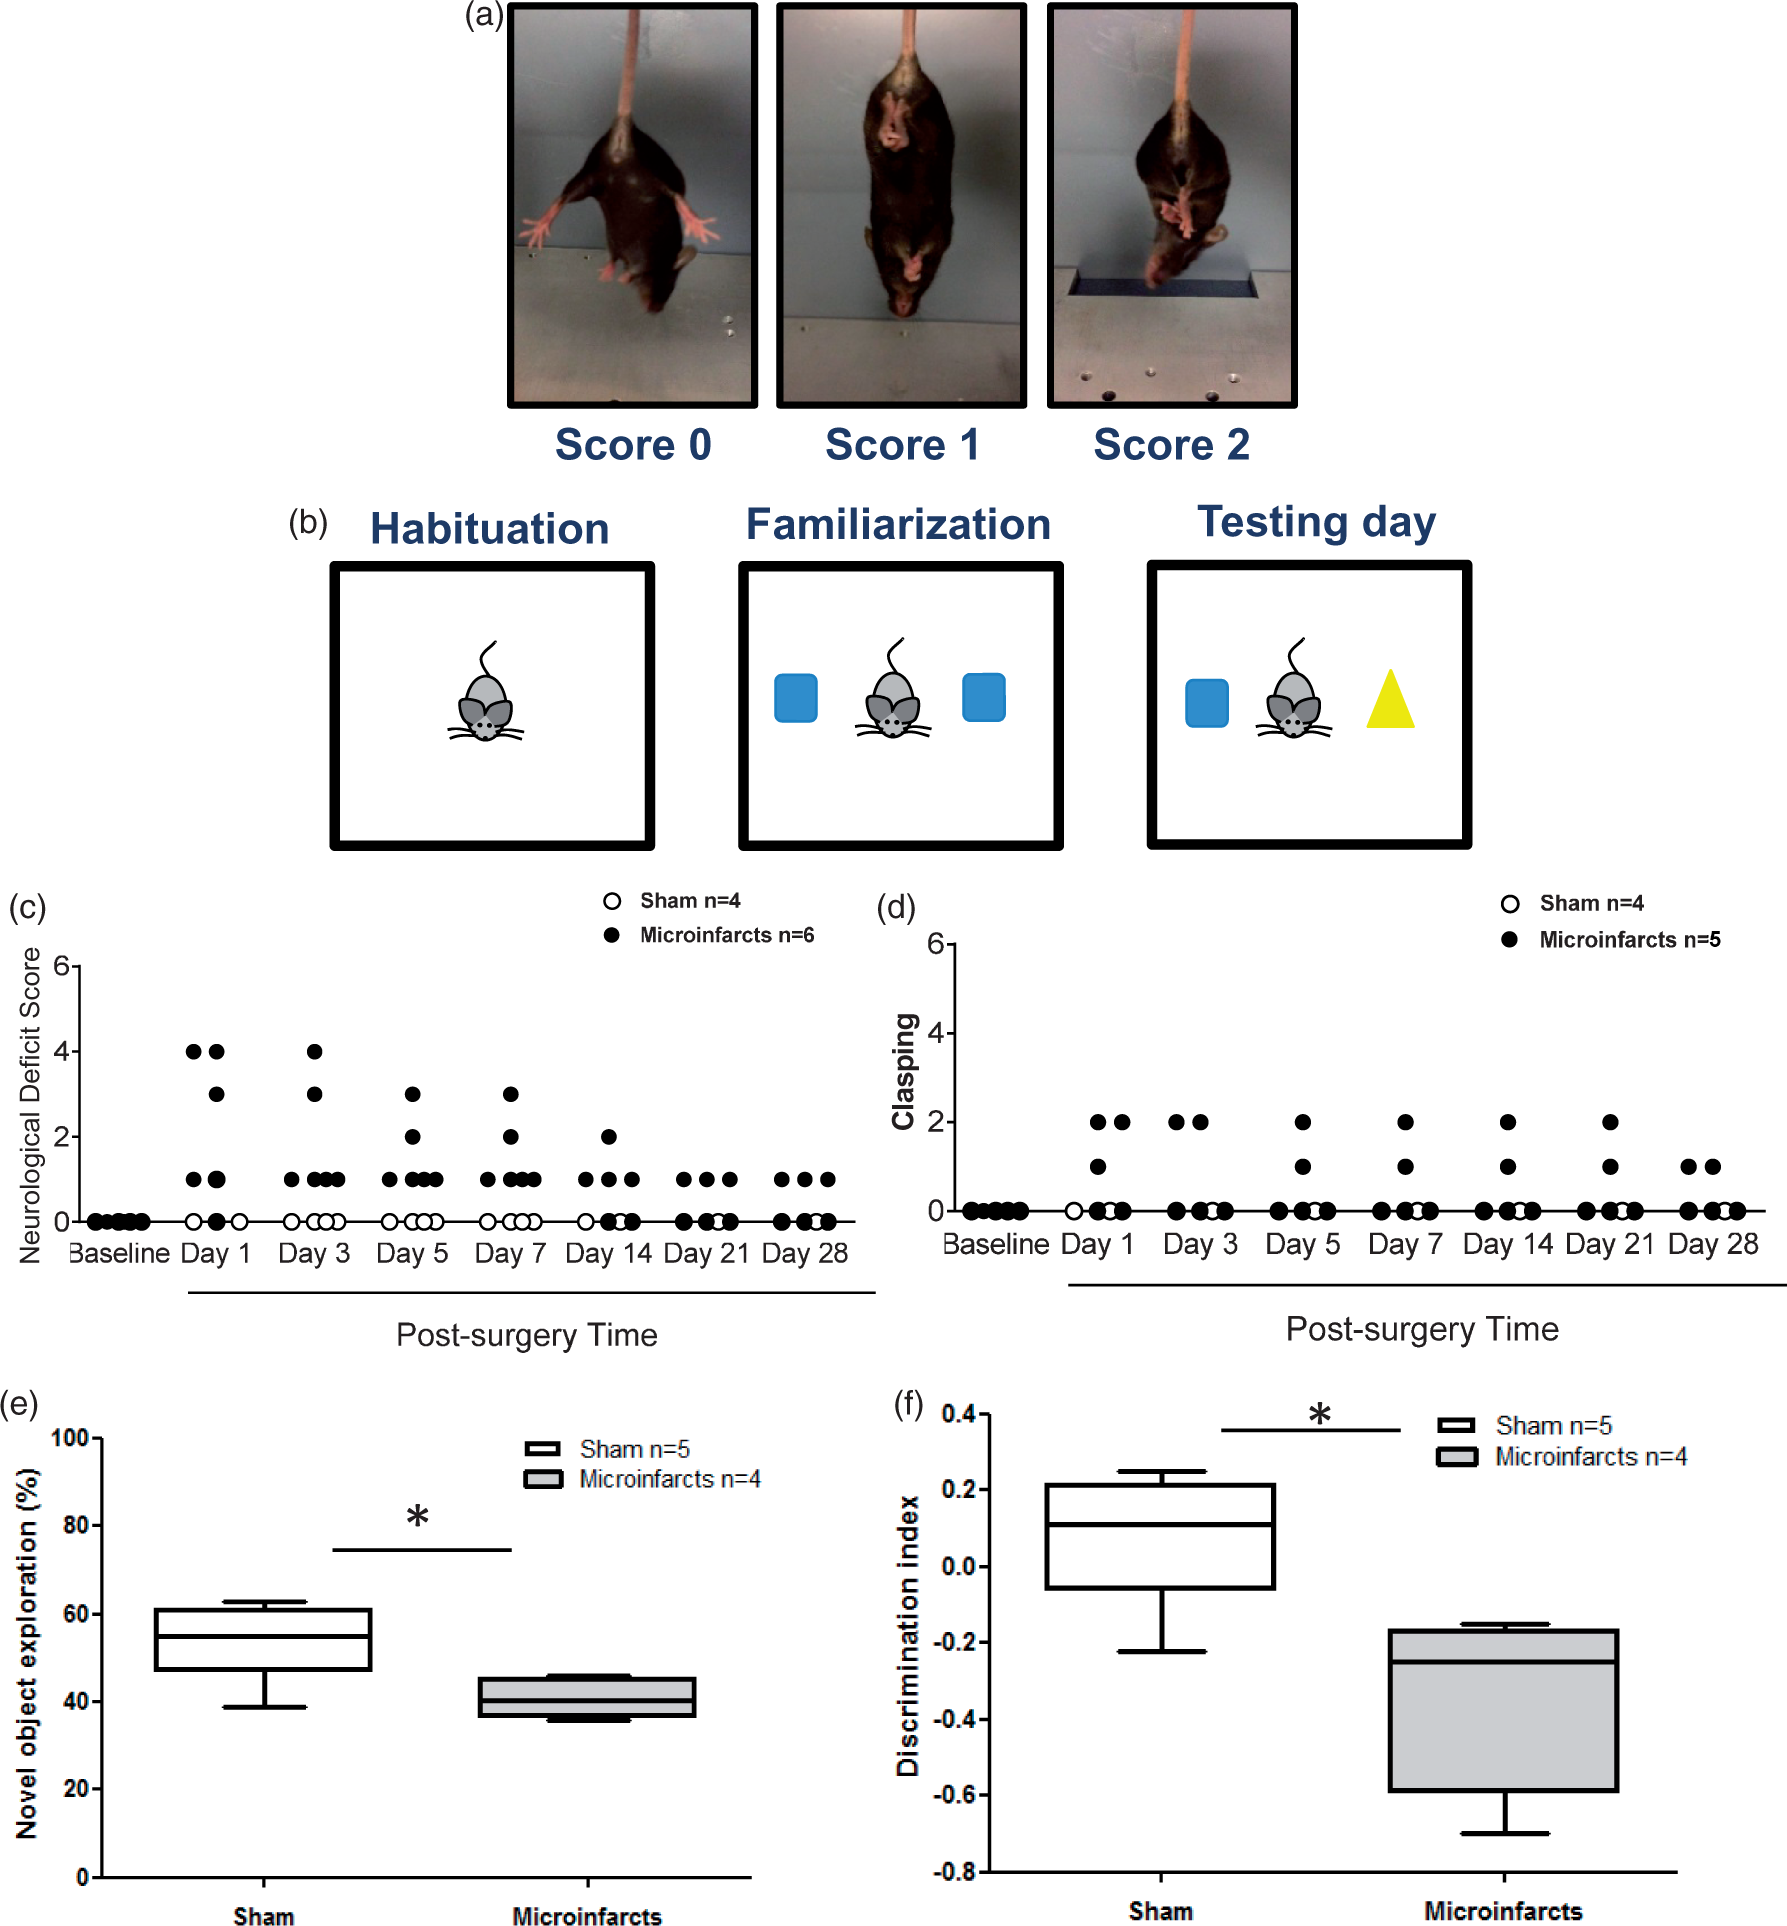
Novel object recognition test
The novel object recognition (NOR) test is a commonly used test for mice that provides an index of recognition memory. 21 On day 1, each mouse was allowed to explore an empty arena consisted of a rectangular area (70 cm wide × 80 cm long × 50 high, methacrylate) for one 15-min session. After this habituation phase, the mouse was placed back in its cage for 5 min. During the familiarization phase, the mouse was exposed for 15 min to the familiar arena with two identical objects (4 cm wide × 5 cm long × 4 high, polyester) placed at an equal distance (around 15 cm from the wall). The height of the selected objects allowed mice to climb over the objects providing for a sufficient level of exploration. Double-sided adhesive tape was used to hold the objects to the floor. To control for odor cues, the arena and the objects were carefully cleaned with 70% ethanol, dried and ventilated for at least 2 min between the mice. Investigative behavior (head orientation of sniffing occurring at a distance ≤ 2 cm) or deliberate contact that cumulatively lasted a minimum of 20 s was considered as exploration of an object.
The following day, the mouse was allowed to explore the arena in the presence of one of the familiar object and a novel object (6 cm wide × 7 cm long × 4 high, polyester, different shape) Figure 2(b). The time spent exploring the new object provides an index of recognition memory.
Laser speckle contrast imaging
Laser speckle contrast imaging was used to assess whether the microoclusions lead to changes in blood flow
22
Figure 3(a). This technology is based on blurring of interference patterns of scattered laser light by the flow of blood cells.
22
The surface of the cortex was illuminated with a 784 nm 32 mW StockerYale SNF-XXX_785S-35 laser (Stocker & Yale, Salem, NH) at a 30° angle with a beam expander, and light intensity was controlled by a polarizer. Images were captured by a CCD camera (Dalsa 1M60) using EPIX XCAP software (v3.7). Three hundred frames were acquired at 10 Hz with a 10-ms exposure time (total time of acquisition 30 s) over a field of view of 8.6 × 8.6 mm.
Changes in cerebral blood flow. (a) Representative laser speckle imaging pictures of sham and microinfarct mice at baseline and for the first seven days following microsphere injection. Scale bar: 1 mm. (b) Mean changes (% baseline) in blood flow per mouse after sham and microinfarct surgery showed no differences between experimental groups. Box represents median ±75/25 percentile, while whiskers show minimum and maximum data points.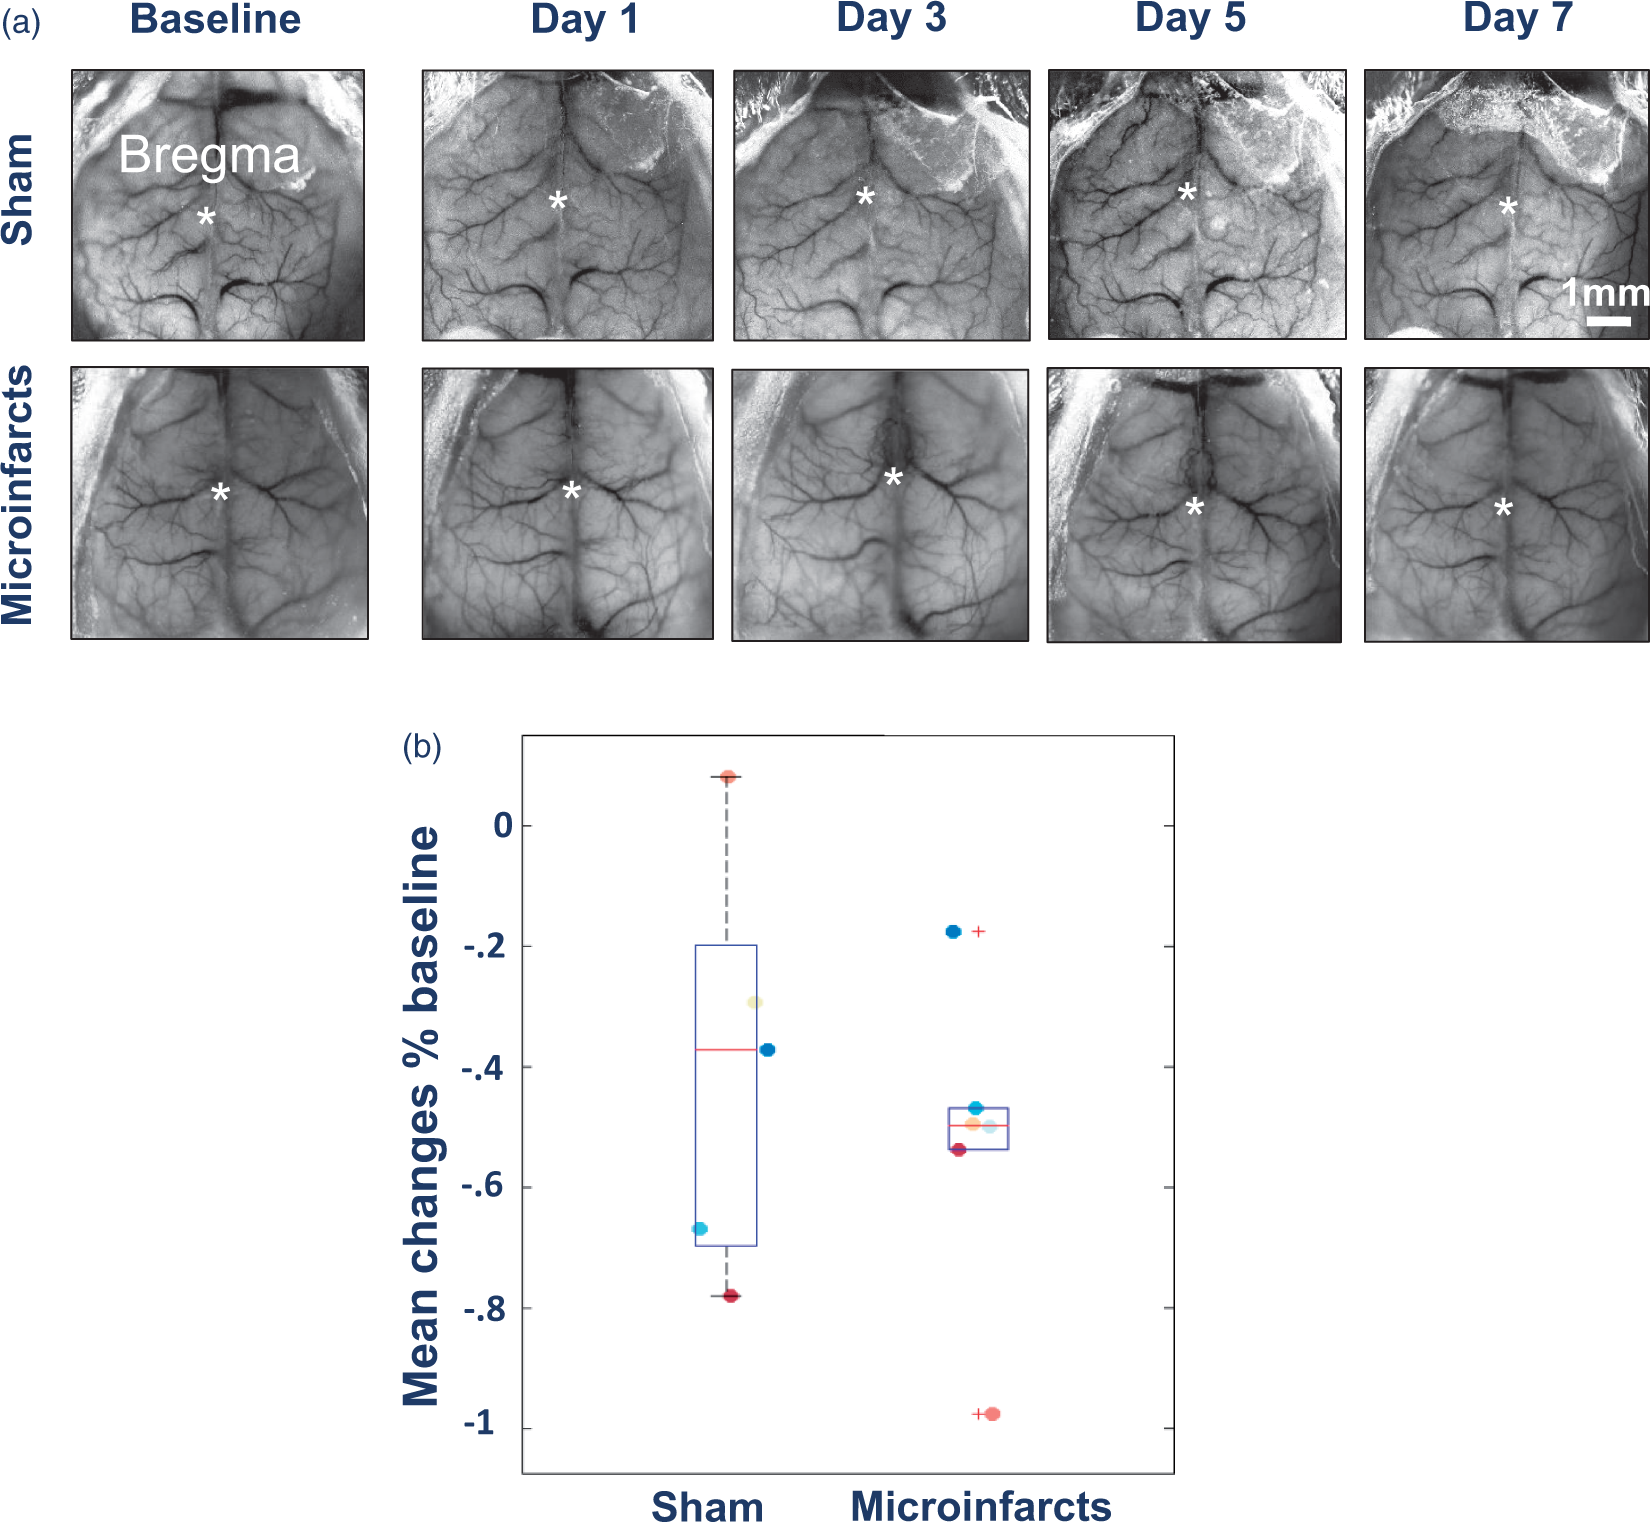
The speckle contrast for each pixel is defined as the ratio of the standard deviation to the mean intensity (speckle contrast, K = σs/I) over time, as established in Dunn et al.,922 and was calculated using a custom script written with MATLAB (Mathworks, Inc. Natick, MA).
Calcium imaging
To investigate the functional cortical dynamics following microsphere injection, fluorescent signals from awake GCaMP6 mice were recorded during 5 min in multiple epochs preceding and following the injections at a frame rate of 30 Hz. Images were obtained using a pair of back-to-back photographic lenses (Nikon NIKKOR f = 50 mm and f = 35 mm) coupled with a 1M60 Pantera CCD camera (Dalsa). To visualize the cortex and vasculature, the surface of the brain was illuminated with green light. GCaMP6 was excited with blue-light-emitting diodes (Luxeon, 470 mm) with an excitation bandpass filter (467–499 nm). Emission fluorescence was filtered using a 510–550 nm bandpass filter. Recordings of 12-bit images were collected at 30 Hz using XCAP imaging software.
Sensory activity was evoked by whisker stimulation using piezoelectric bending actuators in contact with multiple whiskers and vibrating at 100 Hz. Forty events were recorded daily for each mouse and averaged. A total of 11 mice were imaged: 6 with microinfarcts and 5 sham.
Image processing of calcium signals
Calcium imaging data were imported and analyzed with MATLAB (Mathworks, Inc. Natick, MA). For each mouse, each individual sequence was registered by evaluating the spatial shift (X, Y) and rotation relative to the first recording using autocorrelation.23,24 Frames were filtered using a zero-phase lag Chebyshev bandpass filter at 0.009–0.8, 0.08–0.4 and 0.4–4 Hz. 25 Fractional changes in fluorescence were calculated for each pixel by measuring the relative change between each frame and the average fluorescence during the first second of recording (ΔF/F0). To create seed pixel correlation maps, we calculated the Pearson’s correlation coefficient r between the temporal profile of the seed pixel and the profile of all other pixels. These r-values were Fisher z-transformed and averaged over each ROI: barrel cortex (BC), forelimb (FL) and hindlimb (HL) region of the somatosensory cortex, retrosplenial cortex (RS), primary visual cortex (V1), anterior region of the visual cortex (A, considered as part of the parietal association cortex) and motor cortex (M). By selecting the maximum z(r) Fisher values in each of this 400 × 400 µm regions and for each of the seed-pixel correlation map, it was possible to generate correlation matrices. To calculate the calcium response evoked by whisker stimulation, images collected from 40 trials were averaged and the normalized difference to the 1 s average baseline recorded before stimulation for every pixel (ΔF/F). Then, the maximum response after stimulation was selected and compared between groups.
Photothrombotic stroke
In order to compare alterations in connectivity induced by microinfarcts to alterations induced by a larger stroke, mice were head-fixed and a photosensitive dye solution, Rose Bengal (R3877-5G, SIGMA-ALDRICH, USA), was injected intraperitoneally (0.01 mL/g body weight) as previously described. 26 Two minutes after injection, a 40 mW diode pump solid state 532 nm laser MGM-20 (Beta Electronics, Columbus, OH, USA) was positioned over the left sensorimotor cortex for 13 min to produce a unilateral photothrombotic stroke in awake head-fixed mice. 26
Network parameters
Cortical parcellation based on the spectral and spatial decomposition of the calcium signal resulted in 12 functional modules.27,28
Correlations between these modules were used to calculate network parameters of functional connectivity using the Brain Connectivity toolbox in MATLAB. Local efficiency and clustering coefficients were calculated by averaging the individual local efficiencies of each node. Global efficiency and modularity were calculated directly using the respective functions from the toolbox. These parameters were calculated for each day of baseline and post-operative recordings. To estimate the effect of treatment – sham vs. microinfarct surgery – we averaged each parameter over the days before and after surgery and computed the change for each mouse.
Histology
Mice were allowed to survive for 28 days. On day 28, mice were perfused with phosphate-buffered saline (PBS) and 4% paraformaldehyde (PFA), and the brains were collected. Brains were sectioned at 150 µm on a Leica vibratome in the coronal plane. Histological sections were mounted on slides and coverslipped with mounting medium. Images were obtained using an epifluorescent microscope in order to quantify microocclusions.
Statistical analysis
To assess the effects of microocclusions on NDS and Clasping reflex, Scheirer–Ray–Hare extension of the Kruskal–Wallis test was performed. Differences between sham and microinfarct group for the NOR were evaluated using the Mann–Whitney test using a standard statistical software package, Prism 5 (GraphPad Software, La Jolla, CA, USA). Effects of microinfarcts on blood flow and global neural activity in the experimental groups were assessed in MATLAB. Changes in network parameters were fit to a linear mixed-effects model (n = 9 microinfarct vs. n = 7 sham mice) using the glme MATLAB function and performed ANOVA on this model. p-values are reported for the fixed effect of treatment. Changes in blood flow, functional connectivity and standard deviation are shown as Median ± 75/25 percentile. A value of p < 0.05 was considered statistically significant.
Results
The distribution of microspheres was quantified by counting microspheres lodged in visually discernible anatomical brain regions in images obtained using an epifluorescent microscope Figure 1(d). Manual counting revealed that most microspheres were lodged in the cortex (45% ± 13%). Striatum (10% ± 6%), Thalamus (8% ± 4%) Hippocampus (5% ± 3%), and White matter (3% ± 1%) had a lower presence of lodged microspheres, while other subcortical regions contained 29% ± 8%.
Following microsphere injection, functional imaging and behavioral investigation were performed periodically in awake mice. Both microinfarct and sham mice received an NDS 18 of 0 during baseline assessment (see scale in Methods). On day 1 after surgery, microinfarct mice received a score of 1.8 on average, while sham mice only scored 0.1. Assessment of motor function showed a significantly higher NDS over four weeks after microsphere injection (p < 0.001 F (1,56) = 78.47) in microinfarct mice compared to the sham Figure 2(c). Clasping reflex, a measure of limb dystonia,19,20 was first assessed at baseline where both groups had a score of 0. Repeated measures showed that microinfarct mice had a trend (p = 0.0754) to a higher clasping score, with no sham mice scoring above 0 Figure 2(d).
Since the percentage of microspheres producing damage in our model was significantly greater in the hippocampus compared to the neocortex, 11 we evaluated hippocampus-dependent memory using the well-established NOR test. 21 Microinfarct mice showed a significantly lower novel object exploration time ratio (p = 0.0321) and discrimination index (p = 0.0207) consistent with alterations in hippocampal function Figure 2(e) and (f).
Transcranial windows were implanted in both groups at least seven days prior to microinfarct or sham surgery.13,26 This procedure results in a stable chronic window with a large field of view Figure 1(c) and minimal exposure to anesthesia as it requires less than 30 min per mouse.13,26 Mice are habituated to head-fixing sessions, wherein the setscrew keeps the entire head firmly in place regardless of body movement.13,26 This chronic window preparation allows the tracking of cerebral blood flow using laser speckle imaging Figure 3(a). Cerebral blood flow was recorded using laser speckle imaging to create blood flow maps (Figure 3(b) and (c)), which did not reveal any significant change between sham and microinfarct groups (Figure 3(d)). The lack of a measurable change in macroscopic blood flow is expected given that the model does not result in frank infraction and only affects a relatively small fraction of total dorsal cortex. 11
Using wide-field calcium imaging in GCaMP6 mice, we investigated functional cortical dynamics after microsphere injection. Spontaneous activity was recorded at day 1, 3, 5, 7, 14, 21 post-injection, and correlation matrices were generated see (Figure 4(d)). Pearson’s correlation was used as a measure of connectivity as it represents temporal synchrony of the activity of each pixel with the activity of the seed over an extended time course of spontaneous activity. These seed correlations are indicative of the degree of connectivity of each pixel to other pixels within the image.
27
The correlations were calculated using a lag time of zero between the seed and other pixels as in previous work.27,29 Although behavioral consequences were apparent, microinfarct surgery did not produce an effect on the connectivity pattern that was larger than sham surgery (Figure 4(d) and (e)). In order to verify the ability of our imaging configuration to detect any change in connectivity, we investigated how a bigger lesion to the cortex (>1 mm) induced by photothrombotic stroke could be detected by our system. By contrast to the microinfarct model, a strong disruption to interhemispheric connectivity between bilateral motor cortices was observed after focal photothrombotic stroke in motor cortex (correlation values between left and right motor cortex: z(r) = 1.46 ± 0.15 vs. 0.70 ± 0.01, n = 4, unpaired t-test: p = 0.003 (Supplementary Figure 1). This experiment confirmed that correlation analysis of spontaneous activity was able to reveal disruption of functional connectivity. Correlation maps were then generated for multiple days during baseline and after injection and then averaged for baseline or post-injection and for n = 7 sham or n = 9 microinfarct animals, Figure 5. Correlation matrices were obtained by reporting the correlation between pairs of seeds (Figure 6). Mean changes in connectivity per mouse after sham and microinfarct surgery showed no evidence of alteration in global connectivity compared to baseline or sham (two-tailed t-test: p = 0.6569 and 0.7411 respectively) at any of the frequency band explored (0.009–0.8, 0.08–0.4 and 0.4–4 Hz
25
).
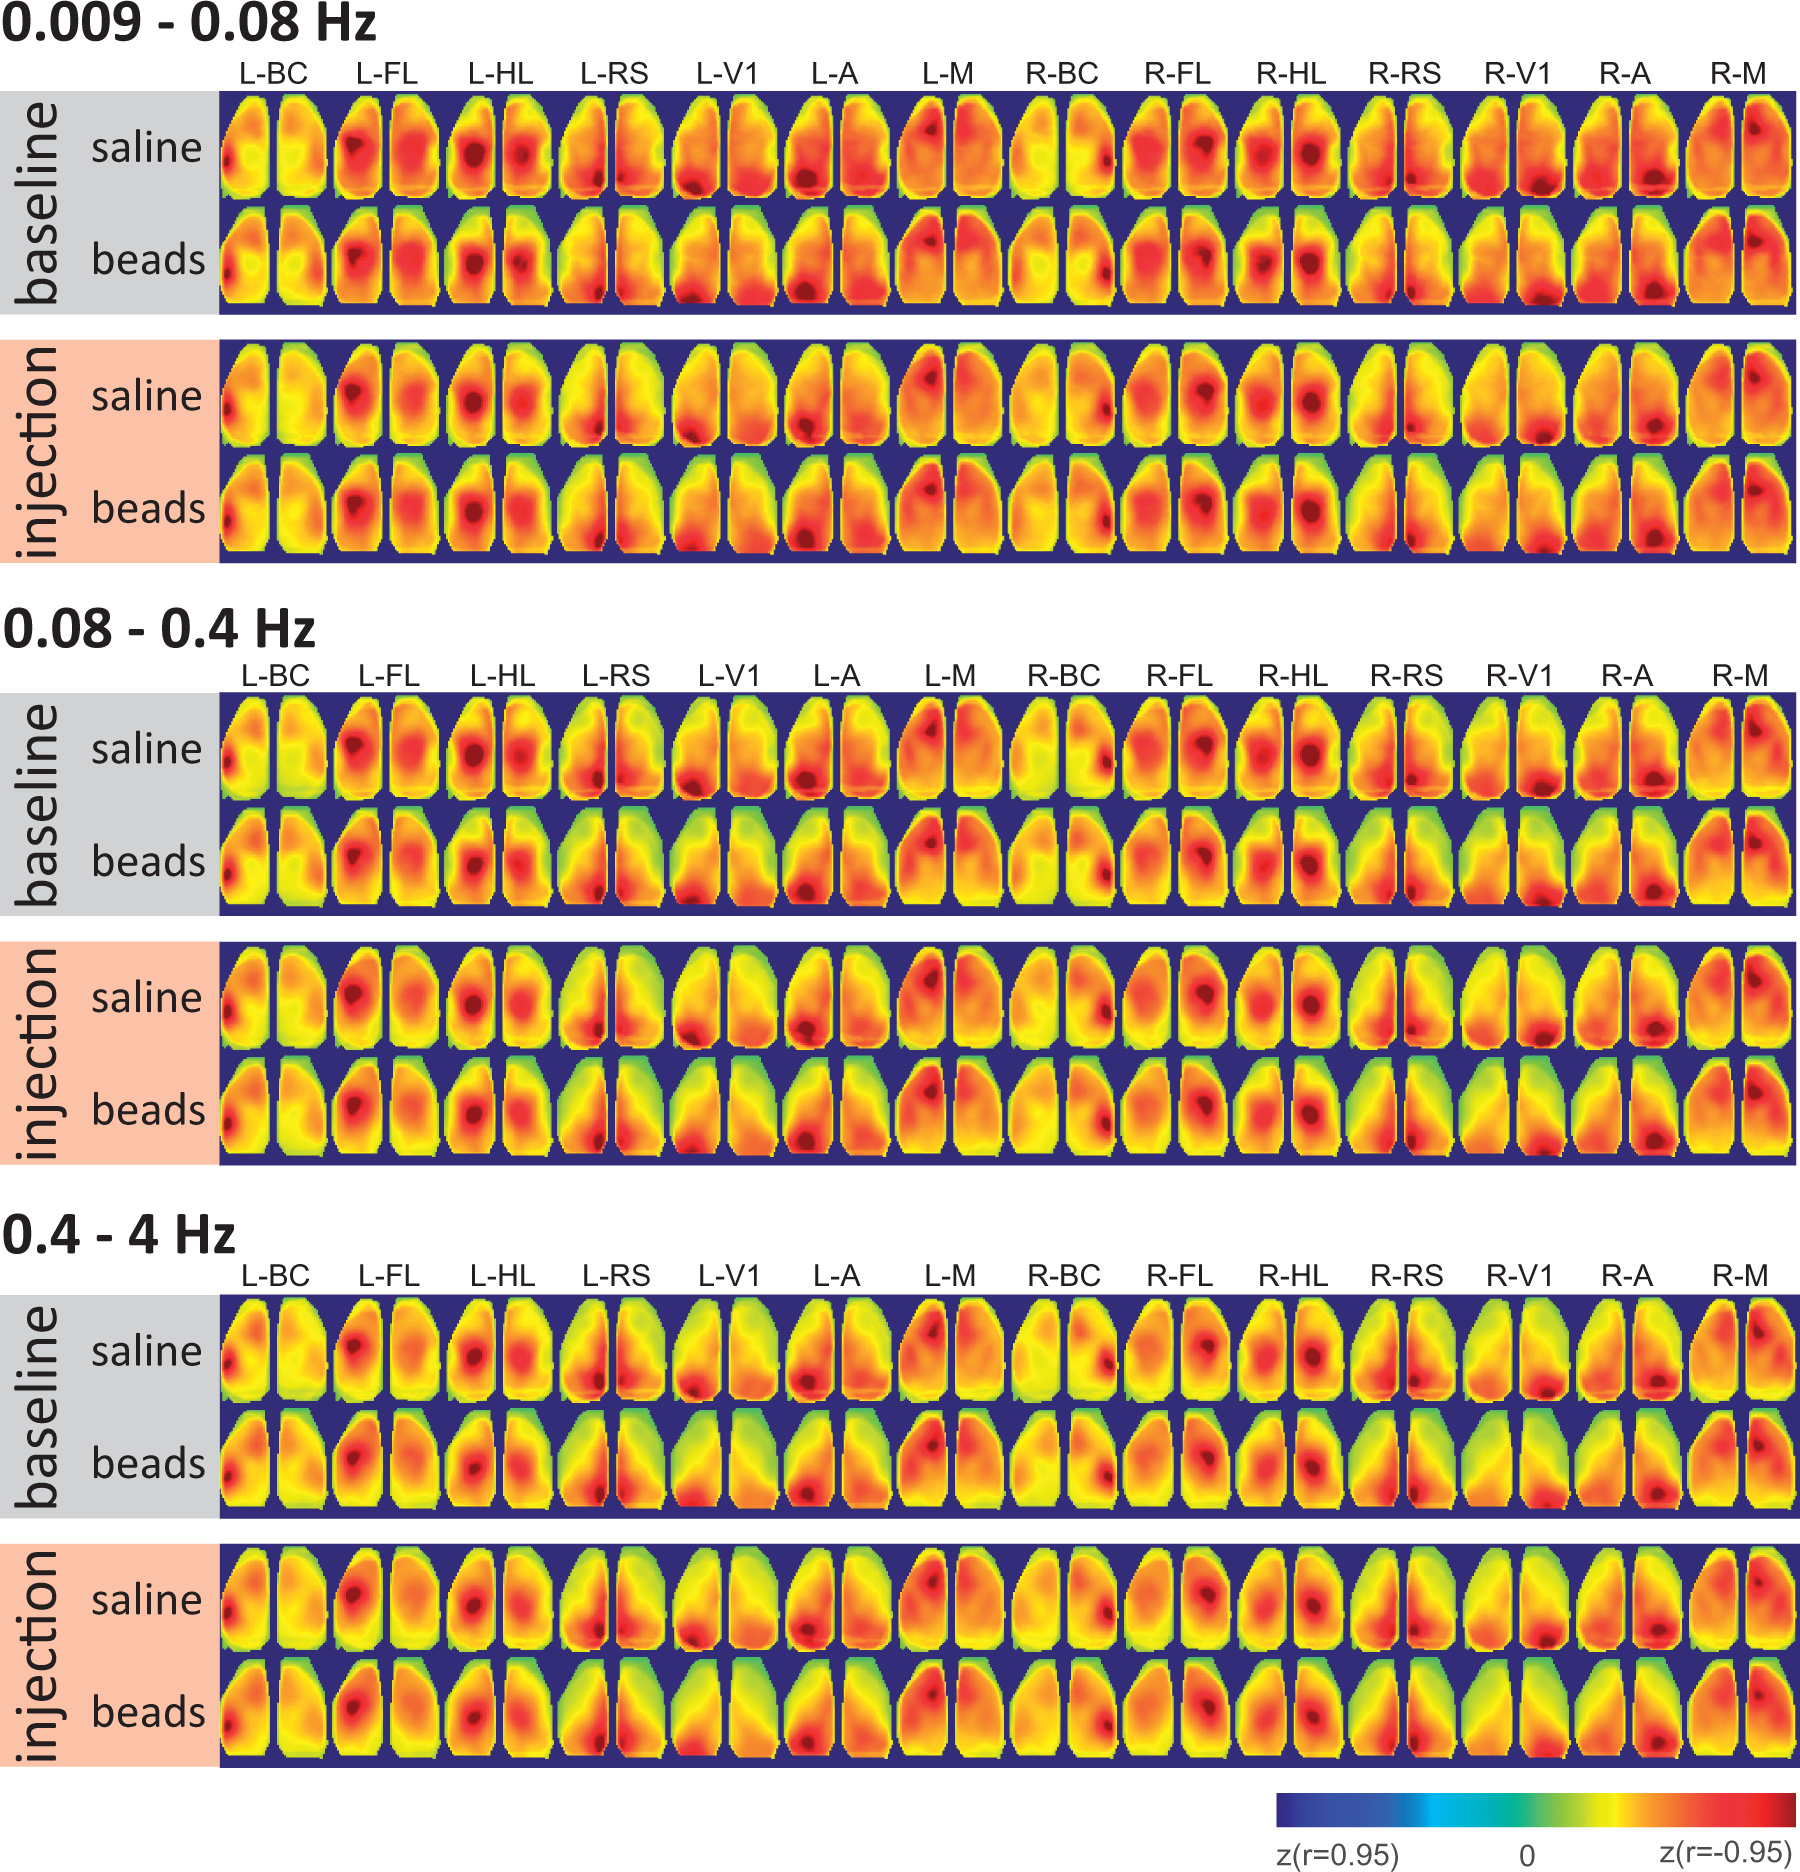
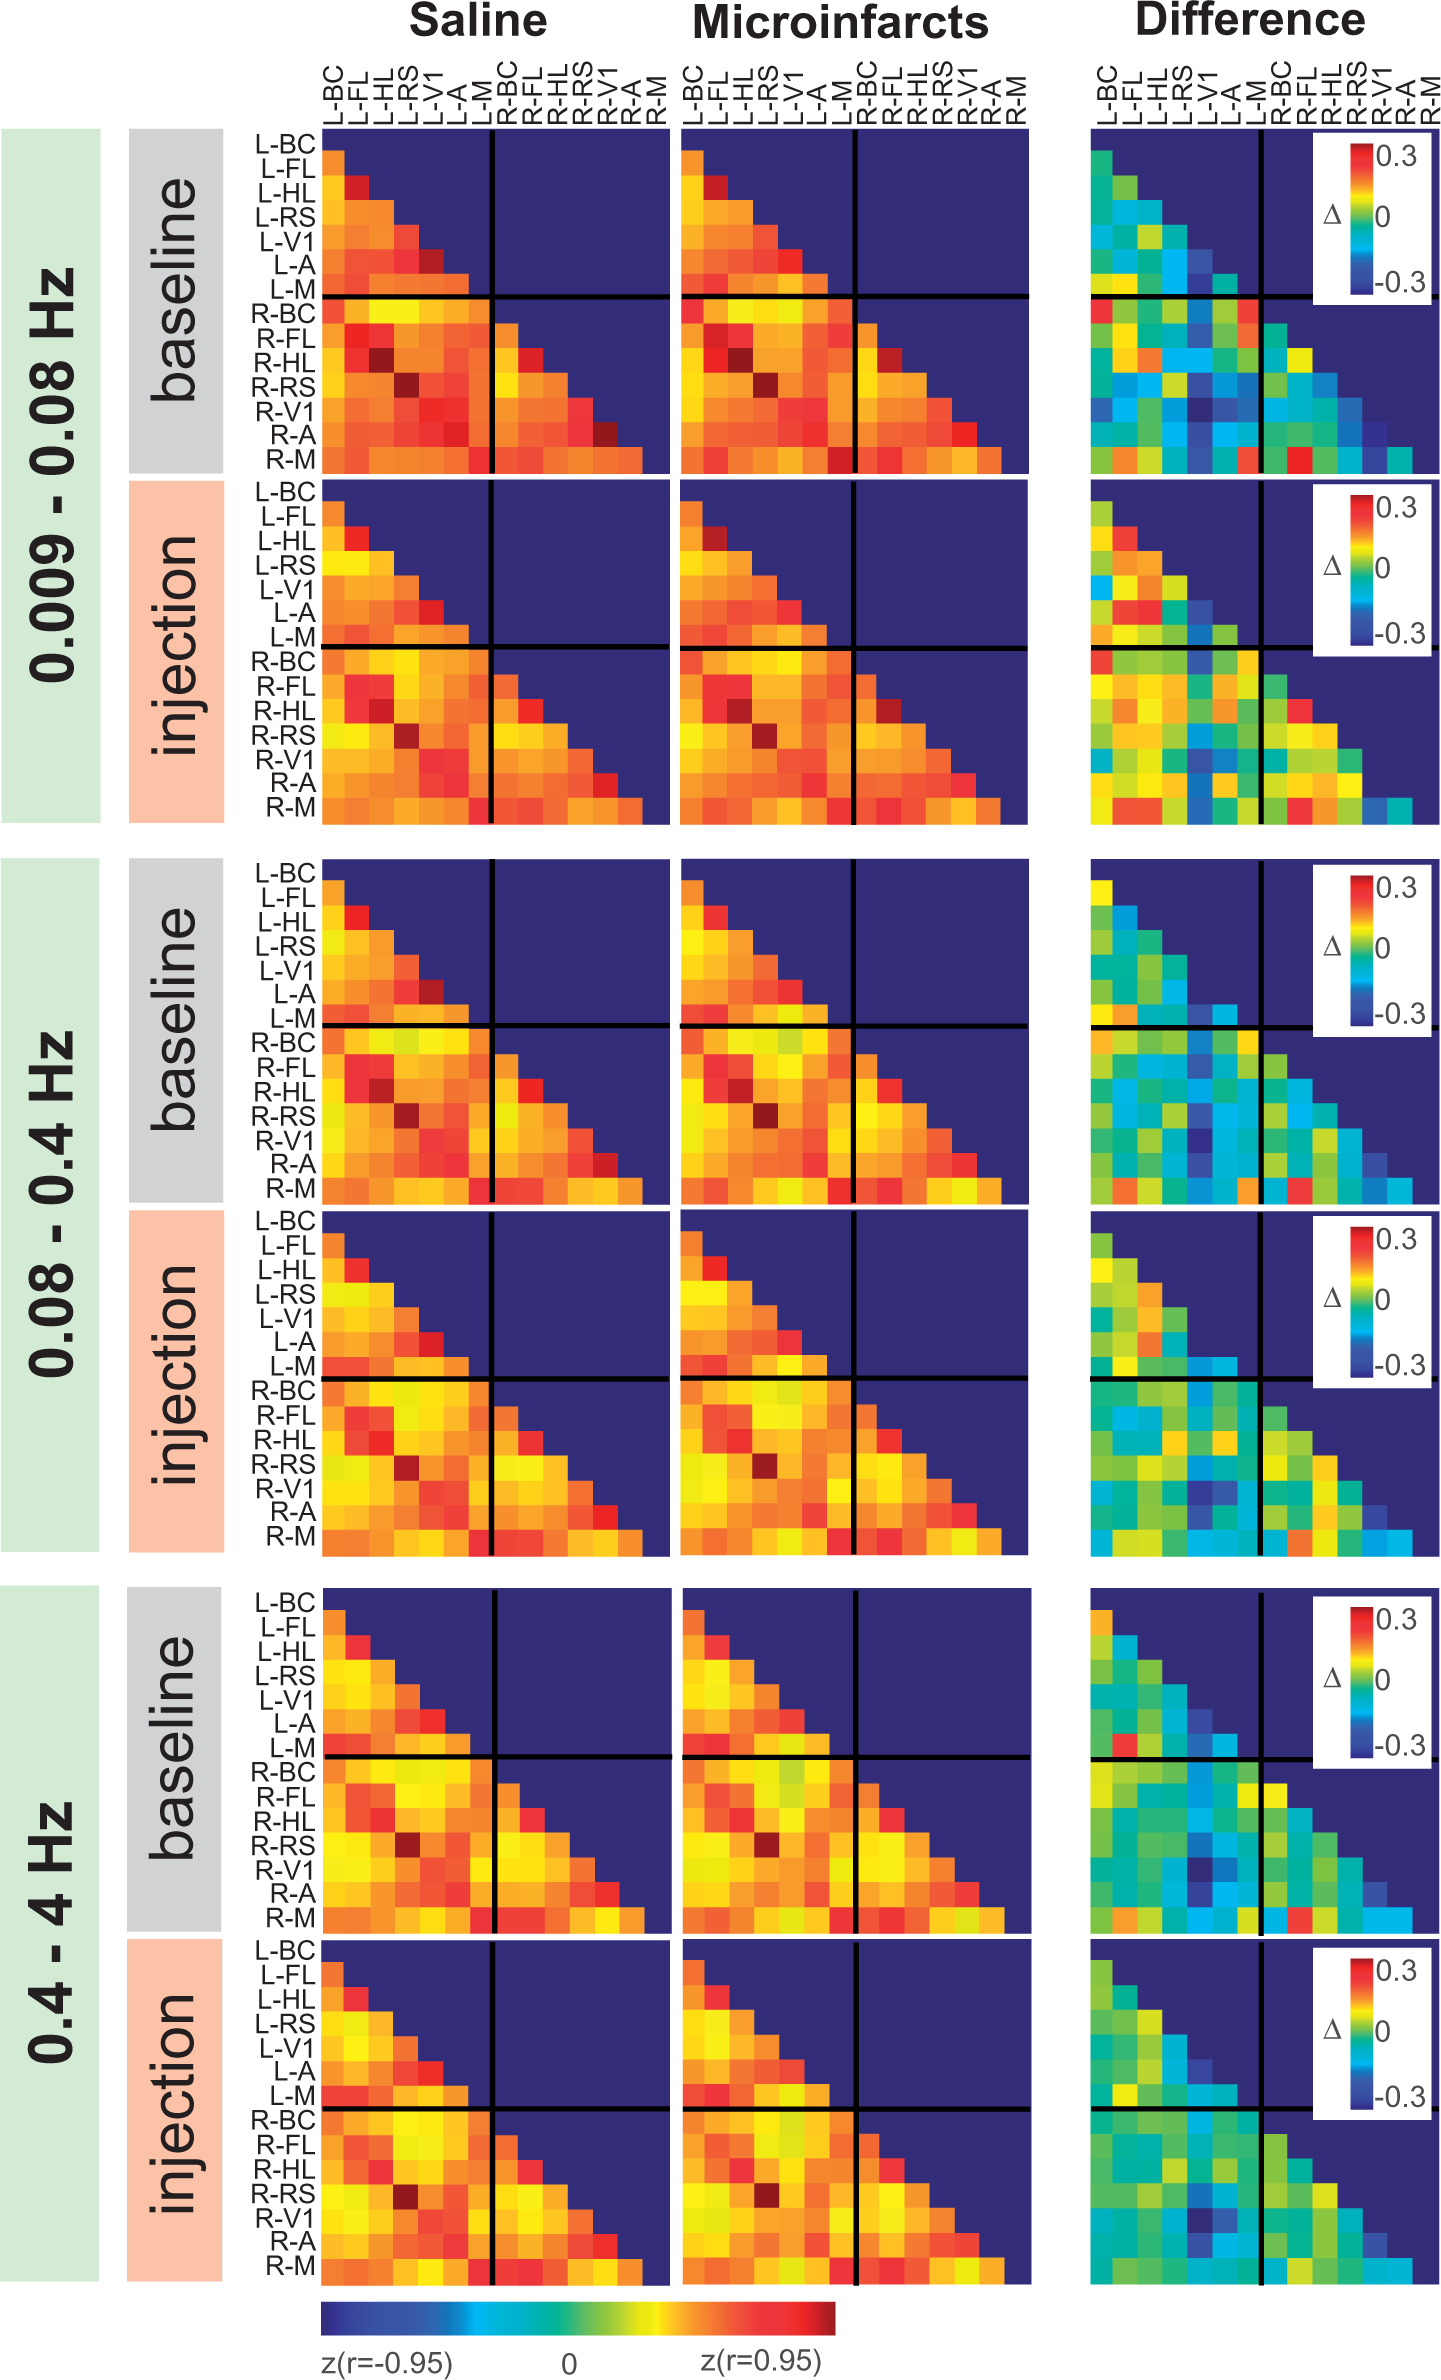
Wide-field calcium imaging. (a) Map of maximum response evoked by whisker stimulation in one recording. Every pixel with ΔF/F higher than 3% is color-coded and overlaid to the green fluorescence image. S: somatosensory cortex, M: motor cortex. (b) Evoked response at the location of the maximum. (c) Average response during baseline and after injection of saline or beads. (d) Left: Correlation maps (Fisher z-transformed) for three representative seeds (Barrel cortex: BC, Hindlimb region of the somatosensory cortex: HL and Primary visual cortex: V1) in each hemisphere during 5 consecutive days of baseline and 1, 3, 5, 7, 14 and 21 days after injection of saline in the left carotid (d), microsphere injection (e). Maps were processed at a frequency band between 0.4 and 4 Hz. Right: Correlation values between pairs of seeds averaged across baseline and after injection as well as their difference. Average correlation maps. Correlation maps for seven representative seeds (BC: barrel cortex, HL: hindlimb and FL: forelimb region of the somatosensory cortex, RS: retrosplenial, V1: primary visual cortex and M: motor cortex) in both hemispheres before (gray) and after (pink) injection of saline (top row) or beads (bottom row). Each map is an average across mice (Sham: n = 7, Beads: n = 9) and for three frequency bands: 0.009–0.8, 0.08–0.4 and 0.4–4 Hz. Average correlation matrices. Correlation values between pairs of seeds averaged across all mice for the days before (left) and after saline injection or microsphere injection for the three frequency bands: 0.009–0.8, 0.08–0.4 and 0.4–4 Hz.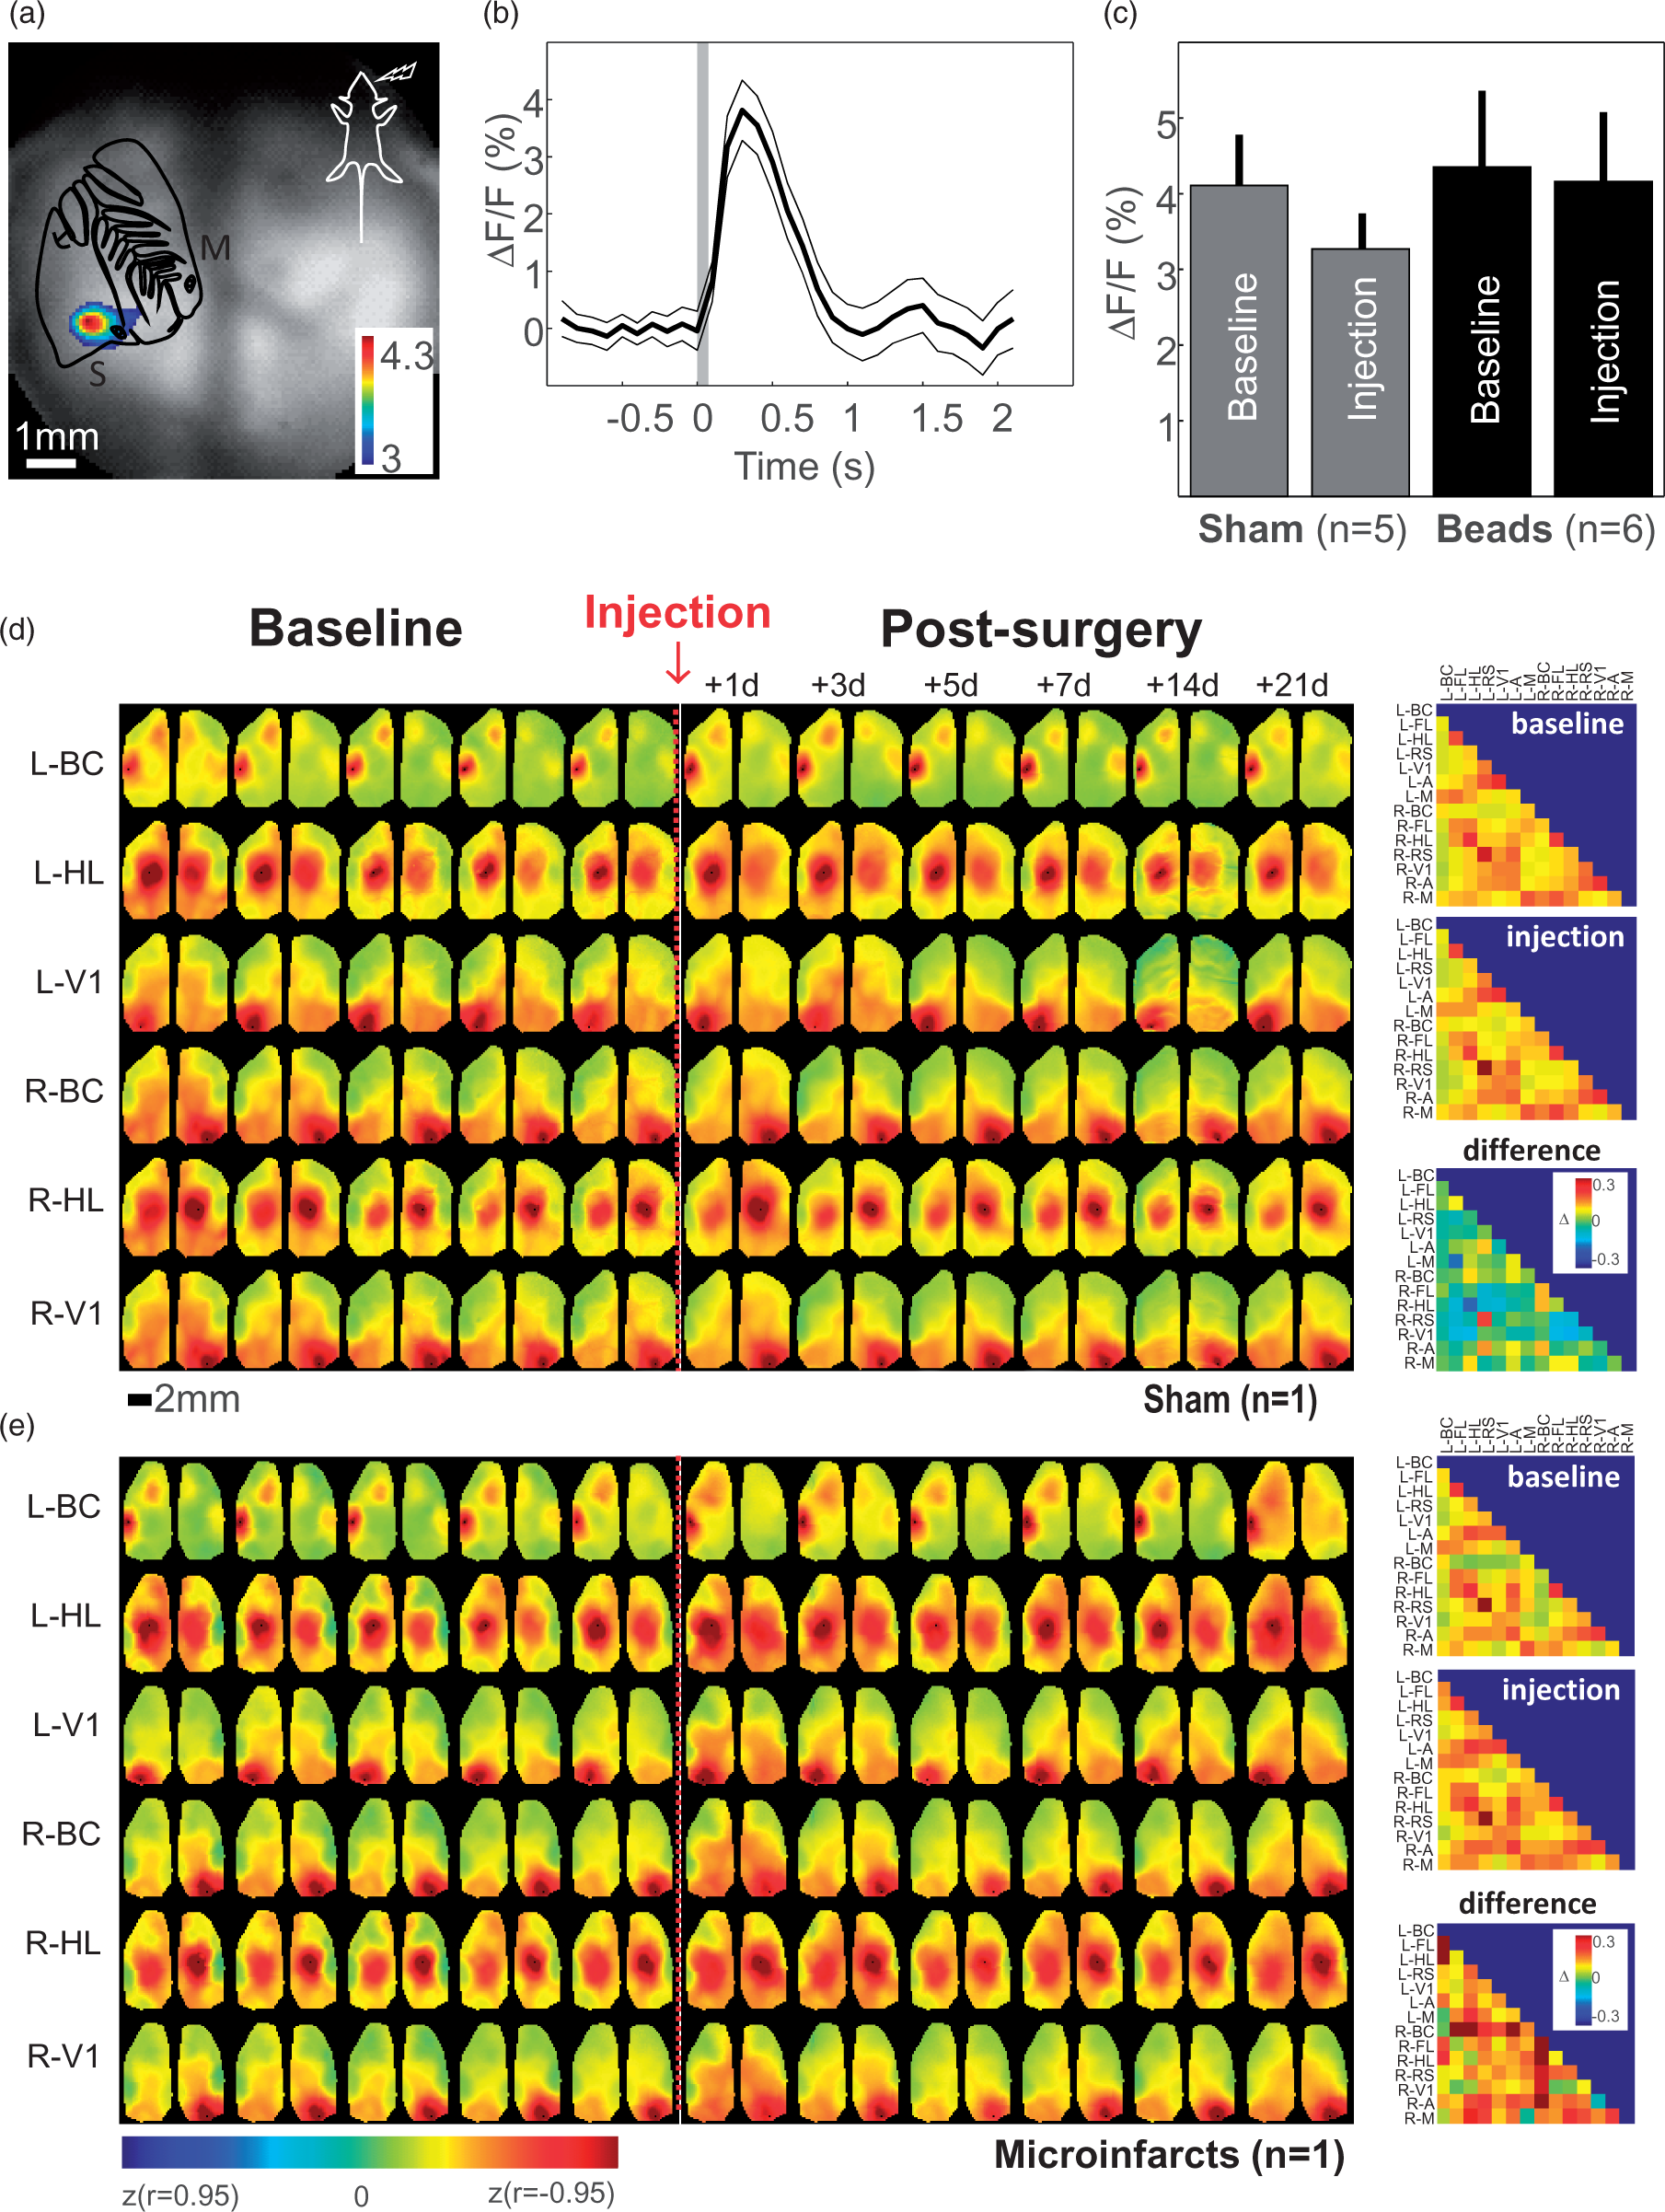
Analysis of network parameters averaged over the days before and after surgery revealed no significant effect of microinfarct induction on the changes in functional connectivity following surgery (Figure 7) in terms of global efficiency (p = 0. 9483), local efficiency (p = 0. 9966), clustering (p = 0. 9692), or modularity (p = 0. 4577).
Network parameters. Scatter and box plots of the changes in network parameters at baseline and after surgery. Microinfarct induction did not result in measurable changes to functional connectivity in terms of global efficiency (a, p = 0. 9483), local efficiency (b, p = 0. 9966), clustering (c, p = 0. 9692), or modularity (d, p = 0.4577). Box represents median ±25/75 percentile, while whiskers show minimum and maximum data points. The scatterplots overlaid show individual mice, with white circles for sham and black circles for microinfarct mice.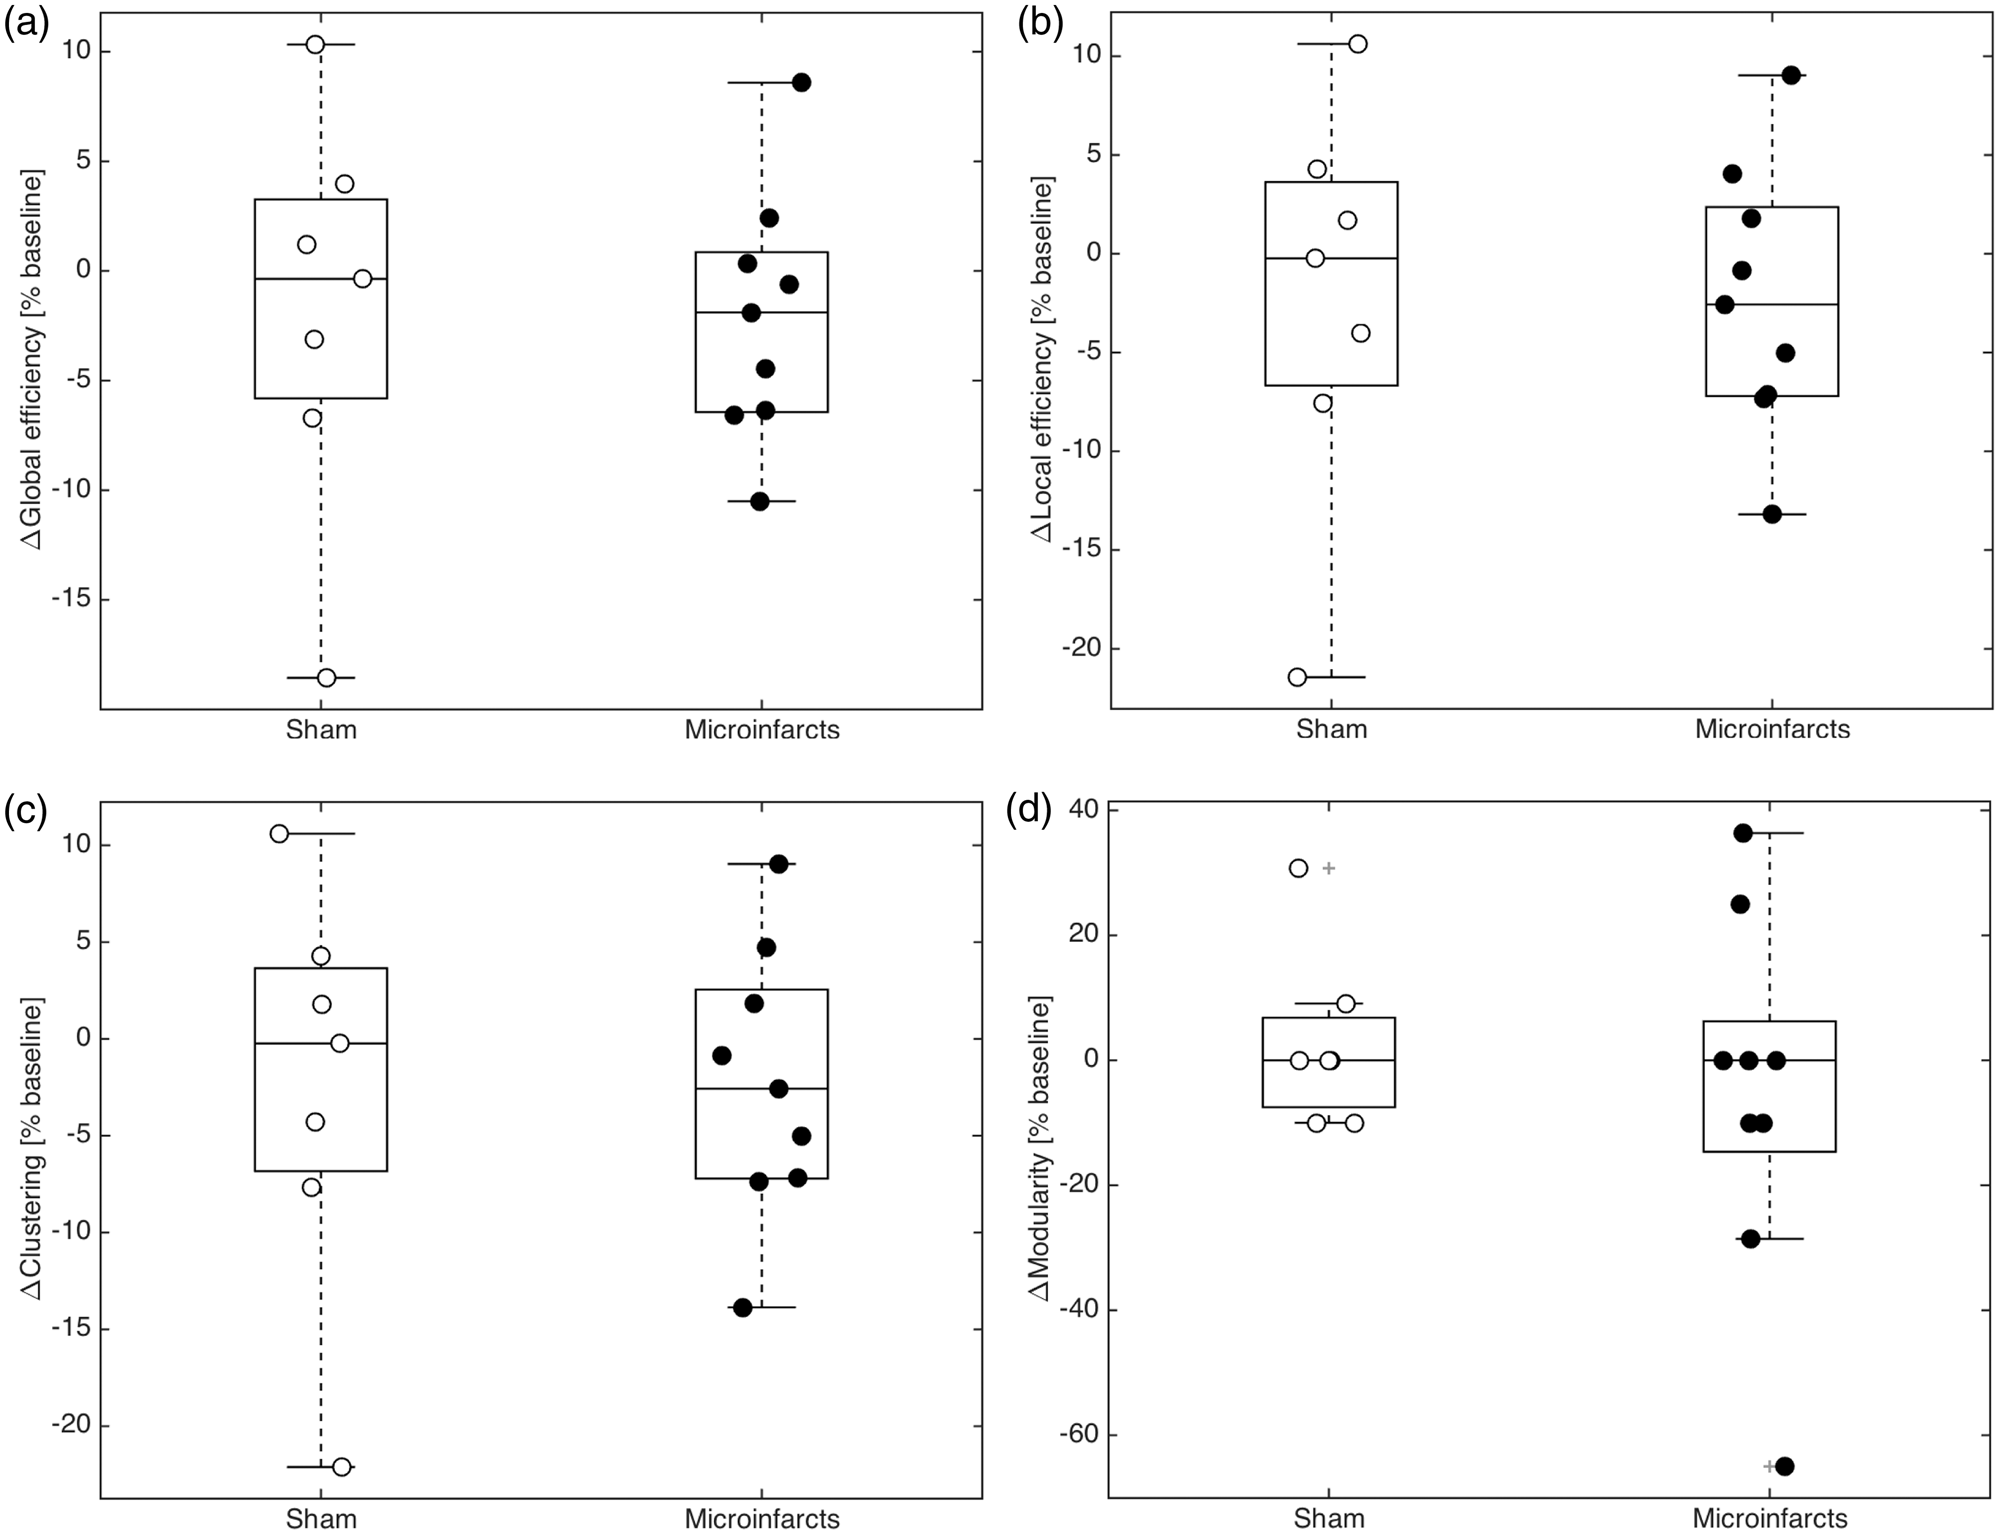
Since the analysis of spontaneous activity did not reveal impairments in cortical connectivity in spite of the observed motor impairments (Figure 2), we used functional activation paradigms to further investigate cortical connectivity. In the same cohort of mice, sensory activity was evoked by whisker stimulation and cortical activity within barrel cortex quantified (Figure 4(a) to (c)). No change in the strength in response was observed before and after injection of the beads (t-test between Beads and Saline animal, before and after injection. For both comparisons: p > 0.05).
Discussion
Using a novel fluorescent microsphere injection model for microinfarcts, 11 we found a significant behavioral impairment in mice that received the unilateral microsphere injection. Longitudinal testing of neurodeficit and clasping scores revealed significant, gross motor impairments during the first four weeks following microinfarct induction. However, no cortical dysfunction could be discerned in terms of neuronal activity on a global level using awake transcranial wide-field calcium imaging, or cerebral blood flow using laser speckle imaging, in any of the cortical regions investigated. Further graph-theoretic analysis of network parameters did not reveal significant changes to functional connectivity at a late stage following microinfarct induction.
Previous work conducted in both rats and mice used photothrombosis or laser light to disrupt flow in single penetrating arterioles.30,31 Despite the contributions of such studies, they still required manual targeting and occlusion of vessels that were optically accessible. Other methods for producing a shower of clots used cholesterol-derived microcrystals injected through the carotid artery.32–34 However, these crystals are variable in size and cannot be visually quantified in brain slices. Studies using fluorescent microspheres have used larger size microspheres (∼50 µm in diameter) to mimic infarcts typical of multi-embolic events35,36 and performed functional imaging in anesthetized mice. We used awake functional imaging to investigate a fluorescent microsphere model that targets the small penetrating arterioles affected in SVDs, and allows for an easy post-mortem localization of lodged microspheres within the mouse brain. 11 Based on the previous work, 11 most microspheres were predicted to occlude the cortical vasculature, which was validated histologically in the post-mortem analysis of the present study. Despite this, only a small percentage of microspheres lodged in the cortex result in a microinfarct using this model. 11 Nevertheless, axons in white matter tracts, striatum and thalamus are damaged after microinfarct induction, potentially disrupting cortical processing. Furthermore, the preponderance of subcortical and white matter lesions in human subjects who present cognitive and motor alterations5,6 implies deficit in regional cortical communication. Consequently, we performed pertinent cortical functional imaging along with behavioral testing.
Laser speckle imaging creates a high definition map of blood flow across the cortex, 22 and transcranial wide-field calcium imaging generates a map of neuronal activity in the cortex at the mesoscopic scale. Ischemic events have been linked to impairments in functional connectivity as assessed using indicators of neuronal activity.28,34 Cortical neuronal activity in mice that received photothrombotic stroke – a model of ischemic stroke known to result in reduced blood flow correlated with neurological impairment 26 and induced a strong disruption in cortical connectivity to the affected region. 37 Based on these findings, we assessed the effect of microinfarct induction on functional connectivity. However, there were no significant global alterations in either functional imaging modality following microinfarct induction. The mean values for cerebral blood flow and correlation of neuronal activity failed to show any significant difference between microinfarct and sham mice. However, the relatively low spatial resolution of laser speckle imaging may not detect a small proportion of microinfarcts. To assess the local effect of the microspheres may require higher resolution local analysis using, for example, two-photon microscopy.30,38
As we observed no global changes in functional connectivity as assessed by correlation, we investigated different network parameters of functional connectivity using a graph-theoretic analysis of the connectivity dataset defined by the correlation matrix. Graph theory has been previously used to investigate changes in functional connectivity in mesoscale imaging studies. 28 However, few studies have used graph theory to investigate the consequences of ischemic micro-events in animal models, 39 and none have evaluated functional connectivity with sparse lesions. Global efficiency is a well-studied network parameter that captures how quickly a network can combine information from distributed regions.40,41 Decreases in global efficiency are accepted as a marker of network deterioration and have been used as predictors of SVD in humans.9,42 However, no change in global efficiency after microinfarct induction was observed in our study, consistent with previous findings in animal studies. 39 Local efficiency measures how readily a sub-network can participate in the integration of information. 40 Previous findings from patients with SVD 43 have revealed an increased local efficiency correlated with cognitive decline. However, we observed no significant change in local efficiency as a result of microinfarct induction. The clustering coefficient of a network reflects the prevalence of densely interconnected groups of brain regions, 44 while modularity that captures the degree to which these interconnected groups represent clearly delineated and non-overlapping structures. 14 Previous findings revealed a decrease in modularity following ischemic events in mice. 39 However, these changes were only visible after a reported increase in severity of hypoperfusion in aged mice. In our study, no significant changes in either clustering coefficient or modularity were observed as a result of microinfarct induction, indicating that factors such as the age of the mice and the severity of the assault may be crucial contributors to network deterioration.
A well-known limitation to this type of analysis is that results may vary depending on parcellation criteria used. 45 Here, we defined brain regions using a connectivity-based approach based on spontaneous activity. An alternative explanation for the absence of measurable changes to network parameters in the face of gross motor impairment could be that either white matter projections or subcortical nuclei lesions account for the motor dysfunctions observed. Additionally, microscopic observations could also provide insight into these complex mesoscopic relations.
The hippocampus is another brain region that is critically affected in this model. 11 Despite the greater number of microsphere lodged in the cortex, microspheres lodged in the hippocampus resulted in the highest proportion of micro-occlusion that led to microinfarct formation. 11 Microinfarct mice exhibited significantly lower exploratory behavior of a novel object vs. a familiar object compared to the sham mice. 21 A limitation of the object recognition test is the avoidance of a novel object due to neophobic reactions. 21 To avoid this possible confound, mice were given 15 min to familiarize themselves with the testing environment before being presented with a test object. Furthermore, object recognition memory requires the interaction of several brain regions in addition to the hippocampus, such as the amygdala and perirhinal cortex. 46 Therefore, impairments in object recognition may not be taken as direct evidence of hippocampal dysfunction in a stochastic lesion model that may have also affected other brain regions involved. Nonetheless, given that this model shows a larger incidence of microsphere-induced lesions in the hippocampus 11 and that hippocampal inactivation is sufficient to impair NOR, 47 we may at least partially attribute, impairments in NOR to microinfarcts in the hippocampus.
A key factor of this model is that it allows us to observe fluorescent microspheres in histological slices as a means to quantify the extent to which microspheres were lodged in different brain regions. However, consistent with previous findings,33,48,49 Silasi et al. 11 show that in this model, the majority of lodged microspheres do not cause microinfarcts and that this varies across brain regions. One possible explanation is that the level of vascularization of each brain structure influences microsphere distribution. Relative to the cortex, the hippocampus and white matter have lower capillary densities in mice 50 and accumulated fewer lodged beads, but were more susceptible to damage. 11
A major challenge facing the fluorescent microsphere model, as well as every particle injection model of SVD11,31,33 is the stochasticity of both the particle lodging and infarct formation. However, this targeting of the brain vasculature with hundreds of microspheres does result in behavioral impairments (high neurodeficit and clasping, and reduced exploration of novel objects). Cognitive and gross motor impairments accompanied by a preponderance of subcortical and white matter lesions over cortical lesions are observed in both the human disease 51 and the present model, but escape detection by in vivo imaging of regional activity and human diagnosis. Given these parallels, the challenge seems to be inherent to the disease itself and not a failure of the model. While we have intended to use mesoscale imaging to model human clinical imaging tools, higher spatial-resolution analysis of the functional imaging taking into consideration the location of micro-infarcts lesions could be developed to successfully identify the alterations responsible for the observed motor and memory impairment.
Supplemental Material
Supplemental material for Longitudinal monitoring of mesoscopic cortical activity in a mouse model of microinfarcts reveals dissociations with behavioral and motor function
Supplemental material for Longitudinal monitoring of mesoscopic cortical activity in a mouse model of microinfarcts reveals dissociations with behavioral and motor function by Matilde Balbi, Matthieu P Vanni, Max J Vega, Gergely Silasi, Yuki Sekino, Jamie D Boyd, Jeffrey M LeDue and Timothy H Murphy in Journal of Cerebral Blood Flow & Metabolism
Footnotes
Funding
The author(s) disclosed receipt of the following financial support for the research, authorship, and/or publication of this article: This work was supported by the Leducq foundation, the Foundation Grant from Canadian Institutes of Health Research FDN-143209 and the Brain Canada, Heart and Stroke Foundation of Canada, Canadian Neurophotonics Platform, and the Canadian Partnership for Stroke Recovery. We thank Pumin Wang and Xiao-Yan Cindy Jiang for surgical assistance, and Luis Bolanos for graphic design contribution.
Declaration of conflicting interests
The author(s) declared no potential conflicts of interest with respect to the research, authorship, and/or publication of this article.
Authors’ contributions
Matilde Balbi: study design, performed the experiments, data interpretation, wrote the manuscript. Matthieu P Vanni: analysis contribution, data interpretation, edited the manuscript. Max J Vega: analysis contribution, data interpretation. Gergely Silasi: study design, data interpretation. Yuki Sekino: performed part of the behavioral experiments. Jamie D Boyd: optical assistance. Jeffrey LeDue: optical assistance, analysis contribution, data interpretation, edited the manuscript. Timothy H Murphy: study design, data interpretation, edited the manuscript.
References
Supplementary Material
Please find the following supplemental material available below.
For Open Access articles published under a Creative Commons License, all supplemental material carries the same license as the article it is associated with.
For non-Open Access articles published, all supplemental material carries a non-exclusive license, and permission requests for re-use of supplemental material or any part of supplemental material shall be sent directly to the copyright owner as specified in the copyright notice associated with the article.