
Abstract
An alteration of parenchymal cerebrospinal fluid circulation (CSF) has been proposed to take part in the pathophysiology of multiple sclerosis. By using an intragate T1-weighted high-resolution MRI of the spinal cord of freely breathing mice injected with a gadolinium chelate in the cisterna magna, we show that a parenchymal CSF circulation exists in the spinal cord, in addition to that originally described in the brain. In experimental autoimmune encephalomyelitis, a model of multiple sclerosis, we show a reduction of parenchymal CSF circulation specifically in the spinal cord but not in the brain.
Introduction
The existence of a parenchymal cerebrospinal fluid (CSF) circulation through the cerebral tissues has been originally described in the brain. 1 The recent introduction of the “glymphatic” concept has opened an intense debate regarding the nature of the molecular and cellular supports and biophysical mechanisms involved (actual circulation or combination of diffusion with convection or dispersion).2–6 In any case, parenchymal CSF circulation may play an important role for the physiology of the CNS, and recent studies have reported its alteration during ageing and in several models of neurological diseases such as Alzheimer’s Disease, 7 traumatic brain injury, 8 vascular dementia, 9 stroke 10 or subarachnoid hemorrhage. 11 The existence of a parenchymal CSF circulation comparable to what reported in the brain has only be scarcely investigated, 12 despite the necessity of a drainage system in the spinal cord too.
Multiple sclerosis (MS) is a demyelinating disease in which neuroinflammation and CNS autoimmunity play a central role. Considering the close interactions of CNS fluid drainage with neuroinflammatory and neuroimmune processes, 13 impairment of parenchymal CSF circulation has been proposed to play a role in MS pathophysiology. 14 However, this possibility was never studied in animal models of MS.
In the present study, we have developed an original method allowing imaging the circulation of CSF through the mouse spinal cord using high-resolution MRI in freely breathing mice. We give the evidence of a parenchymal CSF circulation in the mouse spinal cord parenchyma, and show its alteration in the spinal cord of mice subjected to experimental autoimmune encephalomyelitis (EAE), a model of MS.
Materials and methods
Animals
Experiments were performed on female SJL/J mice (Janvier, Le Genest-Saint-Isle, France) in accordance with the French (Decree 87/848) and the European Communities Council (Directive 86/609) guidelines. This study and the procedures thereof were approved by the French ministry of education and research (Project #02654.02; Center agreement #D14118001). All animals of this study were maintained under specific pathogen-free conditions at the Centre Universitaire de Ressources Biologiques (CURB, Basse-Normandie, France). Animal experiments are reported in compliance with the ARRIVE guidelines. Investigators were blinded to experimental group when performing and analysing all the experiments presented in this study.
Intracisternal injection
Specific tracers indocyanine green (7.75 kDa) or Dotarem (0.56 kDa) were injected (1 µL over 1 min) into the cisterna magna following a previously reported method 10 by using a pulled glass micropipette (diameter = ∼ 80 µm).
Relapsing remitting EAE (PLP–induced EAE) was induced in 6/8-week-old female SJL/J mice 15 following a previously reported method. 16 Animals were randomly affiliated to EAE or Sham groups. Parenchymal CSF circulation was assessed by the methods described below when the animals reached a clinical score of 2 (11–13 days after EAE induction).
MRI experiments were performed on a 7T Pharmascan MRI system (Bruker, Germany) equipped with surface coils. High-resolution 3D T1-weighted imaging of the brain was performed with a fast low angle shot (FLASH) sequence with the following parameters: TR/TE 15/3.57 ms, Angle = 25°, Field of View = 20 × 17 × 14.4 mm, Matrix = 256 × 218 × 96 (leading to a resolution of 78 × 78 × 0.15 mm), acquisition time = 5 m 14s. High-resolution 2D T1-weighted imaging of the spinal cord was performed with the following parameters sequence set as follow : TR/TE 16.4/3.393 ms, Angle = 40°, Field of View = 20 × 15 mm, Matrix = 256 × 192, Slice Thickness (i.e. depth of the sample contributing to the image) : 0.4 mm, voxel size: 0.078 mm × 0.078 mm × 0.4 mm, acquisition time = 2 m 37 s. Quantification of the images was performed using ImageJ (1.48, NIH) in a blinded manner.
Ex vivo optical imaging
After (1 h) intracisternal indocyanine green microinjection, brain and spinal cords were removed and placed in optical imaging system (Biospace). Fluorescence was measured (excitation = 650 nm, background = 500 nm, emission filter = 700 nm) and quantified with the M3 Vision software (Biospace).
Immunohistochemistry
Euthanasia, tissue preparation and immuostaining were performed as described earlier 16 using the following antibodies: goat anti-Collagen IV (1:1000; SouthernBiotech), rabbit anti-Aquaporin 4 (1:1000; Santa Cruz Biotechnology), rat anti-CD4 (1:25; ebioscience) and sheep anti-fibrinogen (1:10,000). Primary antibodies were revealed using Fab'2 fragments of Donkey anti-rat, rabbit or goat IgG linked to FITC, TRITC (1:600, Jackson ImmunoResearch, West Grove, USA). Images were digitally captured using a Leica DM6000 microscope-coupled coolsnap camera, visualized with Metavue 5.0 software (Molecular Devices, USA) and further processed using ImageJ 1.49e software (NIH). All analyses were performed blinded to the experimental groups.
Statistical analysis
Results are presented as the mean ± SEM. Normality tests were performed on all samples (D'Agostino-Pearson omnibus test and Shapiro–Wilk test). When normality could not be assumed, we used non-parametric tests (Kruskal–Wallis for multiple comparisons followed by Mann–Whitney's U-test), which are the most stringent in these conditions. Two groups were considered to be significantly different when p-value < 0.05.
Results
The existence of a parenchymal CSF circulation can be evidenced by the minimally invasive injection of tracers in the cisterna magna10,17 and the observation of their apparent diffusion within cerebral tissues. The tracer indocyne green broadly diffused within the spinal cord parenchyma 1 h after its injection in the cisterna magna (Figure 1(a) and corresponding quantification, Figure 1(b)). One hour after injection of DOTA-Gd into the cisterna magna, we observed two types of T1 MRI hypersignal: first, a strong hypersignal at the border of the spinal cord (Figure 1(c), yellow arrows), corresponding to the classically described arachnoid CSF flux
1
; second, a more diffuse hypersignal within the whole spinal cord parenchyma (Figure 1(c), white arrows), which showed that the contrast agent had reached all spinal cord regions. This hypersignal then gradually decreased (4 h and 24 h, Figure 1(d), and corresponding quantification, Figure 1(e) and (f)).
Evidence of parenchymal CSF circulation in the spinal cord. (a, b) Ex-vivo optical imaging of Indocyanine green diffusion into the spinal cord parenchyma and corresponding quantification (n = 3–6; *P < 0.05). The images presented show a projection of fluorescence intensity emitted by the dye contained within the whole volume of tissue. (c–f) Representative axial and sagittal T1-weighted images before and after DOTA-Gd injection in the cisterna magna and corresponding quantifications (n = 4/group; *P < 0.05). Quantification is made from the whole CNS region scanned by MRI (rostral or caudal part of the spinal cord shown in D) and global signal collected from each caudal or rostral cord is normalized to the surface of each region. Yellow arrows: arachnoid CSF flux, blue arrows: parenchymal influx.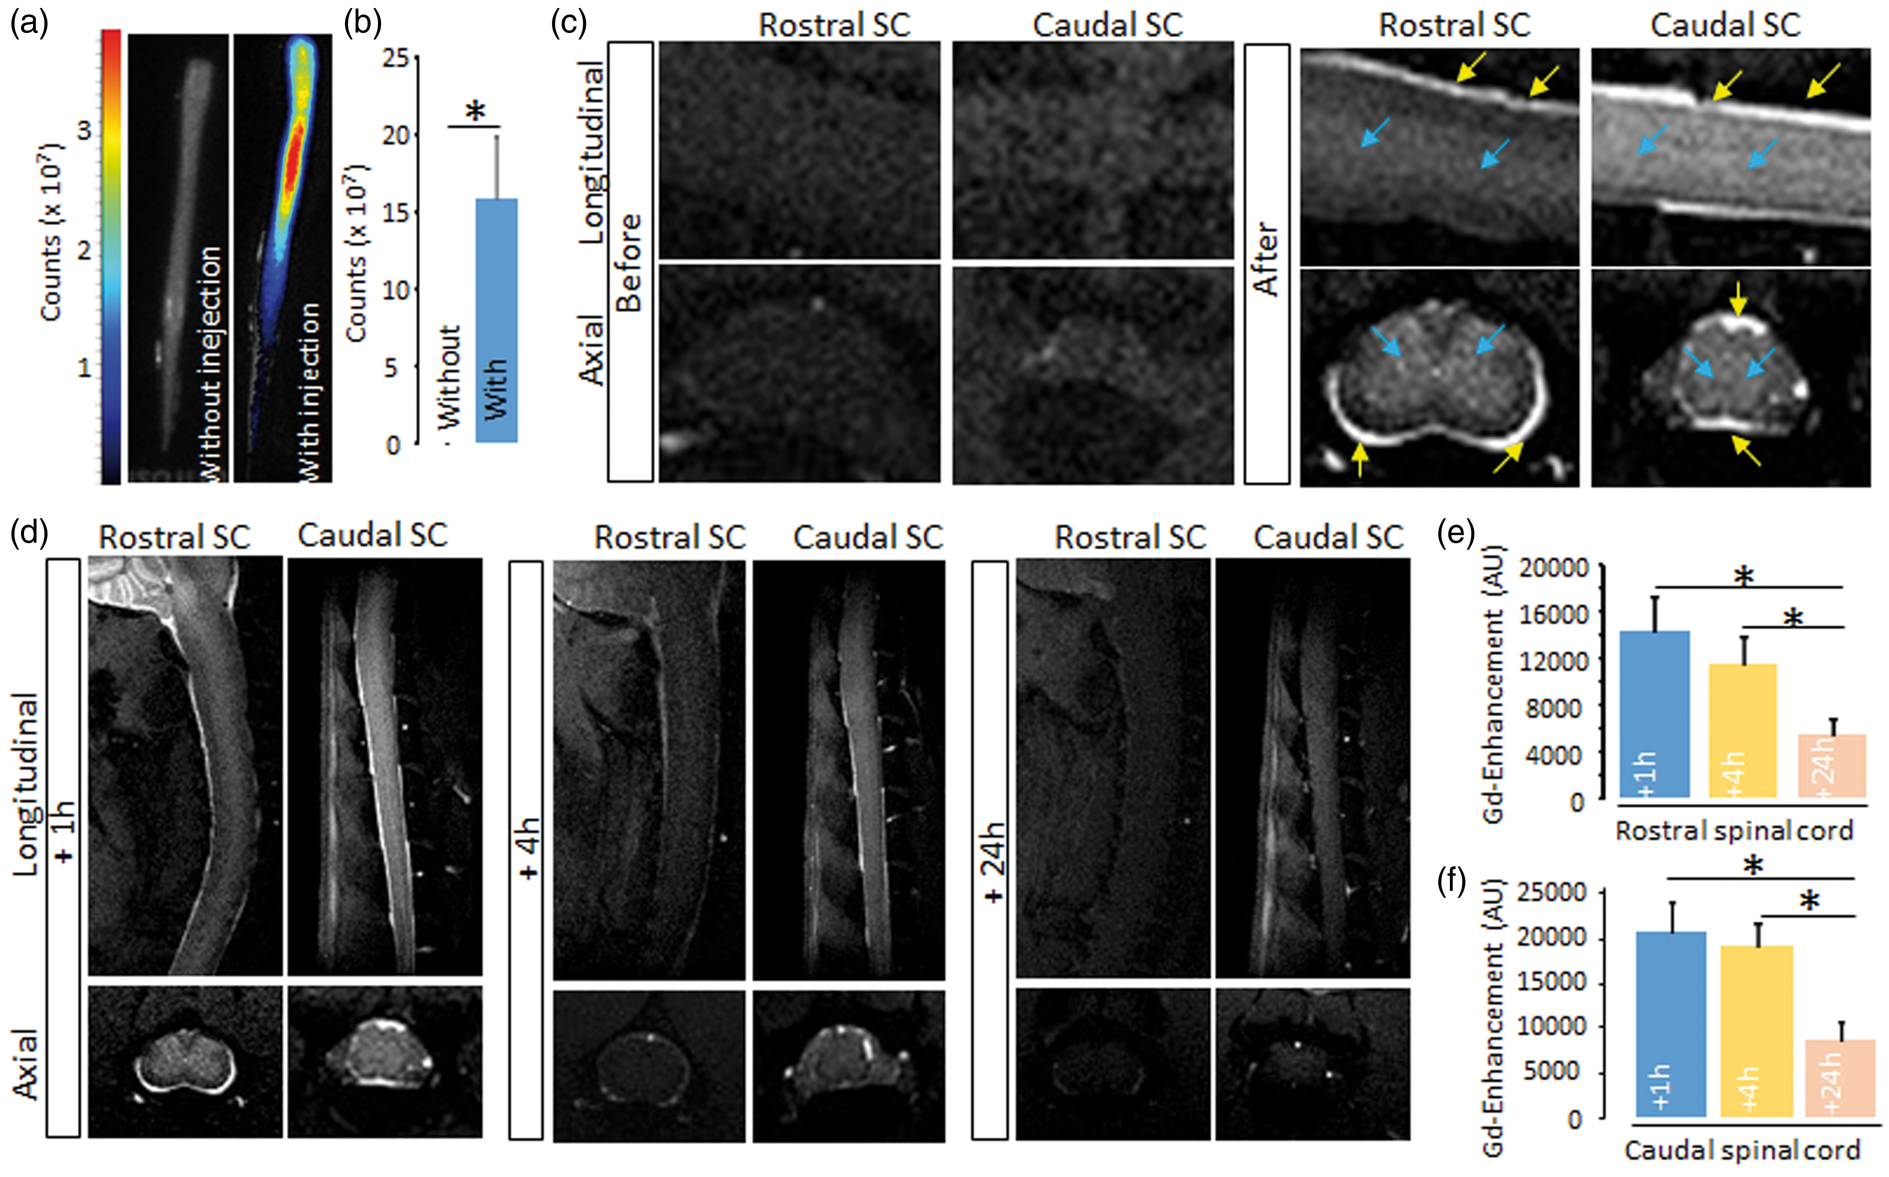
Then, given the importance of CNS fluid drainage in inflammation and immune response to the CNS,
18
we addressed whether a modification of parenchymal CSF circulation occurred in EAE. After injection in the cisterna magna, DOTA-Gd diffused within the spinal cord parenchyma of sham animals (Figure 2(a) and corresponding quantification, Figure 2(b)) in the same manner as what observed in control animals (Figure 1(d)). In contrast, this diffusion was much lower in EAE animals (Figure 2(a) and corresponding quantification, Figure 2(b)). These data were confirmed by the ex-vivo observation of reduced indocyanine green diffusion (Figure 2(c) and corresponding quantification, Figure 2(d)). When indocyanine green was injected intravenously, it diffused within the spinal cord only in EAE but not in sham animals (Figure 2(e) and (f)), which reflects blood–spinal cord barrier dysfunction. Noteworthy, the diffusion of DOTA-Gd (Figure 2(g)) and indocyanin green (Figure 2(h)) from the cisterna magna were normal in the brain and cerebellum of these animals (Figure 2(i) to (j)). Finally, the diffusion of DOTA-Gd from the cisterna magna was not altered in pre-symptomatic animals (24 h before onset; Figure 2(k) and corresponding quantification, Figure 2(l)).
CSF influx into the spinal cord is reduced in a mouse model of multiple sclerosis. (a, b) Representative axial and sagittal T1-weighted spinal cord images after DOTA-Gd injection in the cisterna magna and corresponding quantification (n = 3–4 /group; *P < 0.05). (c, d) Representative ex vivo optical imaging of the spinal cord after indocyanine green injection in the cisterna magna and corresponding quantification (n = 3–4 /group; *P < 0.05). (e, f) Representative ex vivo optical imaging of the spinal cord after intravenous indocyanine green injection and corresponding quantification (n = 3–5 /group; *P < 0.05). The images presented (c–f) show a projection of fluorescence intensity emitted by the dye contained within the whole volume of tissue. (g) Representative T1-weighted brain images after DOTA-Gd injection in the cisterna magna and corresponding quantification (n = 3–4 /group). (h) Representative ex vivo optical imaging of the brain after indocyanine green injection and corresponding quantification (n = 3–4 /group). (i, j) Quantification of images in E and F. (k, l) Representative axial and sagittal T1-weighted spinal cord images from asymptomatic EAE (24 h before onset) and date-matched sham with DOTA-Gd injection in the cisterna magna and corresponding quantifications (n = 4 /group).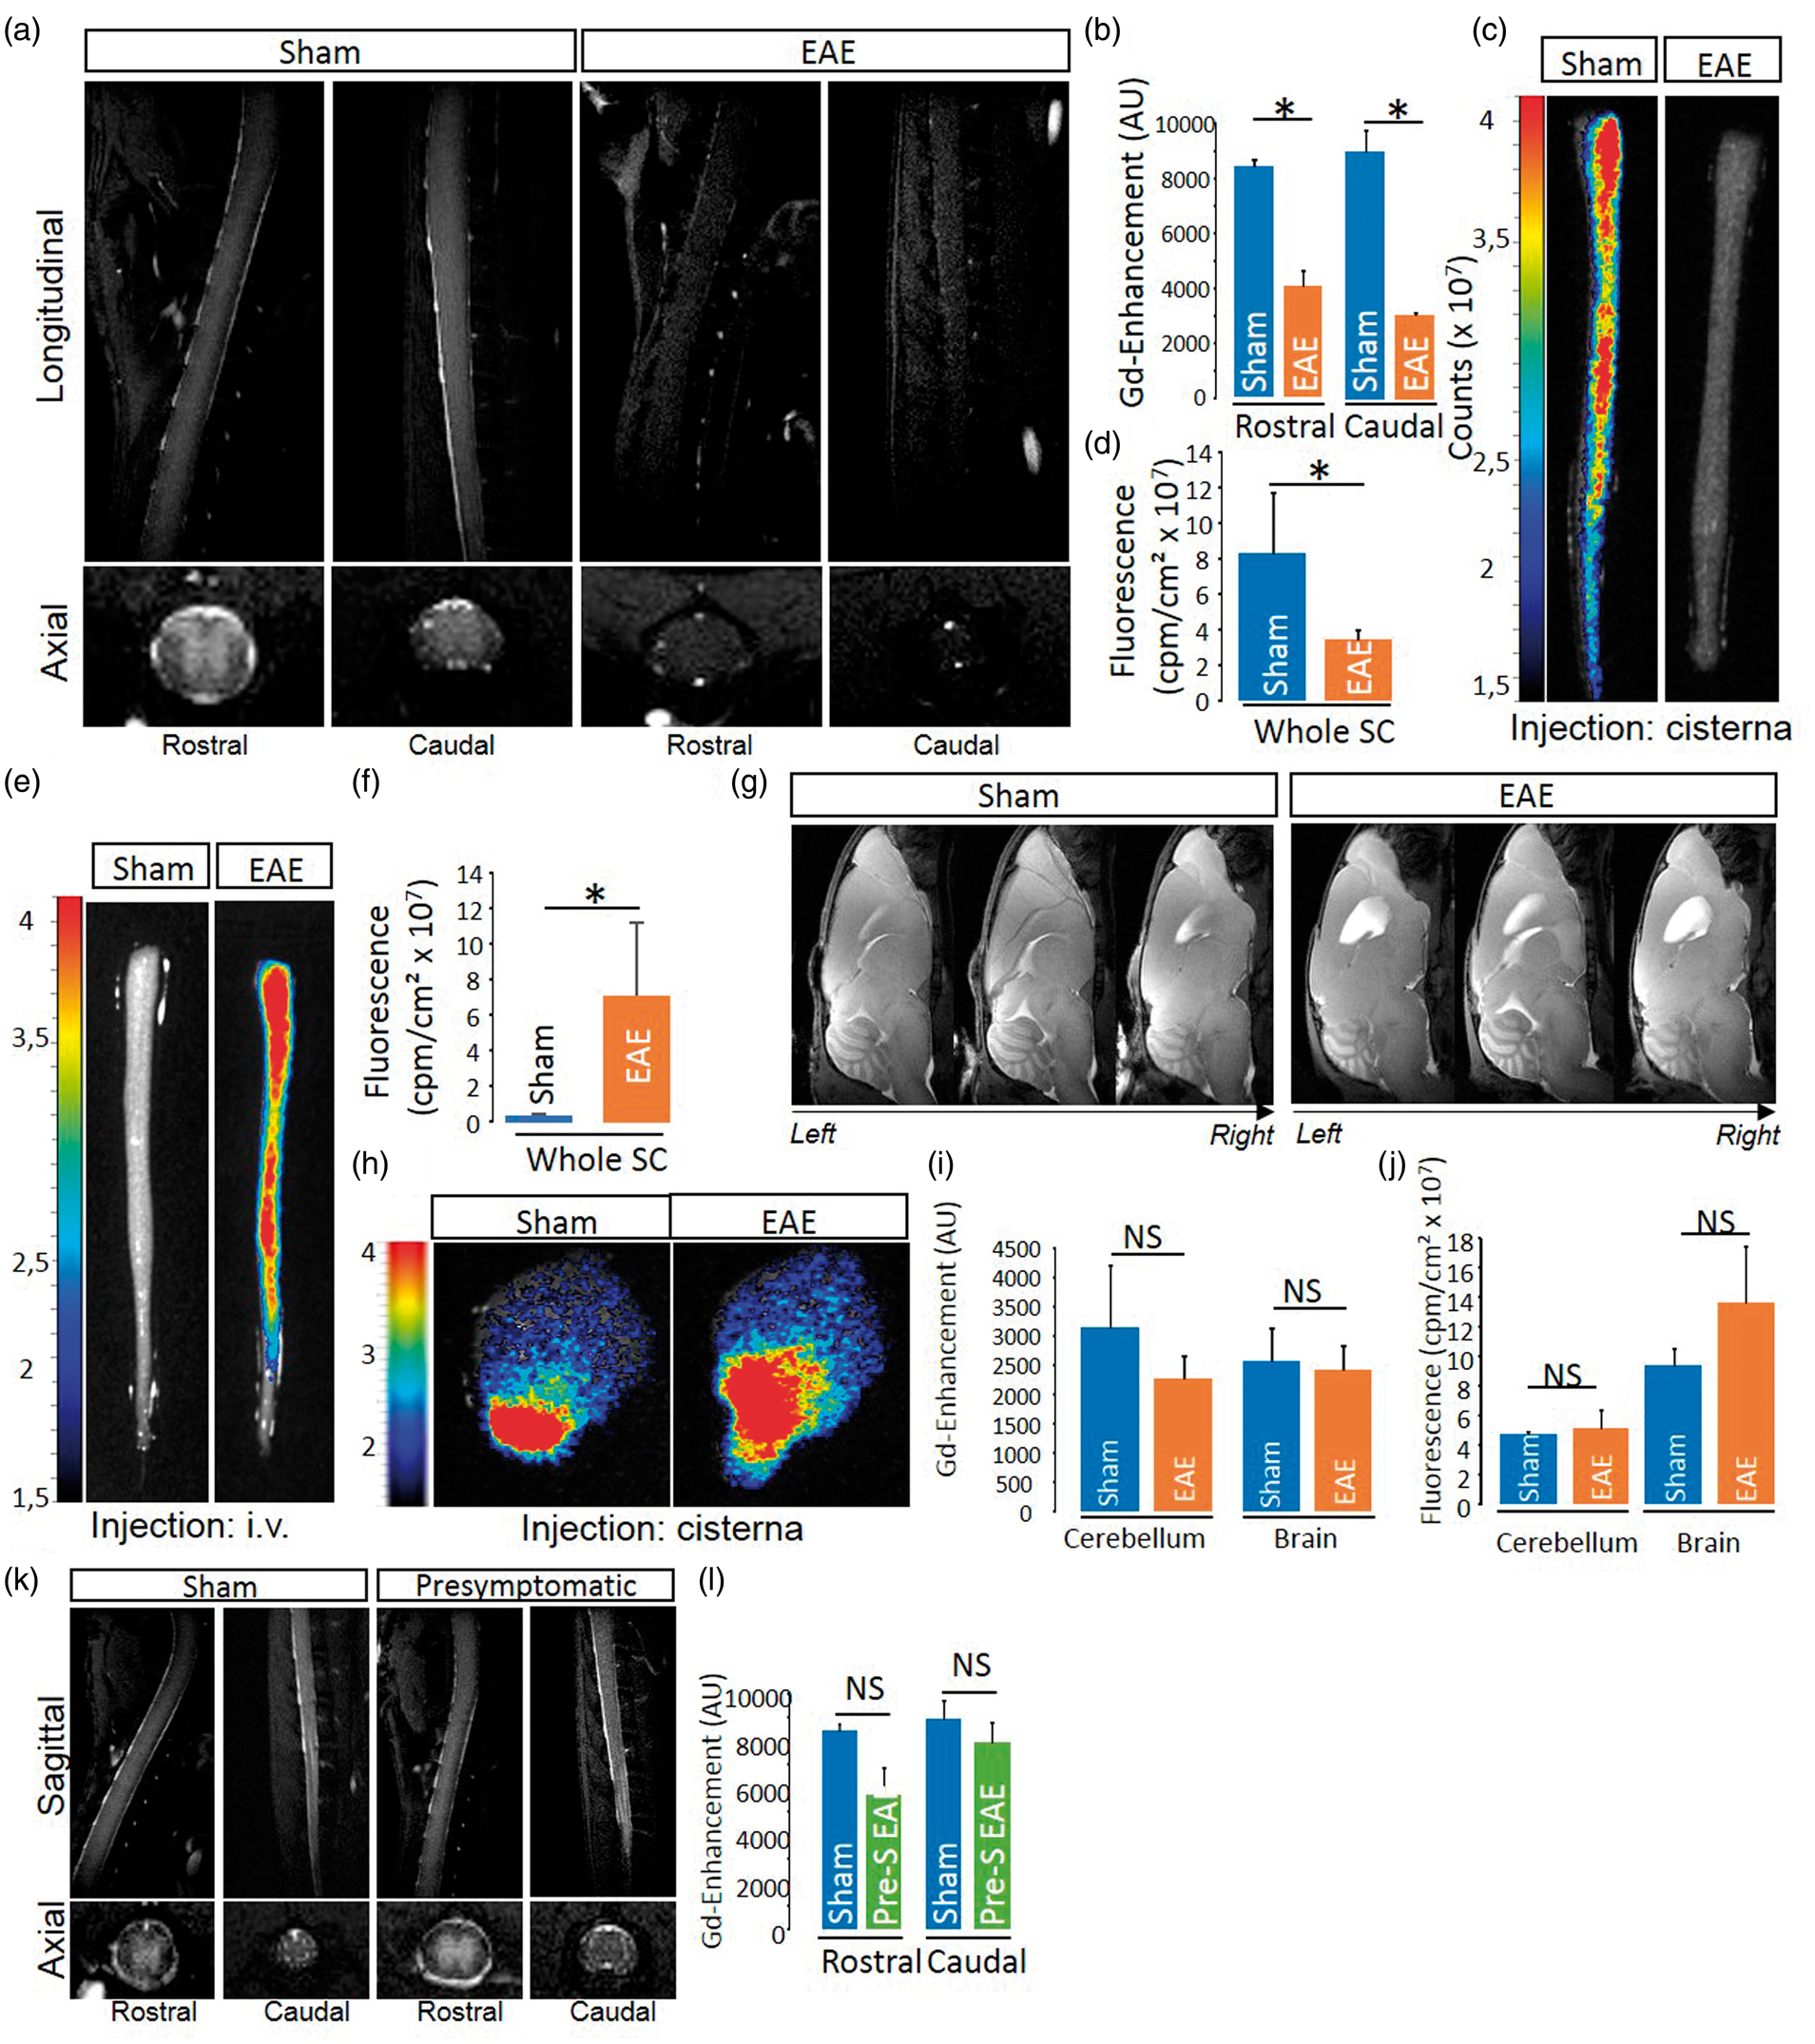
Delocalization of the water channel Aquaporin-4 (AQP4) from astrocyte end feet surrounding cerebral vessels was proposed to be associated to a modified CSF circulation.
19
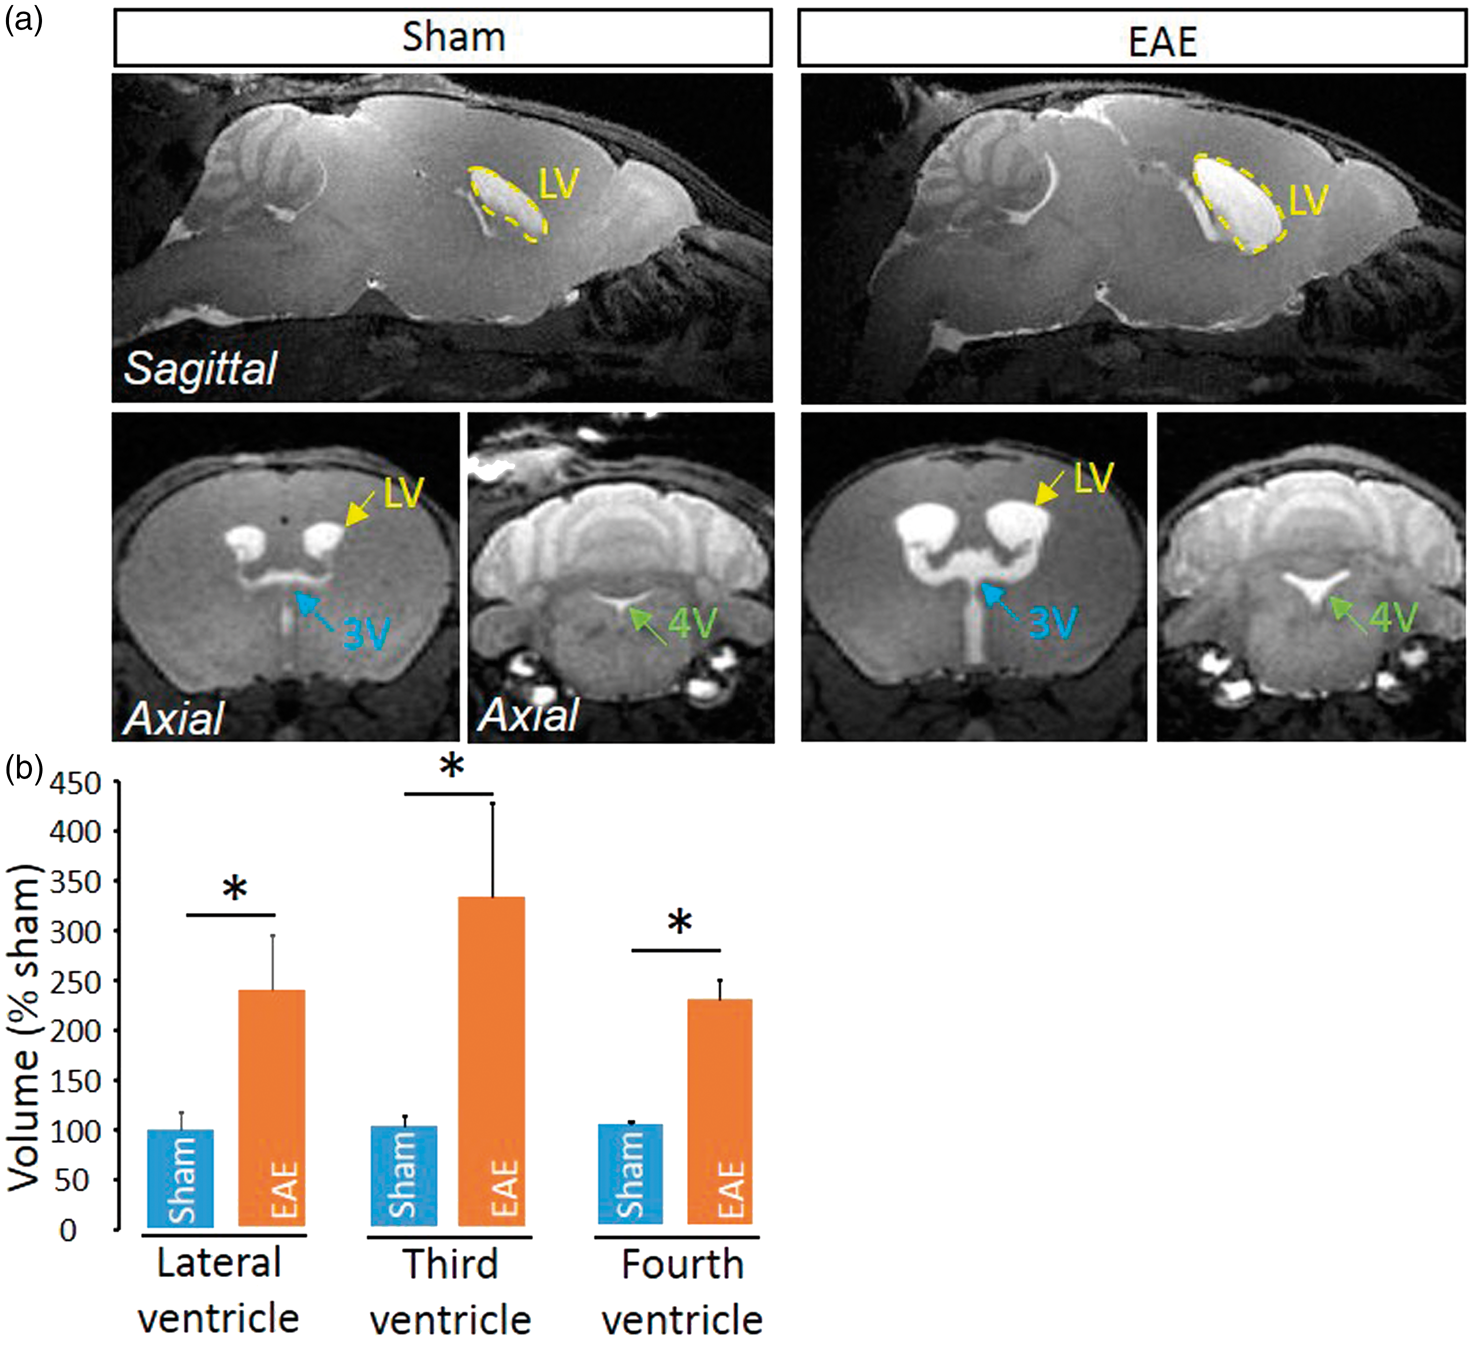
We show here that AQP4 expression is delocalized from a perivascular location to a widespread parenchymal expression in the spinal cord (Figure 3(a)), though not in the brain (Figure 3(b)). This delocalization was observed at the vicinity of perivascular infiltrates (Figure 3(c)) and was present only in late EAE lesions, but not in early lesions (Figure 3(c)). Interestingly, AQP4 delocalization was associated to the infiltration of inflammatory cells that invaded the space between the basal lamina and perivascular astrocyte end-feet (Figure 3(c) and corresponding quantification, Figure 3(d) and (e)). These cells were identified as lymphocytes (Figure 3(f)), which ability to cross the glia limitans is critical for the development of the disease.20,21 Finally, because the impairment of parenchymal CSF circulation may profoundly impair fluid drainage in the whole CNS, we investigated whether the ventricular size may be modified in EAE animals. Strikingly, ventricles (lateral, third and fourth ventricles) were twice larger in EAE animals as compared to sham animals (Figure 4).
Impairment of parenchymal CSF circulation is associated to perturbations of the perivascular area. (a) Representative immunohistological images of the AQP4 (green) distribution in EAE and sham spinal cord Red: collagen IV; Blue: cell nuclei. Scale bar = 10 µm. (b) Representative immunohistological images of the AQP4 (green) distribution in EAE and sham brain Red: collagen IV; Blue: cell nuclei. Scale bar = 10 µm. (c) Representative immunohistological images of the vessels of EAE mice at different stages of the disease and sham animals. White arrows: nuclei of infiltrated cells. LS: luminal side; PS: perivascular space. Green: AQP4, red: collagen IV; blue: cell nuclei. Scale bar = 10 µm. Quantification of (d) the number of infiltrated cells (n = 4–5; **P < 0.01) and (e) AQP4 staining intensity (n = 3–4; *P < 0.05) from images presented above. (f) Representative immunohistological images of CD4 + lymphocyte in the perivascular space in EAE animals. Red: collagen IV; magenta: AQP4; green: CD4; blue: cell nuclei. Scale bar = 10 µm. Enlargement of ventricles in EAE mice. (a) Axial T1-weighted brain images from EAE and sham mice at the level of the lateral ventricle (LV), third ventricle (3V) and fourth ventricle (4V). (b) Corresponding quantification of ventricle size (n = 4 /group; *P < 0.05).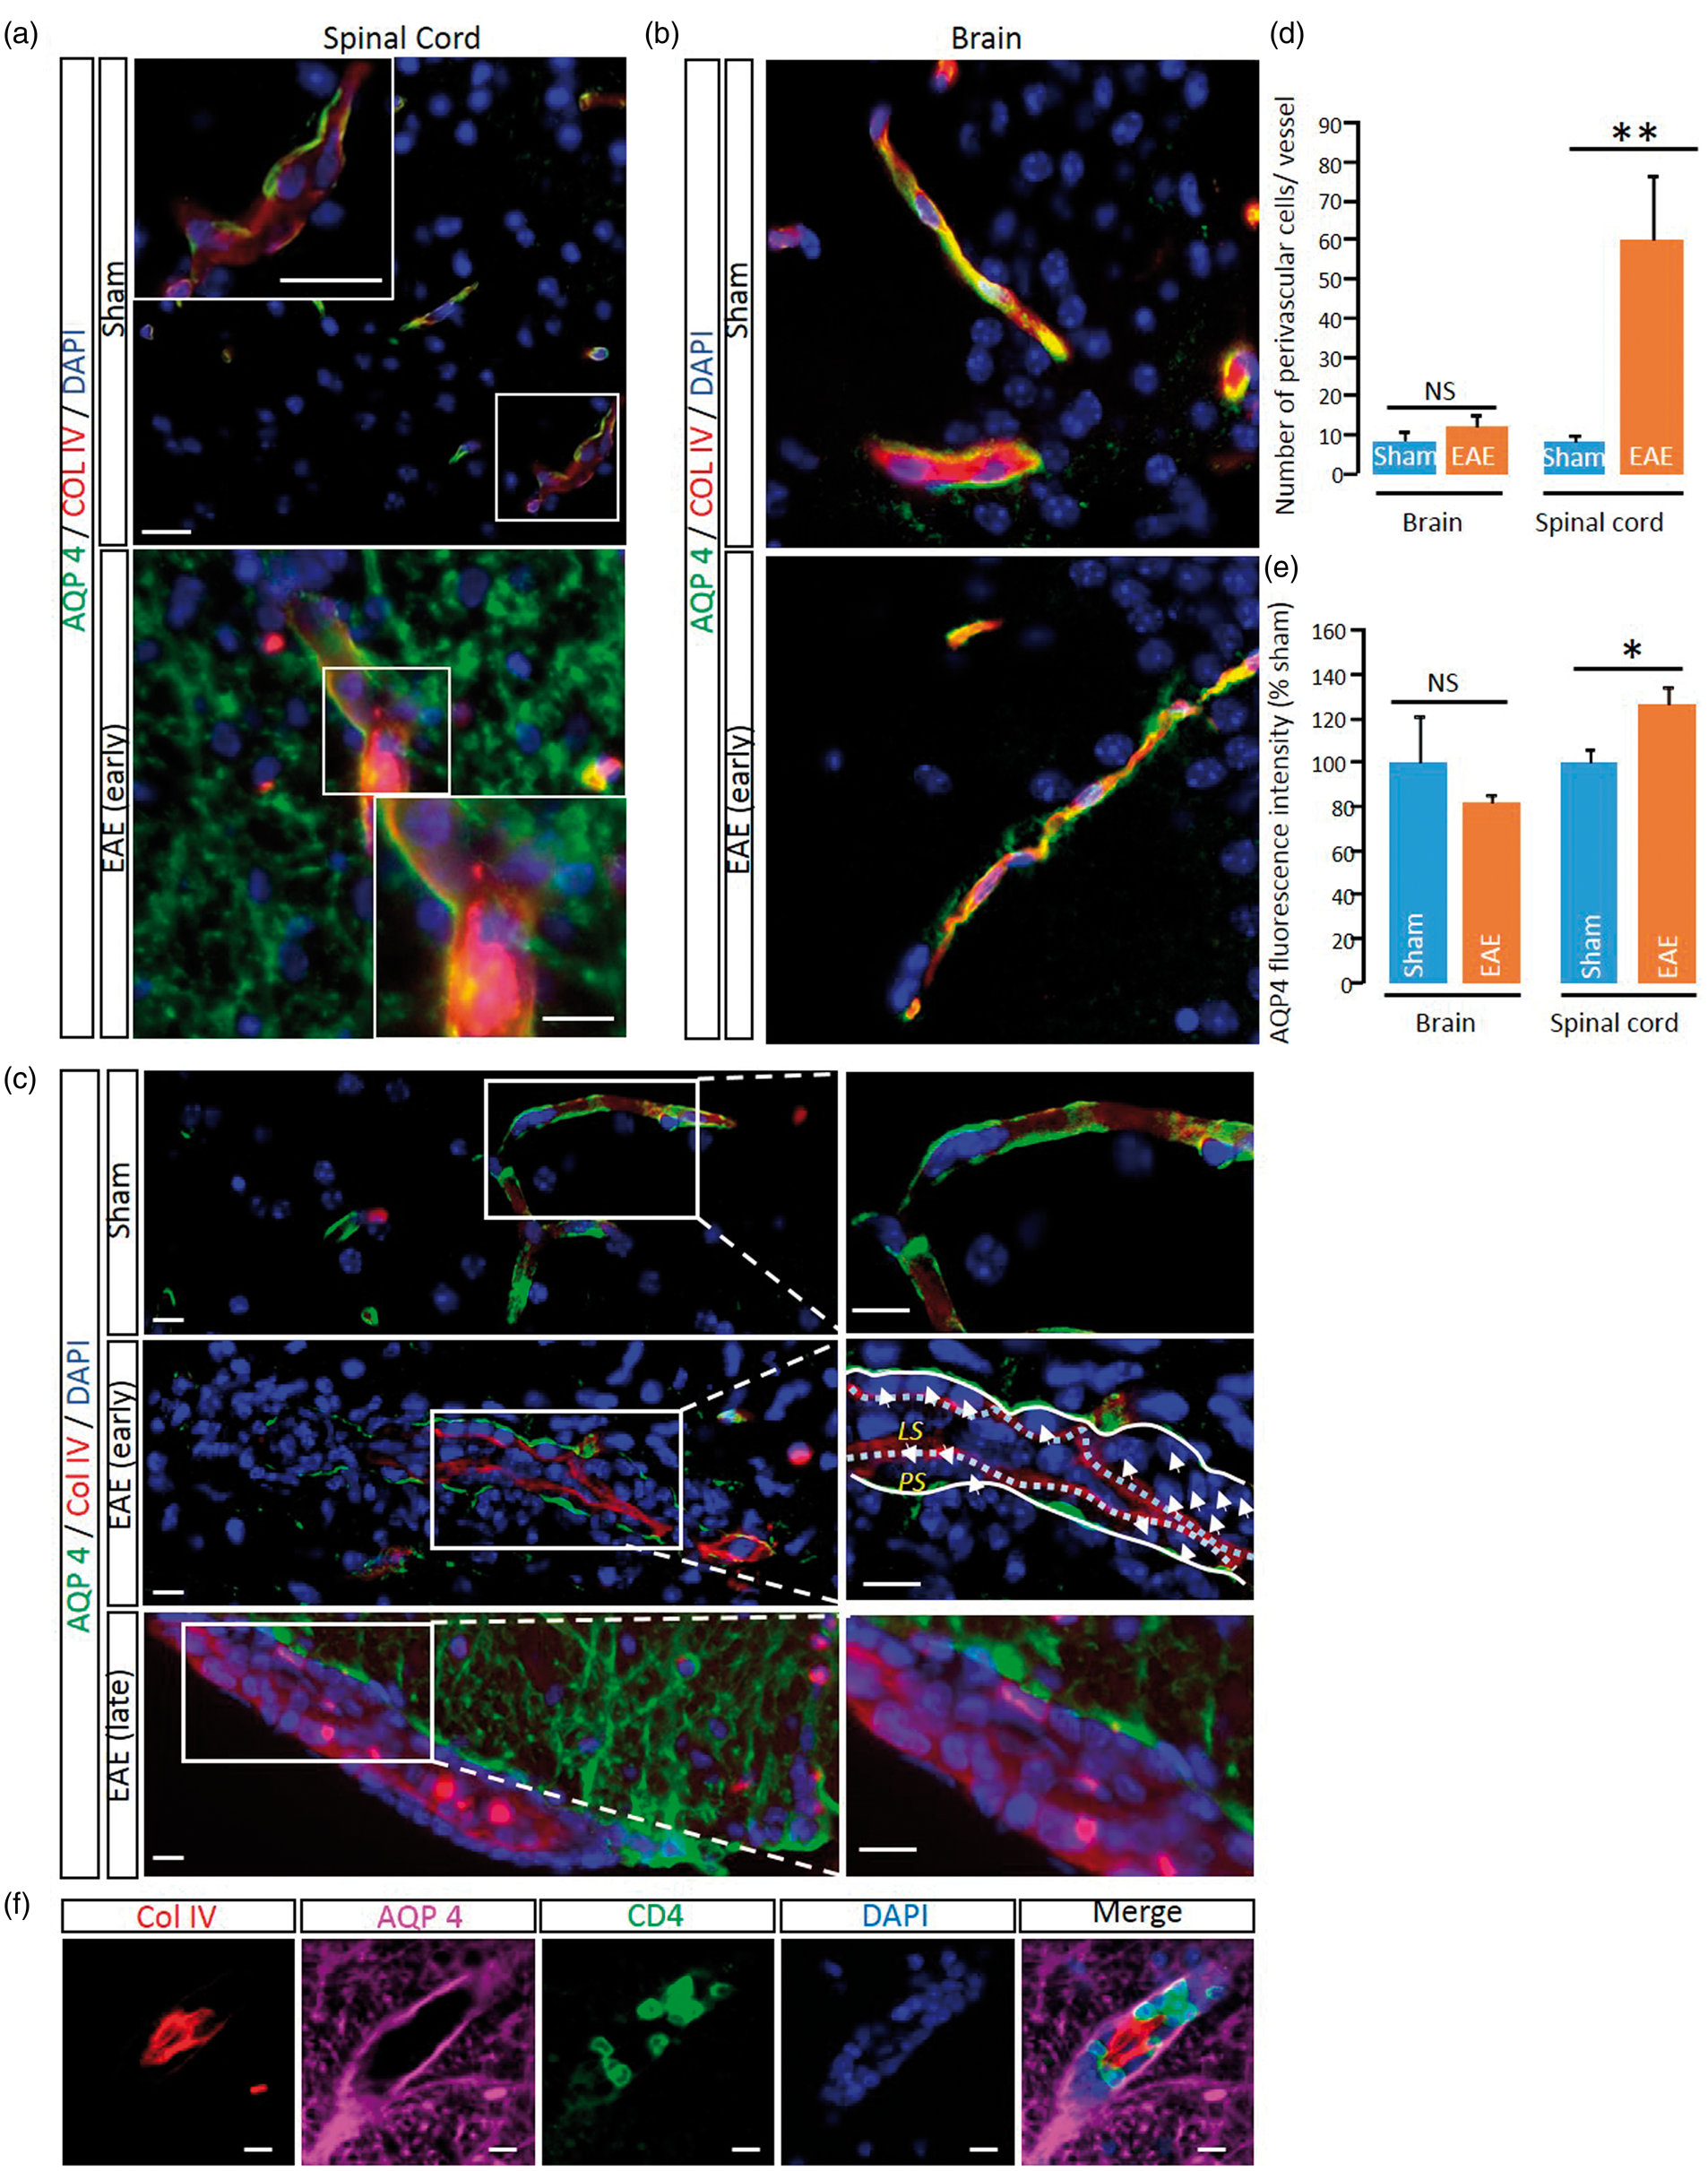
Discussion
The present work suggests that a parenchymal CSF circulation drives the clearance of solutes from the spinal cord parenchyma, as previously reported in the brain. 10 This can be postulated on the basis of experiments conducted earlier in the brain which reported, for instance, the clearance of intrastriatal injected radioactive tracers or Aβ peptide. 12
Our data show a reduction of tracer diffusion – which may be interpreted as a reduction of parenchymal CSF circulation – in the spinal cord parenchyma but not in the brain or cerebellum parenchyma. In addition, we report a delocalization of AQP4 restricted to the spinal cord. This is consistent with previous observations that inflammation in EAE triggers the spinal cord much more severely than the brain and the cerebellum. 16 Impairment of parenchymal CSF circulation thus appears to overlap hallmarks of neuroinflammation such as blood–brain/blood–spinal cord barrier, endothelial activation or leukocyte infiltration. 16 This suggests that detecting modifications of parenchymal CSF circulation could be used in the future for diagnostic and follow-up purposes in the management of human MS. The opportunity of this approach is reinforced by current investigations giving the basis for imaging parenchymal CSF circulation in human. 6
Beyond this, the fact that parenchymal CSF circulation impairment coincides in both space and time with leukocyte infiltration asks the question of the causal relationship between these two events. On the one hand, the dysfunction of the parenchymal CSF circulation could facilitate immune infiltration, which would make it a cause rather than a consequence of EAE. However, we did not observe any modification of this circulation in presymptomatic animals, which stands against an early involvement of parenchymal CSF circulation dysfunction in the onset of EAE. On the other hand, the dysfunction of parenchymal CSF circulation could result from immune infiltration, which would make it a consequence rather than a cause of EAE. We observe that infiltrated leukocyte invade the perivascular space delimited by astrocyte endfeet and the basal lamina, which is considered as a support for CSF circulation. 22 It is tempting to postulate that leukocytes infiltrated in this space interfere with CSF circulation and could thus participate in its impairment.
In addition to blocking the penetration of probes into the parenchyma of the spinal cord, EAE also leads to a reduction of their penetration into the subarachnoid space and to an enlargement of the ventricles in the brain. In a different context (kaolin-induced hydrocephalus), enlargement of ventricles is accompanied by a block of communication between the cisterna magna and the subarachnoid space. 23 However, this block results in a compensatory increase in CSF absorption of tracers in spinal cord tissues, rather than the decrease reported here. Thus, although we can postulate that a link exists between the enlargement of ventricles and the block of communication between the cisterna magna and the subarachnoid space, the latter can result in either increase or decrease of parenchymal CSF circulation, depending on the context. The mechanistic bases that explain these discrepancies should be investigated in future works.
A current debate exists on the involvement of astrocytic AQP4 in driving a convective CSF flux within the parenchyma.4,19 We thus considered important to assess the localization of AQP4 in the context of the present work. In the spinal cord of naïve animals, we show that AQP4 staining is found on astrocyte end feet and surrounds the vasculature in a manner comparable to what previously observed in the brain. 24 This localization gives structural characteristics compatible with the “glymphatic” system previously described in the brain. 17 In EAE, we report that AQP4 is delocalized from astrocyte end feet, as previously observed in the ageing 25 or degenerating 7 brain. Noteworthy, AQP4 delocalization was not observed in the brain or cerebellum, which matches the observation that the dysfunction of the parenchymal CSF circulation occurs preferentially in the spinal cord, and not in the brain. This delocalization coincides in space and time with impairment of parenchymal CSF circulation. Nevertheless, as for leukocyte infiltration, the causal relationship between these two events remains unclear. In the one hand, the dysfunction of parenchymal CSF circulation could result from AQP4 delocalization, as previously proposed in models of Alzheimer’s disease. 19 On the other hand, immune cell infiltration together with blood–spinal cord barrier dysfunction occurring during the early phases of EAE 16 could drive the detachment of astrocytic end-feet, thus leading to AQP4 translocation and dysfunction of the parenchymal CSF circulation.
Extracellular proteolysis, in particular via matrix metalloproteinase (MMPs) activity, has been shown in other contexts to cleave dystroglycan,26,27 which are responsible for the anchoring of the perivascular AQP4 pool. 28 In fact, in animal models of stroke, dystroglycan cleavage by MMP-9 induces a loss in AQP-4 polarization. 29 In the context of EAE, MMP-2 and MMP-9 are expressed by infiltrating leukocytes 30 and dystroglycans are cleaved where leukocyte infiltration occurs. 21 We can thus postulate that during EAE, infiltrating leukocyte would produce MMPs which would cleave dystroglycans, thus contributing to the loss of polarized anchorage of AQP4 and finally to its delocalization. Deciphering the mechanistic links between AQP4 polarization, blood–brain/blood–spinal cord barrier dysfunction, leukocyte infiltration and modulation of parenchymal CSF circulation is a great challenge for future research.
Footnotes
Funding
The author(s) disclosed receipt of the following financial support for the research, authorship, and/or publication of this article: This work was supported by the ARSEP foundation. APF receives a fellowship from the Conseil Régional de Normandie.
Declaration of conflicting interests
The author(s) declared no potential conflicts of interest with respect to the research, authorship, and/or publication of this article.
Authors’ contributions
AFP, MG, RM & FD have conceived and designed the study; AFP & AQ have acquired and analyzed the data; FD has written the manuscript and AFP, MG, DV & RM have drafted it.