
Abstract
Psychosocial stress is a risk factor for the development of depression. Recent evidence suggests that glial activation could contribute to the development of depressive-like behaviour. This study aimed to evaluate in vivo whether repeated social defeat (RSD) induces short- and long-term inflammatory and metabolic alterations in the brain through positron emission tomography (PET). Male Wistar rats (n = 40) were exposed to RSD by dominant Long-Evans rats on five consecutive days. Behavioural and biochemical alterations were assessed at baseline, day 5/6 and day 24/25 after the RSD protocol. Glial activation (11C-PK11195 PET) and changes in brain metabolism (18F-FDG PET) were evaluated on day 6, 11 and 25 (short-term), and at 3 and 6 months (long-term). Defeated rats showed transient depressive- and anxiety-like behaviour, increased corticosterone and brain IL-1β levels, as well as glial activation and brain hypometabolism in the first month after RSD. During the third- and six-month follow-up, no between-group differences in any investigated parameter were found. Therefore, non-invasive PET imaging demonstrated that RSD induces transient glial activation and reduces brain glucose metabolism in rats. These imaging findings were associated with stress-induced behavioural changes and support the hypothesis that neuroinflammation could be a contributing factor in the development of depression.
Keywords
Introduction
Major depressive disorder (MDD) is a highly prevalent mental disorder affecting approximately 350 million people worldwide. 1 Although MDD patients can benefit from treatment with antidepressants, over 30% of them are (at least partly) treatment-resistant. 2 It is likely that the lack of treatment efficacy arises from the gaps in our understanding of MDD etiology. 3
One of the risk factors for the development of MDD is exposure to psychosocial stress. Currently, it is estimated that 20–25% of individuals exposed to highly stressful events develop MDD.4,5 Notably, recent evidence suggests that (neuro)inflammatory processes may be involved in the physiopathology of MDD. 6 In this sense, it is possible that psychosocial stress and persistent immunological activation might contribute (either additively or in parallel) to treatment resistance to conventional antidepressants.4,7–11
Microglia and astrocytes are involved in the immunological response of the central nervous system. These cells are known to undergo a series of events, commonly known as “glial activation,” in response to brain disturbances such as neuronal damage or infection. These events include cell proliferation, morphological changes, increased expression of specific cell surface markers, production of cytokines and other inflammatory mediators. 12 Depending on the type of stimulus and its duration, microglia activation can be classified as acute or chronic. 13 Stress could be such a stimulus for glia activation. Glucocorticoids released as a consequence of psychosocial stress can bind to corticoid receptors on microglia and induce a shift towards a pro-inflammatory phenotype.14,15 Chronically activated microglia produce well-known pro-inflammatory cytokines 16 such as interleukin-6 (IL-6), interleukin-1β (IL-1β) and tumour necrosis factor-α (TNF-α), all of which can affect the hypothalamic-pituitary-adrenal (HPA) axis and alter central serotonin levels 17 and thus could ultimately trigger mood disorders. 18
Nowadays, a widely accepted biomarker for activated microglia and astrocytes is the translocator protein (TSPO). 19 Under normal conditions, TSPO expression is low, but the receptor is highly overexpressed upon activation by an inflammatory stimulus. Therefore, TSPO overexpression has been used as a glial activation biomarker, 20 measured noninvasively by means of positron emission tomography (PET) using 11C-PK11195 as the tracer. 21 At the same time, PET offers the possibility to image other (patho)physiological processes that are seemingly altered in MDD patients, such as brain glucose metabolism. 22 Glucose metabolism can be measured with the tracer 18F-FDG.
A growing body of preclinical evidence has implicated microglia activation in the neuroinflammatory response to psychosocial stress.23–26 Repeated social defeat (RSD) constitutes a model of psychosocial stress in rats with a high ethological validity. 27 RSD is able to induce adverse physiological, behavioural and neuronal deficits, which resemble certain core symptoms of depression.9,28 However, the effects of RSD on glial activation and brain metabolism have not been assessed in vivo and the long-term effects of RSD are largely unknown.
Therefore, the aim of this study was to longitudinally investigate the short- and long-term effects of psychosocial stress on the development of glial activation and brain metabolism in the RSD rat model of stress-induced depressive behaviour, using non-invasive PET imaging. To confirm the validity of the animal model, behavioural changes and corticosterone levels were assessed.
Materials and methods
Experimental animals
Male outbred Wistar Unilever rats (n = 40, 8 weeks, 261 ± 15 g; Harlan, Horst, The Netherlands) were randomly divided in two groups: control (n = 20) and social defeat (SoD, n = 20). Sample size was calculated based on previous studies using 11C-PK11195 PET for glial activation detection in rats.20,29 The rats were individually housed during the experiment and kept in humidity-controlled, thermo-regulated (21 ± 2℃) rooms under a 12:12-h light:dark cycle with lights on at 7 a.m. After experimental day 25, rats were housed in pairs for the six-month follow-up in order to prevent social isolation stress effects.30–32 Rats had ad libitum access to food and water, and were weighed every day.
Animal experiments were performed in accordance with the Dutch Experimental Animals Act (Wet op Dierenproeven; WoD) of 1977 and its later amendments. All procedures were approved by the Institutional Animal Care and Use Committee of the University of Groningen (Dier Experimenten Comissie – DEC), protocol DEC 6828A and 6828B, and are reported according to the ARRIVE guidelines. 33
Study design
The overall design of the study is depicted in detail in Figure 1. Wistar rats (SoD group) were subjected to RSD on day 0–4. Controls were handled similarly, but not exposed to aggressive residents. In each group, 10 rats were randomly selected for PET imaging and followed-up longitudinally with 11C-PK11195 and 18F-FDG on days−1, 6, 11 and 25 (same rats scanned with both tracers at all-time points). Behavioural assessments were performed on days −2, 5 and 24 (short-term follow-up). The previously scanned rats were re-evaluated after three and six months (long-term follow-up) in order to determine the persistence of behavioural alterations, glial activation and differences in brain metabolism. During the follow-up, the rats were weighed once a week.
Study design. (a) Short-term follow-up: SoD (n = 20) and control rats (n = 20) were subjected to repeated social defeat from day 0–4. Open field (OF) and sucrose preference test (SPT) were carried out at day −2 and day 5. The elevated plus maze (EPM) was conducted on day 5. The novel object recognition test (NOR) was performed on day 24. PET scans with 11C-PK11195 and 18F-FDG or sham scans were performed on day −1, 6, 11 and 25, with collection of serum samples for corticosterone (CORT) measurements on day −1 and 6. On day 25, 10 SoD and 10 control rats that underwent sham scans were terminated for brain collection and pro-inflammatory cytokines quantification. (b) Long-term follow-up: SoD (n = 10) and control (n = 10) rats were followed during six months after the cessation of RSD, with OF, SPT, EPM, NOR and PET scans being repeated after three and six months.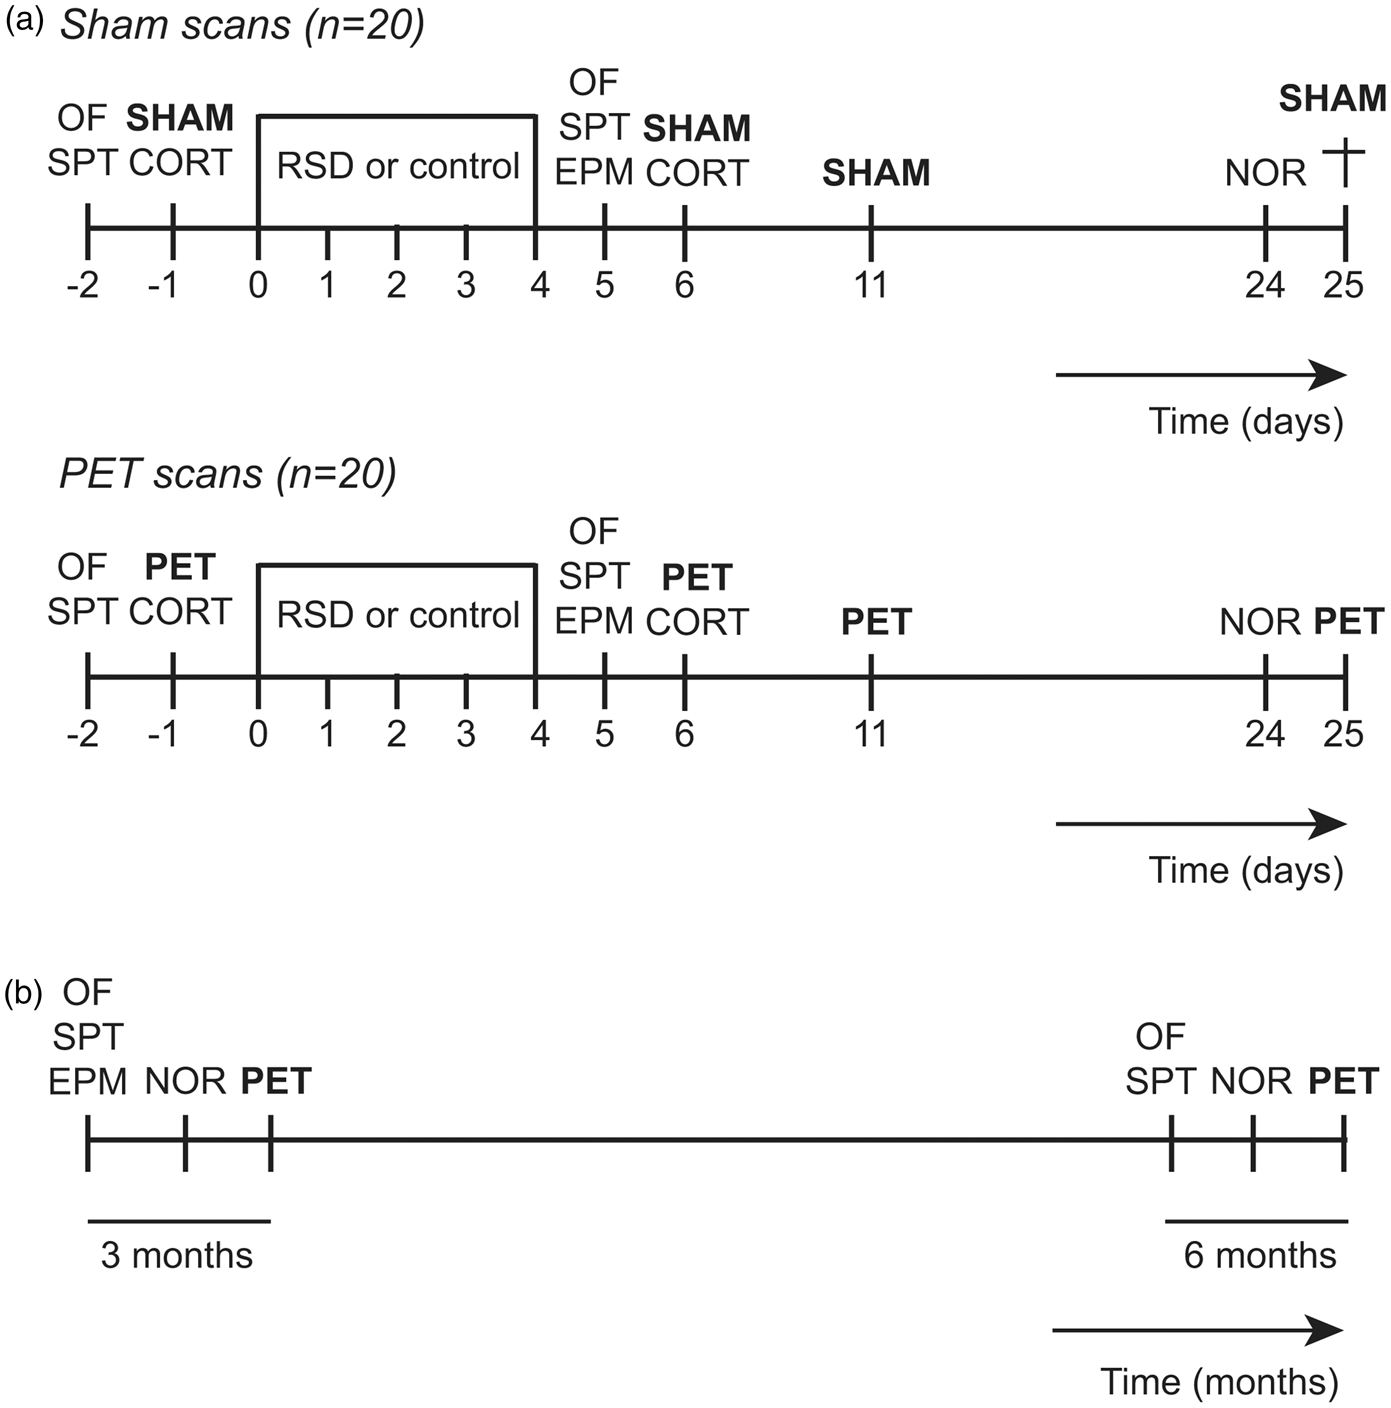
The remaining 10 rats per group were handled exactly the same, but were subjected to sham scans (anesthetized for the same period). On day 25, the rats that underwent sham scans were terminated and the brains were collected for the quantification of pro-inflammatory cytokines.
RSD
SoD rats were introduced into the cage of a dominant (resident) male outbred Long Evans rat (502 ± 36 g; Harlan, IN, USA). The male Long Evans rats were housed in a separate experimental room in large cages (80 × 50 × 40 cm) with a Long Evans female rat, with ligated oviducts, to stimulate territorial aggression. 27 The residents were trained and screened for aggressive behaviour at least three times prior to the experiment. 8 Only residents that attacked an intruder within 1 min were used for the actual social defeat experiment.
The RSD experiment always took place between 16:00 and 18:00 p.m. Prior to RSD, females were removed from the cage of the resident. The experimental rat (intruder) was placed in the cage of the resident and they were allowed to interact for a period of 10 min or shorter if the intruder assumed a supine (submissive) position for at least 3 s. After submission (or 10-min exposure), the intruder was placed inside a wire mesh cage to avoid further physical contact, but still allowing intense visual, auditory and olfactory interactions for a total exposure period of 60 min. The social defeat protocol was repeated on five consecutive days using different residents. Control rats were placed in a new clean cage without resident for 60 min on five consecutive days.
Body weight gain (g)
Body weight gain (g) was calculated for each rat as the difference between the body weight at a given time point minus the weight on experimental day 0 (first day of RSD).
Behavioural tests
Open field (OF), elevated plus maze (EPM) and novel object recognition (NOR) tests were recorded on video for further analysis using Ethovision XT8.5 software (Noldus Information Technology, Wageningen, The Netherlands).
Sucrose preference
The sucrose preference test (SPT) was used to assess anhedonia, a sign of depressive behavior. 8 Prior to the experiment, rats were habituated four times by exposure to a 1% sucrose solution for 1 h. At baseline and after five days of RSD, a bottle with water and one with 1% sucrose solution were randomly placed in the cage of the rat. The preference for sucrose was calculated as the total intake of sucrose solution divided by the total liquid intake and multiplied by 100%. 34
Open field
To investigate the effects of social defeat on explorative and anxiety-related behaviour, the rats were placed inside a square box (100 × 100 × 40 cm) for 10 min on day −2 and 5. The time spent in the centre of the arena relative to the time spent at the borders (a proxy measurement for anxiety), and the total distance moved (locomotor and explorative activity) were documented.
Elevated plus-maze
A standard elevated plus-maze (EPM) with 52 cm arms extending from a 9 × 9 cm central area, 62 cm above the floor, was used to assess anxiety-like behaviour on day 5 and month 3. 35 Each session of 5 min was started by placing the rat in the central area facing the closed arms of the maze. 36 The percentage of time spent in the open and closed arms, and in the centre was measured. The EPM could not be applied in the six-month follow-up since the size of the animals impeded their mobility in the apparatus.
Novel object recognition
A NOR test was performed to evaluate visual memory 37 and the long-lasting memory impairment induced by RSD on day 24, month 3 and 6. 38 Rats were placed in a square box (50 × 50 × 40 cm) with two identical objects (plastic bottles or Lego cubes). 39 They were allowed to explore the objects for 3 min. The objects were removed and after 2 h, one familiar and one new object were presented to the rat for 3 min. The preference index (PI) was calculated as the ratio between time spent on exploring the new object and the total time spent on object exploration. 40
Corticosterone levels
For corticosterone quantification, rats were anesthetized with isoflurane mixed with medical air and 0.5 mL of whole blood was quickly collected from the tail vein on day −1 and 6. Samples were always collected at 10 a.m. The whole blood was allowed to cloth for 15 min and centrifuged at 6000 r/min (3.5 g) for 8 min at room temperature to obtain serum samples. Samples were stored at −20℃ until further analysis by radioimmunoassay. Corticosterone (Sigma Chemical Co., MO, USA.) was used as standard and 3H-corticosterone as tracer (Perkin & Elmer, MA, USA). The sensitivity of the assay was 3 nM. The intra- and inter-assay variations were 6% and 9.6%, respectively.
PET imaging
PET scans were performed using a small animal PET scanner (Focus 220, Siemens Medical Solutions, USA). Both 11C-PK11195 and 18F-FDG PET scans were performed on the same day for each investigated time point. 11C-PK11195 PET scans were always carried out in the morning (between 10:00 and 11:00 a.m.). For the procedure, rats were anesthetized with isoflurane mixed with medical air (5% for induction, 2% for maintenance) and 11C-PK11195 was injected via the penile vein (66 ± 29 MBq, 1.4 ± 2.3 nmol). Immediately after injection, rats were allowed to wake up and recover in their home cage. 18F-FDG PET scans were carried out in the afternoon (between 15:00 and 16:00 p.m.), respecting an interval of at least 10 half-lives (t 1/2) of 11C isotope decay. Rats were deprived from food for 4–6 h, injected intraperitoneally21,41 with 18F-FDG (31 ± 8 MBq), and returned to their home cage afterwards. For both 11C-PK11195 and 18F-FDG PET, rats were anesthetized 45 min after tracer injection and placed in prone position into the camera with the head in the field of view. A 30-min static scan was acquired, the body temperature was maintained at 37℃ with heating pads, heart rate and blood oxygen saturation was monitored, and eye salve was applied to prevent conjunctival dehydration. A transmission scan was obtained using a 57 Co point source for attenuation and scatter correction.
PET scans were iteratively reconstructed (OSEM2D, 4 iterations and 16 subsets) into a single frame after being normalized and corrected for attenuation and decay of radioactivity. Images with a 128 × 128 × 95 matrix, a pixel width of 0.632 mm, and a slice thickness of 0.762 mm were obtained. PET images were automatically co-registered to a functional 11C-PK11195 or 18F-FDG rat brain template, 42 which was spatially aligned with a stereotaxic T2-weighted MRI template in Paxinos space 43 using VINCI 4.26 software (Max Planck Institute for Metabolism Research, Germany). Aligned images were resliced into cubic voxels (0.2 mm) and converted into standardized uptake value (SUV) images: SUV = [tissue activity concentration (MBq/g) × body weight (g)]/[injected dose (MBq)], assuming a tissue density of 1 g/ml. 18F-FDG uptake was not corrected for blood glucose levels.21,44
Tracer uptake was calculated in several predefined volumes-of-interest (VOI). VOIs were selected based on previous findings,22,23,45–51 taking the size of the brain regions into consideration. Due to the limited resolution of the small animal PET scanner (1.4 mm), 52 small brain regions were excluded to minimize partial volume effects. 53 Therefore, the investigated regions were the amygdala/piriform complex, brainstem, cerebellum, cingulate cortex, entorhinal cortex, frontal association cortex, hippocampus, hypothalamus, insular cortex, medial prefrontal cortex, motor/somatosensory cortex, orbitofrontal cortex and striatum.
Enzyme-linked immunoassay for pro-inflammatory cytokines in the brain
On day 25, rats were terminated under deep anaesthesia by transcardial perfusion with phosphate-buffered saline pH 7.4. Brains were collected and rapidly frozen and stored at −80℃. Frontal cortex, hippocampus, cerebellum and parietal/temporal/occipital cortex were dissected and prepared as published. 39 Pro-inflammatory cytokines IL-6, TNF-α (Biolegend, San Diego, USA) and IL-1β (Thermo Scientific, Rockford, USA) concentrations were determined by ELISA according to the manufacturer’s instructions. Total protein concentration in the brain areas was quantified through Bradford Assay and the cytokine levels corrected for the amount of protein after measurement. 54
Statistical analysis
Statistical analyses were performed with the SPSS software (IBM Corp. Released 2013. IBM SPSS Statistics for Windows, Version 22.0. Armonk, NY). Continuous data are expressed as mean ± standard error of the mean (SEM). Data expressed as percentage were square root arcsine transformed prior to statistical analysis.55,56 Differences in variables from behavioural and biochemical tests were tested through a two-sided paired or independent samples t-test and the effect size of the differences between groups was calculated through Cohen’s d.57,58 The generalized estimating equations (GEE) model 59 was used to account for repeated measurements in the longitudinal design and missing data in body weight and PET measurements. For the statistical model of the body weight gain, “group,” “day of measurement” and the interaction “group × day of measurement” were included as variables. The GEE model for 11C-PK11195 and 18F-FDG uptake (SUV) was applied individually for each brain region, including the variables “group,” “day of scan” and the interaction “group × day of scan” in the model. The data were further explored through pairwise comparison of “group × day of scan” in each brain region for all scan time points combined. The AR(1) working correlation matrix was selected according to the quasi-likelihood under the independence model information criterion value. Wald’s statistics and associated p-values were considered statistically significant at p < 0.05. A Bonferroni-Holm correction was used to adjust significance levels for multiple comparisons. 60
Results
As a consequence of methodological issues, two control rats did not survive a PET scan and a humane endpoint was applied to one rat due to a lethal wound during the RSD protocol.
RSD reduced bodyweight gain, normalizing only after five weeks
The bodyweight of the rats was measured daily until day 25 and weekly thereafter. No significant differences in bodyweight between groups were found before the start of RSD (control: 266 ± 19 g, and SoD: 261 ± 18 g, p = 0.44). For the first 25 days, a significant main effect was found for the factors group (p < 0.001) and day of measurement (p < 0.001), and for the interaction group × day of measurement (p < 0.001), showing that RSD significantly reduced bodyweight gain. More specifically, the reduction in bodyweight gain was already apparent on experimental day 2 (control: 8.8 ± 1.4 g vs. SoD: 4.2 ± 1.3 g, p = 0.01), with no recovery to control levels until day 25 (control: 100.9 ± 3.9 g vs. SoD: 80.8 ± 2.8 g, p < 0.001). When comparing the bodyweight gain from 5 weeks after the RSD until week 28 (six months), there was a statistically significant main effect on day of measurement (p < 0.001), and in the interaction day of measurement × group (p < 0.001), but no difference was found between groups (Supplementary Figure 1).
RSD provoked acute anxiety-like and depressive-like behaviour without cognition impairment
Behavioural tests were performed at baseline and at several time-points after RSD. Social defeat caused a reduced preference for sucrose (Figure 2(a)). At baseline, rats had a 96 ± 1% preference for sucrose, whereas after the RSD (day 5), the preference decreased to 74 ± 4% (p < 0.001, d = 1.1). At the third- and six-month follow-up, the sucrose preference of the SoD group was restored to the baseline value (Figure 2(b)). The sucrose preference of the control group remained constant over time.
RSD-induced behavioral alterations in SoD rats in the short-term follow-up. (a) Anhedonic-like behavior was demonstrated in SoD rats through a within-group comparison of the sucrose preference test (SPT) on baseline and day 5, ###p < 0.001. (b) No differences in SPT of control and SoD rats on the third- and six-month follow-up. Anxiety-like behavior was demonstrated in SoD rats in the open field test (OF) through (c) decreased distance moved on day 5 as compared to control rats, ***p < 0.001 and (d) decreased total time spent in the centre of the arena, ***p < 0.001. In the third- and six-month follow-up, (e) no differences were found in distance moved or (f) time spent in the centre of the OF arena between groups. The elevated plus maze (EPM) confirmed the anxiety behavior of SoD rats on day 5, with (g) decreased the percentage of time spent in the open arms (OA), *p < 0.05, and increased the percentage of time spent in the closed arms (CA), *p < 0.05. No differences were found regarding the percentage of time spent in the centre (C). (h) In the three-month evaluation, no differences were found in the percentage of time spent in the OA, CA or C between groups. RSD did not affect cognition, measured through the novel object recognition (NOR) test and expressed as percentage of preference index (PI). (i) No between-group difference on PI was found on day 24. (j) PI was not significantly different between groups on the third- and six-month follow-up.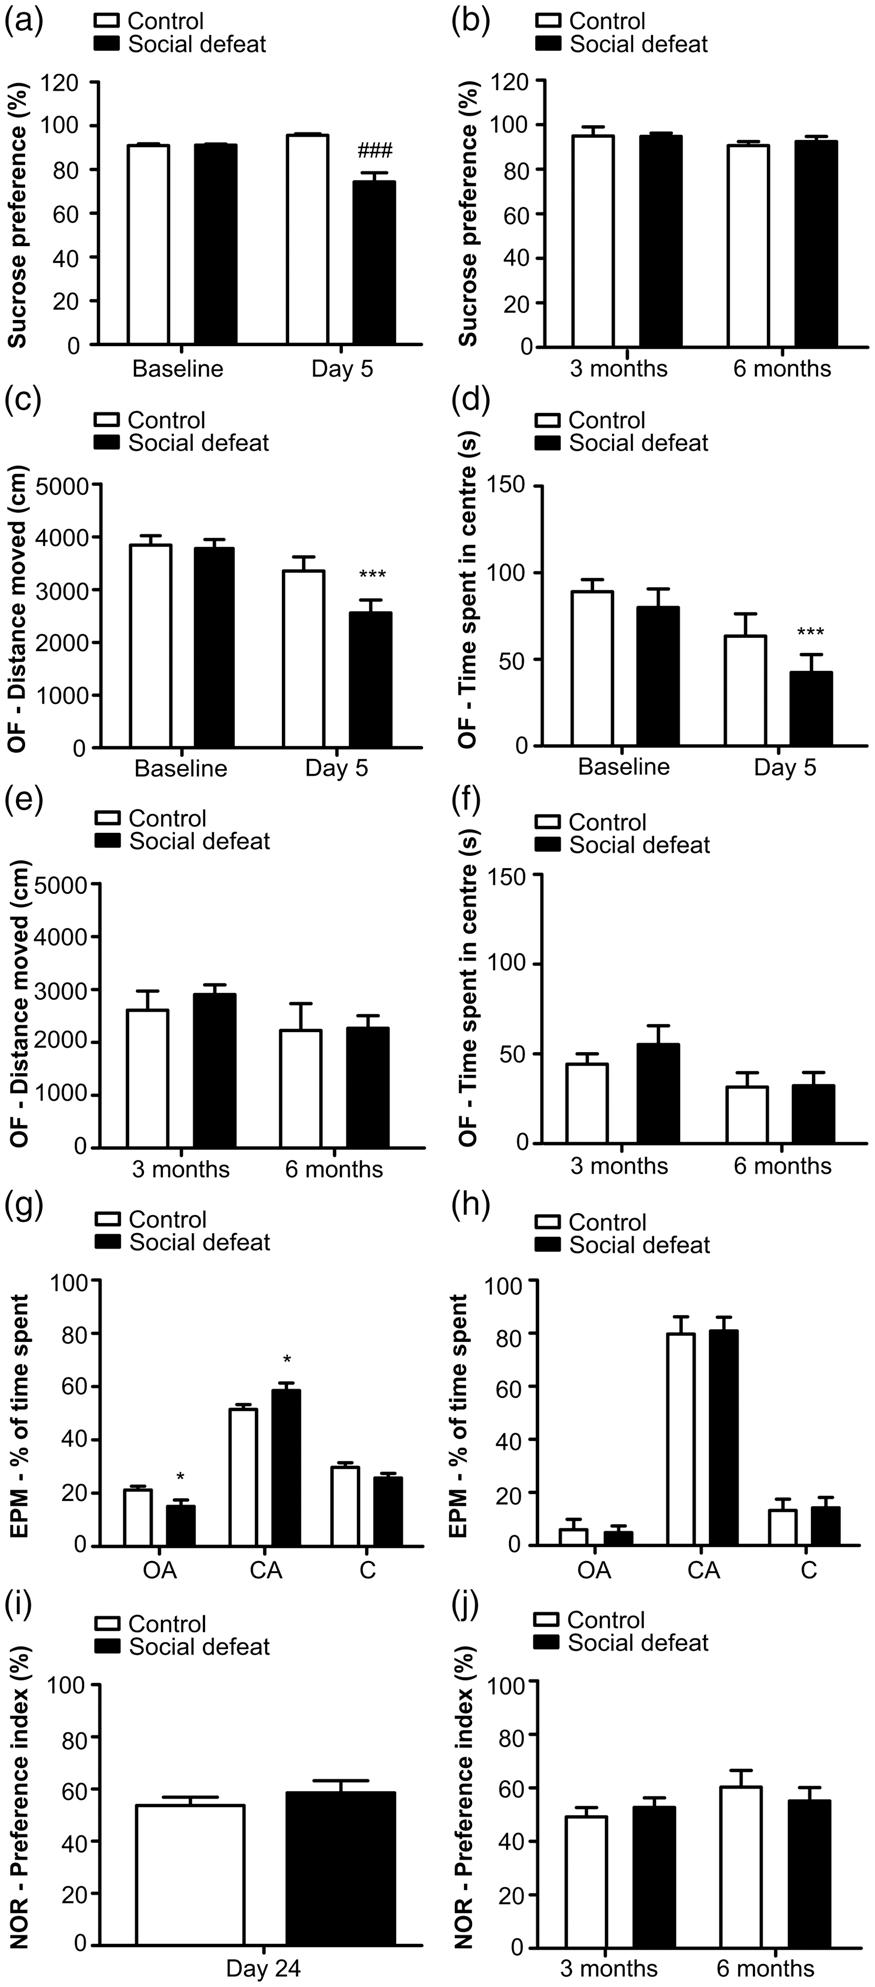
The anxiety-like behaviour and explorative activity were investigated at baseline and immediately after the RSD protocol (day 5), using the OF. No significant differences between groups were found at baseline for distance moved (control: 3.8 ± 0.2 m vs. SoD: 3.8 ± 0.2 m, p = 0.83, d = 0.01) and time spent in the centre of the arena (control: 89 ± 7 s vs. SoD: 80 ± 7 s, p = 0.49, d = 0.2). On day 5, rats exposed to RSD demonstrated anxiety-like behaviour through decreased exploration (control: 3.4 ± 0.3 m vs. SoD: 2.6 ± 0.2 m, p < 0.001, d = 0.7) and a diminished time spent in the centre of the arena (control: 63 ± 13 s vs. SoD: 42 ± 10 s, p < 0.001, d = 0.5) when compared to controls (Figure 2(c) and (d)). At three and six months after RSD, the anxiety-like behaviour of SoD rats had normalized, as the OF test did not reveal any significant difference between groups (Figure 2(e) and (f)).
Anxiety-like behaviour was additionally assessed with the EPM. On day 5, rats in the SoD group spent a significantly lower percentage of time in the open arms (control: 14 ± 2% vs. SD: 9 ± 2%, p < 0.05, d = 0.6) and a higher percentage of time in the closed arms (control: 61 ± 3% vs. SD: 71 ± 4%, p < 0.05, d = 0.7) as compared to controls, showing that rats exposed to RSD were more anxious. No significant difference between groups in time spent in the centre was found (control: 25 ± 2% vs. SoD: 20 ± 2%, p = 0.114, d = 0.6; Figure 1(g)). No significant difference between groups was observed anymore at month 3 (Figure 2(h)).
To assess whether RSD had long-lasting effects on memory, the NOR test was performed on day 24, month 3 and 6. No significant differences were found between groups (Figure 2(i) and (j)).
Serum corticosterone increased significantly in response to social defeat
Serum concentrations of corticosterone were measured before (day −1) and after RSD (day 6). No significant differences were found between groups on day −1 (ctrl: 235 ± 45 nmol/L vs. SoD: 186 ± 43 nmol/L, p = 0.44). Socially defeated rats had significantly increased corticosterone levels after the RSD (day −1: 186 ± 43 nmol/L vs. day 6: 560 ± 114 nmol/L, p < 0.01, d = 1.00), whereas corticosterone levels in control rats were not affected (day −1: 235 ± 45 nmol/L vs. day 6: 207 ± 40 nmol/L, p = 0.675, d = 0.1).
Stress-induced glial activation was detected at short-term follow-up after RSD but not at long-term
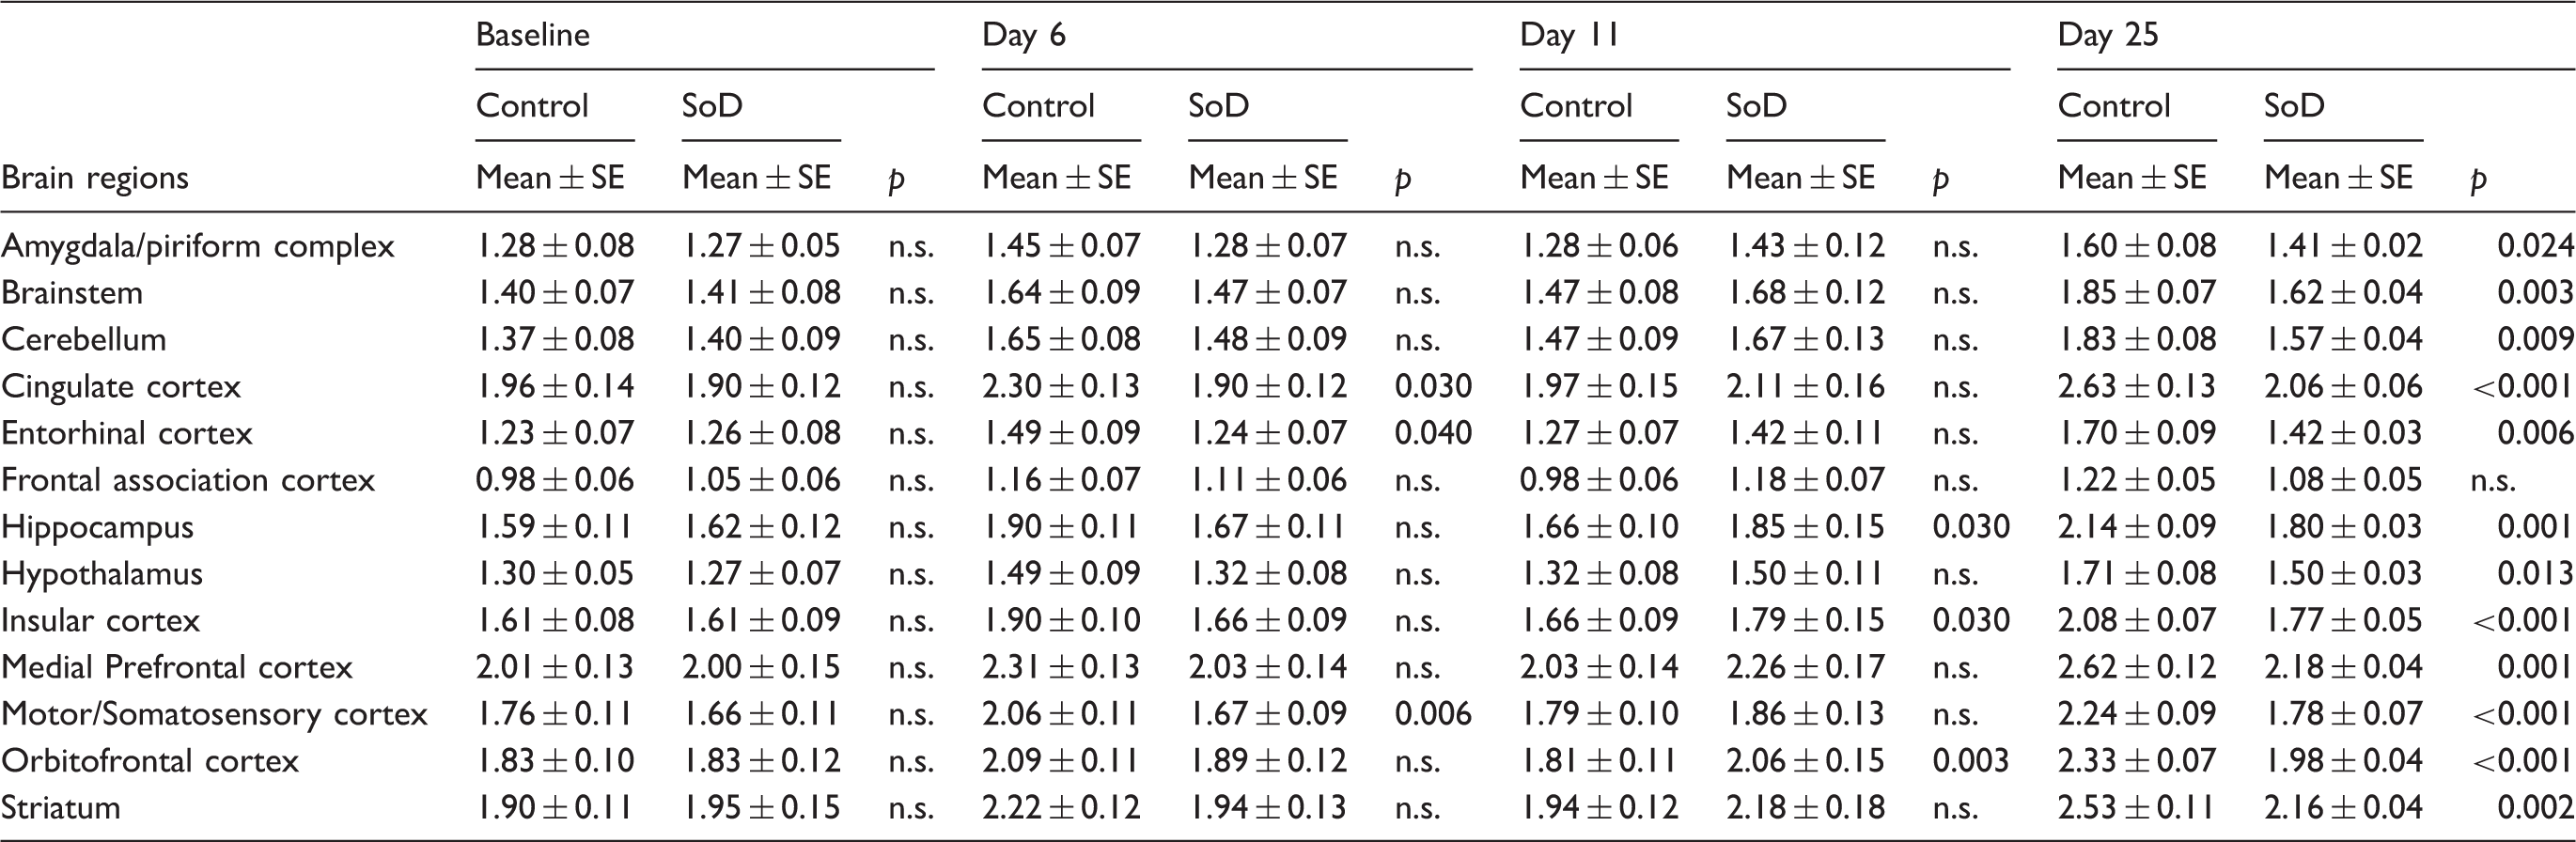
11C-PK11195 SUV values of the short-term follow-up for individual brain regions of control (n = 8) and SoD (n = 9) rats at baseline, day 6, 11 and 25.
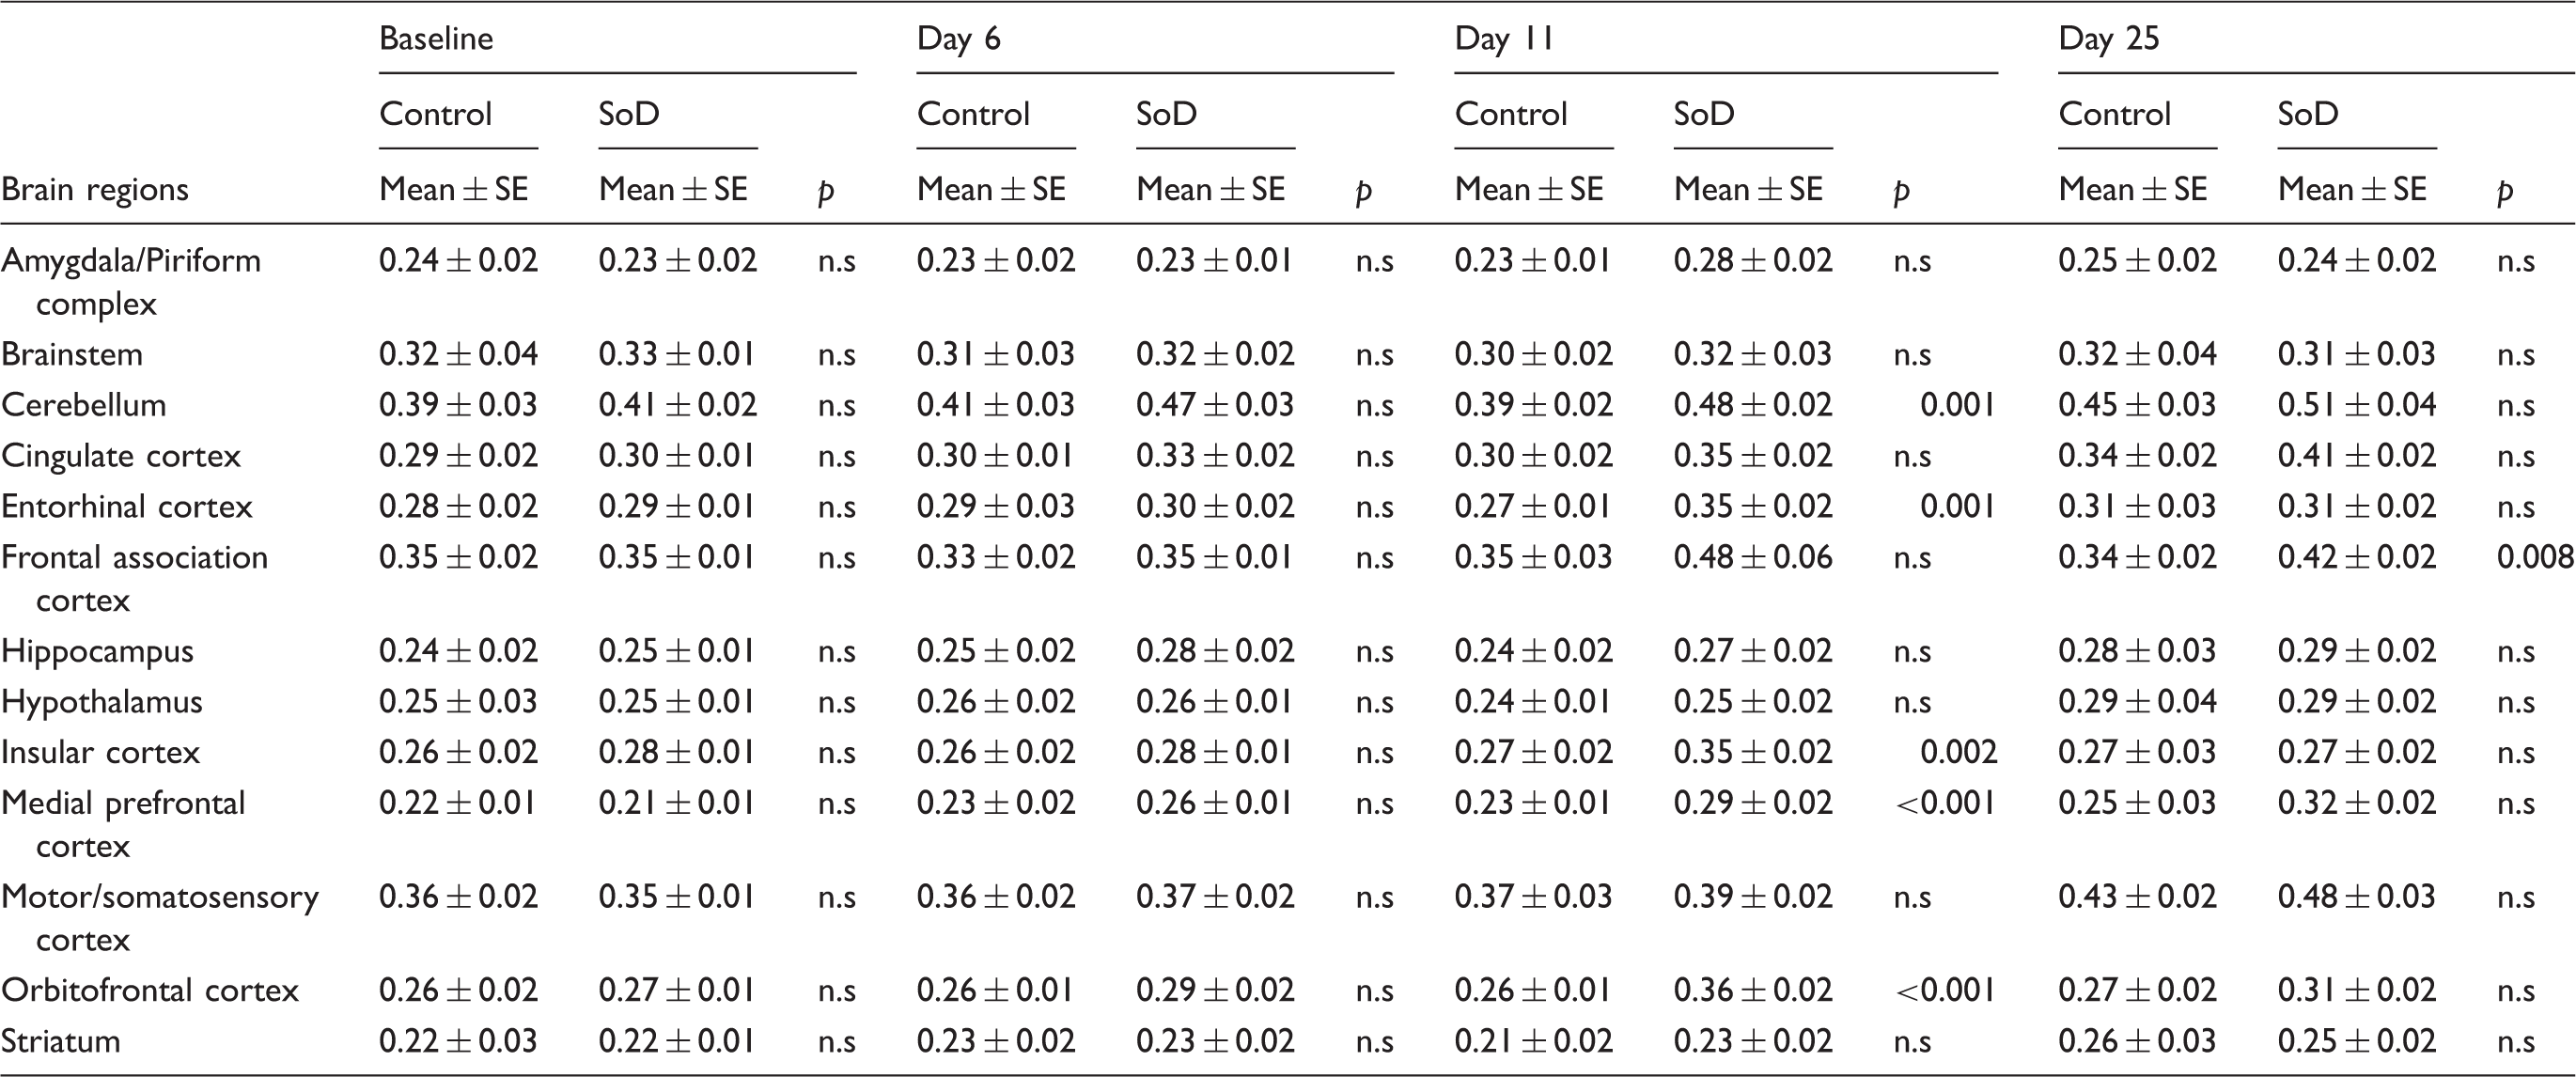
SoD: social defeat; SUV: standardized uptake value.
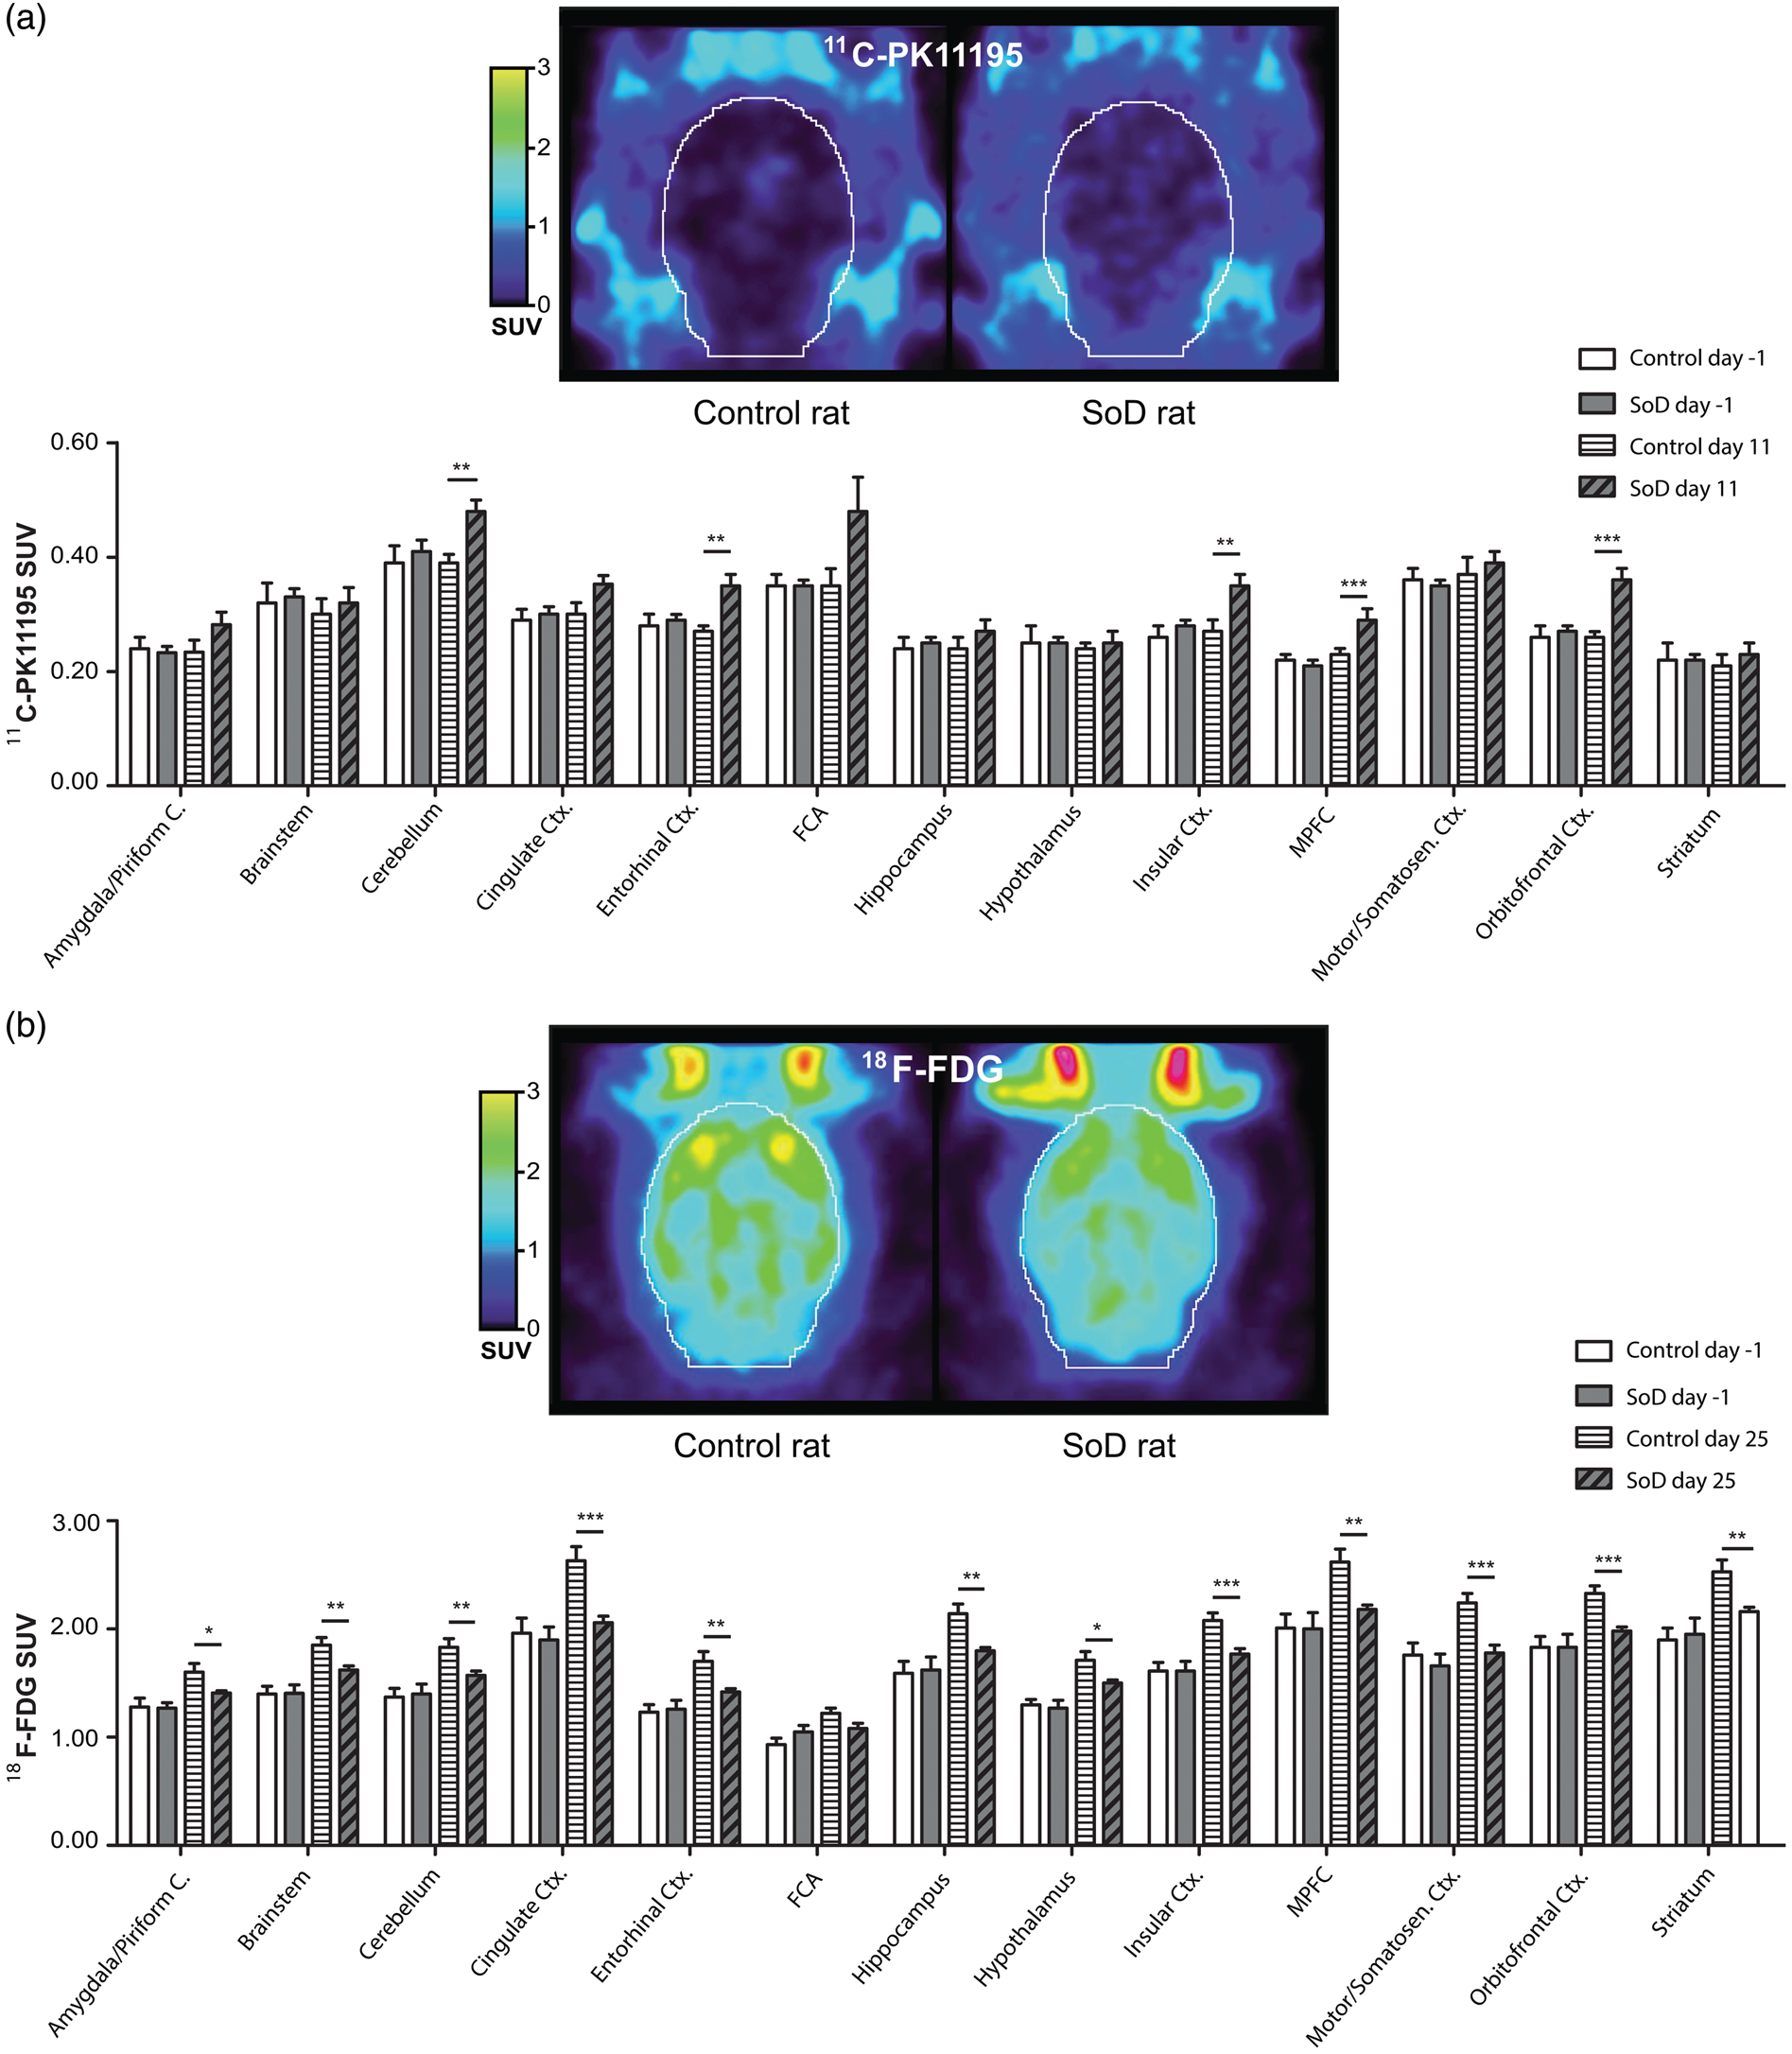
(a) 11C-PK11195 PET scan of a representative control and defeated rat on experimental day 11, followed by a graphical representation of 11C-PK11195 SUV on baseline and day 11. *p < 0.05, **p < 0.01 and ***p < 0.001. (b) 18F-FDG PET scan of a representative control and defeated rat on experimental day 25, followed by a graphical representation of 18F-FDG SUV on baseline and day 25. *p < 0.05, **p < 0.01 and ***p < 0.001.
Effect of time in 11C-PK11195 uptake values in control (n = 8) and SoD (n = 9) rats during the long-term follow-up (three and six months) for individual brain regions as compared to baseline uptake levels.
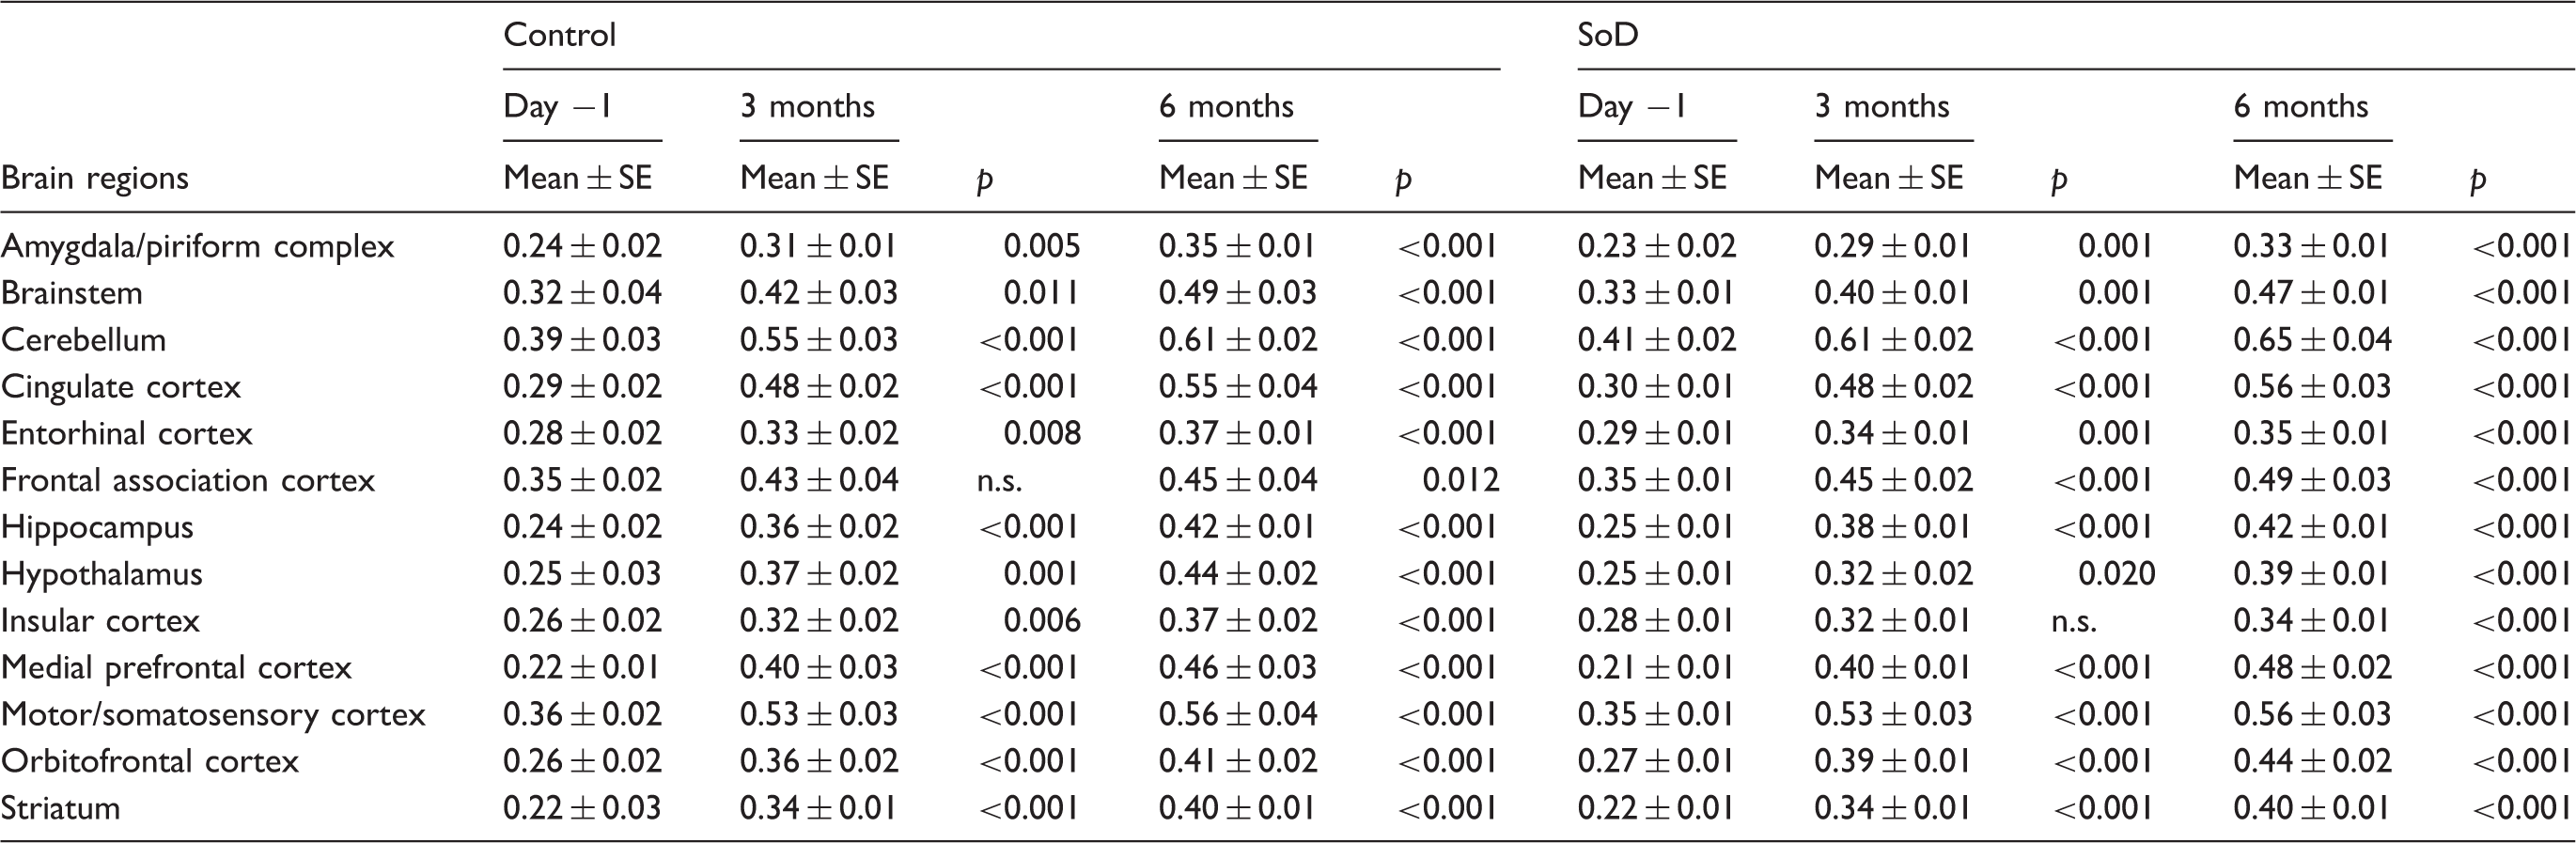
SoD: social defeat.
Brain glucose metabolism alterations in defeated rats found at short-term follow-up normalized within three months
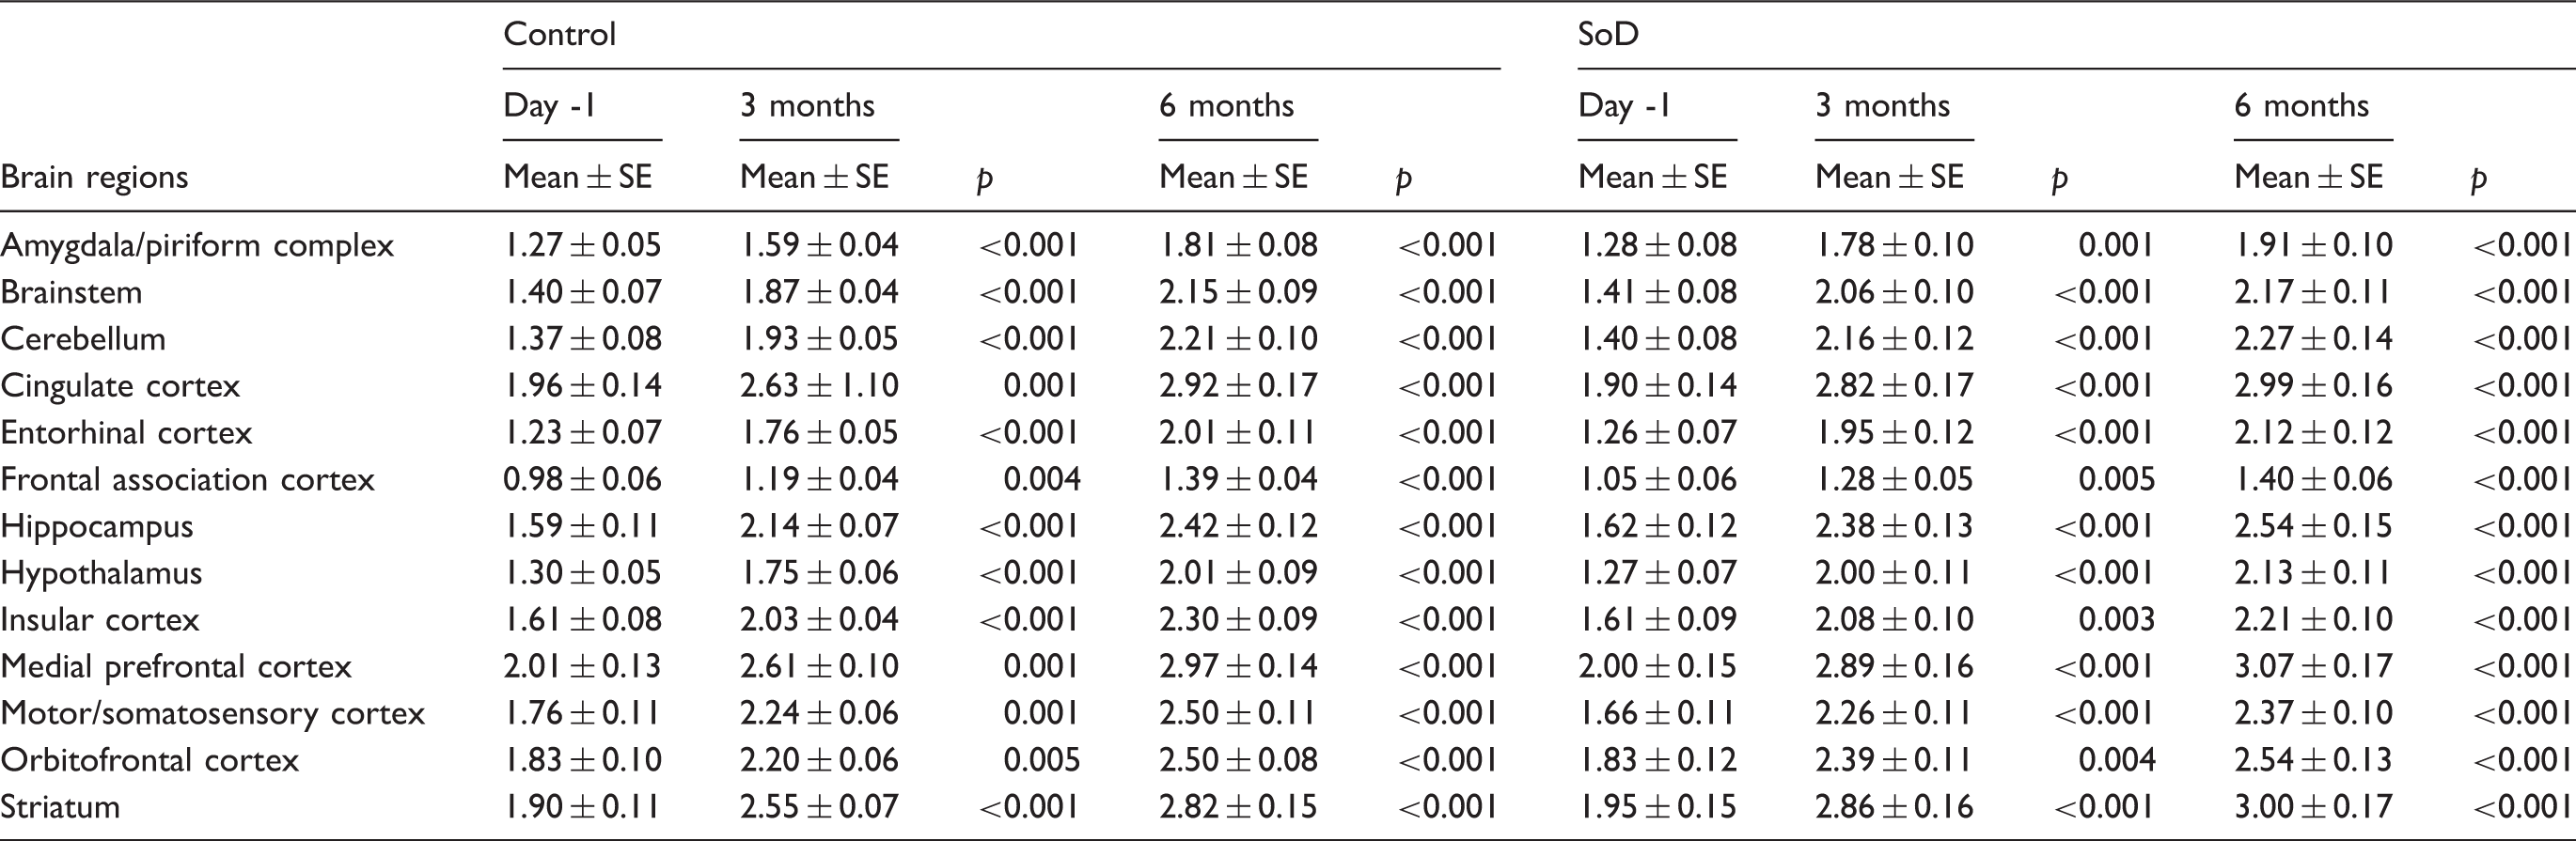
18F-FDG SUV values of the short-term follow-up for individual brain regions of control (n = 8) and SoD (n = 9) rats at baseline, day 6, 11 and 25.
SoD: social defeat; SUV: standardized uptake value.
Effect of time in 18F-FDG SUV values in control (n = 8) and SoD (n = 9) rats during the long-term follow-up (three and six months).
SoD: social defeat; SUV: standardized uptake value.
Elevated IL-1β levels were found in the frontal cortex three weeks after RSD
A significant increase in the levels of IL-1β was found in the frontal cortex of defeated rats (Supplementary Figure 2(a)), when compared to control rats (controls: 74 ± 6 pg/mg vs. SoD: 122 ± 14 pg/mg, p = 0.012, d = 1.55) at day 25. No differences between groups were found in hippocampus, cerebellum and parietal/temporal/occipital cortex. No significant differences in IL-6 and TNF-α levels (p ≥ 0.05) were found in any of the brain regions (Supplementary Figure 2(b) and (c)). However, the Cohen’s effect size values for IL-6 and TNF-α levels in frontal cortex (d = 0.63 and 0.55, respectively) suggest a trend towards increased expression of these cytokines.
Discussion
For the first time, we have demonstrated in vivo that psychosocial stress in rats transiently induces depressive- and anxiety-like behaviour associated with glial activation and altered brain glucose metabolism, as measured by PET. Yet, these effects had normalized during the three and six month’s follow-up.
The RSD protocol effectively exposed rats to recurrent stress as was confirmed by increased corticosterone levels, decreased bodyweight gain, and depressive- and anxiety-like behaviour. These findings are in line with previous studies, confirming the validity of the model.8,61–63 However, we now observed for the first time that these effects of RSD on bodyweight and behaviour did not persist at three and six months after RSD. Furthermore, we observed that defeated rats did not reveal long-lasting memory deficits measurable in the NOR test. Previous studies focused on the cognitive alterations shortly after the termination of the stressful condition and reported that high levels of corticosterone impaired object recognition memory.64–66 Although we found that corticosterone levels were elevated two days after the five-day RSD protocol, we did not measure corticosterone levels at the time of the NOR test (day 24). It is plausible that corticosterone levels had already normalized three weeks after RSD. A recent study by McKim et al. 67 subjected mice to RSD for six consecutive days and tested the effects on memory with the Barnes maze. They reported an increased number of errors to find the escape hole of the maze for defeated rats at day 2, but not at day 28. Put together, these results suggest that RSD causes only early, transient deficits in short-term memory recall. 67
PET imaging with the TSPO tracer 11C-PK11195 demonstrated the presence of glial activation seven days after RSD in the cerebellum, entorhinal cortex, insular cortex, medial prefrontal cortex and the orbitofrontal cortex. The medial prefrontal cortex and orbitofrontal cortex are associated with depressive behaviour and reward,68,69 whereas the cerebellum and insular cortex have been related to anxiety,48,70,71 and the entorhinal cortex is linked with conscious memory and spatial navigation.71,72 Three weeks after RSD, glial activation was only evident in the frontal association cortex, a brain area associated with depression. 73 Interestingly, increased levels of IL-1β were temporally and spatially consistent with this glial activation. IL-1β seems to be the key mediator between increased corticosterone levels as a consequence of psychosocial stress and neuroinflammatory processes.15,74–76 Overall, the observed glial activation was in accordance with previous preclinical studies that have evaluated brain cytokine expression in conjunction with microglia activation after RSD.9,77,78 However, in the third- and six-month follow-up of our study, no differences in tracer uptake between groups were detected anymore, indicating that RSD-induced glial activation is transient.
We observed that 18F-FDG brain uptake was decreased in the motor cortex of SoD rats on day 6, which is in agreement with the decreased locomotor activity observed in the OF test. The decreased 18F-FDG uptake in the cingulate cortex combined with the reduced sucrose preference suggests that RSD reduced motivation and induced anhedonia. 79 Overall, the global decrease in 18F-FDG uptake in the brain of SoD rats on day 25 is in line with the results reported in unipolar depressive patients.22,80–82
An interesting insight arises from the finding that longitudinal within-group comparisons revealed an increase in 11C-PK11195 uptake over a six-month time period both in control and SoD rats. This is in agreement with previous studies that demonstrated age-related microglia activation in healthy rodents 83 and humans. 84 There was also a time-related increase in 18F-FDG uptake, which differed between groups. In contrast to controls, SoD rats had a stable uptake during the short-term follow-up, which only reached the levels of the control group during the long-term follow-up. This suggests that RSD delays rather than hampers brain metabolism maturation. 85
Our most interesting finding was the seemingly “transient” nature of the effects of RSD. However, this does not mean that there are no long-term effects of RDS at all, and further efforts should be encouraged into elucidating whether the observed transient changes are leading to other deleterious effects. To our knowledge, this is the first study that reports a six-month follow-up after RSD along with non-invasive (PET) imaging evaluation. Buwalda et al. 86 evaluated the long-term effects (three months) of adolescent exposure to RSD and showed no differences between controls and defeated animals in physiological (body temperature and corticosterone levels) and behavioural (EPM and social interaction) parameters. These findings are in agreement with our study that also did not reveal any long-lasting negative behavioural effects of social defeat (or at least, not measurable with the reported methods). Still, the question remains whether exposure to psychosocial stress conveys hitherto uninvestigated long-term effects mediated by (neuro)inflammation, which may be relevant in the pathogenesis and treatment of (treatment-resistant) MDD.
Due to its longitudinal design, this study has some limitations. First, we did not confirm PET findings by immunohistochemical analysis of alterations in the morphology of microglia and/or astrocytes. However, indirect measurement of the pro-inflammatory glial phenotype was confirmed by the quantification of pro-inflammatory cytokines in the brain on day 25. Second, corticosterone levels were only measured in serum during two timepoints (before and immediately after RSD) in order to confirm the biochemical effect of the RSD protocol in the model. Therefore, we do not have any information about the longitudinal changes in corticosterone levels during the whole period of the study. Third, recent studies have shown that the TSPO tracer 11C-PK11195 is not the most sensitive candidate for detecting mild glial activation. Tracers like 11C-CB184, 87 11 C-PBR28 20 and 18F-DPA-714 88 are second generation TSPO tracers with superior characteristics in comparison with 11C-PK11195 in terms of affinity and/or nonspecific binding. Therefore, for future preclinical studies, a second generation TSPO tracer should be considered. The second generation, however, is sensitive to polymorphism in the TSPO receptor in humans. Forth, the SUV is a semi-quantitative measurement of tracer uptake, with the advantage of enabling individual monitoring over time and simplicity of the analysis. 89 However, the SUV is sensitive for changes such as blood flow and tracer delivery. Moreover, it is positively correlated to the subject’s body weight. To overcome differences in body weight that might influence SUV values, it has been clinically proposed to use the body surface area or lean body mass instead of body weight in the SUV equation. 90 However, this was not validated in the preclinical setting. Additionally, in order to perform a fully quantitative determination of tracer binding to its receptor (e.g. TSPO), performing the kinetic modelling of 11C-PK11195 requires a terminal procedure with arterial blood sampling for radioactivity measurement of blood and plasma, since no reference region devoid of TSPO is available within the brain. Due to the longitudinal nature of the study, such methodology was not feasible.
In conclusion, psychosocial stress in rats, in the form of RSD, transiently induces depressive- and anxiety-like behaviour, provokes immune activation in the central nervous system, and significantly diminishes brain glucose metabolism. PET imaging proved a useful tool to noninvasively monitoring the effects of stress in a longitudinal study design. This study supports the hypothesis of a mechanistic role of (neuro)inflammation in the development of depressive behaviour. Nevertheless, further research is warranted to elucidate how the transient effects of psychosocial stress can lead to persistent depressive behaviour, as observed in (treatment-resistant) patients with MDD.
Footnotes
Funding
The author(s) received no financial support for the research, authorship, and/or publication of this article.
Acknowledgments
The authors would like to thank David Vállez García for the statistical support and Natalia M Peñaranda Fajardo, for technical assistance in the biochemical analysis.
Declaration of conflicting interests
The author(s) declared no potential conflicts of interest with respect to the research, authorship, and/or publication of this article.
Authors’ contributions
Paula Kopschina Feltes, Erik FJ de Vries and Janine Doorduin designed the study and experiments. Paula Kopschina Feltes acquired the data and wrote the manuscript. Luis Eduardo Juarez-Orozco and Ewelina Kurtys supported data acquisition (PET scans and biochemical analysis). Paula Kopschina Feltes analysed the data. Paula Kopschina Feltes, Erik FJ de Vries, Luis Eduardo Juarez-Orozco, Ewelina Kurtys, Rudi A.J.O Dierckx, Cristina Maria Moriguchi-Jeckel and Janine Doorduin discussed the data, revised the manuscript critically and approved the final version of the manuscript.
References
Supplementary Material
Please find the following supplemental material available below.
For Open Access articles published under a Creative Commons License, all supplemental material carries the same license as the article it is associated with.
For non-Open Access articles published, all supplemental material carries a non-exclusive license, and permission requests for re-use of supplemental material or any part of supplemental material shall be sent directly to the copyright owner as specified in the copyright notice associated with the article.