
Abstract
We aimed to investigate optimal perfusion thresholds defining ischemic core and penumbra for hemispheric-cortical gray matter (GM) and subcortical white matter (WM). A total of 65 sub-6 h ischemic stroke patients were assessed, who underwent acute computed tomography perfusion (CTP) and acute magnetic resonance imaging. CTP maps were generated by both standard singular value deconvolution (sSVD) and SVD with delay and dispersion correction (ddSVD). Analyses were undertaken to calculate sensitivity, specificity, and area under the curve (AUC) for each CTP threshold for core and penumbra in GM and WM. With sSVD, the core was best defined in GM by cerebral blood flow (CBF) < 30% (AUC: 0.73) and in WM by CBF < 20% (AUC: 0.67). With ddSVD, GM core was best defined by CBF < 35% (AUC: 0.75) and in WM by CBF < 25% (AUC: 0.68). A combined GM/WM threshold overestimated core compared to diffusion-weighted imaging, CBF < 25% from sSVD (1.88 ml, P = 0.007) and CBF < 30% from ddSVD (1.27 ml, P = 0.011). The perfusion lesion was best defined by Tmax > 5 s (AUC: 0.80) in GM and Tmax > 7 s (AUC: 0.75) in WM. With sSVD, a delay time (DT) > 3 s from ddSVD was the optimal for both GM (AUC: 0.78) and WM (AUC: 0.75). Using tissue-specific thresholds for GM/WM provides more accurate estimation of acute ischemic core.
Introduction
Computed tomography perfusion (CTP) is a practical imaging technique for stroke patient assessments that can confirm a clinical diagnosis of ischemic stroke and assist in decision-making for thrombolytic treatment. 1 A large number of studies have been devoted to defining the ischemic core and penumbra by applying perfusion imaging thresholds against an imaging reference standard, usually the magnetic resonance perfusion- (PWI) or diffusion-weighted imaging (DWI). 2 Despite there being recognized differences in perfusion values between normal gray matter (GM) and white matter (WM) in a healthy human, the conventional perfusion imaging thresholds that delineate ischemic core and ischemic penumbra do not differentiate between GM and WM.3–6 Positron emission tomography (PET) studies of cerebral hemodynamics have shown that GM in healthy humans has a higher CBF (54.5 ± 12.3 ml/100 g/min) and cerebral blood volume (CBV: 5.2 ± 1.4 ml/100 g) compared to WM (CBF: 22.2 ± 4.9 ml/100 g/min, CBV: 2.7 ± 0.6 ml/100 g).7–9 It is also recognized that subcortical WM has fewer anastomoses and limited penetration of the leptomeningeal collateral vessels into the sub-cortex, which may influence the rate of infarction. 10 Furthermore, both animal and human stroke studies indicate that GM infarction occurs earlier and at a higher cerebral blood flow level due to the higher metabolic demand of GM.11,12 Despite these considerable differences, there has been limited evaluation of the perfusion imaging characteristics of hemispheric cortical GM and subcortical WM ischemia for determination of the ischemic core and penumbra in human studies with sufficient power.
Additionally, the algorithm applied to post-processing of raw perfusion imaging data may be a cause of significant variation of thresholds between different perfusion processing software. The standard singular value deconvolution (sSVD) algorithm is widely applied for MR and CT perfusion processing. However, sSVD is a delay-sensitive method, resulting in underestimation of CBF and overestimation of mean transit time (MTT), as, almost invariably in ischemic stroke, there is delay and dispersion of the contrast between the more proximal arterial input function (AIF) and the ischemic region. 13 SVD with delay and dispersion correction (ddSVD) is thought to be a delay-insensitive algorithm whereby the delay and dispersion of the contrast is corrected by time-shifting of the tissue density curve. Subsequent studies have proposed that the ddSVD algorithm result in more accurate and precise detection of the ischemic core, and especially the ischemic penumbra. 14 This may be particularly important in ischemic WM, where there is likely to be more delay and dispersion of contrast due to its limited collateral supply. There is still no agreement about the optimal imaging post-processing algorithm for CTP in acute ischemia stroke assessment.
We hypothesized that during acute ischemia, hemispheric cortical GM and subcortical WM would demonstrate different thresholds for ischemic core and penumbra. Thus, applying a single threshold for GM and WM might lead to overestimation of the infarct in WM and underestimation of the infarct in GM. Therefore, the use of separate thresholds for WM and GM may provide more accurate estimation of ischemic core and penumbra. We also hypothesized that there may be differences between the two post-processing methods (sSVD and ddSVD) in terms of ischemic core and penumbra estimation in GM and WM. Thus, the purpose of this study was to investigate the optimal CT perfusion thresholds and post-processing method for defining ischemic core and ischemic penumbra in hemispheric cortical GM and subcortical WM, respectively.
Methods
Patients
The study used a previously collected dataset of patients 3 who were admitted to the John Hunter Hospital and fulfilled the following criteria: diagnosis of an ischemic stroke, acute CTP within 6 h of symptom onset, acute MRI (including perfusion imaging) within 1 h of the initial CTP, and follow-up MRI at 24 h of symptom onset. Patients with a posterior circulation occlusion or a lacunar infarct were excluded. Patients were also excluded if their imaging data were severely motion affected. Baseline clinical characteristics were recorded including age, gender, national institutes of health stroke score (NIHSS), and 90 days modified Rankin Score (mRS). Patients were treated with thrombolysis if they were eligible based on the institutional guidelines. This study was approved by the Hunter New England ethics committee under the Helsinki Declaration of 1975 (and as revised in 1983), and all patients gave written informed consent for the use of their clinical and imaging data.
Imaging acquisition
CTP images were acquired on a 16-slice Philips scanner (Philips Mx8000; Philips, Cleveland, OH) or 320 detector row Toshiba (Toshiba Aquilion ONE; Toshiba, Tokyo, Japan). For the 16-slice scanner, two adjacent 60 s series were performed; each perfusion series covered 24-mm sections acquired as four adjacent 6-mm slices. 15 MRI was performed on a 1.5 or 3 Tesla scanner (Siemens Avanto, Erlangen, Germany). The stroke MRI protocol included an axial isotropic DWI, time-of-flight MR angiography, and bolus-tracking PWI. 15
Image post-processing
All perfusion images were processed with MIStar (Apollo Medical Imaging Technology, Melbourne, Australia) for this study. Motion correction was performed automatically and the AIF was selected from the anterior cerebral artery and venous output function (VOF) was selected from the sagittal sinus. The cerebrospinal fluid and chronic infarct and gliosis region were automatically identified by a Hounsfield Unit (HU) threshold and excluded from the analysis. Perfusion maps were calculated using sSVD and ddSVD as part of this study, respectively. sSVD calculated an impulse residue function (IRF) 16 from the AIF corrected by the VOF to generate maps of: CBF, CBV and mean transit time (MTT). CBF is calculated from the peak height of the IRF curve, CBV is calculated from the area under the IRF curve, and MTT is calculated as the ratio of CBV to CBF according to the central volume principle. Time to peak of residual function (Tmax) is calculated from the time to peak of the IRF curve, where Tmax = 0 reflects normal blood supply in normal tissue without delay and dispersion.
Delay time (DT) was calculated using ddSVD to correct for potential arterial delay and dispersion effects caused by stroke and arterial stenosis by generating an arterial transport function from each voxels IRF. 17 The effect of the arterial transport function is to shift and broaden the AIF profile in an attempt to more realistically model the pathophysiology of acute stroke. This is achieved by applying a series of DT values, DTi, ranging from 0 to Tmax. For each DT, a modeled arterial transport function is convolved with the measured global AIF to produce an AIFi, which is used for SVD of the tissue curve to generate an IRFi with its maximum appearing at Tmax (i). The actual DT is determined as the minimum DTi value, which produces Tmax (i) = 0. 14
Patient groups
Patients were divided into two cohorts for threshold analyses. Cohort 1 consisted of patients who had concurrent acute CTP and DWI on admission to measure the volume of the baseline ischemic core. 18 Cohort 2 consisted of patients with no reperfusion at 24 h, where the 24 h DWI lesion was used to define the penumbra. 3 Reperfusion was defined as perfusion lesion volume reduction being >80% from the acute to the 24 h MRI (perfusion lesion was defined as the lesion volume with MTT >145%). No reperfusion was defined as the perfusion lesion volume reduction being <20% at 24 h. 19
Segmentation and imaging analyses
CTP source imaging slabs were co-registered with the corresponding acute DWI for cohort 1 and the 24 h DWI for cohort 2. Gradient echo warping and geometric distortions of the baseline and 24 h MRI was corrected using the imaging analysis tools Free Surfer. Manual manipulation of the CTP registration was undertaken to align the gantry angle and anatomical land marks with the DWI using the imaging fusion tool of the MiStar software and the results confirmed by two experienced analysts (AB and MWP).
The CTP source image was used to manually segment WM from GM using HU thresholds to create a WM/GM mask. This HU threshold was for individual patients as a 4 HU or more drop between tissue compartments and confirmed by an expert viewers (AB and MWP). Individual cases where the acute CT scan showed extensive ischemic change resulting in edema and loss of definition of GM and WM were excluded. The acute and 24 h DWI lesions were defined based on the increase of signal intensities and semi-automatically delineated by region of interest (ROI) tool.3,4
The resulting ROIs and WM mask was transferred to the co-registered acute CTP map for further analysis; so, only those regions on MRI images corresponding to the regions covered by the imaged CTP slabs were included in the analysis. The mean CBF, CBV, MTT, Tmax, and DT of acute DWI-defined infarct core and 24-h MRI defined penumbra region (the volumetric difference between 24-h and acute DWI) were measured in GM and WM, respectively (Figure 1). A range of relative thresholds were investigated for ischemic core and perfusion lesion in GM and WM separately (Figure 2), as well as combined GM/WM. For CBF and CBV, the threshold ranged from 0 to 100%, with 5% increments; for MTT, the threshold ranged from 100% to 500% with 5% increments; for Tmax and DT, the threshold ranged from 0 to 10 s, with increments of 0.5 s. The thresholds level was defined relative to the contralateral hemisphere.
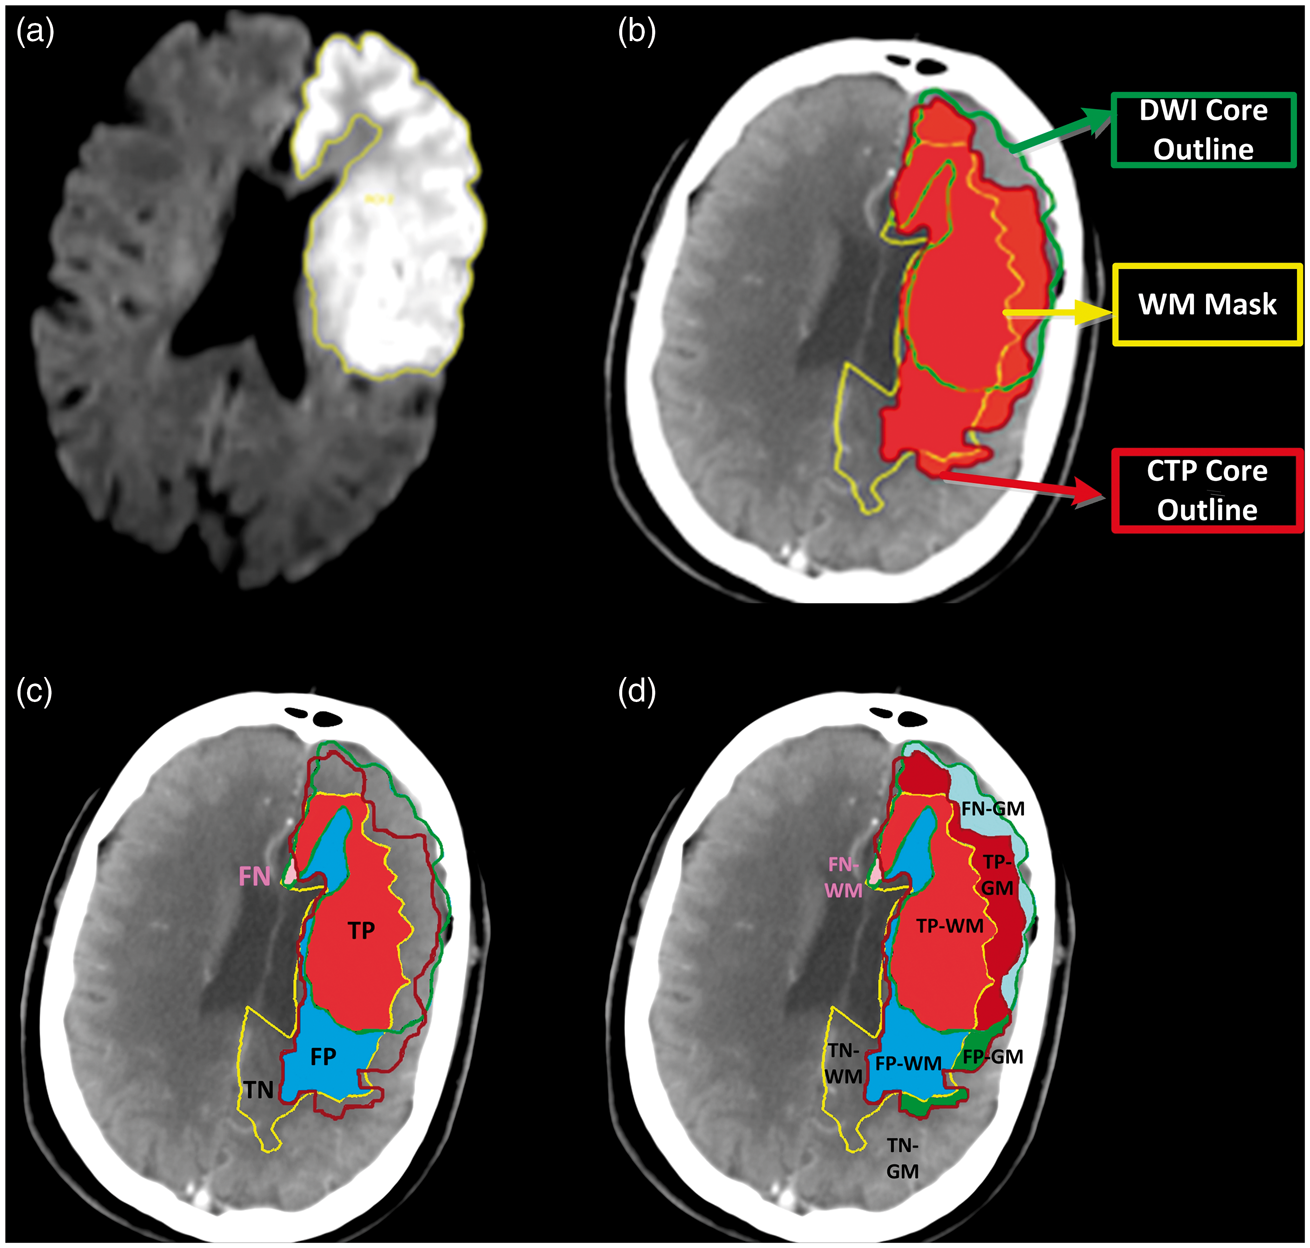
Flowchart of imaging processing steps. DWI co-registered to CTP source image. Creation of a WM mask is based on the Hounsfield Units of CT. Outline of the DWI lesion. Then transferred the DWI ROI and WM mask to the perfusion parametric-maps. The perfusion values (e.g. CBF, CBV, and MTT) for ischemic core and penumbra region were measured in GM and WM. The ROI from acute DWI was defined as infarct core; the ROI from 24-h DWI in patients with no reperfusion was defined as the perfusion lesion. The volumetric difference between 24-h and acute DWI was considered as the penumbra region. Illustration of voxels analysis. After DWI (a) co-registered to CTP and segmentation of WM from GM, the DWI (acute and 24 h follow-up) ROI and the WM mask were transferred to the CTP map (b). The analyses were applied in GM and WM separately, as well as combined GM and WM shown in panel (c and d). Voxels in both CTP and DWI lesions were considered as “true positive” (TP), voxels in CTP lesion but not in DWI lesion were considered as “false positive” (FP), voxels in DWI lesion but not in CTP lesion were considered as “false negative” (FN), voxels included in neither the CTP nor DWI lesion were considered as “true negative” (TN).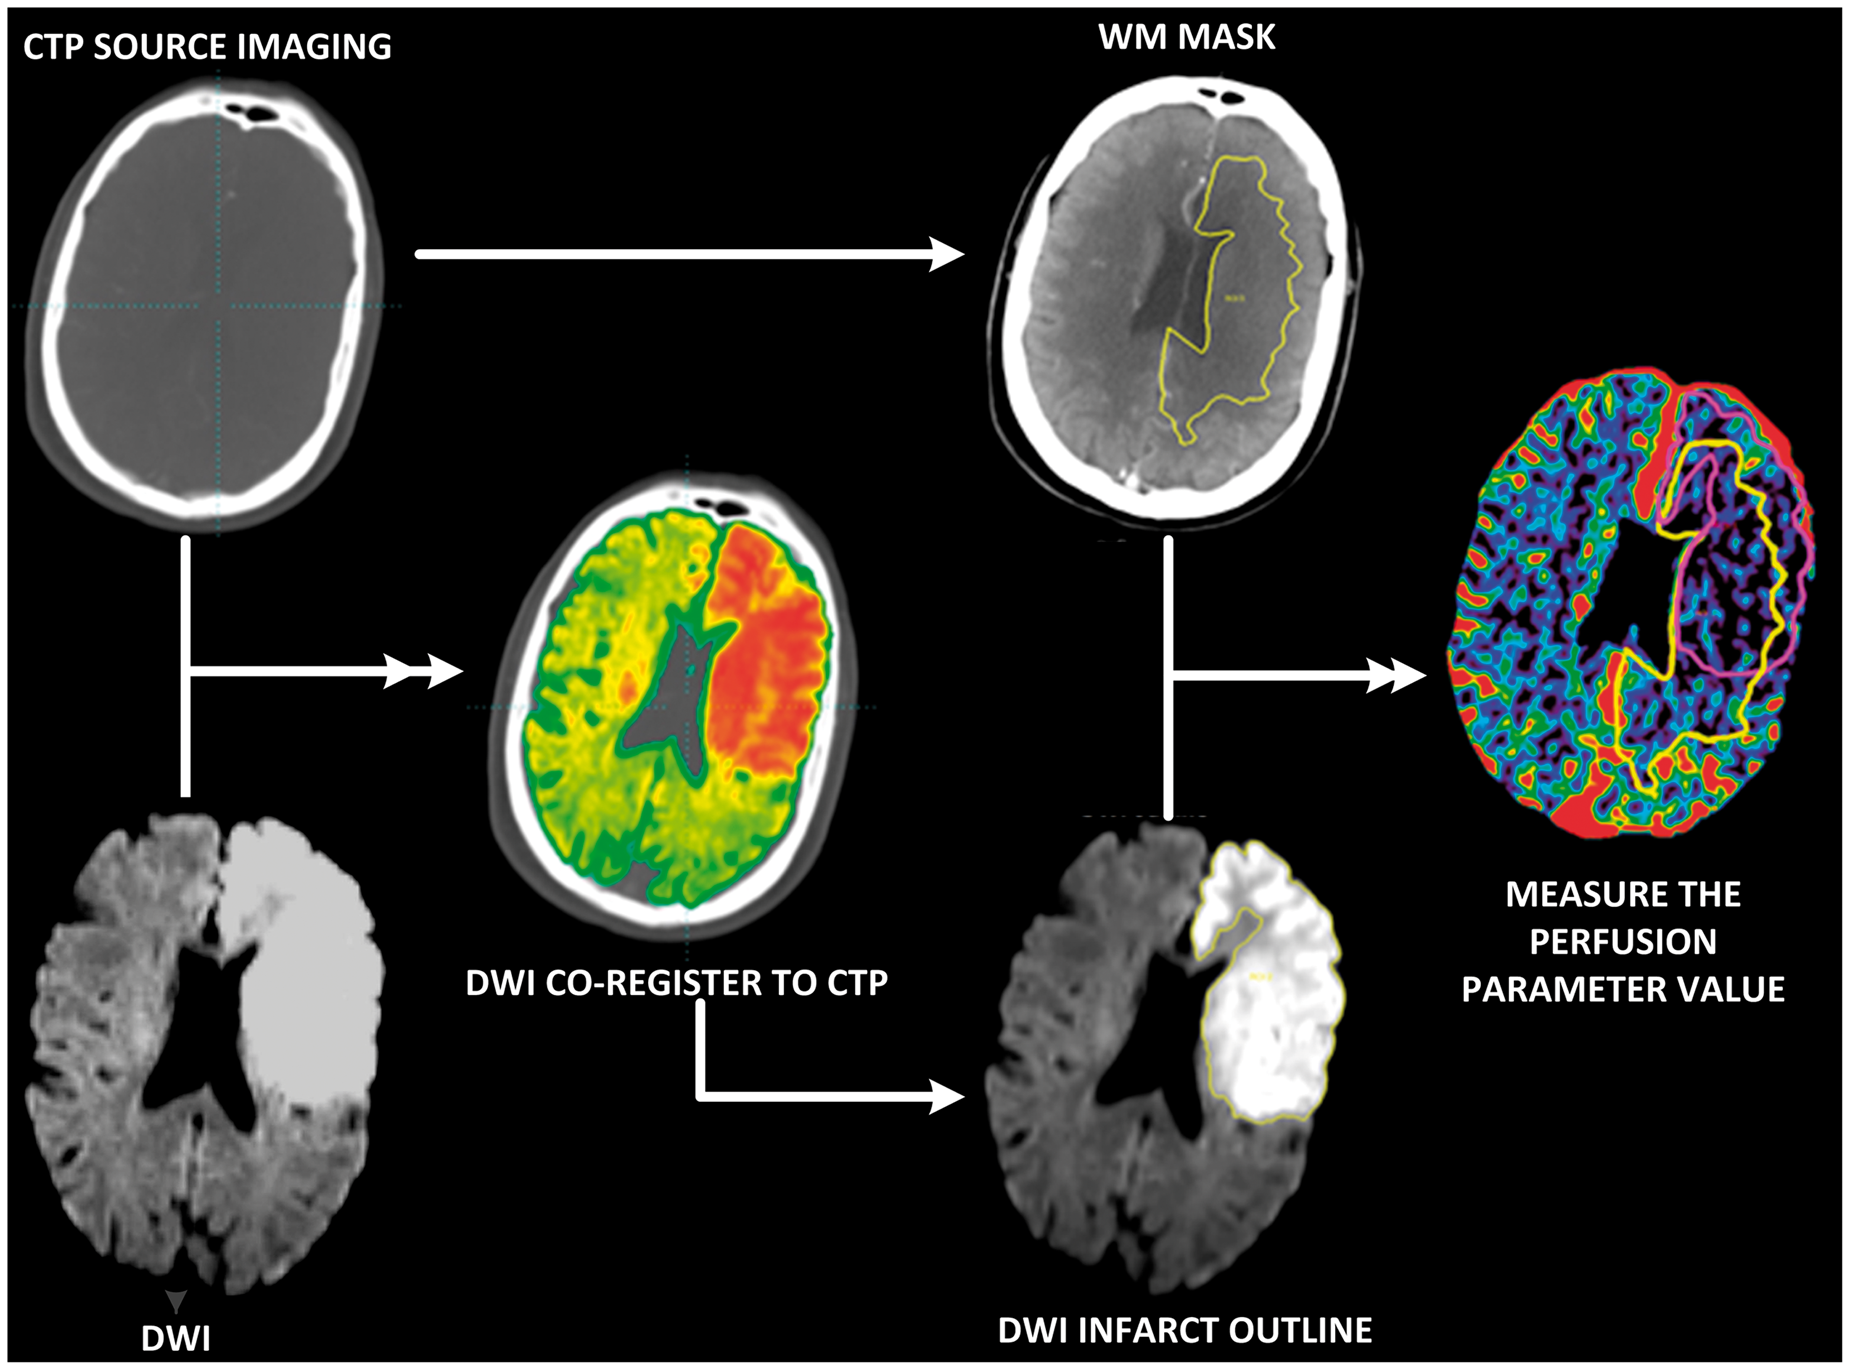
Further validation was performed using PWI to identify GM/WM thresholds for ischemic tissue. GM and WM segmentation was performed within MiStar on MRI anatomical maps, using signal intensity thresholds between the compartments defined above 20 and confirmed by expert viewers (AB and MWP). Following segmentation, all imaging-based threshold analyses were performed again.
Only hemispheric (ischemic hemisphere) brain voxels were analyzed, in order to provide balance in the number of voxels being measured and to prevent large true-positive findings in calculating the specificity. The number of voxels for each threshold was extracted for each region (GM and WM) and the number of voxels overlapping with the corresponding DWI lesion was measured for each region.
Statistical analyses
Statistical analyses were performed with STATA (version 13.0). Descriptive results and quantitative baseline patients' characteristics were presented as mean ± standard deviation (SD) or median and interquartile range (IQR). Paired T test or Wilcoxon signed rank test were performed for parametric data or nonparametric data. The volumetric difference between CTP predicted ischemic core/perfusion lesion and acute/24 h DWI were compared. Statistical significance was set at P<0.05.
A receiver operating characteristic (ROC) analysis was performed to assess the predictive performance of perfusion parameter in relationship to the co-registered concurrent DWI lesion in GM and WM separately. The DWI lesion was considered as the “true” lesion. 2 Voxels in both the CTP and DWI lesions were considered as “True Positive” (TP), voxels in the CTP lesion but not in the DWI lesion were considered as “False Positive” (FP), voxels in the DWI lesion but not in the CTP lesion were considered as “False Negative” (FN), and voxels included in neither the CTP nor DWI lesion were considered as “True Negative” (TN). Sensitivity (TP/(TP+FN)) was plotted against 1-specificity (TN/(TN+FP)) to generate the ROC curve for each threshold. The result of the ROC analyses for each perfusion threshold was presented as the area under the ROC curve (AUC) with 95% confidence intervals (CIs). The optimal thresholds were determined by the AUC, Youden's Index, and the minimum volumetric difference between DWI and CTP.
Results
Patients
Patient baseline characteristics.
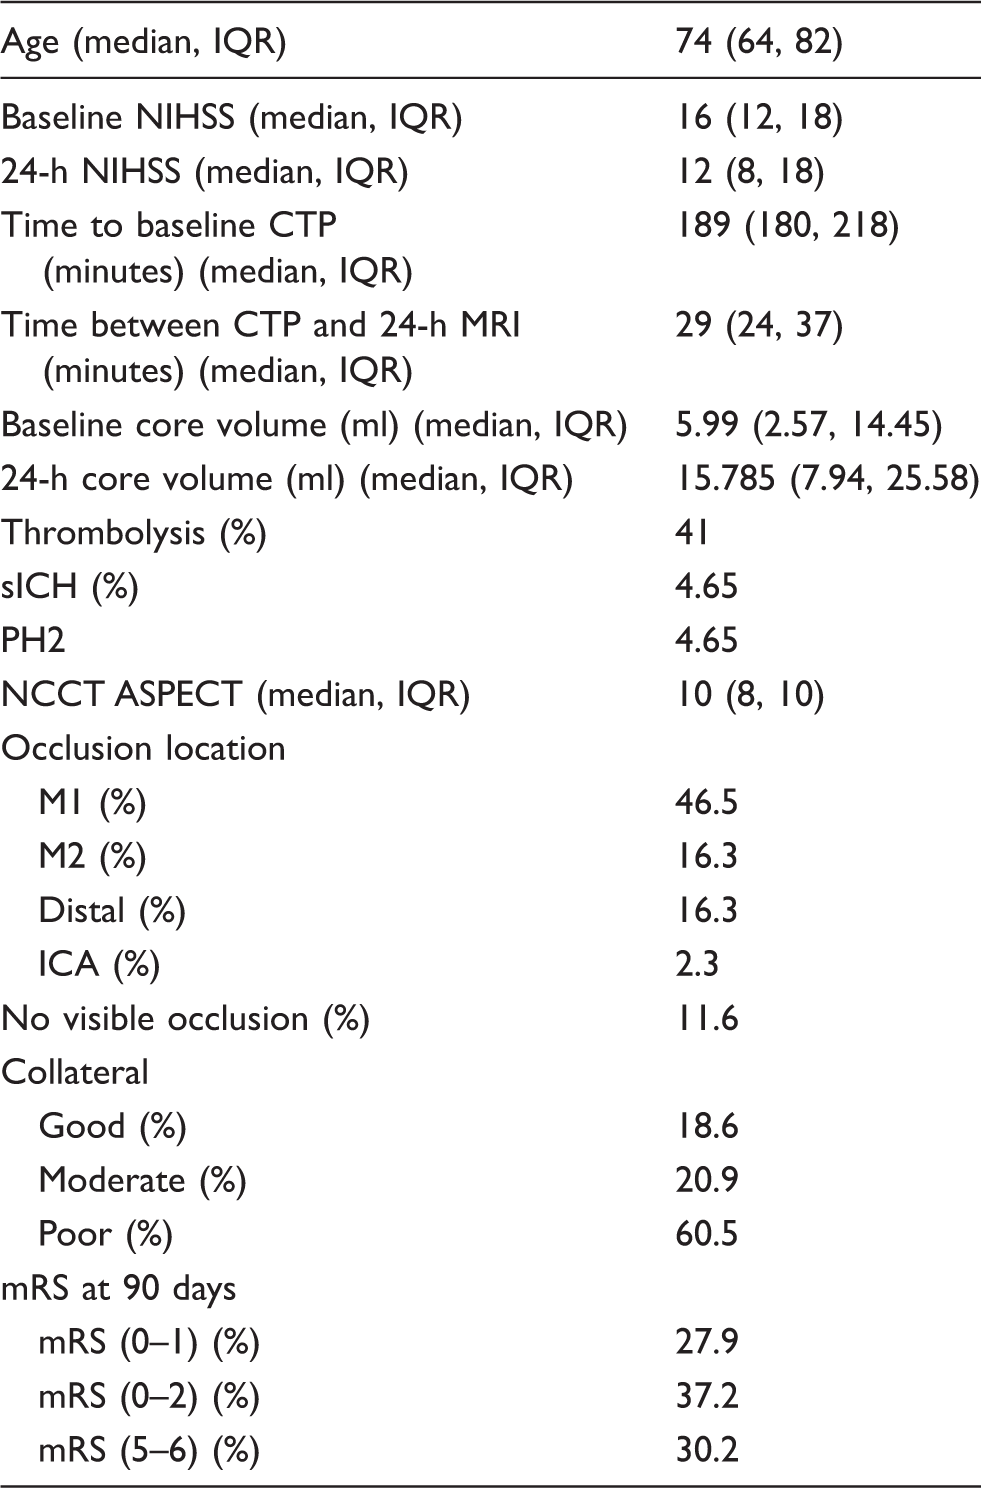
CTP: computed tomography perfusion; MRI: Magnetic Resonance Imaging; NIHSS: national institutes of health stroke score; sICH: symptomatic intracerebral hemorrhage; PH2: parenchymal hematoma subtype 2; NCCT: noncontrast computed tomography; M1: M1 segment of middle cerebral artery; M2: M2 segment of middle cerebral artery; ICA: internal carotid artery; IQR: interquartile range; mRS: modified Rankin Score.
Perfusion values in ischemic core and penumbra of GM and WM
Mean CT perfusion values in MRI-defined ischemic core and penumbra.
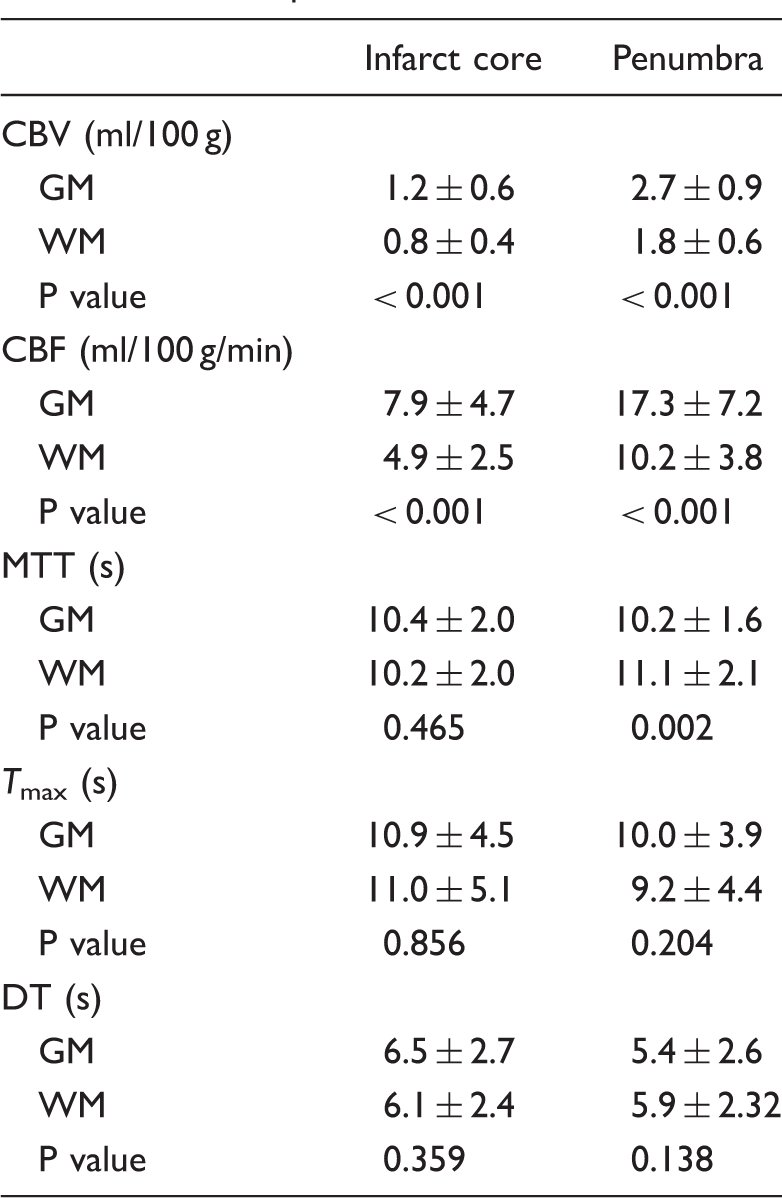
Note: P < 0.05 was considered as the significant level.
GM: gray matter; WM: white matter; CBV: cerebral blood volume; CBF: cerebral blood flow; MTT: mean transit time; Tmax: time to peak of residual function; DT: delay time.
CBV and CBF were higher in GM than in WM within the penumbra region (CBV: 2.7 ± 0.9 ml/100 g and 1.8 ± 0.6 ml/100 g in GM vs. WM, P<0.001; CBF: 17.3 ± 7.2 ml/100 g/min and 10.2 ± 3.8 ml/100 g/min in GM vs. WM, P < 0.001; Table 2). MTT (10.2 ± 1.6 s) in GM penumbra region was shorter than MTT (11.1 ± 2.19 s) in WM (P = 0.038). There were no Tmax and DT value difference between GM and WM within the penumbra region (Table 2).
The optimal threshold for defining ischemia in GM and WM (sSVD)
Performance of best CTP thresholds for definition of acute ischemic core and perfusion lesion.
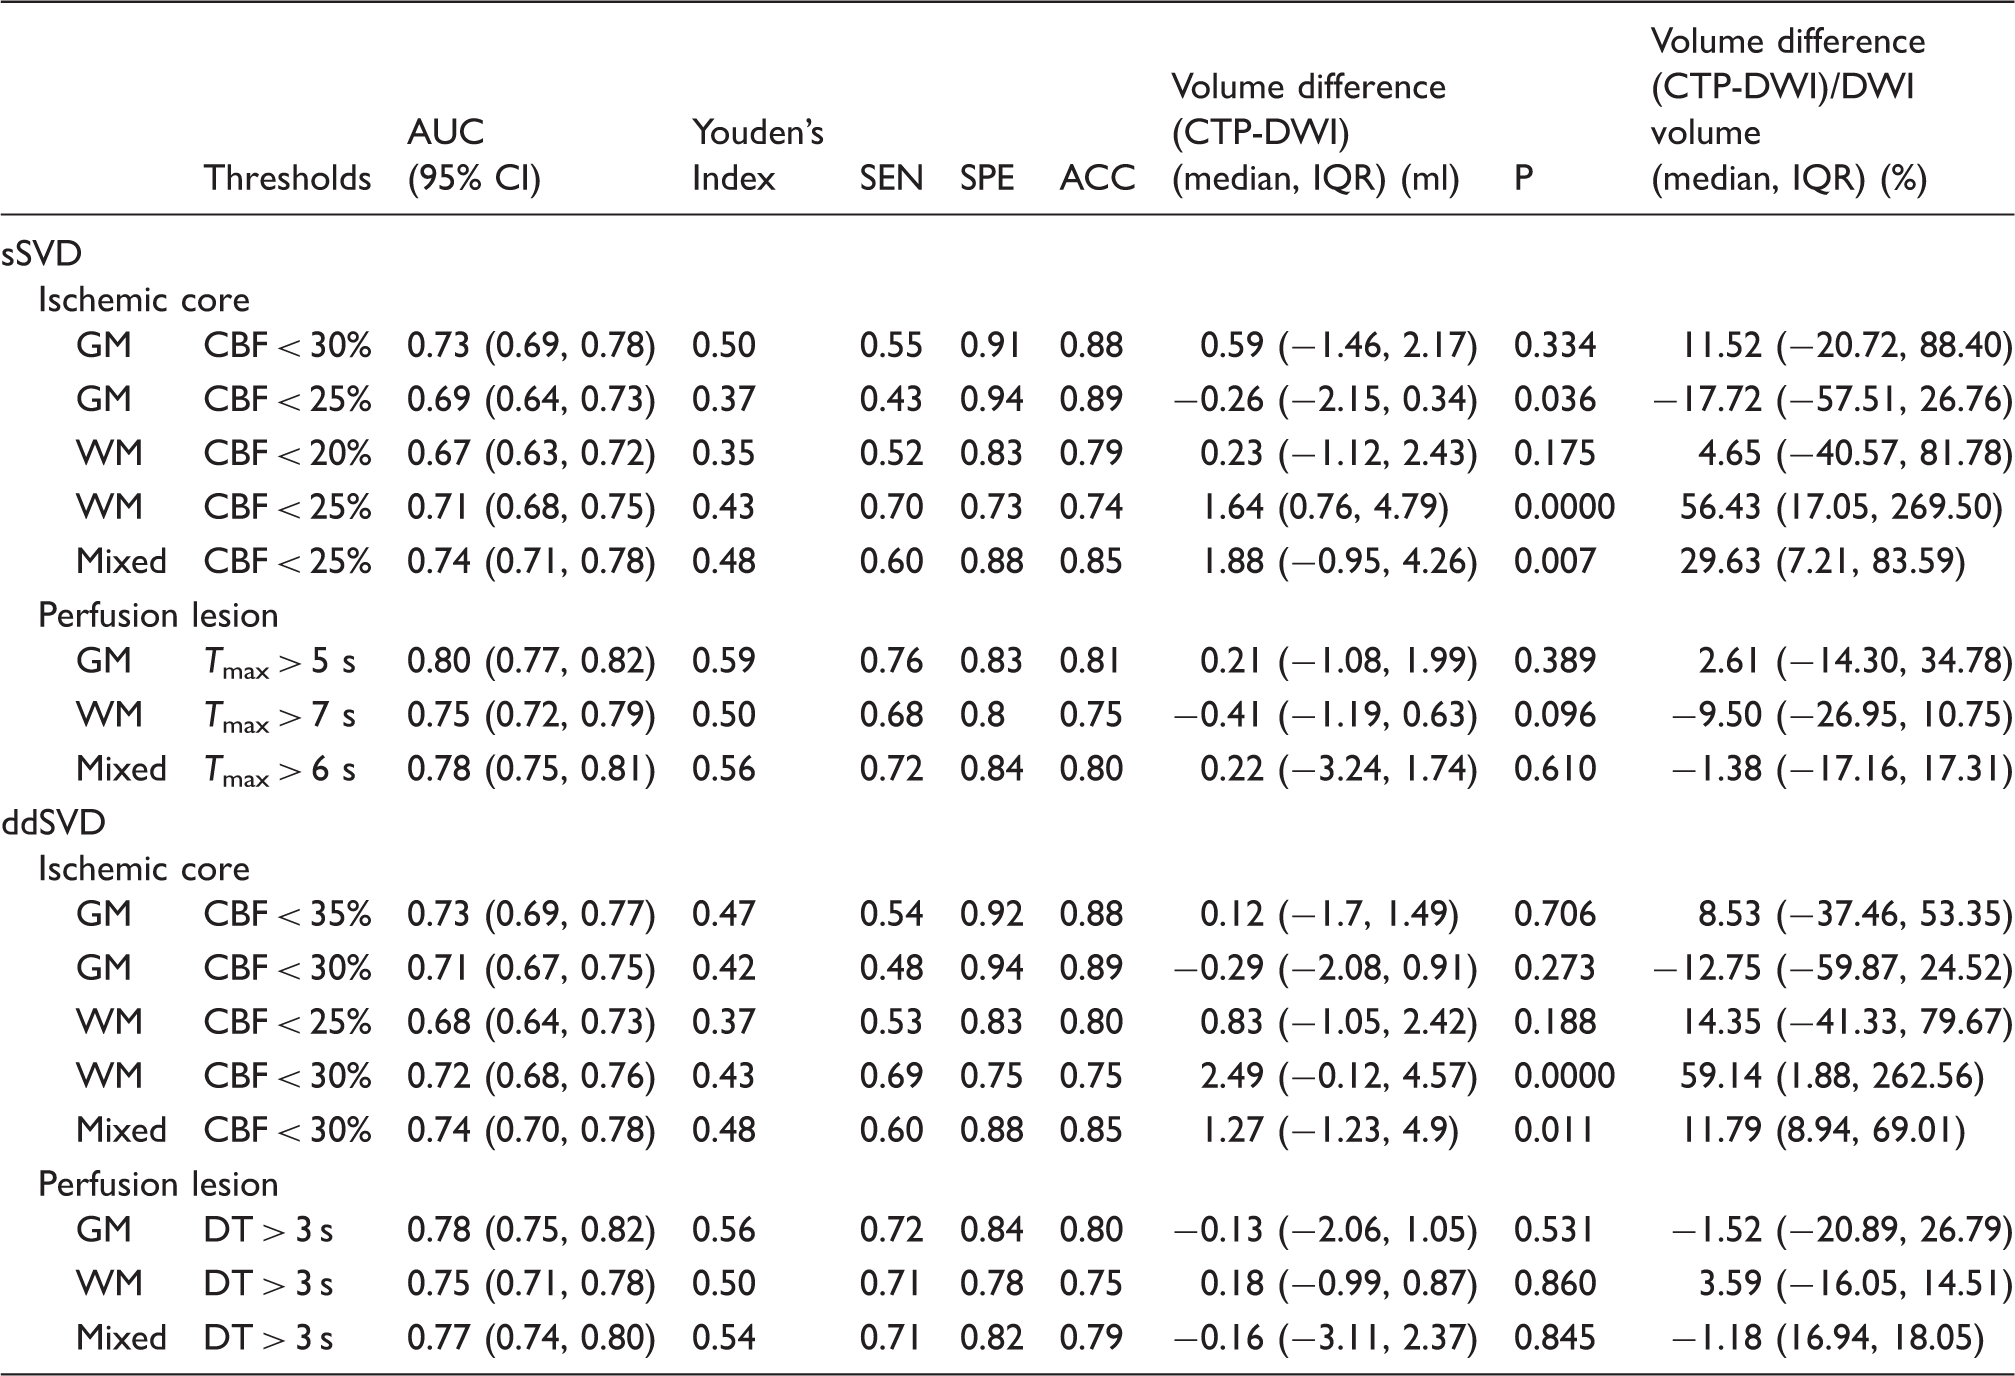
Note: P (volumetric difference between CTP-DWI) < 0.05 was considered statistically significant.
AUC: area under the curve; SEN: sensitivity; SPE: specificity; ACC: accuracy; IQR: interquartile range; sSVD: standard singular value deconvolution; ddSVD: singular value deconvolution with delay and dispersion correction; GM: gray matter; WM: white matter; Mixed: mixed measured gray matter and white matter.
The best CTP ischemic core threshold (CBF < 25%) for mixed GM/WM overestimated acute DWI ischemic volume (median volume difference 1.88 ml, IQR: −0.95, 4.26; P = 0.007; Table 3 and Figure 3). The median acute DWI lesion in this cohort was 5.99 ml (IQR: 2.57, 14.45). These absolute differences translated into a median 29.36% (IQR: 7.21%, 83.59%) overestimation of DWI core by the mixed GM/WM threshold. The application of the mixed GM/WM threshold overestimated the ischemic core in WM (CBF < 25%, median volume difference: 1.64 ml, IQR: 0.76, 4.79; P<0.001), with the median WM DWI lesion of 3.30 ml (IQR: 1.27, 6.18) translating into a relative overestimation of WM core by the mixed GM/WM threshold of 56.43% (IQR: 17.05%, 269.50%). In contrast, the mixed GM/WM threshold underestimated the ischemic core in GM (CBF < 25%, median volume difference: −0.26, IQR: −2.15, 0.34; P = 0.036), with the median GM DWI lesion of 3.77 ml (IQR: 2.01, 8.02) translating into a relative underestimation of GM core by the mixed GM/WM threshold of 17.72% (IQR: −26.76%, 57.51%). There were no significant volumetric differences between the CTP-derived ischemic core volume from the best GM threshold (CBF < 30%) and acute DWI in GM (P = 0.334; Table 3), nor for the best WM threshold (CBF < 20%) in WM (P = 0.125; Table 3).
The plots show individual volumetric difference between the CTP-derived ischemic core and acute DWI when processed with sSVD algorithm. (a) Mixed GM/WM threshold (CBF < 25%). (b) Separate threshold for GM (CBF < 30%). (c) Separate threshold for WM (CBF < 20%). (d) The application of mixed GM/WM threshold (CBF < 25%) in WM only. The mixed GM/WM threshold overestimated the ischemic core. However, the separate GM and WM thresholds for core estimation showed significantly better volumetric agreement with acute DWI. Lastly, the application of a mixed GM/WM threshold overestimated the core in WM as seen in panel (d).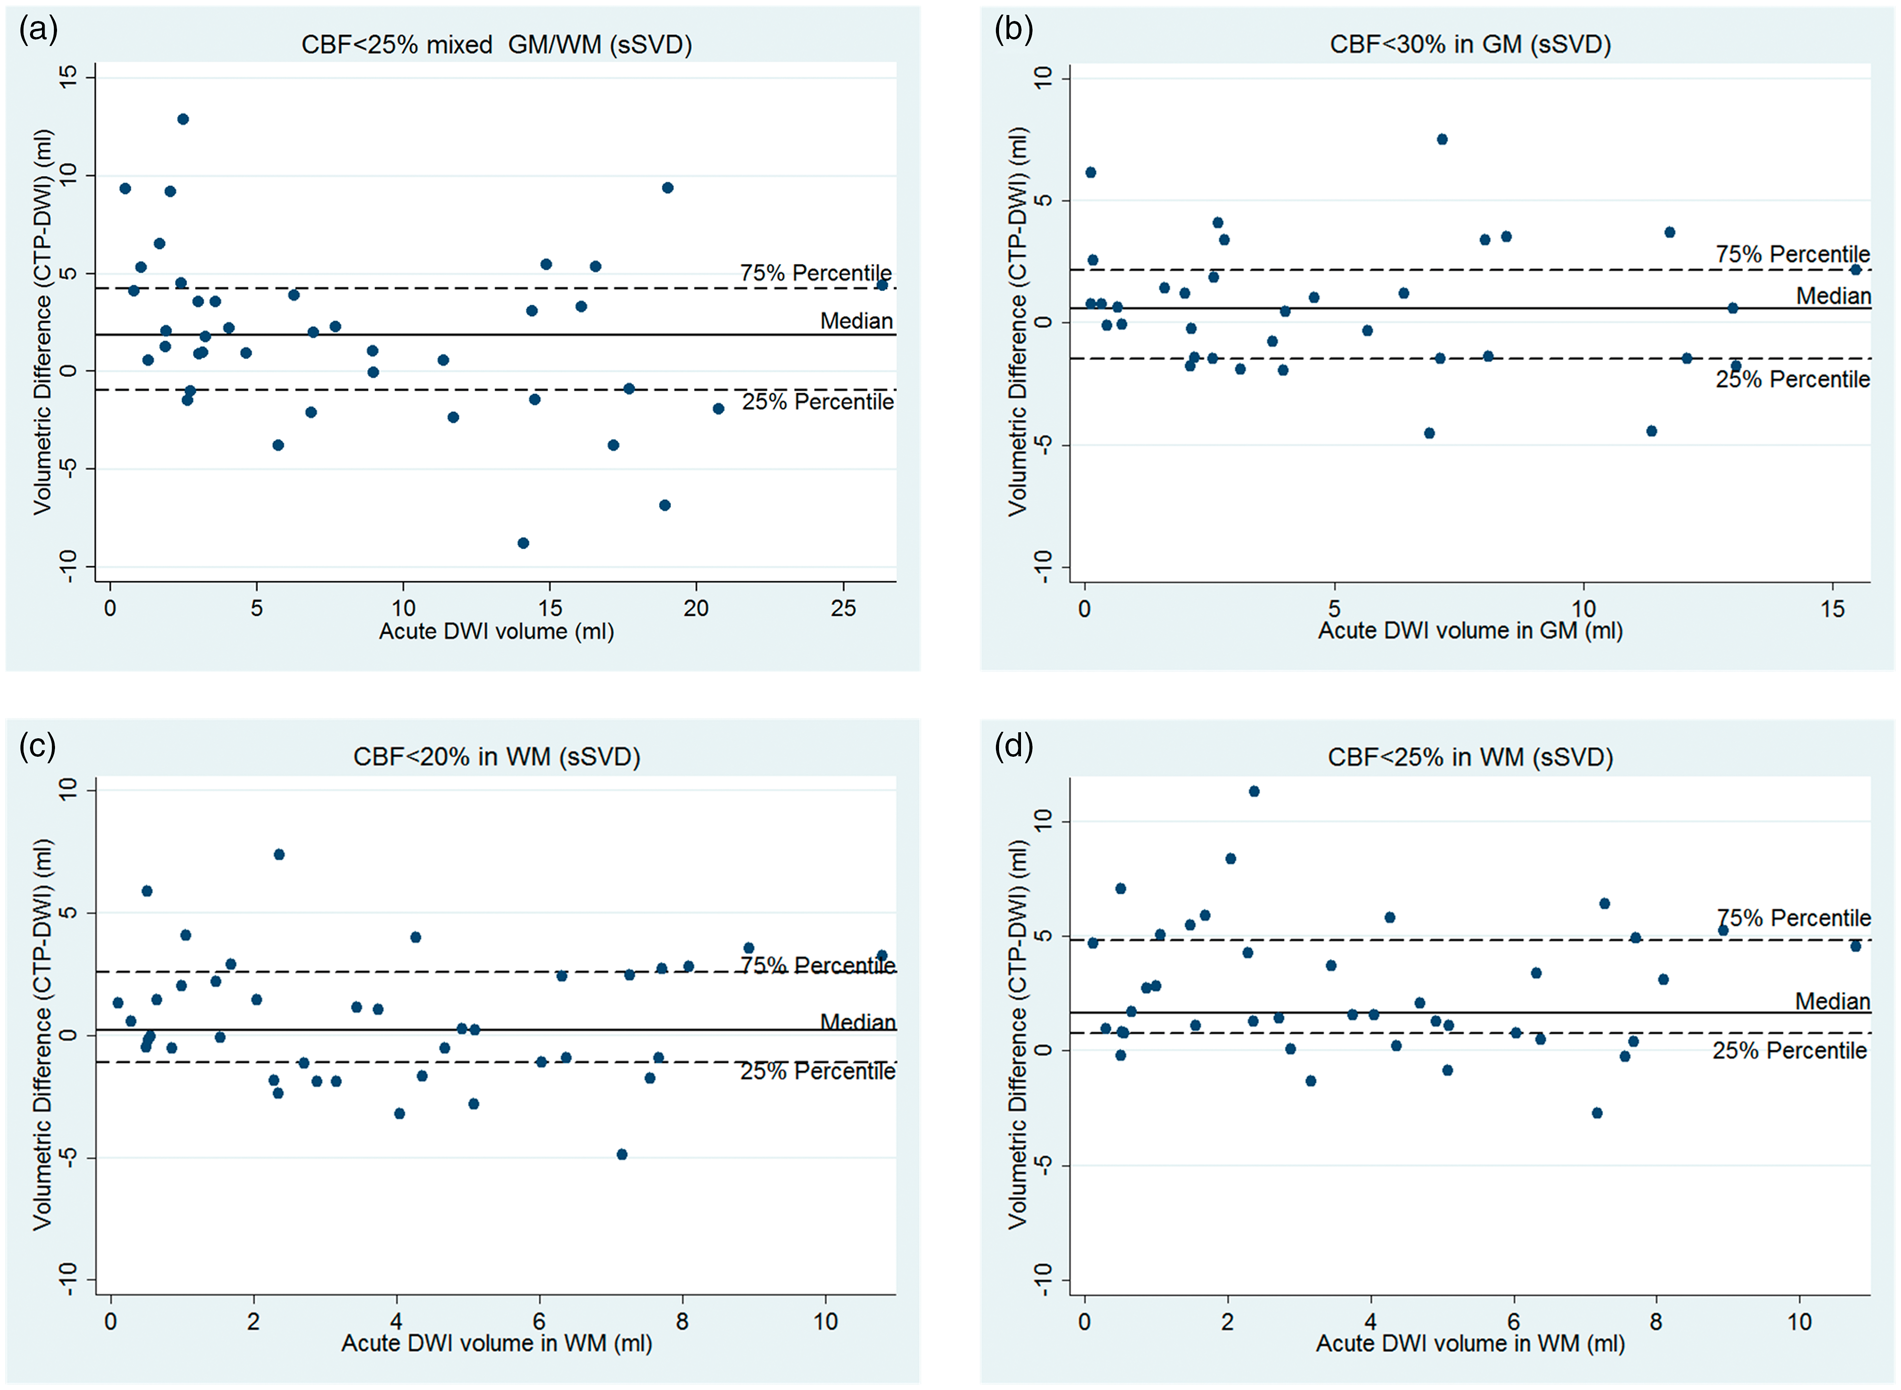
The optimal threshold to predict the perfusion lesion for mixed GM and WM was Tmax > 6 s (AUC: 0.78; 95% CI: 0.75, 0.81; Youden's Index: 0.56; Table 3). The perfusion lesion in GM was best predicted by Tmax > 5 s (AUC: 0.80; 95% CI: 0.77, 0.82; Youden's Index: 0.59), whereas Tmax > 7 s (AUC: 0.75; 95% CI: 0.72, 0.79; Youden's Index: 0.51) was the optimal threshold in WM.
There were no significant volumetric differences between 24 h DWI and the CTP-derived perfusion lesion from the best threshold for GM (median volumetric difference: 0.2 ml, IQR: −1.0, 1.9; P = 0.389), WM (−0.4 ml, IQR: −1.1, 0.6; P = 0.096), nor from assessment using the optimal mixed GM/WM threshold (0.2 ml, IQR: −3.2, 1.7; P = 0.610).
Thus, for sSVD, use of single threshold for mixed GM and WM resulted in significant overestimation of ischemic core in WM and underestimation of core in GM (compared to best individual thresholds for GM and WM), but not for the total perfusion lesion. However, different thresholds were required to define the perfusion lesion in GM vs. WM.
The optimal threshold for defining ischemia in GM and WM (ddSVD)
The optimal threshold to define the core for mixed GM/WM was CBF < 30% (AUC: 0.74; 95% CI: 0.70, 0.78; Youden's Index: 0.48; Table 3). The ischemic core in GM was best defined by the threshold CBF <35% (AUC: 0.75; 95% CI: 0.71, 0.79; Youden's Index: 0.47), whereas CBF < 25% (AUC: 0.68; 95% CI: 0.64, 0.73; Youden's Index: 0.37) was the optimal threshold to delineate the ischemic core in WM.
Applying the best ddSVD threshold for mixed GM/WM overestimated the total ischemic core (CBF < 30%, median volume difference: 1.2 ml, IQR: −1.2, 4.9; P = 0.011; Table 3 and Figure 4). These absolute differences translated into a median 11.7% (IQR: 8.9%, 69.0%) overestimation of DWI core by the mixed GM/WM threshold. This, again, was because application of the mixed GM/WM threshold overestimated the ischemic core in WM (CBF < 30%, median volume difference: 2.4 ml, IQR: −0.1, 4.5; P < 0.001), and translating into a relative overestimation of WM core by the mixed GM/WM threshold of 59.1% (IQR: 1.8%, 262.5%). However, there was no volumetric difference between the acute DWI and the acute ischemic core volume derived from the mixed GM/WM threshold in GM (CBF < 30%, median volume difference: −0.2 ml, IQR: −2.0, 0.9; P = 0.273). There were no significant volumetric differences between the CTP-derived ischemic core volume from the best GM threshold (CBF < 35%) and acute DWI in GM (P = 0.706; see in Table 3), nor for the best WM threshold (CBF < 25%) in WM (P = 0.188; Table 3).
The plots show the individual volumetric difference between the CTP-derived ischemic core and acute DWI when processed with ddSVD algorithm. (a) Mixed GM/WM threshold (CBF < 30%). (b) Separate threshold for GM (CBF < 35%) and (c) Separate threshold for WM (CBF < 25%). (d) The application of mixed GM/WM threshold (CBF < 30%) in WM only. The mixed GM/WM threshold led to overestimate the ischemic core. However, the separate GM and WM thresholds for core estimation showed significantly better volumetric agreement with acute DWI. Lastly, the application of a mixed GM and WM threshold overestimated the core in WM as seen in panel (d).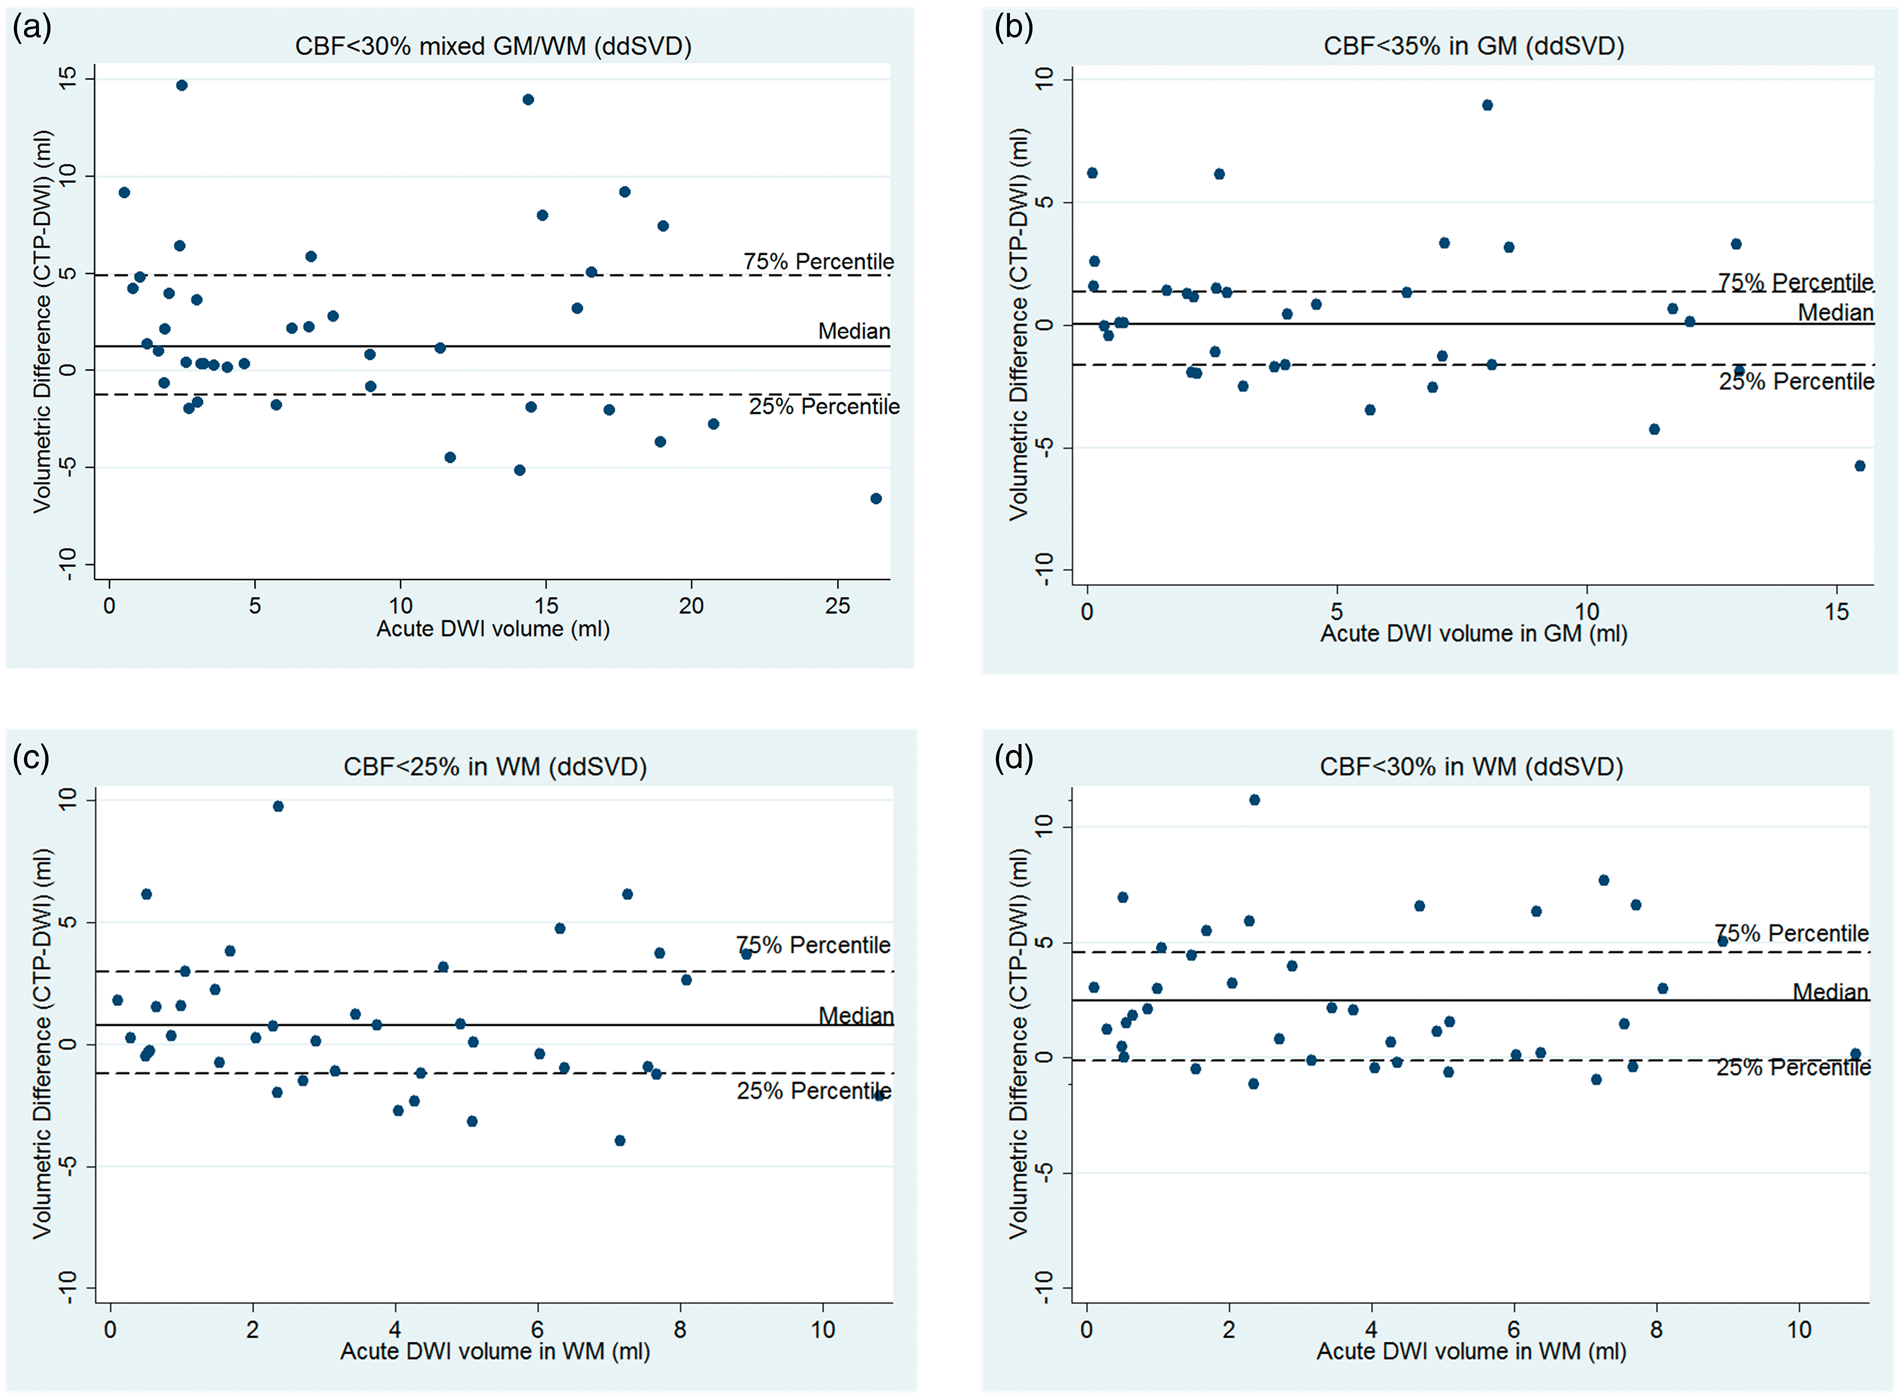
DT > 3 s was the optimal threshold to identify the perfusion lesion in GM, WM, and when measuring mixed GM/WM (Table 3). In patients with no reperfusion, there was no significant volumetric difference between the 24 h DWI and the acute CT perfusion lesion volume derived from the best threshold DT >3 s in GM, WM, nor in mixed GM/WM (P > 0.05; Table 3).
Lastly, 30 patients were scanned using the 16-slice scanner and 13 with the 320-slice scanner. No analysis identified any statistical significant difference between the scanner used and the results of the study when using scanner as an interaction term (P > 0.05).
Threshold validation with PWI
The PWI threshold results for GM/WM are consistent with the CTP threshold results (Supplementary Table 1). The optimal PWI threshold to define ischemic core was CBF <35% for GM, CBF < 25% for WM, and CBF <30% for mixed GM and WM, using the sSVD method. Next, the optimal ddSVD PWI threshold to identify ischemic core was CBF <40% for GM, CBF < 30% for WM, and CBF <35% for mixed GM/WM. The optimal PWI threshold using sSVD to define a perfusion lesion was Tmax > 5 s for GM, Tmax > 7 s for WM, and Tmax > 6 s for mixed GM and WM. Again, DT > 3 s was the optimal PWI threshold used to identify the perfusion lesion in GM, WM, and mixed GM/WM.
Discussion
We present the first comparative analyses of CT perfusion imaging thresholds for ischemia which take into account the physiological variation between hemispheric cortical GM and subcortical WM. We have demonstrated that combining hemispheric cortical GM and subcortical WM compartments in ischemic volume assessments leads to a less accurate assessment of the ischemic core when compared to segmented hemispheric cortical GM and subcortical WM tissue specific thresholds.
Separate tissue-specific ischemic core thresholds for GM and WM gave a significantly better volumetric agreement with acute DWI, regardless of whether sSVD or ddSVD was used as the algorithm to calculate perfusion values. GM had a considerably higher ischemic core threshold compared to WM, thus tissue-specific thresholds were more accurate than the whole brain threshold (which is currently widely used in clinical practice). The mixed GM/WM threshold (CBF < 25% from sSVD and CBF < 30% from sSVD) overestimated the total ischemic core. Furthermore, the application of the “best” single combined GM/WM threshold overestimated the ischemic core in WM, regardless of whether sSVD or ddSVD algorithms were applied for imaging post-processing. However, owing to the small core sizes in our cohort, we cannot say that the level of accuracy is similar in patients with a larger baseline cores (e.g. > 70 ml). Overall, our data indicate that separate tissue-specific threshold (GM vs. WM) will lead to significantly improved accuracy for ischemic core detection, and this might be especially relevant in patients with larger ischemic cores, particularly involving WM.
Interestingly, different CTP parameters were optimal for penumbral threshold detection, dependent on whether sSVD or ddSVD algorithm was used for post-processing. Additionally, although there were different optimal thresholds for GM, WM, and mixed GM/WM using sSVD (Tmax > 5 s, > 7 s, and >6 s, respectively), when using ddSVD, the same DT > 3 s was optimal for all three volumes. This indicates that it is not necessary to use different penumbral thresholds for GM and WM when using the ddSVD algorithm as the post-processing method for CTP.
The reasons for the differences in results for the sSVD vs. ddSVD are complex. In ddSVD, the tissue density curve is shifted according to the estimation of delay before SVD is performed. CBF and MTT are more stable for ddSVD than the sSVD. 13 The ddSVD method is able to accurately estimate and correct the delay and dispersion of the tracer arrival between the AIF and the brain ROI, whereas the sSVD method does not. This is particularly relevant where there is delayed arrival of contrast to the ischemic region via slow collateral flow. This is highlighted by the greater Tmax threshold for WM (compared to GM) with sSVD.
A strength of this study was the use of acute MR data to define ischemic core; this overcomes to some degree the variability caused by the edema and the spontaneous reperfusion that complicates interpretation of studies using follow-up infarct imaging. Importantly, previous work has validated the cross compatibility of perfusion CT and MRI to identify that these modalities are directly comparable which reinforces this study's direct comparison method. 15 Again, we validated the GM and WM thresholds for infarction with PWI in this study, and the variation of PWI thresholds for infarction between GM and WM was consistent with the CTP results. A potential limitation was the limited coverage of the CTP in some patients, because these data were predominantly obtained on an older generation 16-slice CT scanner. This may contribute to the quite small median acute DWI lesions observed, which would tend to lead to underestimation of any differences in ischemic core thresholds between GM and WM. Newer generation whole brain coverage CTP shows better estimates of the penumbra and core. 4 Next, while this study had a limited delay between baseline CTP and MRI acquisition, it is possible that during this time, the stroke physiology developed and the core grew which would lead to a slight overestimate of our core volume data. Furthermore, this study was only carried out in a selected group of patients with hemispheric ischemic stroke, and results are less likely to be pertinent to patients with brainstem or lacunar stroke. Imaging analysis was undertaken retrospectively and by experts in imaging post-processing to ensure that the best possible demarcation between GM and WM was available or that the data were not considered for the analysis. Although discrimination of GM from WM may be very difficult in the acute setting as isodense swelling may be observed in ischemic tissue where the boundaries are blurred meaning, there may be no measurable reduction in HU. However, we used contrast-enhanced CT (CTPSI) to assist in the enhancement between GM and WM. Additionally, the post-processing imaging software was highly effective at differentiating GM from WM, requiring minimal expert intervention.
Lastly, this study was undertaken prior to the advent of endovascular therapy being proven. It is possible that the thresholds identified in this study would be different in patients receiving endovascular treatment, which is able to achieve much more complete recanalization than intravenous thrombolysis, and of course the timing of recanalization is known. This could result in a lower threshold for ischemic infarction as detected by CTP. 21
In conclusion, the results of the current study demonstrate that hemispheric cortical GM has a higher relative CBF threshold for the ischemic core than subcortical WM in acute hemisphere ischemic stroke, in which the use of combined thresholds overestimate ischemic core volume. These differences are likely to be clinically relevant in guiding reperfusion decision-making, particularly in patients with large volumes of acute ischemia in WM, and mean that we should now use different ischemic core thresholds for GM and WM. We also showed that there are different Tmax thresholds needed to detect the perfusion lesion in GM and WM using sSVD. However, it is unclear if this may be clinically relevant given the small volume difference. Notably, a single delay-corrected threshold (DT) using ddSVD was able to accurately quantify the acute perfusion lesion for both GM and WM and showed a smaller volume difference than was seen with the two different Tmax thresholds needed for GM and WM using sSVD. Overall, we have shown that the use of separate GM and WM thresholds may provide more accurate volumes for ischemic core estimations, and that ddSVD may be a more robust method to use to quantify infarct core and penumbra.
Footnotes
Funding
The author(s) disclosed receipt of the following financial support for the research, authorship, and/or publication of this article: Neil J Spratt was supported by a co-funded Australian National Health and Medical Research/National Heart Foundation Career Development/Future Leader Fellowship APP1110629/100827.
Declaration of conflicting interests
The author(s) declared no potential conflicts of interest with respect to the research, authorship, and/or publication of this article.
Authors' contributions
Chushuang Chen performed the analysis, drafted the paper, made critical revisions, and approved the final version. Andrew Bivard supported in gathering study data, study conception, analysis design, and made critical revisions. Longting Lin and Mark W Parsons gathered study data, made critical revisions, and approved the final version. Christopher R Levi and Neil J Spratt made critical revisions and approved the final version.
References
Supplementary Material
Please find the following supplemental material available below.
For Open Access articles published under a Creative Commons License, all supplemental material carries the same license as the article it is associated with.
For non-Open Access articles published, all supplemental material carries a non-exclusive license, and permission requests for re-use of supplemental material or any part of supplemental material shall be sent directly to the copyright owner as specified in the copyright notice associated with the article.