
Abstract
Ischemic stroke triggers an elevation in tonic GABA inhibition that impairs the ability of the brain to form new structural and functional cortical circuits required for recovery. This stroke-induced increase in tonic inhibition is caused by impaired GABA uptake via the glial GABA transporter GAT3, highlighting GAT3 as a novel target in stroke recovery. Using a photothrombotic stroke mouse model, we show that GAT3 protein levels are decreased in peri-infarct tissue from 6 h to 42 days post-stroke. Prior studies have shown that GAT substrates can increase GAT surface expression. Therefore, we aimed to assess whether the GAT3 substrate,
Introduction
Stroke is a leading cause of disability and death with patients exhibiting varied levels of functional recovery. 1 Despite this, no pharmacological treatment options exist to promote functional recovery, beyond the use of remedial therapies. The tissue region surrounding the infarct, the peri-infarct, is a structurally intact but functionally impaired region critical for recovery. Targeting this region can facilitate plasticity and cortical remapping resulting in the formation of new structural and functional circuits between related cortical regions.2–4 The process of plasticity is highly influenced by GABAA receptor signaling and tonic GABA-mediated inhibition, which maintains and shapes the level of neuronal excitability and facilitates the remapping of brain regions.5–8 Accordingly, alterations in GABAergic signaling and tonic inhibition are triggered by an ischemic stroke in both animals and humans.6,8–10 Of particular importance, dampening extrasynaptic α5-containing GABAA receptors from three to seven days post-stroke and onwards, but not acutely within hours, increases motor functional recovery in animal stroke models.6,11 Further, these studies parallel observations in human patients where functional recovery correlates with decreased GABAergic signaling.10,12
Although GABA agonists have failed to translate into positive clinical outcomes promoting neuroprotection in humans, 13 GABA modulation, and in particular tonic inhibition, has attracted new attention as a putative approach for promoting recovery during the sub-acute phase (3–7 days) after ischemia.6,8,11,14,15 Interventions targeting the sub-acute phase offers a much broader therapeutic window than the thrombolytic treatment by tissue plasminogen activator (t-PA), 16 and most if not all patients will have been assessed and available to receive the treatment. 17 Recent clinical advances have confirmed that decreasing tonic inhibition by inhibiting α5-containing GABAA receptors results in an increase in cortical excitability. 15 We now await outcomes from phase 2 trials to confirm if, indeed, such treatments promote neural repair post stroke.18,19
Tonic inhibition is in most cases regulated at the GABAA receptor level and little attention has been given to GABA transporters (GATs),
14
which can regulate ambient GABA levels and hence affect tonic inhibition.6,20–22 The glial GABA transporter, GAT3, has previously been suggested to contribute to an increase in tonic inhibition, as after stroke there is decreased expression and impairment of GAT3 function. By contrast, GAT1, the most abundant GAT in the brain, displays unaffected expression and function.6,8,23 Therefore, GAT3 could be a target for regulating tonic inhibition in ischemic stroke. An alternative approach to using GAT inhibitors is to use substrate inhibitors for GATs, which have been reported to increase GABA uptake in neuronal and glial cultures via an increase in the surface expression of GAT1 and GAT3, respectively.
24
We report here that a delayed chronic administration of the GAT3 substrate,
Material and methods
In vitro studies
Materials
DNA encoding the human taurine transporter (TauT) was kindly provided by Dr. Nanna MacAulay (University of Copenhagen, Denmark). Dr. Robert J Vandenberg (University of Sydney, Australia) generously provided DNA constructs encoding the human glycine transporters, GlyT1 and GlyT2. Human creatine transporter (CreaT) DNA was purchased from Origene (Rockville, MD, USA). All were subcloned into the pUNIV vector (Addgene, Cambridge, MA, USA) as described earlier. 26
Cell cultures and transfection
Mouse and human GATs were stably expressed in HEK-293 and CHO cells, respectively, and tsA201 cells were cultured as described previously. 27 tsA201 cells were transfected with plasmid DNA (8 µg per 10 cm dish) encoding human GAT3-pcDNA5/FRT, 28 human GAT3 epitope-tagged extracellularly with the hemagglutinin (HA) (GAT3-HA) 29 and human TauT, 26 using 40 µl PolyFect transfection reagent according to the manufacturer’s protocol (Qiagen, West Sussex, UK).
Cortical astrocytes were isolated from one- to two-day-old NMRI mice (Janvier Labs, Le Genest-Saint-Isle, France) using the neuronal tissue dissociation Kit (P) and anti-ACSA-2 Microbead Kit according to manufacturer’s protocols (MACS Miltenyi Biotec, Lund, Sweden) and cultured as described previously. 26
In vitro competition uptake of L -isoserine at recombinant SLC6A transporters
The [3H]GABA competition uptake assay at mouse and human GATs and in cortical astrocyte cultures was performed as previously described.26–28 Cortical astrocyte cultures were pre-incubated prior to the [3H]GABA assay with compounds diluted in Hank’s Balanced Salt Solution (HBSS) supplemented with 20 mM HEPES, 1 mM CaCl and 1 mM MgCl, 0.1% DMSO (pH 7.4) for 60 min at 37℃ in a humidified incubator with 5% CO2.
Further, Xenopus laevis oocytes recombinantly expressing related SLC6A members, including GlyT1, GlyT2, TauT and CreaT, were also used to assess the specificity for the GATs. 26 [3H]taurine competition uptake assay was performed at human TauT transiently expressed in tsA201 cells following the protocol for the [3H]GABA competition uptake assay described previously27,28 with the exception of exchanging [3H]GABA with 22 nM [3H]taurine for 5 min.
The FLIPR® membrane potential assay
The FMP assay was performed as previously described. 27
[3H]Muscimol binding
The assay of [3H]muscimol binding to the GABAA receptors was performed as previously described. 30
GAT3 surface expression in vitro
Surface expression of GAT3-HA upon pre-incubation with GAT3 compounds was determined using an ELISA against the HA-epitope. tsA201 cells recombinantly expressing GAT3 was used to ensure that there was a significant difference in the signal between GAT3-HA and GAT3 on the day of assay. Cells were washed with HBSS supplemented with 20 mM HEPES, 1 mM CaCl and 1 mM MgCl (pH 7.4) (HBSS-HEPES) and incubated with compounds diluted in HBSS-HEPES to study the effect of 5 to 120 min pre-incubation and in growth media to study the effect of the compounds following 24 and 48 h pre-incubation, at 37℃ in a humidified incubator with 5% CO2. The cells were fixed with 4% PFA, and 0.05% Triton X-100 was added when the total pool of GAT3-HA (intracellular pool and surface fraction) was determined. The cells were blocked for 60 min in 3% skim milk, incubated 45 min at room temperature (RT) with anti-HA (anti-HA.11, 1:1000, BioLegend, San Diego, CA, USA), washed and incubated with a HRP-conjugated antibody (anti-mouse, 1:1500, P0447, Dako, Glostrup, Denmark) for 45 min at RT. SuperSignal™ ELISA Femto substrate (ThermoFisher Scientific, Waltham, MA USA) was added with PBS, and chemiluminescence was measured on an EnSpire2300 Multilabel Reader (PerkinElmer, Waltham, MA, USA). Chemiluminescence is depicted as a percentage of the control response.
MTT assay
The viability of the compound-treated tsA201 cells expressing GAT3-HA was tested using MTT. Compound-treated cells were incubated with 0.5 mg/ml MTT for 2 h at 37℃ in a humidified incubator with 5% CO2 and solubilized with isopropanol before reading the absorbance at 550 nm on an EnSpire2300 Multilabel Reader (PerkinElmer).
Slice preparation
Slices were prepared from C57BL/6 J male mice (Janvier Labs, Le Genest-Saint-Isle, France) aged 5 ± 1 weeks and dissected as described earlier 31 with minor modifications in the carbonated bicarbonate buffer, with the composition (mM): NMDG (100), NaCl (26), KCl (2.5), NaH2PO4 (1.25), Glucose (10), CaCl2 (1), MgCl2 (3), NaHCO3 (26), kynurenate (1), ascorbate (0.3) and pyruvate (0.1). Slices were stored in regular carbonated artificial cerebrospinal fluid (ACSF) at 28–29℃ (composition as above, with NMDG replaced by NaCl and without kynurenate) and used for recordings in the period of 1–5 h after cutting.
Whole-cell patch-clamp electrophysiology
In the recording chamber, slices were perfused at a speed of 2.8–3 mL/min with a modified carbonated ACSF at 33–34℃ and osmolarity adjusted to 310 ± 3 mOsm. Recording ACSF contained in addition to storage ACSF: kynurenate (1 mM), CGP54626 (1 µM), atropine (1 µM), TTX (0.5 µM), strychnine (1 µM), A804598 (1 µM), GABA (1 µM). Pyramidal neurons in layer 2/3 of the cingulate cortex were visually identified under IR video-microscopy and recorded from using borosilicate pipettes (1.5/1.1 OD/ID mm) with a CsCl-based intracellular solution of the composition (mM): CsCl (135), NaCl (4), MgCl2 (2), EGTA (1), HEPES (10), ATP (2), GTP (0.5), TEA (5), QX-314 (5), adjusted to pH 7.2 and 292 ± 3 mOsm. Recording electrodes had a resistance of 5–8 MOhm in this solution and recording of baseline activity began 6–7 min after establishing the whole cell configuration. Recordings were made using a Multiclamp 700A amplifier (Axon, Molecular Devices, Sunnyvale, CA, USA), digitized at 10 kHz on a 1322 digidata (Molecular Devices) and filtered at 3 kHz (8-pole Bessell). After stable baseline was obtained, recordings consisted of 3 min baseline, 6 min of NO-711, 6 min of
Recordings were analyzed in pClamp/Clampfit and Origin 9 (Molecular Devices). Holding current was assessed in a 60 s interval at the end of each baseline and drug period as the center of a single Gaussian of points sampled at a 100 Hz frequency. Differences in tonic current upon drug perfusion are depicted as difference in holding current relative to baseline and normalized to neuron capacitance. Data are based on recordings from 8 cells/8 slices from four animals.
In vivo and ex vivo studies
Animals and surgical procedures
All in vivo procedures described in this study were carried out in accordance with guidelines on the care and use of laboratory animals set out by the University of Otago, Animal Research Committee and the Guide for Care and Use of Laboratory Animals (NIH Publication No. 85-23, 1996). All in vivo studies were approved by the University of Otago Animal Ethics Committee and are reported according to the ARRIVE (Animal Research: Reporting In Vivo Experiments) guidelines.
Focal stroke was induced by photothrombosis in young (2–4 months old) male C57BL/6J mice (Hercus Taieri Research Unit, Dunedin, New Zealand) weighing approximately 25–29 g as previously described. 6 Under isoflurane anesthesia (2–2.5% in O2), mice were placed in a stereotactic apparatus, the skull exposed through a midline incision, cleared of connective tissue and dried. A cold light source (KL1500 LCD, Zeiss) attached to a 40× objective giving a 2 mm diameter illumination was positioned 1.5 mm lateral from Bregma and 0.2 ml Rose Bengal solution (10 g/L in normal saline, i.p.: Sigma-Aldrich) was administered. After 5 min, the brain was illuminated through the intact skull for 15 min, while keeping body temperature at 37.0 ± 0.3℃ by a heating pad (Harvard apparatus, Holliston, MA, USA).
Mice were housed under a 12 h light/dark cycle with ad libitum access to food and water. All animals (36 in total) were randomly assigned to a treatment group five days post-stroke (sham + vehicle (n = 6) and sham +
Compound administration and processing of tissue
A micro-osmotic pump (model 1004, administration for 28 days at 0.11 µl per hour, Alzet, Cupertino, CA, USA) was connected to a cannula, placed directly into the infarct, and was implanted on the back of the mice on day 5 post-stroke.
Behavioral assessment
Recovery of forelimb motor function was determined by the cylinder and grid-walking tasks to assess their exploratory behavior and walking, respectively, as previously reported. 6 The mice were tested approximately seven days prior to stroke to establish a baseline performance level and then after 7, 14, 28 and 42 days post-stroke at approximately the same time each day. Observers blinded to the treatment group scored behaviors as previously described. 6
Immunofluorescent labeling of GAT3 and GFAP and infarct volume
Immunofluorescent labeling of GAT3 and GFAP was performed 42 days post stroke. Brain sections, every sixth section through the stroke with a thickness of 30 µm, were rinsed in tris buffered saline (TBS) and transferred to 1% sodium tetraborate in TBS for 20 min at RT. The sections were blocked for 60 min in TBS containing 5% goat and donkey serum with 0.3% Triton X-100 and incubated in TBS with 2% goat and donkey serum and 0.3% triton X-100 containing primary polyclonal antibodies (rabbit anti-mouse GAT3, 1:100, AB1574 and chicken anti-mouse GFAP, 1:3000, AB5541, Millipore, Darmstadt, Germany) for 24–48 h at 4℃. The rinsed sections were incubated for 2 h at RT in the dark in TBS with 2% normal serum and 0.3% triton X-100 containing appropriate fluorescent secondary antibodies (anti-rabbit 1:1000, 711-485-152, Abacus ALS, Auckland, New Zealand; anti-chicken 1:1000, SA5-10071, ThermoFisher Scientific) and nuclear stained in Hoechst (1:1000, Sigma-Aldrich) in TBS for 5 min at RT. Images were taken with an Olympus BX61 microscope, and two sections from each animal were included in the analysis. Changes in GAT3 intensity/cell and GFAP staining were investigated at day 42 post-stroke in layers 2/3 and 5 in the peri-infarct and 400 µm and 800 µm from the peri-infarct in 6 squares of 90 × 180 µm. Using the software FIJI Image J (National Institutes of Health, USA), the integrated density value (IDV) was measured in all six regions of interest (ROIs) on duplicate slides across the three channels. Using the blue channel, a selection of at least 10 representative nuclei in the ROI were outlined and measured for integrated density. Dividing the blue channel IDV of each ROI by the mean nucleus IDV gives the average number of cells present in each ROI. The fluorescent intensity of the GAT3 is expressed as a per cell measure by dividing the IDV of each ROI by its respective average cell number. GFAP staining is expressed as IDV only. Infarct volumes were determined 42 days post-stroke using cresyl violet staining and Image J analysis by an observer blinded to the treatment groups.
6
The analysis is based on obtaining measurements from every sixth section through the entire infarct (area in mm2), and infarct volume was quantified as follows: infarct volume mm3
GAT3 Western blotting
Another group of C57BL/6J male mice (2–4 months old) were subjected to a photothrombotic stroke as described to investigate GAT3 expression in naïve animals and animals subjected to stroke. The animals were sacrificed by a pentobarbital overdose, followed by rapid extraction of the brain after 1, 3 and 6 h and 1, 3, 7, 14 and 28 days post-stroke, to determine the temporal change in GAT3 levels compared to sham operated mice. The brains were cut on a cryostat (CM1860, Leica) at −20℃ from anterior to posterior, and the top quadrant of the left hemisphere containing the peri-infarct and surrounding tissue were collected. Protein was purified using RIPA-buffer supplemented with cOmplete™ and homogenized using a bullet blender.
Western blotting was performed using the NuPAGE® system from Invitrogen (Carlsbad, CA, USA). Protein samples mixed with 2× Laemmli with 0.1 M DTT were sonicated for 5–10 s and left at RT for 10 min before loading. Ten micrograms of protein was loaded in 4–12% Bis-Tris gels and separated by SDS PAGE for 60 min at 170–180 V. The gel was blotted on a PVDF membrane (ThermoFisher Scientific) at 25–30 V for 60 min. The rinsed membranes were blocked 60 min in TBS containing 5% skimmed milk. The top part of the membranes was incubated with blocking buffer containing the polyclonal GAT3 antibody (rabbit anti-mouse GAT3, 1:1000, AB1574, Millipore) and the bottom part of the membranes with the monoclonal glyceraldehyde 3-phosphate dehydrogenase (GAPDH) antibody (mouse anti-mouse GAPDH, 1:12000, NB600-502SS, Biologicals, Littleton, CO, USA) overnight at 4℃. The rinsed membranes were incubated with appropriate HRP-conjugated secondary antibodies (anti-rabbit, 1:2000, A16096, ThermoFisher Scientific; anti-mouse, 1:2000, P0447, Dako) for 60 min at RT, rinsed and incubated with Amersham™ ECL™ Prime Western Blotting Detection Reagent (GE Healthcare Biosciences, Pittsburg, PA, USA) for 4 min prior to the detection of chemiluminescence using FlourChem® HD2 (Alpha Innotech, San Leandro, CA, USA). Image J was used to quantify optical density using GAPDH as a reference, which was unaffected by the stroke and stably expressed at all time points. Each group contained 5–6 animals with 1–2 technical replicates.
Statistical analysis
All statistical analyses were performed using GraphPad Prism (version 7.0c, San Diego, CA, USA). One-way and two-way ANOVA followed by Dunnett’s multiple comparison test and unpaired t-test were used when as appropriate and specified accordingly. P < 0.05 was considered statistically significant.
Group sizes for the behavioral analysis were determined by power analysis calculations using the G Power Software (version 3.1.5) based on data obtained previously in the grid-walking and cylinder tasks.6,32,33 The following parameters: α = 0.05, effect size = 1.5, two-sided for behavioral experiments were used. To ensure a power >80%, we included six animals in each of the two sham groups and 6-8 animals in each of the stroke groups.
Results
GAT3 protein expression levels are decreased in the peri-infarct and surrounding region
Previous studies have shown that GAT3 protein levels are decreased in the peri-infarct cortex after a photothrombotic stroke to the motor cortex coinciding with an increase in tonic inhibition.6,8 To extend the regional and temporal pattern of GAT3 expression after stroke, we examined GAT3 protein expression in the peri-infarct cortex of mice after a photothrombotic stroke to the forelimb motor cortex. Using Western blotting, we found that the GAT3 protein expression decreased in the peri-infarct cortex and surrounding tissue from 1 h onwards, reaching a significant reduction by 6 h, with a maximal decrease in expression (46% decrease) observed seven days post-stroke (Figure 1(a) and (b)). A small non-significant decrease in expression was observed at 14 and 28 days post-stroke. For the Western blotting, we isolated the top quadrant of the brain containing the peri-infarct and surrounding tissue (Figure 1(b)). As a result, we were not able to assess region-specific changes in GAT3 expression, which could also be masked given the way the tissue was collected. Thus, to more accurately assess the GAT3 expression specifically in the peri-infarct cortex and subsequent regions, we investigated immunofluorescent staining of GAT3 42 days post-stroke in layers 2/3 and 5 in the peri-infarct and 400 µm and 800 µm away from the peri-infarct region. We show that the photothrombotic stroke induced long-lasting effects after 42 days primarily in the peri-infarct cortex, where the GAT3 expression was significantly decreased by 48% and 63% in layers 2/3 and 5, respectively (GAT3 intensity/cell: sham + vehicle vs. stroke + vehicle, layer 2/3: 2436 vs. 1253 and layer 5: 3916 vs. 1445), as well as in the subsequent regions in layer 5 by 28–41% (GAT3 intensity/cell: sham + vehicle vs. stroke + vehicle, 400 µm: 3733 vs. 2211 and 800 µm: 3439 vs. 2463) (Figure 1(c)). Although GAT3 protein expression levels determined by Western blotting were not different from sham levels after 14 days, it is clear from the immunofluorescent staining of GAT3 that a stroke to the motor cortex did indeed induce long-lasting decreases in GAT3 expression. These long-lasting changes in GAT3 were mainly in the peri-infarct region up to 800 µm away from the infarct and may very well affect the tonic currents in these given regions accordingly as long as 42 days post-stroke.
Temporal changes in GAT3 expression in the peri-infarct region and surrounding tissue after a photothrombotic stroke to the motor cortex in male mice. (a) Western blotting data showing that GAT3 expression decreased significantly from 6 h to 7 days post-stroke including the depiction of the outlined region isolated for Western blotting containing the peri-infarct and surrounding tissue (black box). (b) Representative Western blots of GAT3 and GAPDH. One-way ANOVA followed by Dunnett’s multiple comparison test comparing sham to the different time points post-stroke. *P < 0.05, **P < 0.01, ***P < 0.001 (n = 6 for sham and 1, 3 and 6 h and 1, 14 and 28 days, n = 5 for 3 and 7 days). (c) GAT3 intensity/cell 42 days post-stroke in the peri-infarct region and +400 µm and +800 µm from the peri-infarct in layers 2/3 and 5 (see Figure 4(a)). GAT3 intensity/cell was significantly decreased in the peri-infarct in layers 2/3 and 5 and outside the peri-infarct in layer 5, but not in layer 2/3. Two-way ANOVA with stroke and region as independent factors and region as repeated measures followed by Dunnett’s multiple comparison test comparing sham + vehicle to stroke + vehicle in the specific regions. **P < 0.01, ***P < 0.001 (n = 6). Box plot (boxes, 25–75%; whiskers, minimum and maximum; lines, median).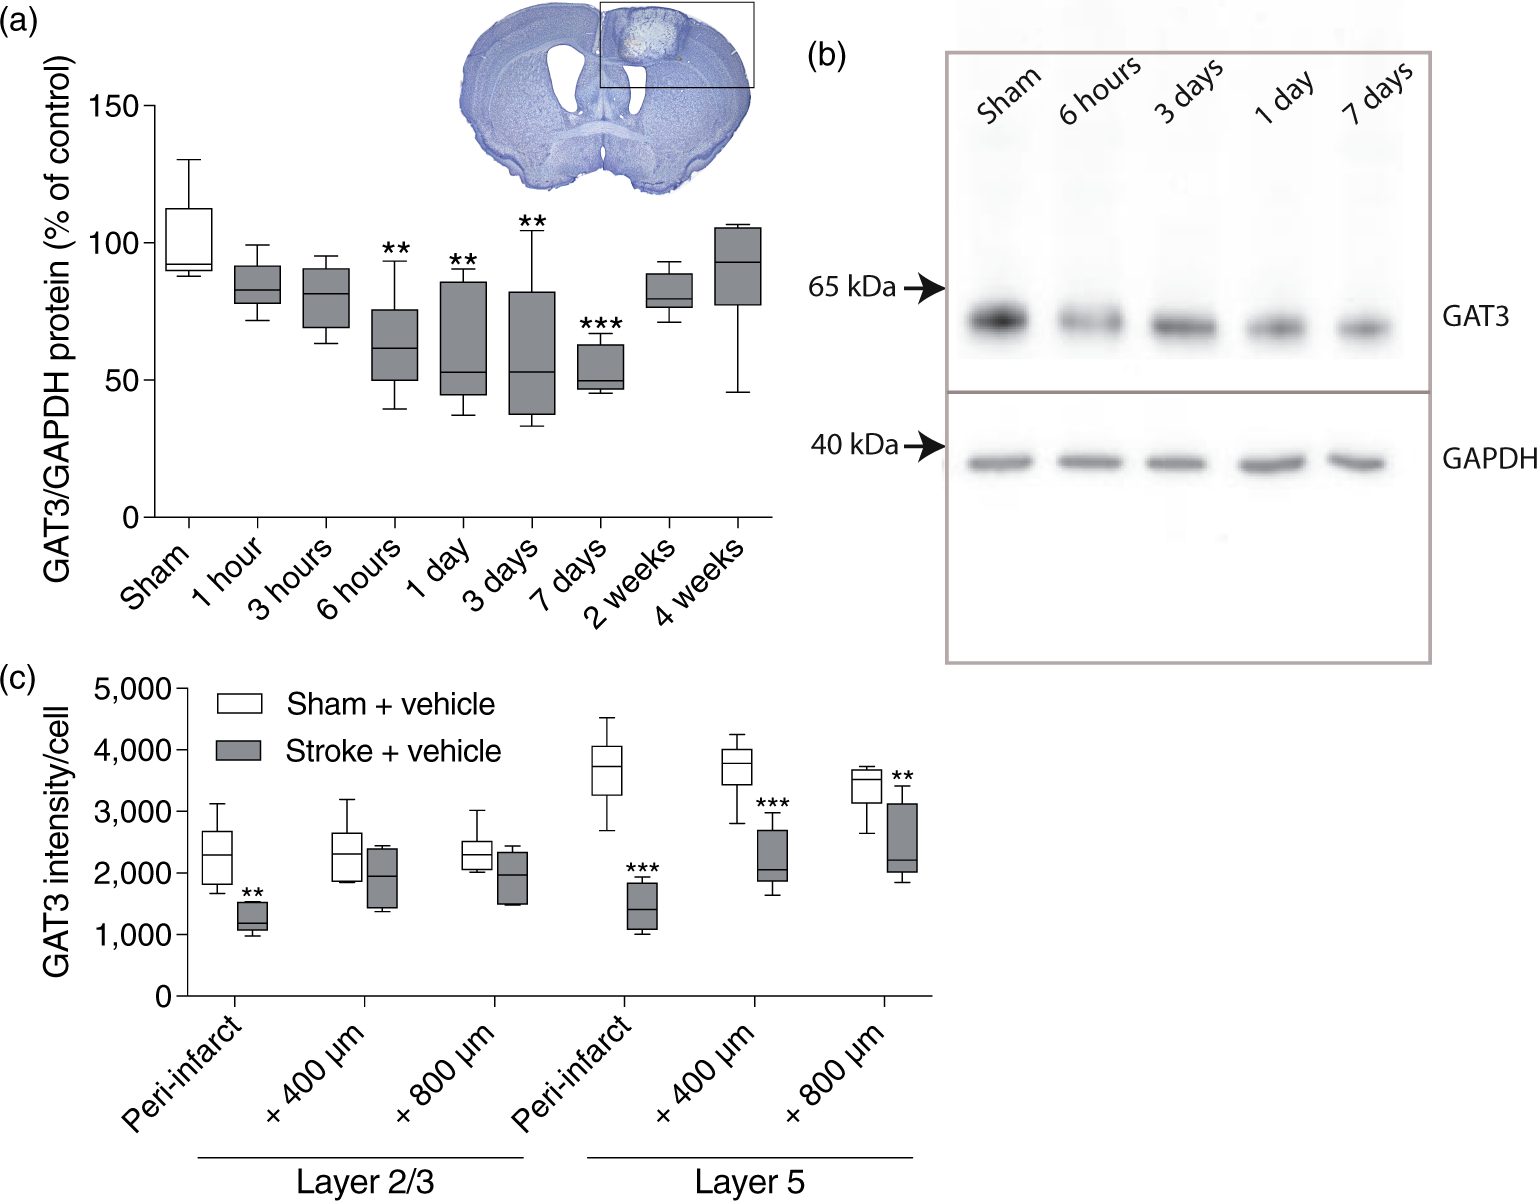
In vitro characterization of the GAT3 substrate L-isoserine
Supported by our findings in Figure 1, impaired GAT3-mediated uptake leads to a chronic increase in tonic inhibition in the peri-infarct cortex hindering functional recovery.
6
Previous studies have shown that GAT substrates can enhance GABA uptake in neuronal and glial cultures via an increase in the surface expression of GAT1 and presumably also GAT3.24,34,35 The only GAT3 substrates currently available are
The GAT2/3 inhibitor (S)-SNAP-5114 has been shown to increase tonic inhibition,6,21,22,38 while the effect of a GAT3 substrate inhibitor on tonic currents is unknown. To confirm that GAT3 interaction leads to modulation of tonic inhibition in cortex, we tested the effect of Tonic currents in pyramidal neurons in layer 2/3 and the effect of 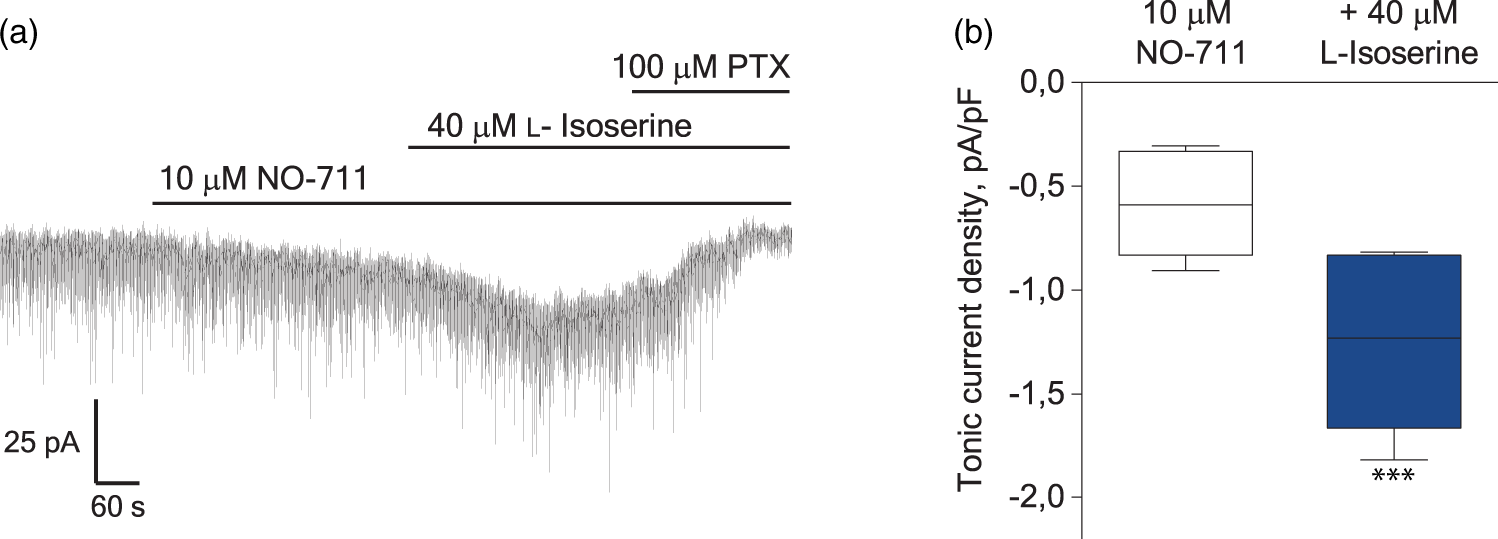
Due to the structural resemblance of
The GAT3 substrate L -isoserine increases post-stroke recovery
Having verified that GAT3 expression is subjected to long-lasting changes following an ischemic stroke, we wanted to investigate the modulatory role of GAT3 in stroke recovery using Motor function pre-op (before) and 7, 14, 28 and 42 days after a photothrombotic stroke and infarct volume. Motor function was assessed by analyses of (a) foot faults and (b) forelimb asymmetry in the grid-walking and cylinder tasks, respectively. Significant forelimb deficits (P < 0.001), contralateral to the hemisphere with stroke, were observed for at least 42 days post-stroke on both behavioral tasks. Chronic treatment with the high concentration of 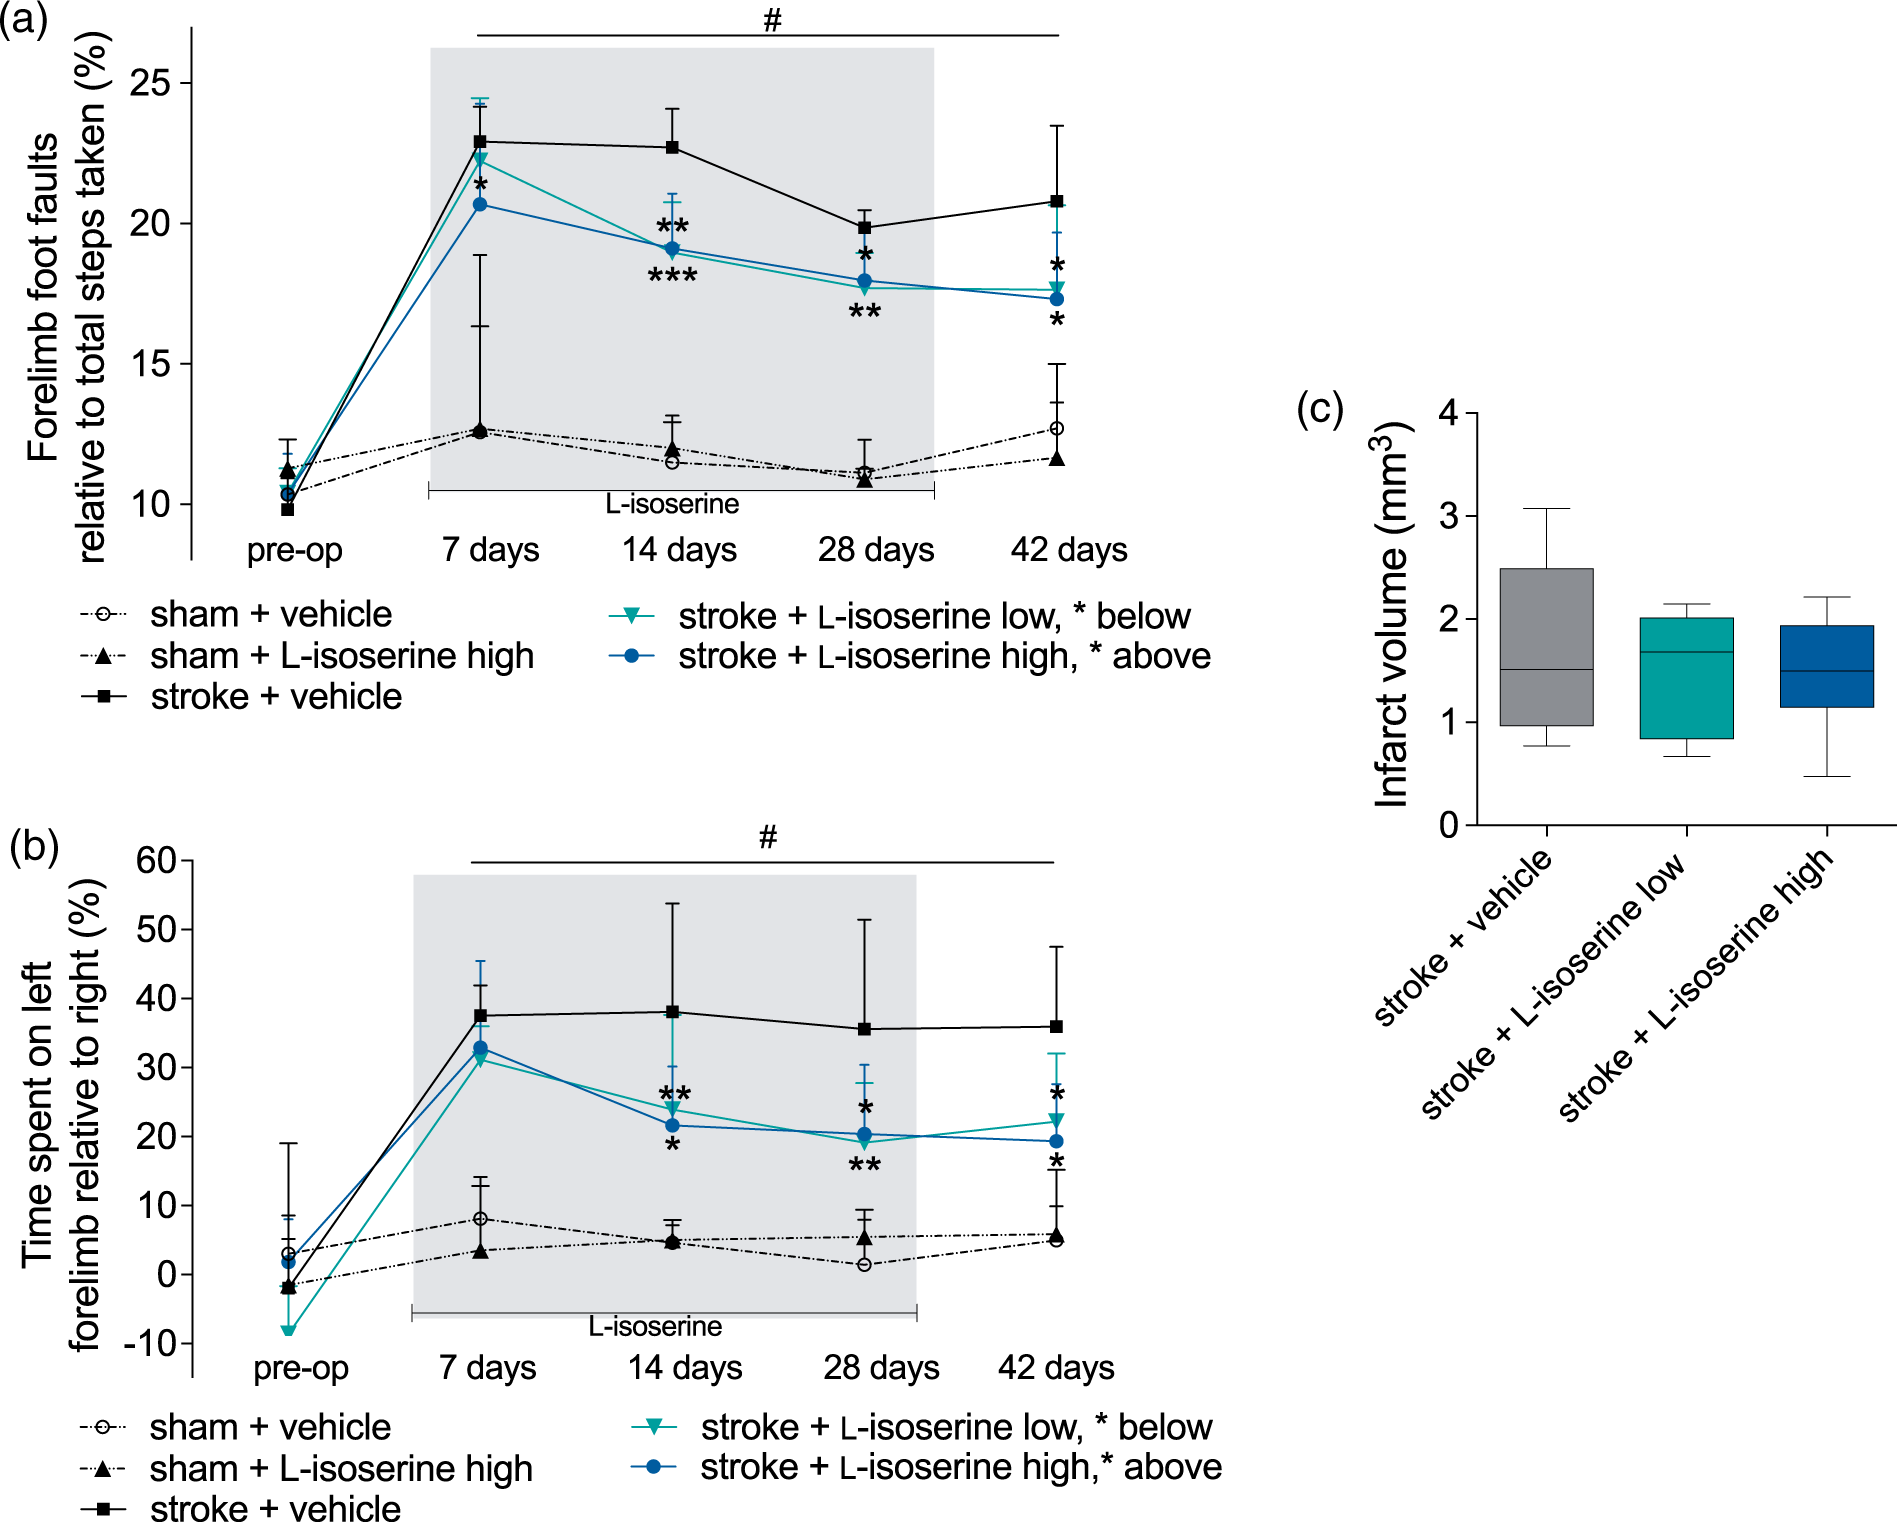
L -Isoserine increases the GAT3 intensity/cell outside the peri-infarct region
To investigate whether GAT3 intensity/cell and GFAP expression 42 days post-stroke. (a) Representative staining of GAT3 and GFAP and the six squared regions, where the GAT3 intensity/cell and GFAP intensity were determined; peri-infarct (1 and 4) and 400 µm (2 and 5) and 800 µm (3 and 6) from the peri-infarct in layers 2/3 and 5, respectively. (b) 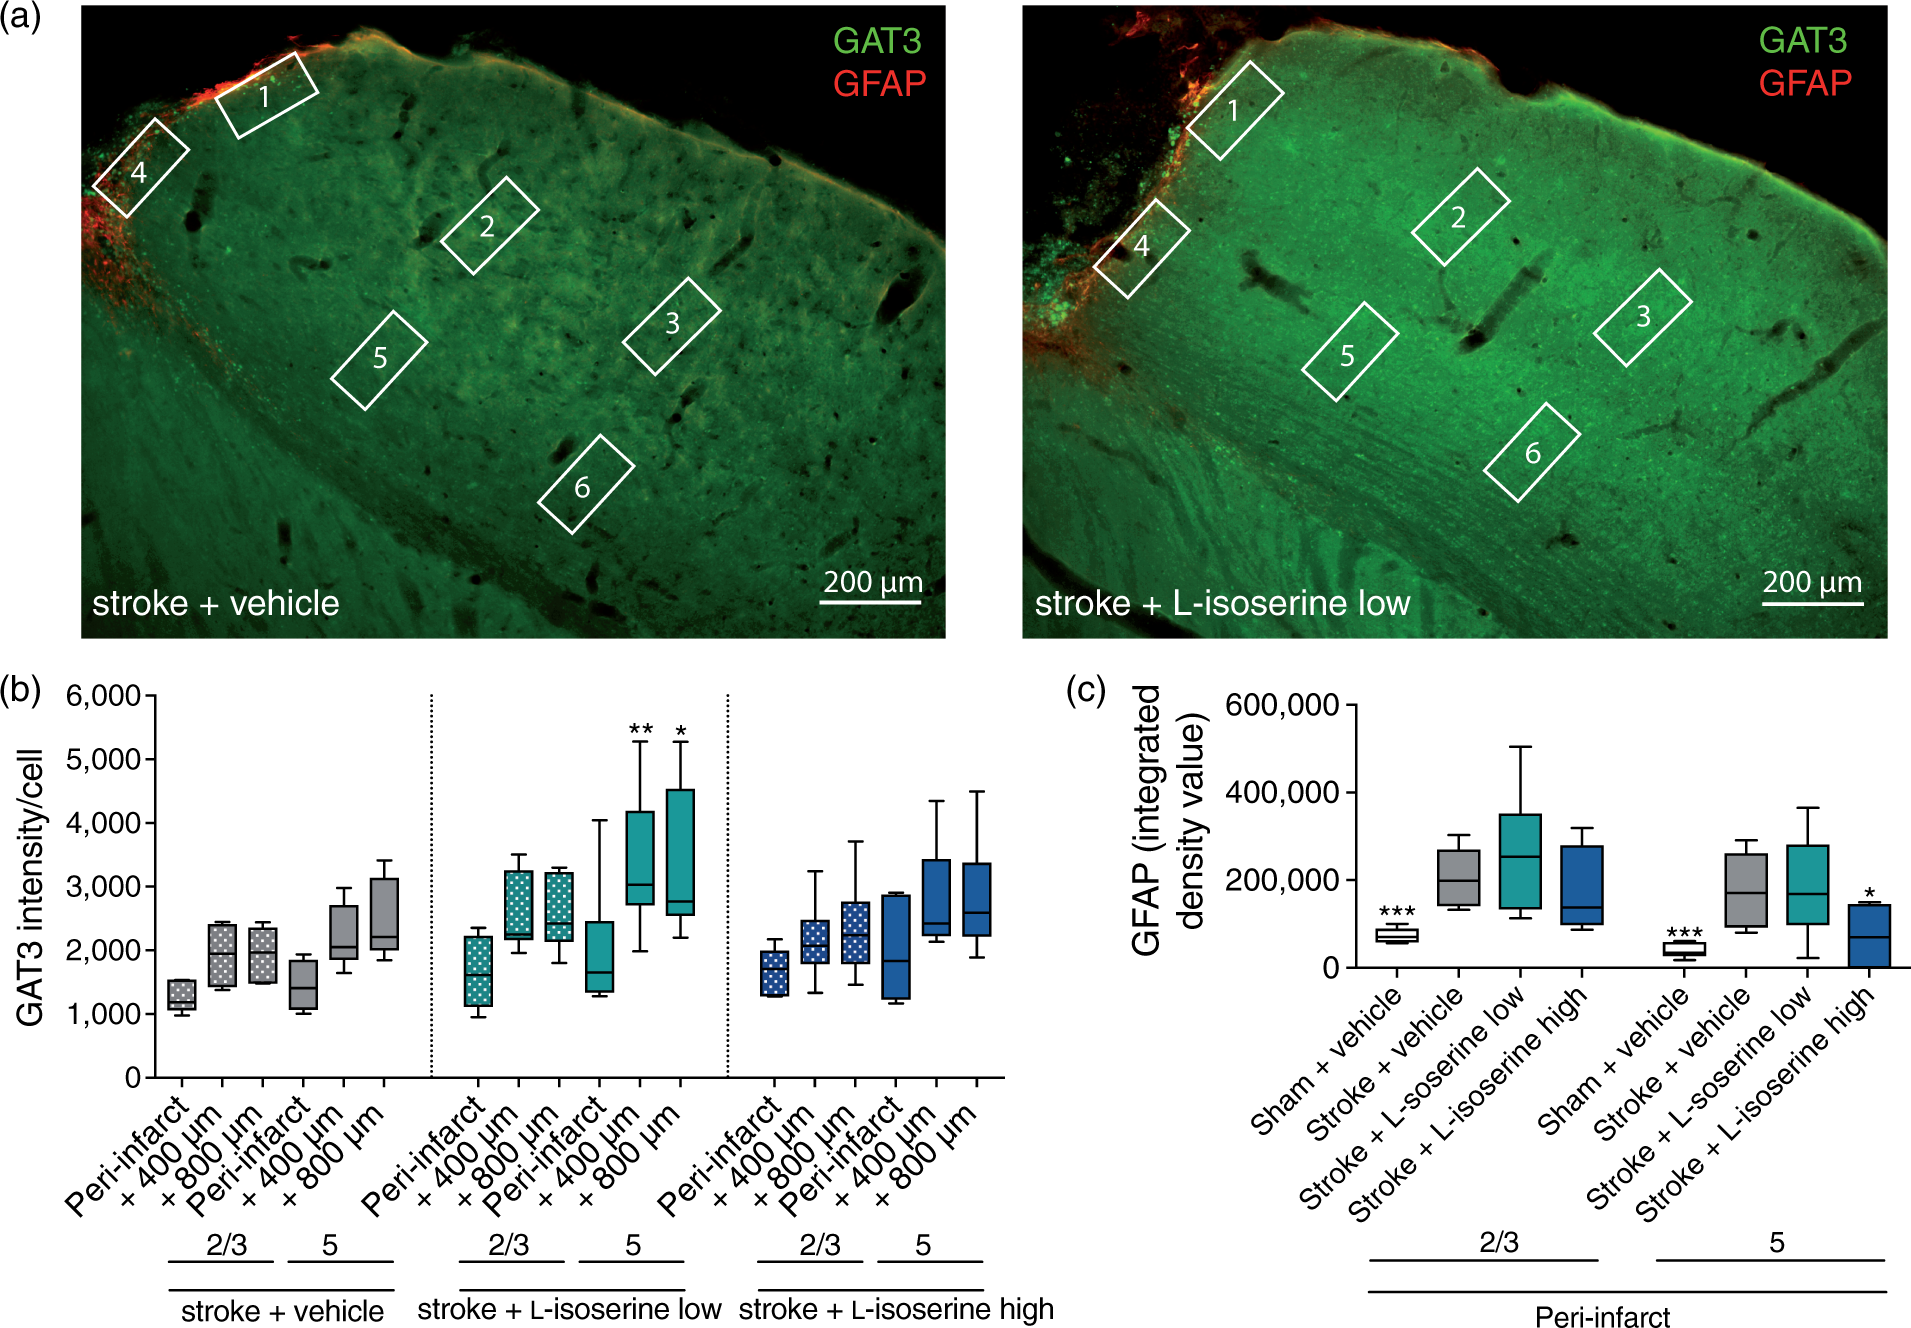
With immunofluorescent GAT3 staining, we studied the effect of Total [3H]GABA uptake in cortical astrocyte cultures. Pre-incubation (60 min) with 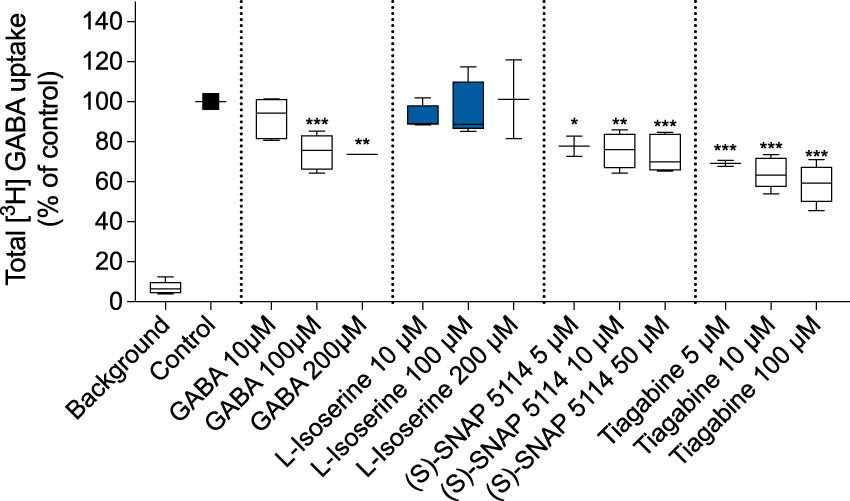
To investigate if the surface expression of GAT3, which, in large, dictates ambient GABA levels in vivo, is modulated by GAT3 surface expression in tsA201 cells recombinant expressing GAT3-HA and their corresponding cell viability. (a to c) The surface expression of GAT3-HA was assessed by ELISA, (d to f), while cell viability after pre-incubation at different time points with the compounds was assessed by MTT. (a to c) 5 min to 48 h pre-incubation with 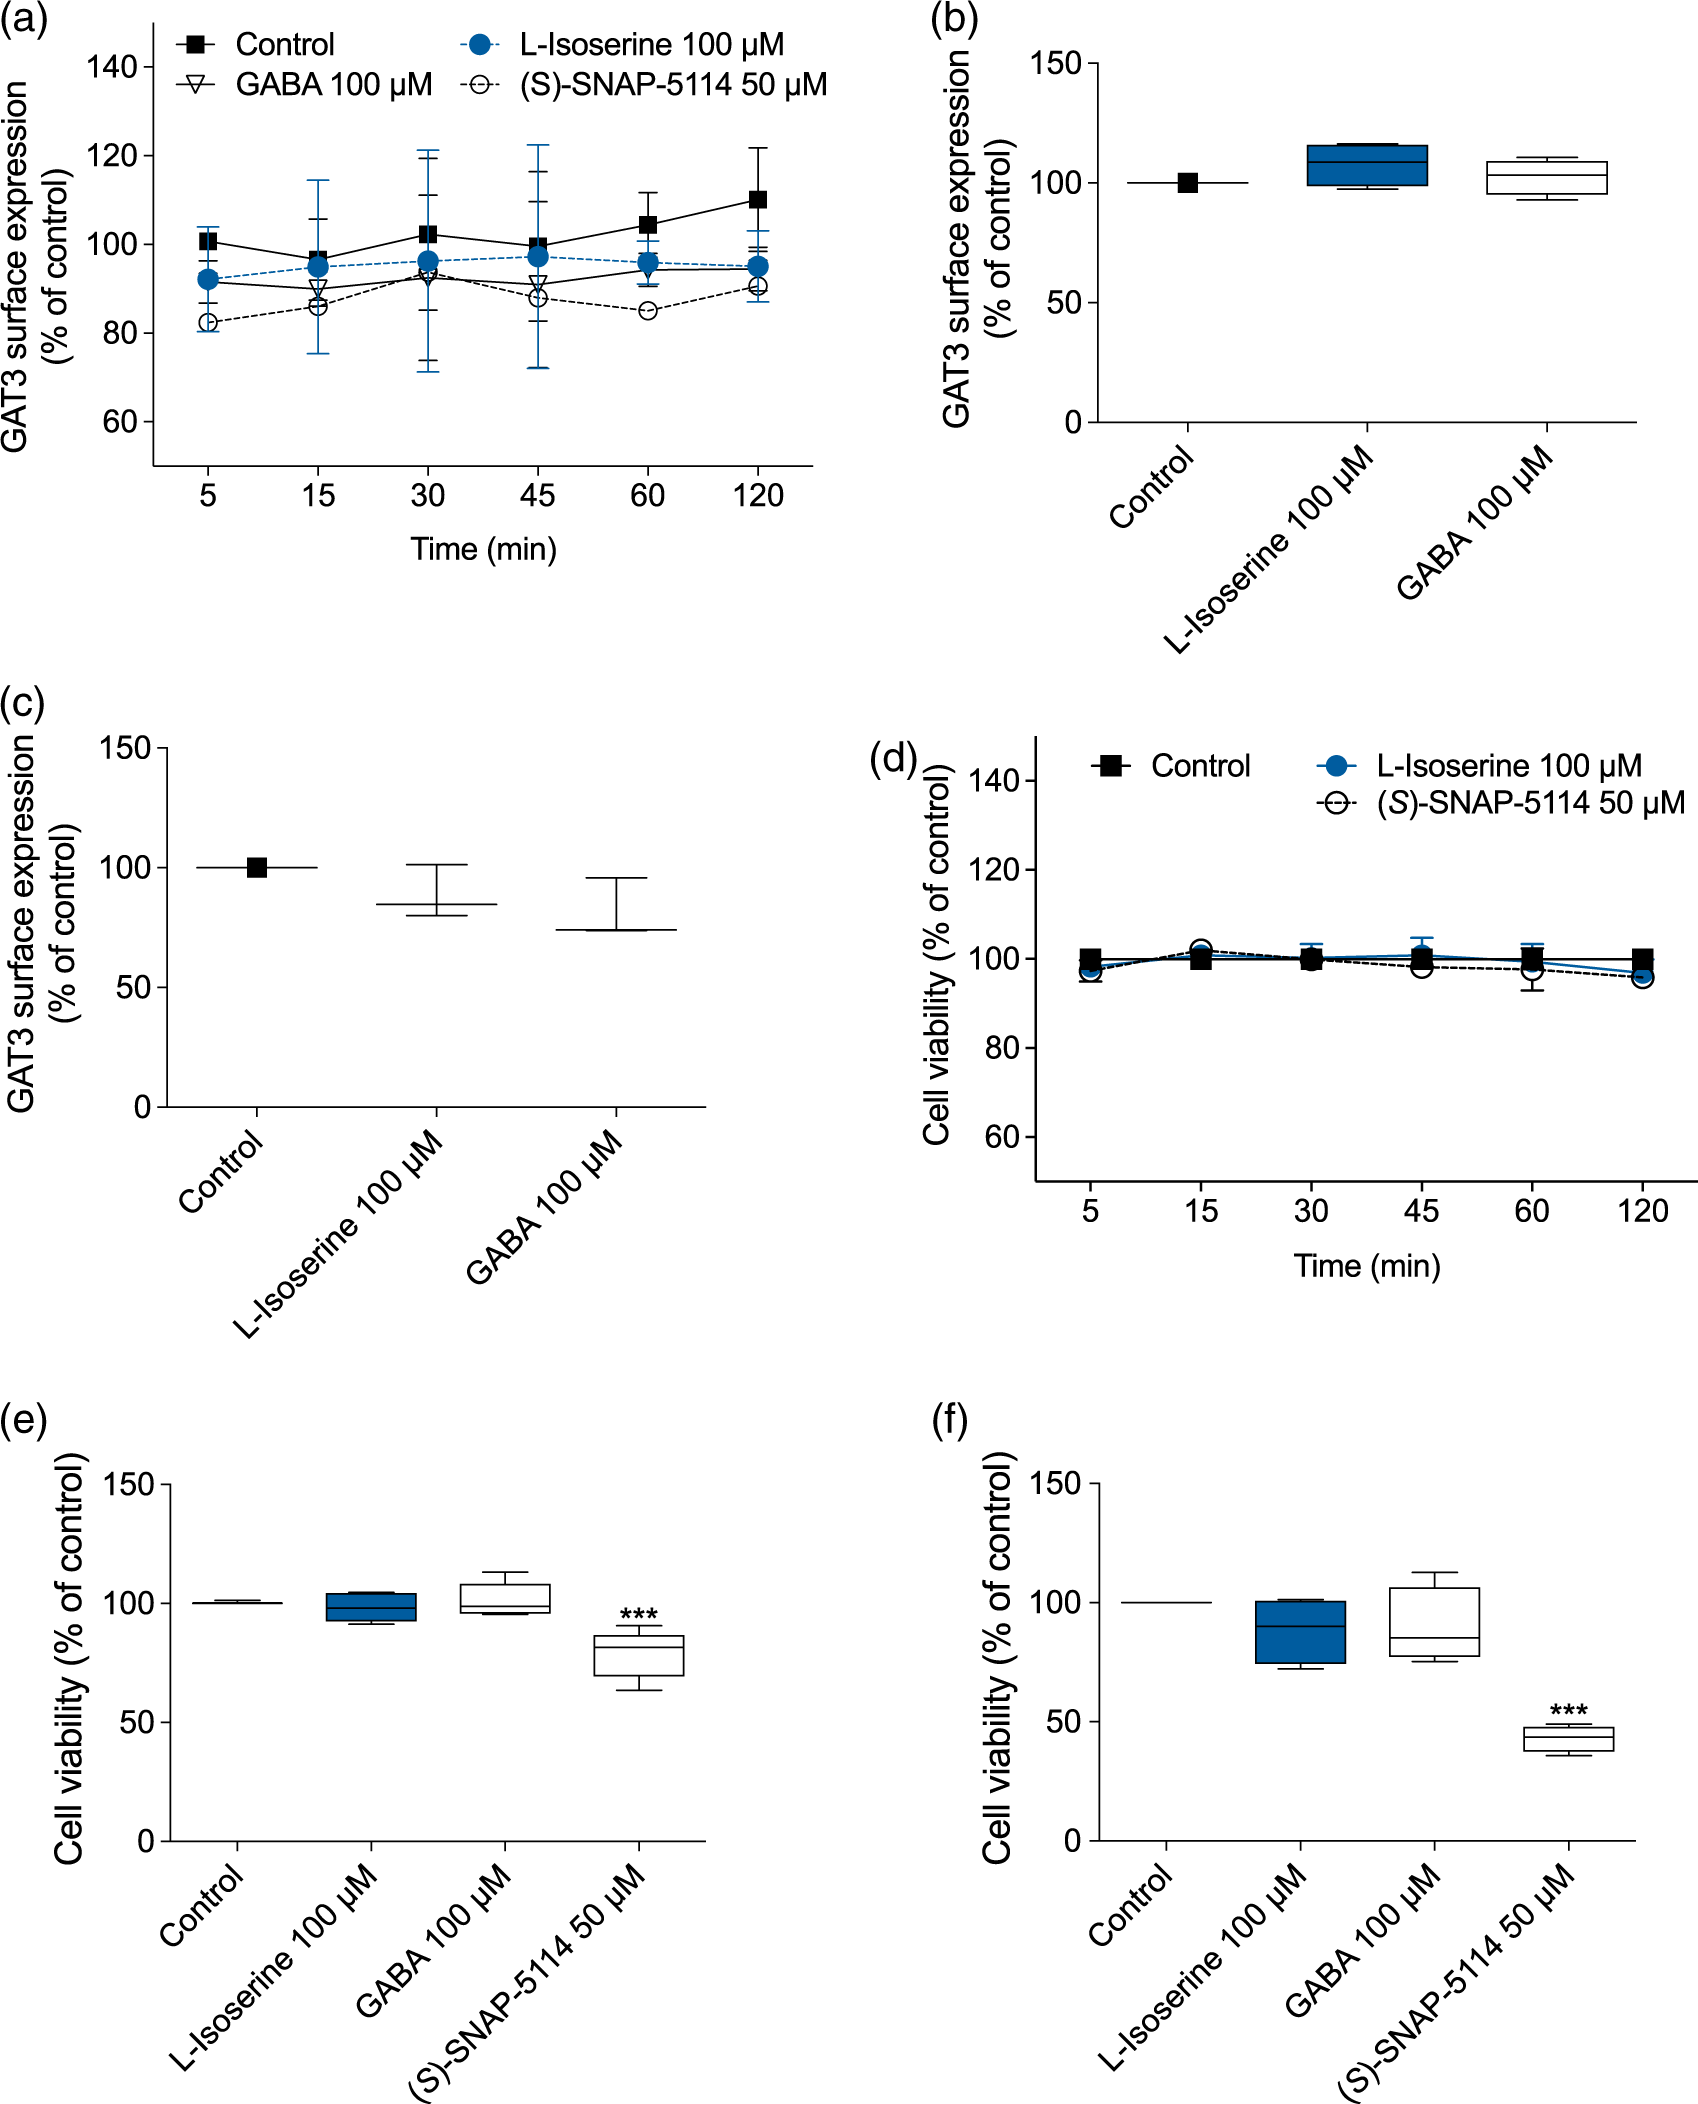
L -Isoserine modulates the glial scar
Last, we wanted to investigate if
Discussion
Recent studies have shown that tissue adjacent to the stroke, the peri-infarct cortex, is a region of heightened plasticity and contributes to the limited capacity of the brain to repair following a stroke.17,43–45 The peri-infarct cortex is a region where patterns of evoked neuronal activation shift, correlating to improved functional recovery.33,43 This process involves changes in brain excitability, which underlies changes in the way the brain represents motor and sensory function. In particular, a reduction in cortical inhibition promotes recovery of function in peri-infarct cortex by facilitating the formation of new functional and structural circuits to enhance motor remapping. 46 Consistent with this, we have recently shown that a delayed reduction in GABA-mediated tonic inhibition, by inhibiting extrasynaptic GABAA receptors, can increase the recovery of motor function,6,47 and that the changes in GABA signaling in the peri-infarct region and resultant increase in tonic inhibition after an ischemic stroke is in part due to changes in GAT3 expression and function. 6
GAT3 expression is decreased post-stroke
In the present study, we show that GAT3 is subjected to long-lasting changes in response to ischemia, primarily affecting the cells found in close proximity to the ischemic core. In this area, GAT3 expression is already down-regulated after 6 h and remains suppressed 42 days post-stroke, indicating that it is most likely the palisading astrocytes, which form the glial scar, that display a reduced GAT3 expression. These temporal changes in GAT3 levels match the reported change in tonic inhibition, 6 further supporting the hypothesis that impaired GAT3-mediated uptake is contributing to the chronic elevation in tonic inhibition after ischemia. We also show that changes in the total pool of GAT3 correlates with equal changes in tonic inhibition and that the down-regulation of GAT3 precedes the changes in tonic inhibition reported by Clarkson et al. 6 and extends for as long as 42 days post-stroke, much longer than previous thought. 6 Yet, we cannot exclude that other sources may contribute to the increase in ambient GABA levels including reactive astrocytes, which have been reported to be able to produce and subsequently release GABA via the anion channel bestrophin1 (Best1) 48 and GAT3 efflux.38,49
Delayed treatment with a GAT3 substrate, L-isoserine, increases GAT3 expression and post stroke recovery
With GAT3 being a direct regulator of ambient GABA levels and tonic inhibition
14
and being involved in the pathology of an ischemic stroke,6,8 we wanted to investigate the therapeutic potential of a GAT3 substrate inhibitor. We are the first to show that the GAT3 substrate inhibitor,
Ambient GABA levels and tonic inhibition are controlled by the reuptake of GABA into surrounding astrocytes and neurons via GATs.14,20 We show that Schematic summary of key results and the proposed hypothesis stating how 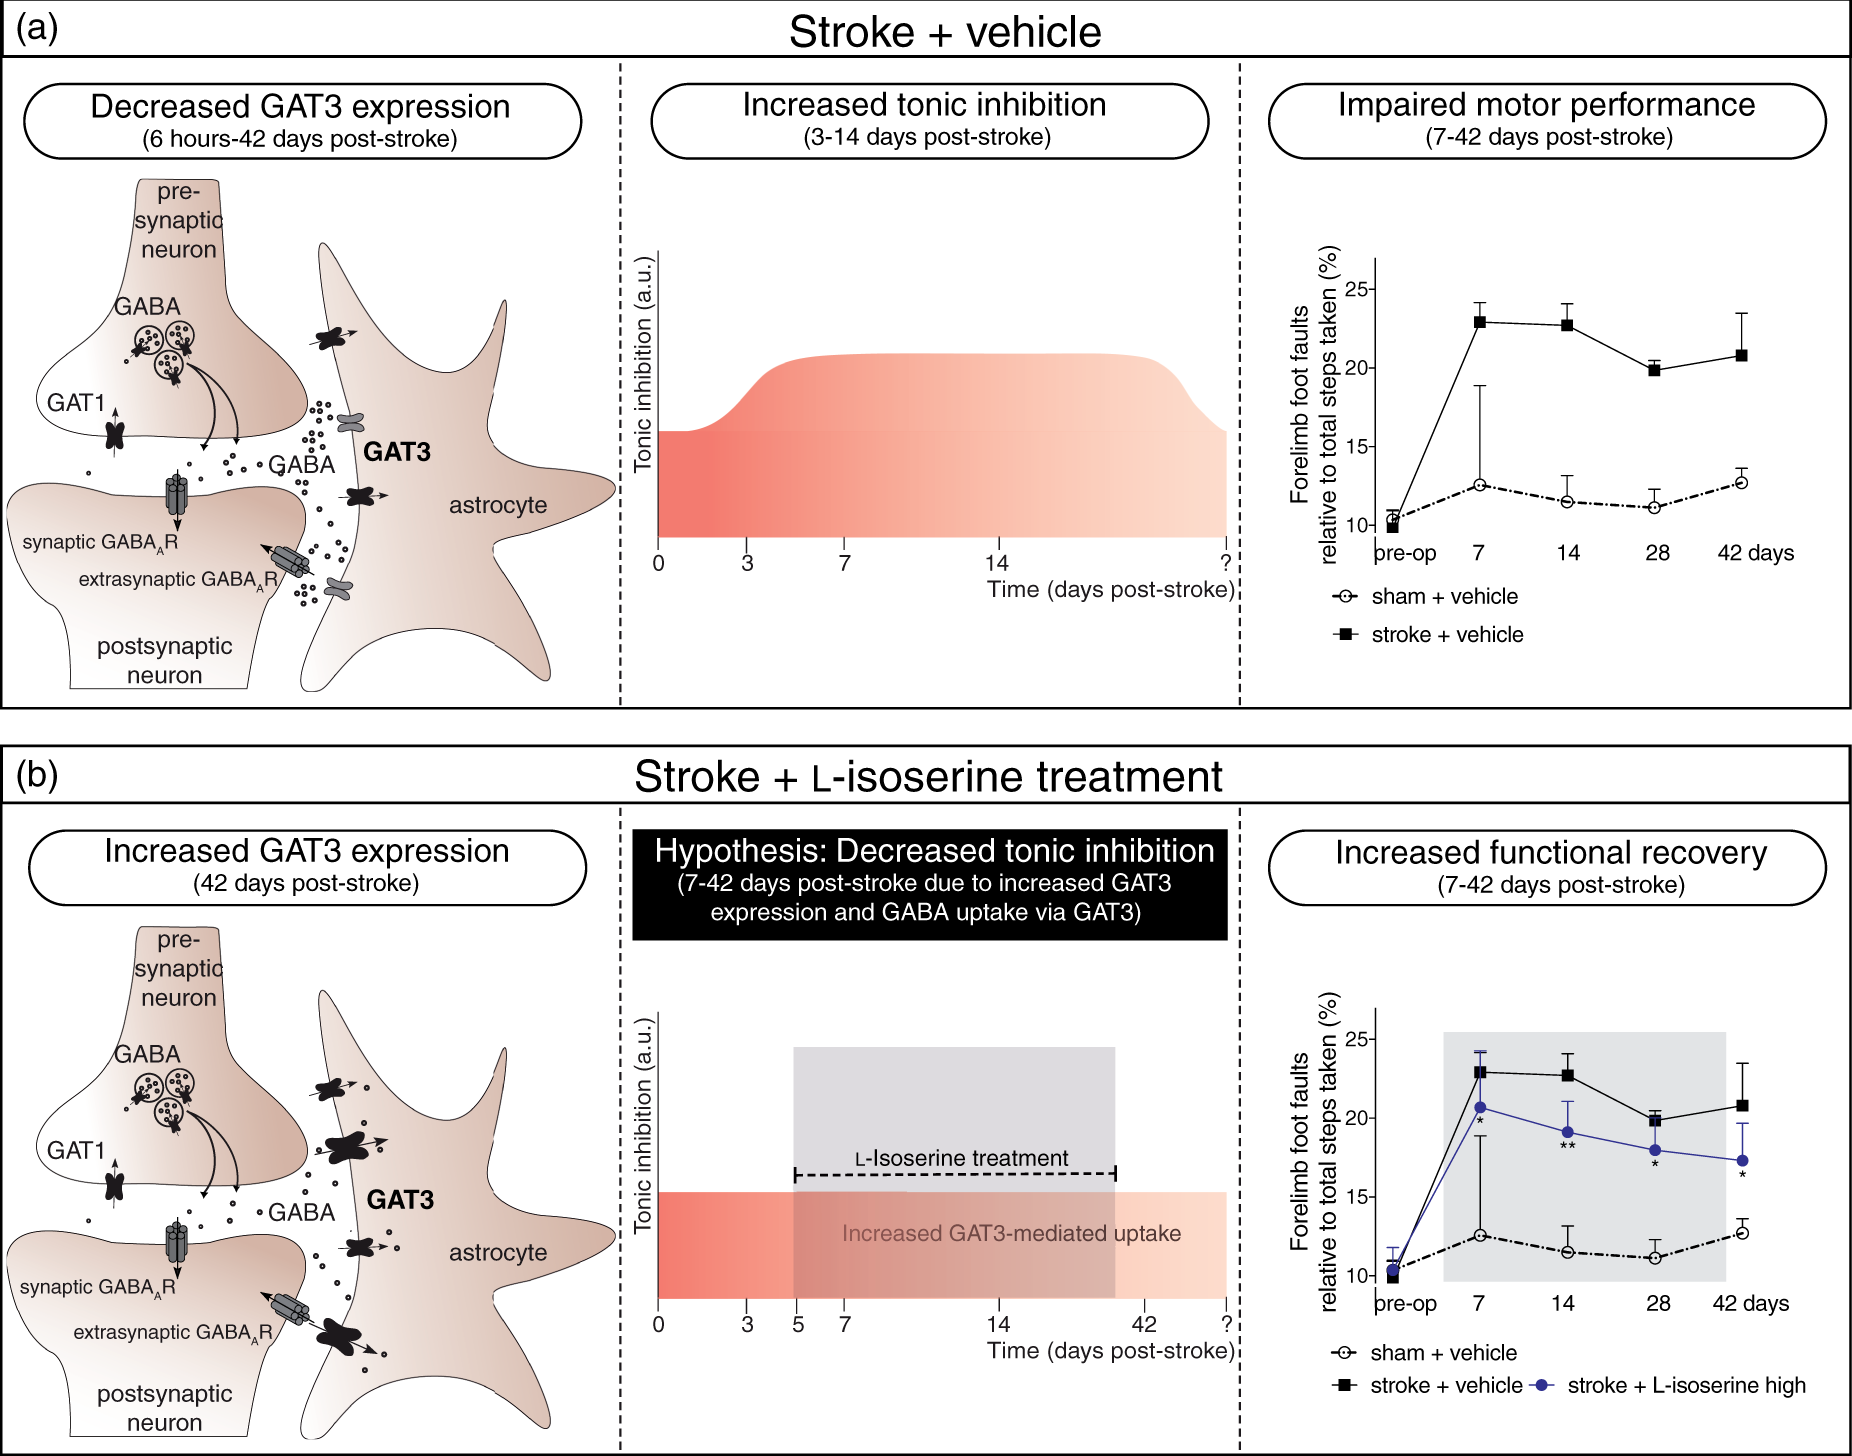
In contrast to the effects of
Tonic inhibition is not the only parameter controlling stroke recovery and there is a plethora of factors that influence the outcome besides tonic inhibition per se. The reactive astrocyte in particular has many roles in ischemia and is highly involved in the regulation of the inflammatory response,
42
where chronic neuroinflammation impede post stroke recovery.
50
A recent study has also shown that reactive astrocytes are needed for axonal sprouting,
41
indicating that some astrogliosis is necessary for recovery. For this reason, we also looked at the modulation of the glial scar in the stroke mice at day 42 and investigated the effect of L-isoserine. We show that the high concentration of
Conclusion
We show that a photothrombotic stroke to the motor cortex produces long-lasting effects by reducing the GAT3 protein level thus impairing the GAT3 uptake, persisting for as long as 42 days after the ischemic insult. We are the first to demonstrate that a GAT3 substrate inhibitor,
Footnotes
Funding
The author(s) disclosed receipt of the following financial support for the research, authorship, and/or publication of this article: This work was supported by the Lundbeck Foundation (grant R118-A11564), the Carlsberg Foundation (PW), the Drug Research Academy, the New Zealand Neurological Foundation and the Royal Society of New Zealand Project Grant (ANC).
Declaration of conflicting interests
The author(s) declared no potential conflicts of interest with respect to the research, authorship, and/or publication of this article.
Authors’ contributions
MEKL, ANC and PW designed the studies. MEKL, EKG and ANC performed and analyzed the in vivo studies. MEKL, EKG, NBJ, NOD and LT performed and analyzed the in vitro studies. MEKL drafted the manuscript. PW and ANC critically revised the manuscript. All authors reviewed, edited and approved the final version of this manuscript.
References
Supplementary Material
Please find the following supplemental material available below.
For Open Access articles published under a Creative Commons License, all supplemental material carries the same license as the article it is associated with.
For non-Open Access articles published, all supplemental material carries a non-exclusive license, and permission requests for re-use of supplemental material or any part of supplemental material shall be sent directly to the copyright owner as specified in the copyright notice associated with the article.