
Abstract
While recent ‘big data' analyses discovered structural brain networks that alter with age and relate to cognitive decline, identifying modifiable factors that prevent these changes remains a major challenge. We therefore aimed to determine the effects of common cardiovascular risk factors on vulnerable gray matter (GM) networks in a large and well-characterized population-based cohort. In 616 healthy elderly (258 women, 60–80 years) of the LIFE-Adult-Study, we assessed the effects of obesity, smoking, blood pressure, markers of glucose and lipid metabolism as well as physical activity on major GM-networks derived using linked independent component analysis. Age, sex, hypertension, diabetes, white matter hyperintensities, education and depression were considered as confounders. Results showed that smoking, higher blood pressure, and higher glycated hemoglobin (HbA1c) were independently associated with lower GM volume and thickness in GM-networks that covered most areas of the neocortex. Higher waist-to-hip ratio was independently associated with lower GM volume in a network of multimodal regions that correlated negatively with age and memory performance. In this large cross-sectional study, we found selective negative associations of smoking, higher blood pressure, higher glucose, and visceral obesity with structural covariance networks, suggesting that reducing these factors could help to delay late-life trajectories of GM aging.
Keywords
Introduction
Recent ‘big data' analyses of structural co-variance between brain regions revealed large-scale gray matter (GM) networks that are linked to developmental changes and inter-individual behavioral differences.1–4 Douaud et al. 3 described a network of transmodal cortical and limbic GM regions that showed correlated shrinkage in healthy aging and links to memory performance. That GM network also mirrored brain regions that exhibit accelerated atrophy in patients with Alzheimer's disease (AD). 3
The observed network-based effects could hint towards a shared susceptibility of connected regions, indicative of unique morphological properties, to selective pathological processes.5,6 They also strengthen the hypothesis that fundamental mechanisms of aging may contribute to (or result from) neurodegenerative pathologies.7–11 A better understanding of possible modulators of GM networks that are vulnerable to aging would thus open a novel window towards targets for intervention of disease progression.
Using conventional analyses, global and regional decreases in GM volume and cortical thickness have been linked, though not unequivocally, 12 to common cardiovascular risk factors comprising cigarette smoking, hypertension, obesity and metabolic changes.13–16 However, addressing potential impact of these factors at the network- and population-level remains a major challenge. 17
We therefore aimed to systematically assess the effects of obesity, smoking, blood pressure, as well as markers of glucose and lipid metabolism and physical activity on major GM networks using linked independent component analysis of cortical volume, thickness, and surface area estimated from T1-weighted MRIs in a large cohort of community-dwelled healthy older individuals. We determined the unique contribution of each risk factor (selected according to the Framingham study 18 and additionally physical activity 19 ) to variations in these GM networks using multivariable statistics that were adjusted for confounders. Possible associations between GM networks and cognition were explored using a sumscore of verbal memory performance, known to be highly affected by age. 20 We hypothesized negative effects of cardiovascular risk factors on major GM components that are prone to undergo age-associated changes and linked with cognition.
Materials and methods
Participants
Data were drawn from the baseline examination of the “Health Study of the Leipzig Research Centre for Civilization Diseases” (LIFE), a population-based cohort study of adult Leipzig inhabitants, randomly invited via the population registry. All subjects signed an informed consent form and received a small financial compensation. The study protocol was in accordance with the declaration of Helsinki and approved by the ethics committee of the University of Leipzig.
Participants underwent neuropsychological testing, medical examinations, and a randomly selected subset underwent magnetic resonance imaging (MRI) of the head at 3T (n ∼ 2600). For details on the study design, see Loeffler et al.
21
Out of a sample of 985 older participants (≥ 60 years) available at the date of analyses, we excluded participants with dementia, neurological, psychiatric or immune suppressive medication (n = 203), as well as major brain pathology (e.g. tumors and stroke) (n = 47). Also, subjects with missing information on confounding factors (n = 74), severe movement artifacts on the MRI or other technical problems (n = 32), as well as non-intact cognitive performance (n = 13, defined as showing a total cognitive sumscore of < 3 SD of the mean population) were excluded, resulting in a sample of 616 subjects (Figure 1). Due to the nature of our exclusion criteria, participants excluded (n = 369) were on average slightly older (mean age: 69.5 ± 6 (SD) years, p = 0.021), more frequently women (p = 0.028), exhibited a higher BMI (mean BMI: 28.4 ± 4.25 (SD) kg/m2, p = 0.001) and were less educated compared to those included (p < 0.001).
Flow chart of the study. Out of 985 older adults free of stroke, 369 were excluded due to medication intake, brain pathology, missing covariates, non-usable MRI scans, or non-intact cognition, leaving 616 participants for main analyses. Out of this sample, 516 participants had physical activity information.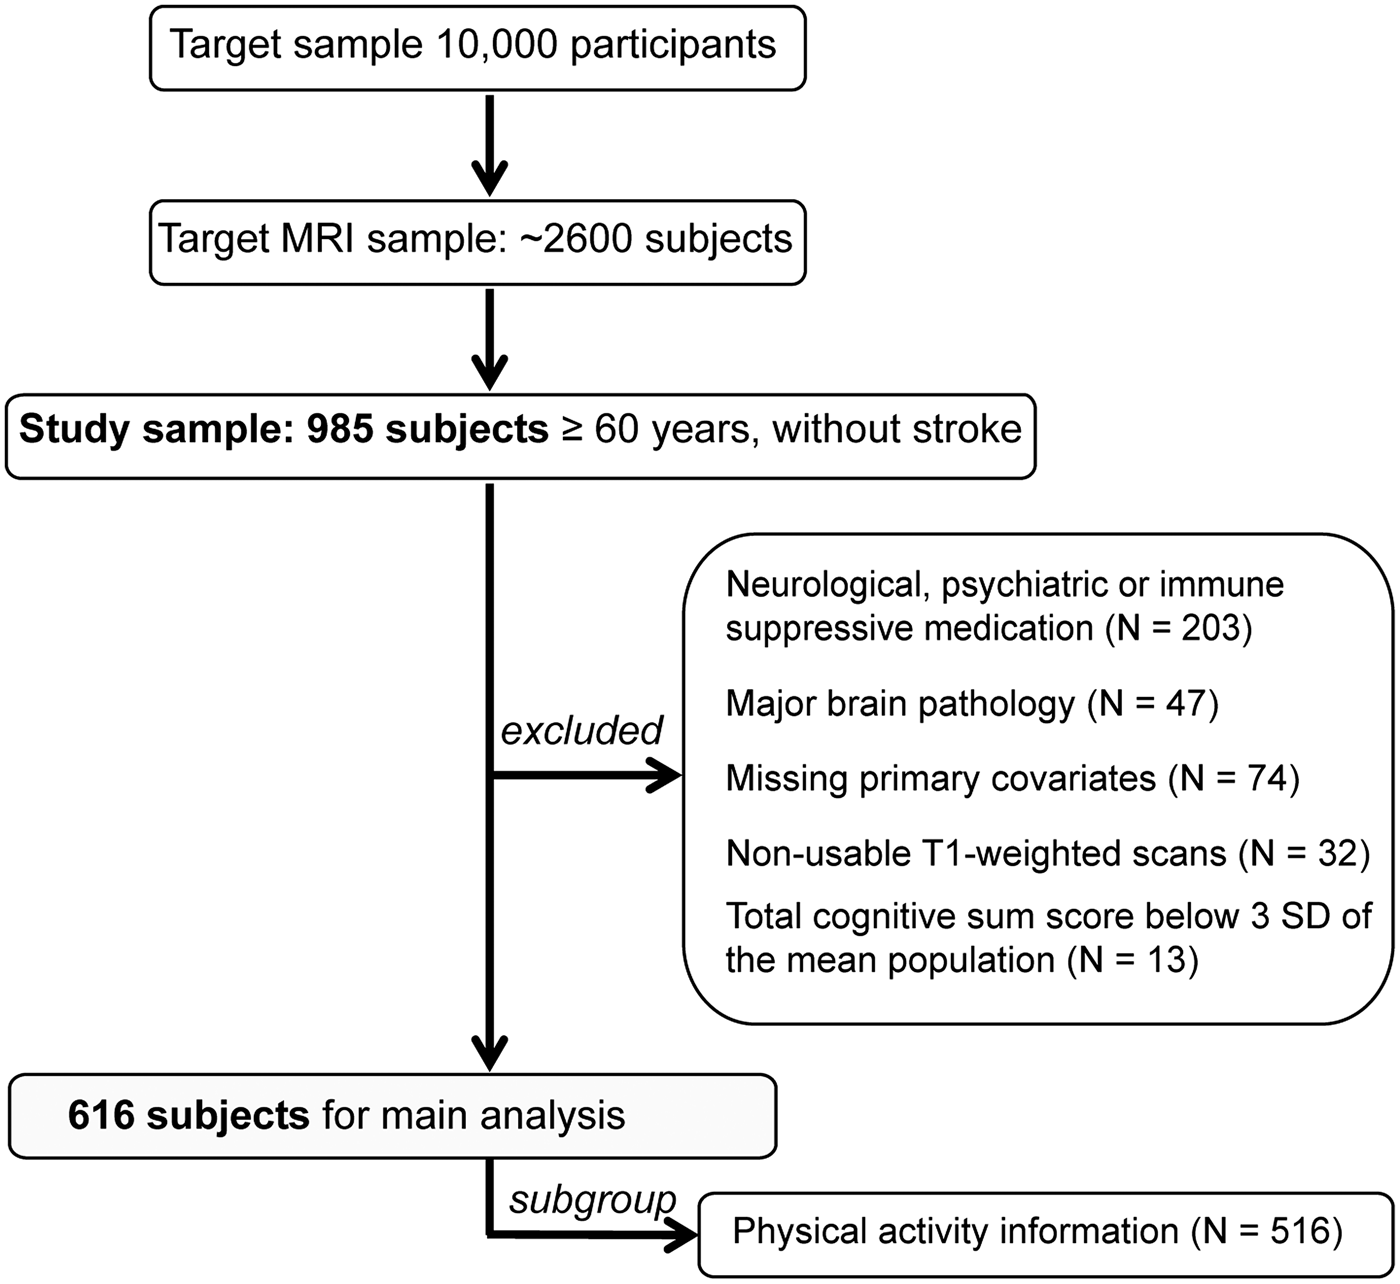
MRI acquisition
Anatomic T1-weighted images were acquired in a 3-Tesla Magnetom Verio scanner (Siemens, Erlangen, Germany) equipped with a 32-channel head array coil, using a three-dimensional Magnetization-Prepared Rapid Gradient Echo (MPRAGE) sequence. GRAPPA parallel imaging technique 22 was applied on the Alzheimer’s Disease Neuroimaging Initiative (ADNI) standard protocol with the following parameters: TI 900 ms, TR 2300 ms, TE 2.98 ms, flip angle 9°, band width 240 Hz/pixel, image matrix 256 × 240, 176 partitions, FOV 256 × 240 × 176 mm3, sagittal orientation, voxel size 1 × 1 × 1 mm3, no interpolation.
Image processing
T1-weighted images were processed using FSL-VBM, 23 an optimized voxel-based morphometry (VBM) 24 protocol using FMRIB Software Library (FSL) tools (http://fsl.fmrib.ox.ac.uk/fsl/fslwiki/FSLVBM; FSL 4.1), 25 in which a symmetric study-specific GM template was built from the images of a sub-group of 260 participants equally matched for males and females, which were not significantly different from the whole sample with regard to age and BMI range and frequency of hypertension and diabetes. Prior to the FSL-VBM processing, the volumes were masked by the full brain-segmented volume output from FreeSurfer (http://surfer.nmr.mgh.harvard.edu/; FreeSurfer 5.0.0), 26 effectively excluding non-brain compartments. After nonlinearly registering all of the brain-extracted, GM-segmented images onto the symmetric study-specific GM template, the optimized FSL-VBM protocol involved a compensation (or “modulation”) for the local contraction/enlargement caused by the nonlinear component of the transformation. In addition, brain structural information was derived from vertex-wise cortical thickness and surface area calculated in FreeSurfer by means of an automated surface reconstruction scheme. 26 All surface reconstructions were visually inspected in Freeview and manually edited in 31 cases. For computational reasons, we reduced the number of data points in each modality by lowering the resolution of the pre-processed images, while not losing any information about global patterns of structural covariance, due to the smoothness of the pre-processed images. The modulated registered GM-segmented images were first down-sampled to 4 mm isotropic and then were smoothed with an isotropic Gaussian kernel with a σ of 4 mm (≈9.4 mm full width at half maximum (FWHM)). Cortical thickness and surface area maps were sampled from subject space to the fsaverage5 template (10,242 vertices) and then smoothed with a surface FWHM of 10 mm.
Relative amount of explained variance by independent components (IC), according to linked-IC analysis of gray matter volume (GMV), cortical thickness, and surface area; and correlation with age and memory performance.
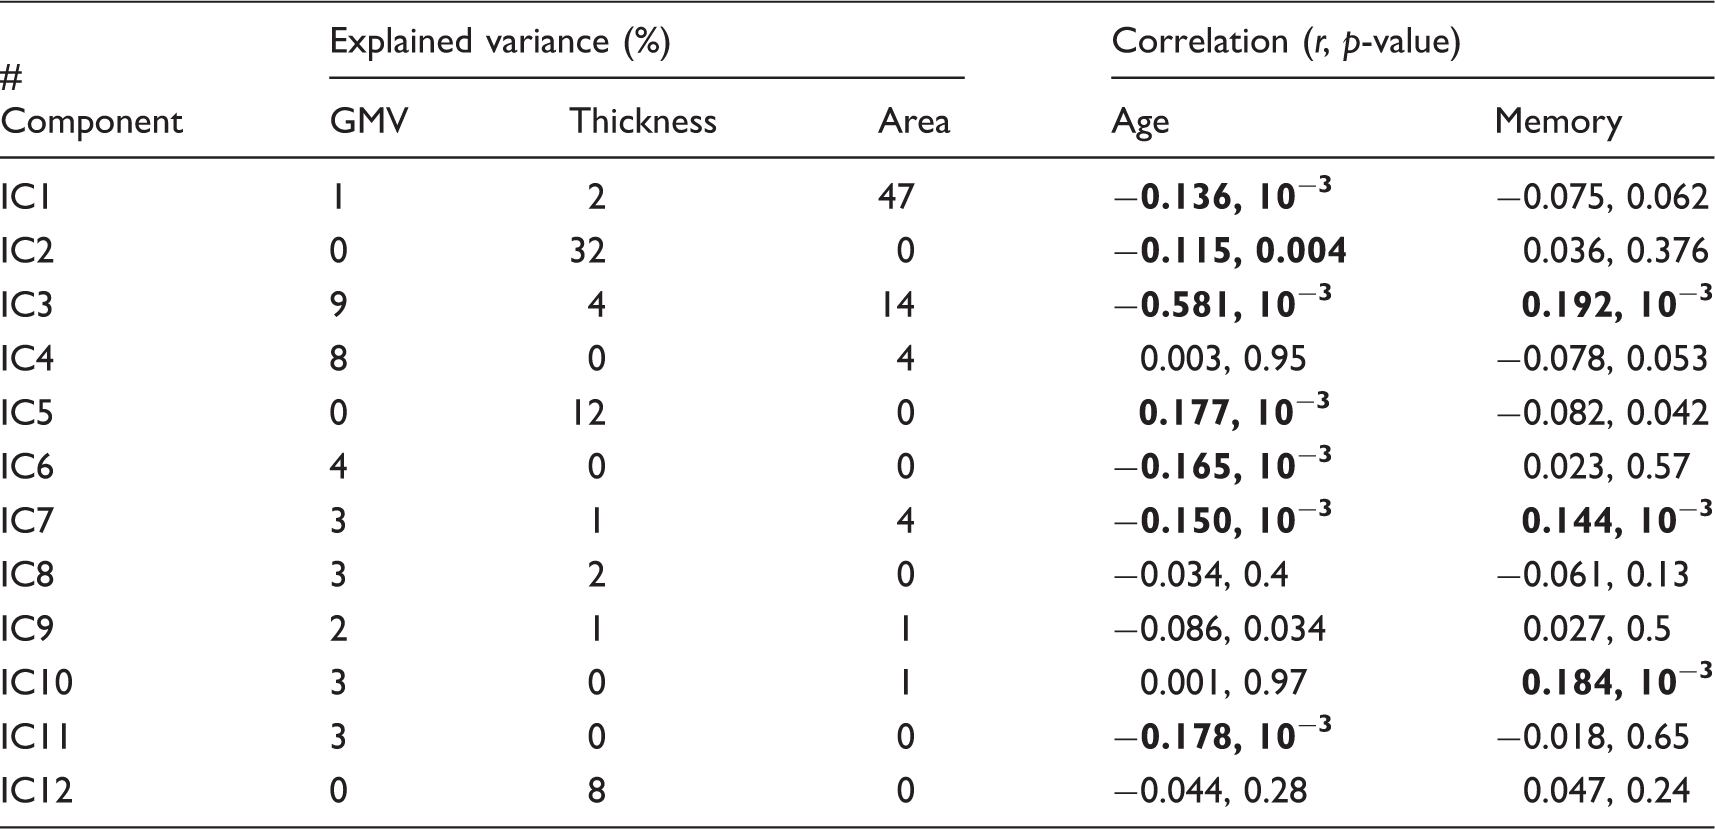
Note: r- and p-values are according to Spearman’s rank correlations. Significant associations are indicated by bolding the numbers (p < 0.005).
For illustration purposes, we up-sampled the linked-ICA results to the high-resolution versions of the smoothed input data, similar to Groves et al. 27 (GM volume images on 2 mm isotropic and surface measures sampled on fsaverage space, i.e. 163,842 cortical vertices per hemisphere).
Cardiovascular risk factors
All subjects underwent anthropometric assessments, donated blood after fasting overnight and were asked to fill in questionnaires about their lifestyle habits. Cardiovascular risk factors comprised obesity, assessed using “waist-to-hip ratio” (WHR, measured using an ergonomic circumference measuring tape (SECA 201) to the nearest 0.1 cm) and “BMI” (in kg/m2, measured) as continuous variables, “smoking status” (current, past or never smokers), systolic “blood pressure” (in mmHg, mean of three consecutive measurements in a seated position at rest), fasting serum concentrations of glucose and lipid metabolism, i.e. “glycated hemoglobin (HbA1c)” (in mmol/mol), “high-density lipoprotein (HDL)” (in mU/mL), and total “cholesterol” (in mmol/L). By using blood pressure and markers of glucose control (HbA1c) as continuous variables of interest related to hypertension and diabetes, we were able to increase statistical power and sensitivity in a dose–response relationship. Six subjects had missing blood values due to technical problems (HbA1c, n = 5, HDL, n = 1), these values were replaced by the sample’s medians. “Physical activity” (self-reported according to the German short version of the international physical activity questionnaire, IPAQ, 29 in MET-minutes/week) was analyzed in a subgroup of 516 subjects due to unreturned questionnaires in 100 subjects.
Memory performance and assessment of confounders
“Memory performance” was assessed using the CERAD verbal learning task. 30 Briefly, subjects were asked to remember and recall immediately and after a delay as many words as possible out of a list of 10 words. The memory performance sumscore was defined as the standardized mean performance in the sum of (1) immediate learning (no. of correct words across the three learning trials), (2) delayed recall (no. of correct words in the recall trial), and (3) recognition (no. of correctly recognized words in the recognition trial, minus false positives).31,32
“Depression” was measured using the Center for Epidemiologic Studies Depression Scale (CES-D) questionnaire, 33 “arterial hypertension” was defined as a systolic blood pressure ≥ 160 mmHg, a diastolic blood pressure ≥ 95 mmHg or use of antihypertensive medication, 14 “diabetes” was defined as none, type 1 medicated, type 2 medicated, type 2 unmedicated, and “other cardiovascular conditions” were defined as arrhythmia or tachycardia. “Education” was measured according to the International Standard Classification of Education (7 levels). 34 In addition, “APOE4 carrier status” was defined as carrying one or two E4 alleles of the apolipopreotein E (APOE) gene (n = 32 missings due to lack of DNA samples). Genotyping was performed on a Roche Lightcylcer 480 using genomic DNA that was isolated from peripheral leukocytes using an automate protocol on the Qiagen Autopure LS (Qiagen, Hilden, Germany).
Statistical analysis
To determine unique associations between the GM networks and cardiovascular risk factors, we conducted partial correlations between subjects' loading on each of the 10 ICs and BMI, WHR, smoking, blood pressure, HbA1c, HDL and total cholesterol, respectively, in line with previous studies.35,36 When meeting the criteria of bivariate correlation with the respective IC (Figure 2), the remainder of the cardiovascular risk factors as well as the following confounder variables was considered in the partial correlation models: age, sex, depression, hypertension (except for blood pressure analyses), diabetes (except for HbA1c analyses), other cardiovascular conditions, white matter hyperintensities (WMH, assessed according to the Fazekas rating scale by means of 3D-FLAIR images
37
), education, total intracranial volume (TIV), and APOE4 carrier. We repeated analyses for physical activity in the physical activity subgroup (n = 516).
Bivariate correlations among independent components (IC), cardiovascular risk factors, confounders, and verbal memory score. Significant associations (Spearman's correlations, p < 0.05) are color-coded in red-shaded (positive) and blue (negative). CV: cardiovascular; WMH: white matter hyperintensities; TIV: total intracranial volume; APOE-e4: apolipoprotein E epsilon-4 carrier status; BMI: body mass index; WHR: waist-to-hip ratio; HbA1c: glycated hemoglobin; HDL: high-density lipoprotein.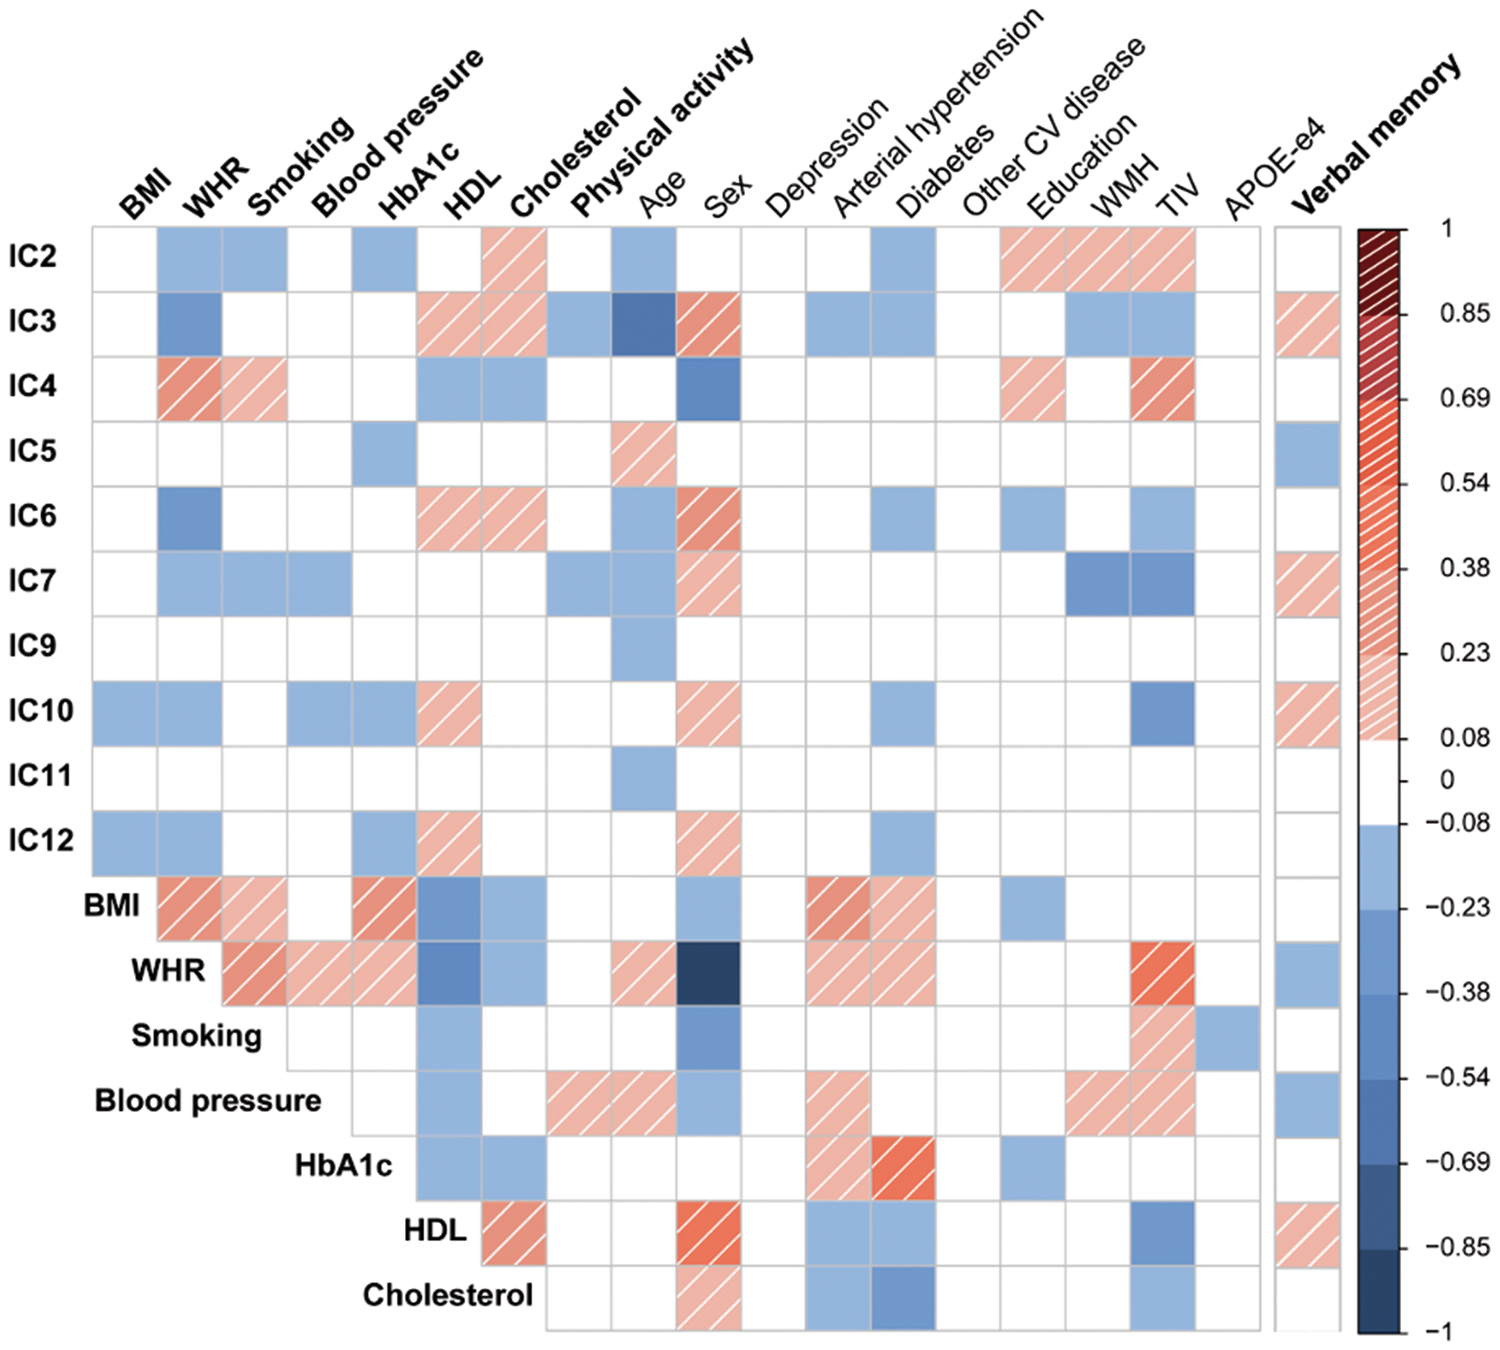
To assess if the relation between blood pressure (or HbA1c) and GM networks would change with medication, we repeated the analysis in those with anti-hypertensive medication (or anti-diabetic medication, respectively), and in those without. In addition, given the link between estrogen replacement therapy and brain aging,38,39 we excluded women with current estrogen medication in confirmatory analyses. All variables were normally distributed (unimodal, |skewness| ≤ 1), except IC7, HbA1c, HDL, and physical activity, therefore non-parametric statistics were used. For partial correlations, missing APOE4 values (n = 32) were substituted by the sample mean. The significance threshold of partial correlations was set to p < 0.05 (two-sided) and corrected for the number of ICs tested (n = 10), resulting in pα < 0.005. All statistical analyses were performed in SPSS 20 (PASW, SPSS, IBM).
Results
Sample characteristics.
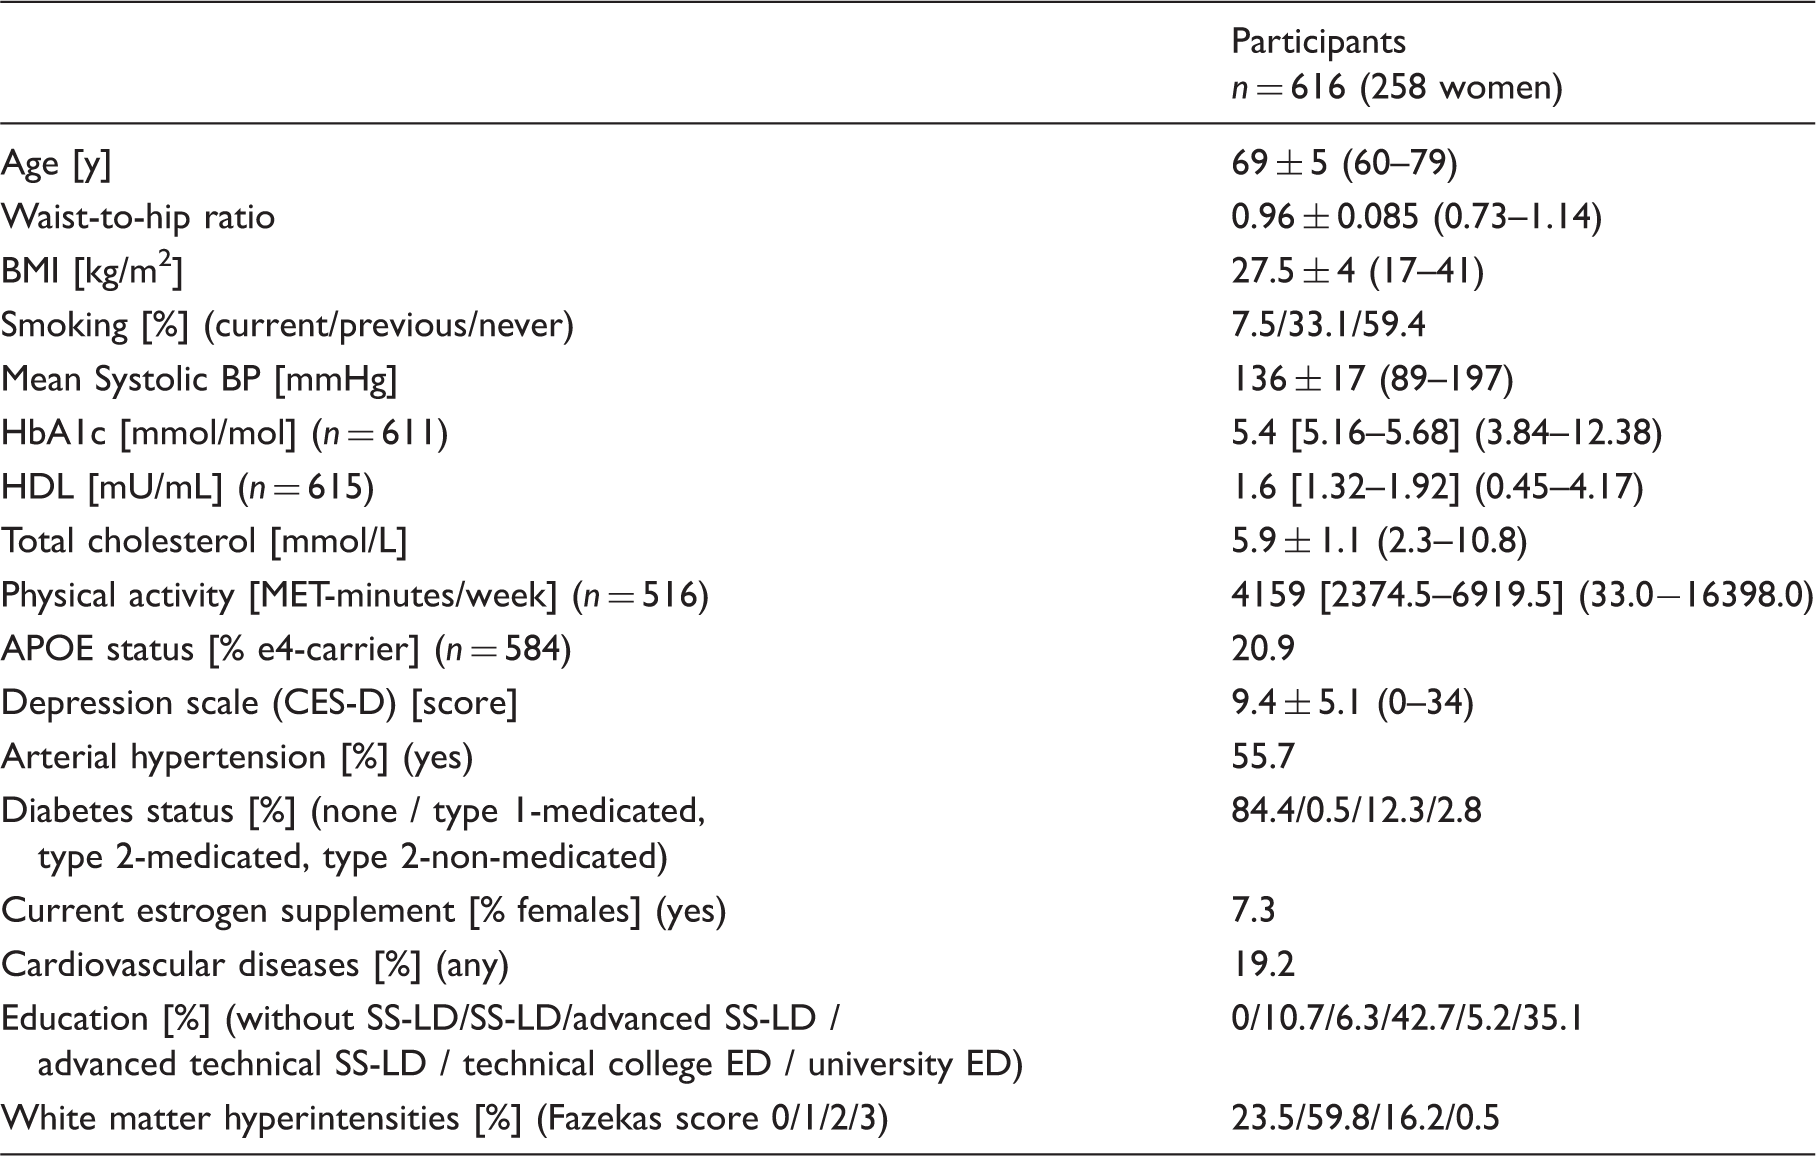
Note: Data are mean ± SD (minimum-maximum) or median [Interquartile range] (minimum-maximum), unless indicated otherwise.
BMI: body mass index; BP: Blood pressure; MET: multiples of the resting metabolic rate; HbA1c: glycated hemoglobin A1c; HDL: high-density lipoproteins; APOE: Apolipoprotein E; CES-D: center for epidemiologic studies depression scale; SS-LD: secondary school-leaving degree; ED: entrance degree.
Structural networks and cardiovascular risk factors
Out of 10 independent GM components, global networks IC2 and IC7 showed an overall decrease in cortical thickness and volume, respectively, with age (IC2: r = −0.115, p = 0.004; IC7: r = −0.150, p < 10−3; Table 1). IC7 was also associated with memory performance (r = 0.144, p < 10−3).
Independent of further associated risk factors and confounders, cigarette smoking was significantly linked to lower thickness and volume throughout the neocortex in these two global networks (Figure 3(a) and (b), IC2: partial-r = 0.120, p = 0.003; IC7: partial-r = −0.143, p < 0.001).
In two global networks, lower gray matter thickness (IC2, a) and volume (IC7, b) were associated with smoking (a) and higher blood pressure (b). Scatter plots show the individual’s loading (black dots) and the group’s median with 95% SE or linear fit. Colors indicate positive (red/yellow) or negative (blue/light-blue) co-variations within the network (z > 4), maps are drawn on a standard brain.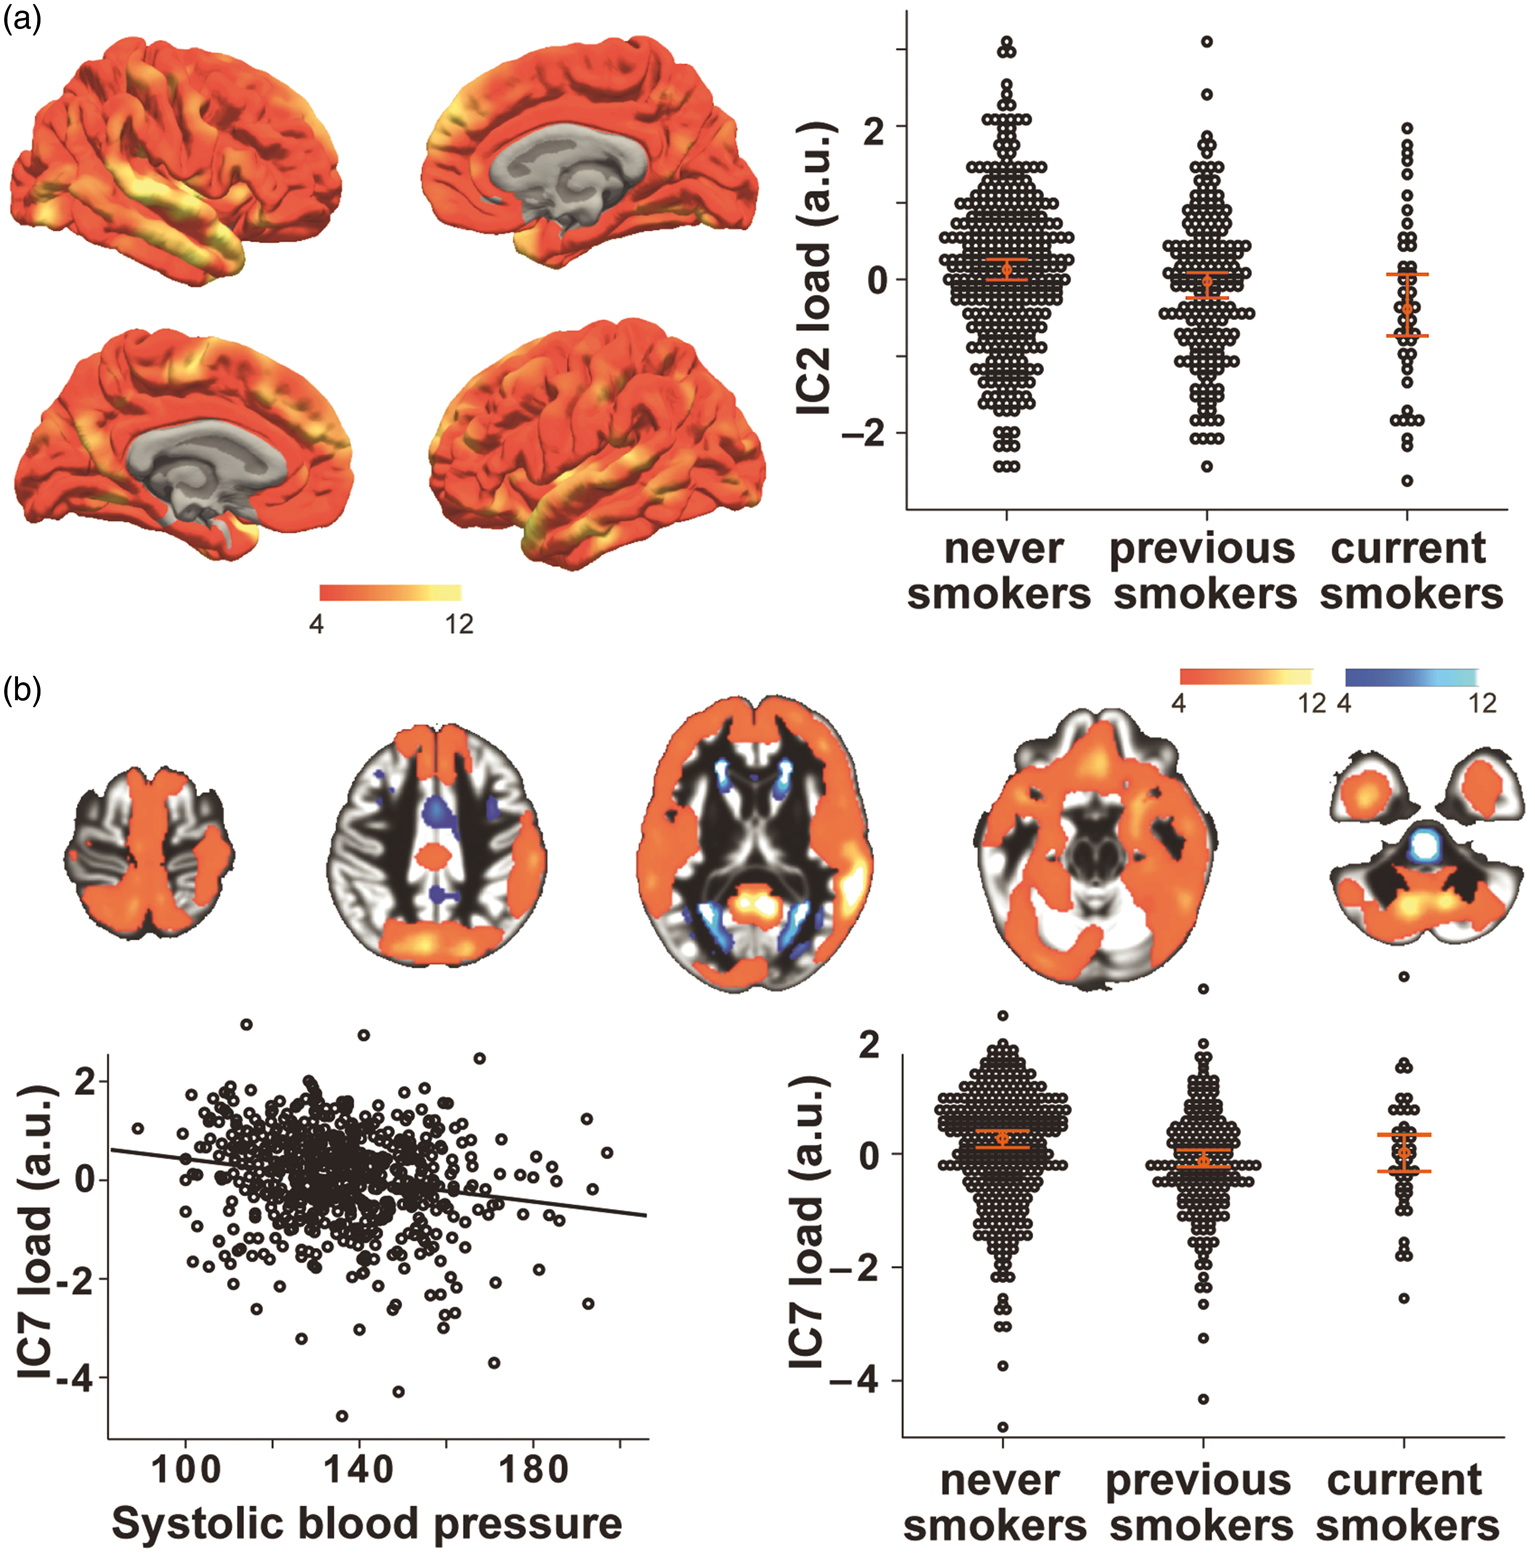
Also, blood pressure was independently associated with IC7, showing an overall cortical volume decrease in association with increased blood pressure (Figure 3(b), partial-r = −0.122, p = 0.003).
Considering glucose metabolism, we observed that higher serum concentrations of HbA1c were associated with decreased cortical thickness in IC2 after controlling for other risk factors and confounders (partial-r = −0.158, p < 10−3) (Figure 4(a)). A more regionally specific effect was noted for HbA1c in network IC5, showing lower thickness in medial frontal, insular, cingulate and inferior temporal areas and higher thickness in the postcentral gyrus and in the intraparietal sulcus (partial-r = −0.206, p < 10−3) (Figure 4(b)). This network exhibited a positive correlation with age (r = 0.177, p < 10−3).
Higher fasting serum levels of HbA1c were associated with lower cortical thickness of IC2 (a) and IC5 (b). Scatter plots show the individual’s loading on each network (black dots) and linear fit. Colors indicate positive (red/yellow) or negative (blue/light-blue) co-variations within the network (z > 4), maps are drawn on a standard brain.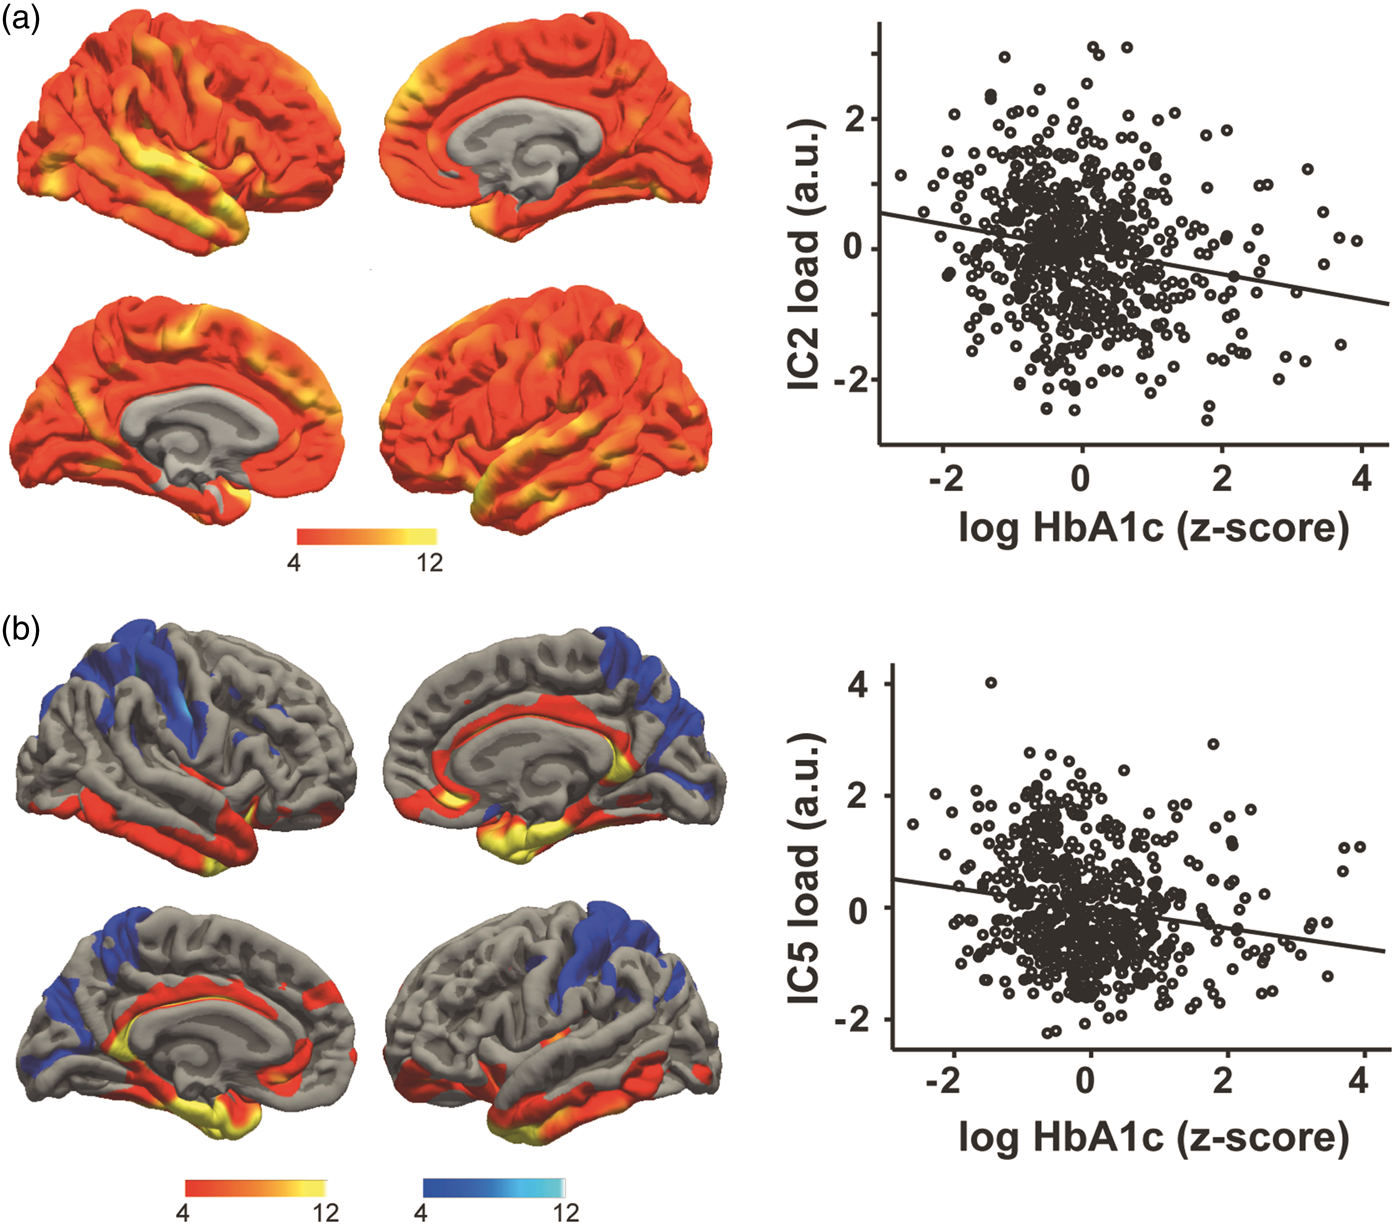
A strong negative association with age was present in IC3 (r = −0.58, p < 10−3), which was characterized by changes in GM volume predominantly within the fundus of the sulci in prefrontal, temporal and parietal regions, as well as in limbic and paralimbic areas and in the cerebellum (Figure 5(a) and (b)). Notably, this network had a good spatial agreement with the GM component in Douaud et al.
3
(http://www.fmrib.ox.ac.uk/analysis/LIFO+AD+AOS/), showing late development and accelerated decline in aging, and with GM atrophy seen in AD (spatial correlation of Z-maps: r = 0.82, p < 10−3; r = 0.67 p < 10−3, respectively). Lower GM volume in this network correlated with worse memory performance in our sample (r = 0.192, p < 10−3 Figure 5(b)). In addition, lower GM was independently associated with higher WHR in this component (partial-r = −0.149, p < 10−3) (Figure 5(c)).
Higher waist-to-hip ratio was associated with lower gray matter volume in a network of multimodal regions (IC3, a, c) that also correlated negatively with age and memory performance (b). Scatter plot shows the individual’s loading on the network and linear fit. Colors indicate positive (red/yellow) or negative (blue/light-blue) co-variations within the network (z > 11), maps are drawn on a standard brain.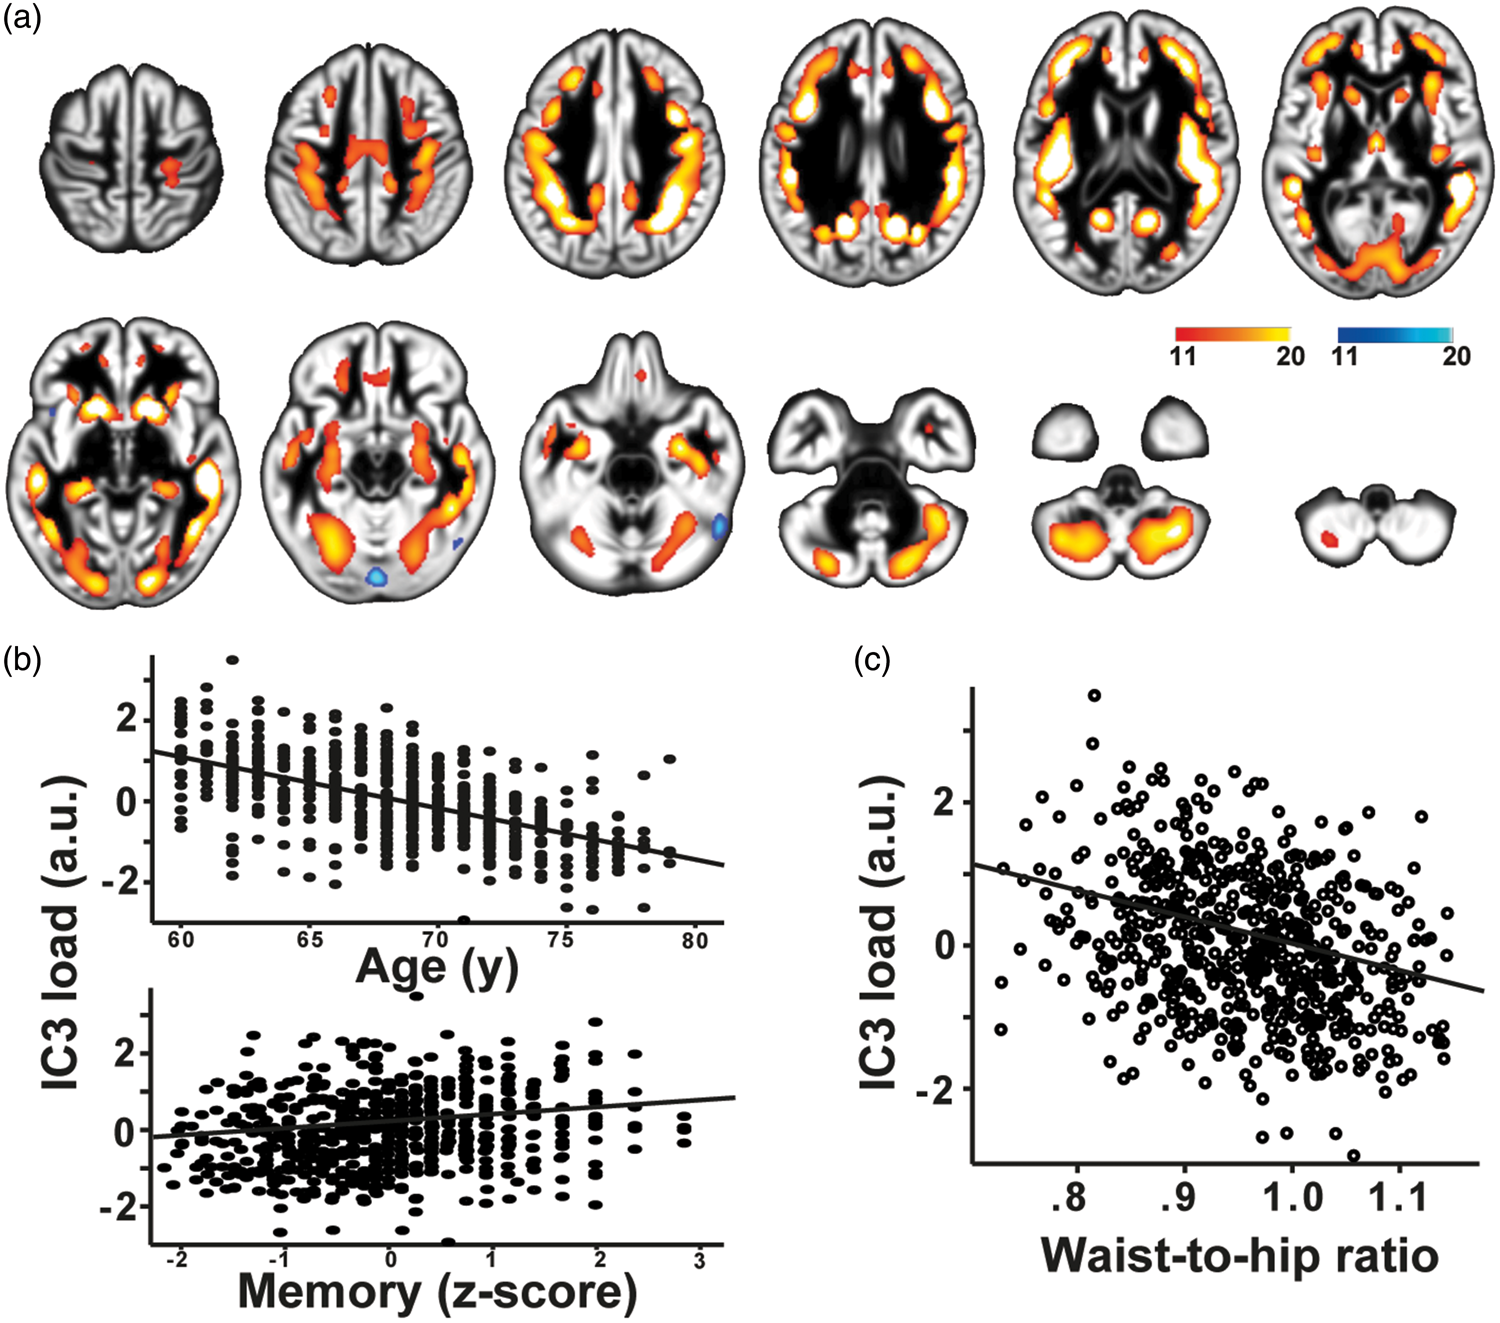
Considering components covering parts of the cerebellum, GM volume in IC10 correlated with memory performance (r = 0.184, p < 10−3). In addition, IC10 was independently associated with lower blood pressure (partial-r = −0.129, p = 0.001), showing decreased GMV in the lateral cerebellum, including bilateral Crus I, part of Crus II, area VI, VII-b, and VIII-a.
Subsample analysis
Considering physical activity in the subgroup of 516 subjects, no independent significant associations with the GM networks were found. Additionally, controlling for physical activity did not change the pattern of above-described effects of cardiovascular risk factors and GM networks, as well as when excluding women on estrogen replacement therapy (n = 19) (data not shown).
In participants with anti-hypertensive medication (n = 325), higher blood pressure was associated with lower GM volume in both IC7 (partial-r = −0.176, p = 0.002) and IC10 (partial-r = −0.139, p = 0.013). In those without anti-hypertensive medication (n = 291), however, associations did not reach significance. In participants without anti-diabetic medication (n = 534), but not in those with (n = 82), higher HbA1c, similar to the whole sample analysis, was negatively associated with IC2 (partial-r = −0.159, p < 10−3) and IC5 (partial-r = −0.230, p < 10−3)
Discussion
In this large cross-sectional study, we identified unique associations of cardiovascular risk factors, independent from confounders, on major structural covariance brain networks in a well-characterized cohort of 616 healthy older adults. In two age-associated networks that covered most cortical areas, we detected lower GM volume and thickness in smokers, in participants with higher blood pressure, and in those with higher long-term glucose. Also, WHR was associated with lower GM volume in a multimodal, age- and memory-sensitive network, known to be affected in both normal aging and AD.3,40
Smoking
We observed a significant negative association between smoking and global networks IC2 and IC7, pointing to a negative impact of smoking throughout all areas of the neocortex. Our findings are in line with recent results of Karama, 15 which linked smoking to widespread cortical thinning in a similarly large sample of older individuals (n = 504). Considering the pattern of GM covariance, these networks could be indicative of ubiquitous neuronal properties that are affected by smoking. 41 This could be due to direct and indirect toxic effects of cigarette smoking, for example as shown in rodents after prenatal exposure to nicotine, 42 or in humans with regard to chronic effects of cigarette smoking on cerebral perfusion. 43
Blood pressure
Our results indicate that higher blood pressure exerts negative effects on GM volume in networks that covered most parts of the neocortex and cerebellum, with stronger associations in subjects taking anti-hypertensive medication. There is consistent evidence that higher blood pressure in mid-life is a risk factor for cognitive decline and AD, 44 and medication intake could indicate a prolonged period of elevated blood pressure, leading to stronger effects of high blood pressure in this group. A meta-analysis of neuroimaging findings concluded that high blood pressure leads to lower GM volume, particularly in frontal and temporal lobes. 13 Possible underlying mechanisms include cerebrovascular lesions due to chronic high blood pressure and GM loss. 45
Glucose metabolism
Higher concentrations of the long-term marker of glucose metabolism, HbA1c, were associated with two networks of covariance mainly in cortical thickness. Considering the additive nature of components in our analysis, this indicates a negative impact of higher glucose on most parts of the neocortex with stronger effects in medial frontal, cingulate and temporal areas, in line with previous reports in young. 46 Due to neurotoxic effects of glucose and accumulation of advanced glycation end products (AGEs), 47 persistent episodes of hyperglycemia might have led to GM damage in subjects with higher long-term glucose. It could be speculated that regions of higher metabolism in young and higher Aß accumulation in older cognitively normal subjects 48 would show stronger correlations; however, future studies that for example implement AGE-receptor-PET 49 are needed to expand on these speculations.
Visceral obesity
We found an independent association of higher WHR and lower GM volume in IC3, covering multimodal cortices at the gray-to-white matter border as well as limbic regions. This finding is in line with previous studies that showed negative effects of obesity on regional and total GM volume in older cohorts,31,50 and extends previous reports that observed more severe changes when looking at visceral obesity measures in comparison to “crude” BMI. 51 This might be due to the more severe negative effects of visceral adipose tissue compared to (gluetal-) subcutaneous fat, including a higher expression of proinflammatory cytokines. 52 Chronic low-grade inflammation has been speculated to particularly harm myelination, thus affecting white matter tracts and intra-cortical axon collaterals. 53 The network depicted by IC3 in our cohort has been previously linked to AD and described to display a “last-in-first-out” trajectory.3,40 These effects had been further ascribed to the myelination process of intracortical fibers depicted by the network. 3 Therefore, our data-driven analysis supports the hypothesis that higher visceral fat, possibly through higher inflammatory activity, exerts detrimental effects on the late-myelinated GM. However, future studies combining imaging techniques capable of quantifying myelin content and AD pathology as well as more detailed measures of visceral fat-related inflammation are needed to test this hypothesis.
Lipid markers and physical activity
We did not observe robust association between markers of lipid metabolism or physical activity and GM networks. In our sample of healthy elderly, we observed higher HDL levels and far less individuals on anti-hyperlipidemic medication compared to others,16,54,55 rendering a low sensitivity to detect HDL-effects on GM structure in our cohort likely. Considering physical activity, longitudinal studies including older adults observed protective effects on GM volume and thickness,55–57 raising the possibility that our cross-sectional questionnaire (IPAQ short version) might not have been sensitive enough to capture these effects. 58 Furthermore, accumulated evidence suggests a positive impact of leisure activities on cognitive function and lowered risk of AD.59,60 Specifically, in an elderly population, such as ours, use of standardized leisure activity questionnaire might better depict factors with possible beneficial effect on brain aging.
Limitations
We are unable to infer causal relationships due to the cross-sectional nature of our study, thus we cannot exclude that changes in GM structure were prior to the differences in cardiovascular risk factors. However, it has been suggested that modifiable risk factors at middle-age are a better predictor of structural decline and cognitive outcomes in later life, 61 which potentially imply even stronger associations of risk factors on GM networks than seen here. The effects of smoking in our cohort could have been underestimated as result of cortical recovery after quitting smoking 15 that might have led to a higher variance within our “previous smoker” group. Despite possible effects of further factors linked with higher cardiovascular risk, such as low “cognitive reserve” or depressive illness, on GM measures,62–65 we did not evaluate these conditions in detail. Strengths of the study include the large population-based sample and the data-driven multi-modal analysis of GM networks, instead of focusing on traditional voxel-wise associations in one modality. This systems-view could increase the interpretability of the effects in older populations on the brain, especially with regard to underlying mechanisms and potential preventive options.1,7,8
Conclusions
Using a large cohort of healthy older adults and a data-driven approach, we were able to replicate and further characterize large-scale, age-sensitive GM networks that inversely correlated with major cardiovascular risk factors, i.e. smoking, blood pressure, long-term glucose, and visceral obesity. The spatial extent and composition of covarying GM measures within the different networks indicated that smoking and, to a lesser degree, higher blood pressure affected GM throughout the brain, which might be attributed to direct and indirect damage of neuronal tissue. Higher HbA1c was found to predominantly affect areas that are known to have high glucose metabolism and early Abeta deposition. In addition, we detected negative effects of visceral obesity on a structural network covering areas rich in intracortical myelinated fibres, possibly pointing to detrimental effects of visceral fat-induced low-grade inflammation on myelin. This proposed mechanism might also help to better understand how a cardiovascular risk factor, in this case WHR, could be a trigger or booster of cognitive decline and regional AD pathology, as this network has specifically been linked to accelerated aging and vulnerability to AD in previous studies. 3 Our additional observation of a negative correlation of both age and memory performance with IC3 further underlines the congruency and the functional relevance of this specific network. Future longitudinal studies including the LIFE follow-up data (starting in August 2017) or those that incorporate more detailed microstructural assessments are now needed to prove our hypotheses and to test if improving cardiovascular risk, specifically visceral obesity, would help to maintain the integrity of GM networks sensitive to aging throughout old age.
Footnotes
Funding
The author(s) disclosed receipt of the following financial support for the research, authorship, and/or publication of this article: This work is supported by the European Union, the European Regional Development Fund, and the Free State of Saxony within the framework of the excellence initiative, and LIFE–Leipzig Research Center for Civilization Diseases, University of Leipzig (project numbers 713-241202, 14505/2470, 14575/2470), and by the German Research Foundation (CRC1052 Obesity mechanisms Project A01 to AV and MS).
Acknowledgements
We thank all members of the LIFE study center for conducting the LIFE-Adult-Study as well as all participants for their valuable collaboration. The funding sources had no role in the design and conduct of the study; collection, management, analysis, or interpretation of the data; preparation, review, or approval of the manuscript; and decision to submit the manuscript for publication.
Declaration of conflicting interests
The author(s) declared no potential conflicts of interest with respect to the research, authorship, and/or publication of this article.
Authors’ contributions
SKM conducted data analysis, statistical analysis, and was involved in the interpretation of results and writing of the manuscript. ML, MLS, SGR-H, MS and TL were involved in study design, data collection and revision of the manuscript. FB and LL contributed to data analysis and manuscript revision. AV was involved in study design and revision of the manuscript. AVW contributed to analysis and interpretation of the data and writing of the manuscript.
References
Supplementary Material
Please find the following supplemental material available below.
For Open Access articles published under a Creative Commons License, all supplemental material carries the same license as the article it is associated with.
For non-Open Access articles published, all supplemental material carries a non-exclusive license, and permission requests for re-use of supplemental material or any part of supplemental material shall be sent directly to the copyright owner as specified in the copyright notice associated with the article.