
Abstract
How stress influences brain repair is an issue of considerable importance, as patients recovering from stroke are known to experience high and often unremitting levels of stress post-event. In the current study, we investigated how chronic stress modified the key cellular components of the neurovascular unit. Using an experimental model of focal cortical ischemia in male C57BL/6 mice, we examined how exposure to a persistently aversive environment, induced by the application of chronic restraint stress, altered the cortical remodeling post-stroke. We focused on systematically investigating changes in the key components of the neurovascular unit (i.e. neurons, microglia, astrocytes, and blood vessels) within the peri-infarct territories using both immunohistochemistry and Western blotting. The results from our study indicated that exposure to chronic stress exerted a significant suppressive effect on each of the key cellular components involved in neurovascular remodeling. Co-incident with these cellular changes, we observed that chronic stress was associated with an exacerbation of motor impairment 42 days post-event. Collectively, these results highlight the vulnerability of the peri-infarct neurovascular unit to the negative effects of chronic stress.
Introduction
For several decades, the promotion of optimal recovery and regeneration of the peri-infarct zone has been a major research goal. It is now understood that following the initial ischemic insult, the peri-infarct zone undergoes a series of highly orchestrated changes, 1 the ultimate goal of which appears to be twofold: firstly to seal the infarction site from viable parenchyma and secondly to re-establish physiological conditions to pre-stroke like levels. For those familiar with the literature concerning peri-infarct remodeling, it is difficult to identify or highlight the importance of any one mechanism or cell type over another. Indeed, in recognition of this fact, scientific efforts have increasingly turned to explanatory frameworks that can be usefully deployed to help unify those experimental findings generated thus far. To this end, the concept of the neurovascular unit (NVU) has gained increasing prominence.
The NVU is considered to be a functionally and structurally interdependent multicellular complex, comprising; endothelial cells, the basal lamina, pericytes, astrocytes, microglia and neurons.2–4 Several groups have proposed that successful recovery depends on the restoration of NVU function.5–9 From the available evidence, it appears that remodeling of the NVU continues for many weeks and potentially months following the initial injury. While the nature of NVU remodeling has been relatively well characterized in the context of stroke, 10 less well known is the extent to which environmental experiences may modify the process.
One of the most relevant environmental inputs encountered during NVU remodelling post-stroke is psychological stress. Recovery from post-stroke is known to be stressful, with patients frequently experiencing severe difficulties with movement, communication, and cognition (and sometimes all three together). Due to these changes, patients often have difficulty in performing what were previously routine tasks, such as navigating spatially, preparing food, and executing other basic domestic activities.11,12 These limitations in turn have flow on effects to other domains of life, such as an individual’s sense of independence, level of social engagement, occupational capacity, and financial situation. Given these serious challenges, it is perhaps unsurprising that many studies have consistently identified high levels of stress in patients recovering from stroke.13,14
In the broadest sense, prior studies have indicated that the application of stress during the recovery period is associated with memory, learning and motor impairments in both humans15–17 and rodents.18–20 It has further been identified that stress exposure following stroke can significantly exacerbate the damage caused by stroke.21,22 To our knowledge, however, there have been no studies that have directly examined the impact of stress on the NVU following stroke.
In the current study, we utilized the photothrombotic model of vascular occlusion to examine cellular level NVU remodelling. We have chosen to run a study with three experimental groups: shams, occlusion alone, and occlusion with stress. We were not interested in the effects of stress by itself, as this phenomenon has been examined elsewhere.23–37 The addition of a stress alone condition would have unnecessarily reduced the overall level of experimental power. The principal question that we wanted to address in this study was “do animals exposed to stress and vascular occlusion respond differently to those exposed to vascular occlusion alone?” A sham group was also included to confirm that the occlusion procedure was effective. Understanding basic information about how chronic stress influences the NVU will potentially open up future opportunities for targeting modifiable lifestyle factors to minimize complications arising during the recovery process.
The current study focused on investigating changes in vasculature, microglia, astrocytes, and neurons within the peri-infarct zone. We examined changes in the morphology, distribution and density of labeling for vessels. Key vascular growth factors were measured including VEGF, Angopoietin-1 (Ang-1) and Angiopoientin-2 (Ang-2) each of these have well described roles in promoting vascular growth post-stroke.38–42 Microglial (Iba-1), astrocyte (GFAP) and neuronal markers (Synaptophysin, PSD-95 and NeuN) were also measured. Cell counts were also undertaken. Additionally, weight change was monitored; changes in motor function were examined, as was tissue loss within the infarcted hemisphere. Briefly, these investigations provided results that we have interpreted as suggesting that chronic stress deployed during the recovery process profoundly disrupts the remodeling of the NVU and exacerbates the severity of stroke induced motor deficits.
Materials and methods
Animal numbers and treatment groups
A total of 80 C57BL/6 adult male mice were used in the study. In all instances, animals were randomly allocated to one of three treatment conditions: (1) sham; (2) stroke; and (3) stroke with stress. There were three main cohorts run in the study, the first was for the collection of paraformaldehyde fixed tissue, the second for fresh tissue for western blotting and the third was for validating the stress protocol to induce robust elevations of circulating corticosterone.
The first cohort (fixed tissue) 8 animals were assigned to the sham group, and 12 each to the stroke groups. Two animals were removed from the stroke, one due to surgical complications and the second due to absence of stroke. The second cohort (fresh tissue) had eight animals per group assigned. There were no losses. In the third stress validation cohort, there were six animals assigned to each of the four time points evaluated. For randomized allocation of animals, we used computer-generated random numbers. 43 Specifically, all animals were given a unique identifier upon arrival into the facility. For instance, the first cohort of 32 animals was numbered 1–32. The sequence of numbers from 1 to 32 was then randomised. The first 8 in the sequence were assigned to the sham group, the second 12 to the stroke group and the third 12 to the stroke stress group.
Animals were obtained from the Animal Services Unit at the University of Newcastle. Animals were maintained in a temperature (21℃ ± 1) and humidity controlled environment with food and water available ad libitum. Lighting was on a 12:12 h reverse light–dark cycle (lights on 19:00 h) with all procedures conducted in the dark phase under low-level red lighting (40 Lux). All animals were allowed to habituate for a minimum of seven days prior to the start of the experiment. All experiments were approved by the University of Newcastle Animal Care and Ethics Committee, and conducted in accordance with the New South Wales Animals Research Act and the Australian Code of Practice for the use of animals for scientific purposes. This study complied with the ARRIVE guidelines.
Photothrombotic occlusion
On Day 0 (D0), mice were anaesthetized by isoflurane in an induction chamber (4% for induction, 2% for maintaining) in 100% oxygen. The skin along the midline of the scalp, from the eye level down to the neck, was incised and the skull was exposed. Photothrombotic vascular occlusion was induced by intraperitoneal injection of mice with 0.2 mL of 10 mg/mL of rose Bengal 8 min prior to 15 min of illumination, using a cold light source with a fibre optic end of 4.5 mm diameter placed 2.2 mm left lateral of Bregma onto the exposed skull. The area of illuminated includes the motor (M1) and somatosensory (S1) cortices. The interaction of light with the dye (at its excitation wavelength) initiates the generation of free radicals that damage the endothelial membranes, and subsequently trigger a thrombotic reaction resulting in microvessel occlusion. After 15 min of illumination, the skin of the scalp was closed using surgical cyanoacrylate glue. For the sham group, similar procedure was applied except rose Bengal was replaced with 0.2 mL of 0.9% saline.
Stress protocol
Repeated restraint stress is one of the most widely used models for inducing chronic stress in rodents’ studies.22,44–47 This model, as many others have previously reported induces the archetypal features of the stress response, including persistent weight loss, an enduring consequence of ongoing stress in the rodent.48–50 At the beginning of the study, all animals were randomly assigned to their experimental groups. Two to three animals from the same group were housed per cage. The stress protocol was initiated on D3 when animals had recovered from stroke. Stress was induced using a restraint stress model where animals were placed in 50 mL conical tubes. The restraint tubes had 20–30 ventilation holes (0.5 cm in diameter) across the surface of the tubes. A larger hole was made at each end of the tube to comfortably accommodate the tail and nose. The animals received no food or water during the stress protocol. At the end of the session, animals were returned to their home cages. Animals were randomly stressed five days per week, accumulating to a total exposure of 20 h per week for six consecutive weeks. Stress duration was varied between two and six hours per day as it has previously been identified varying the ratio of free time to restraint time maintains responsiveness to a homotypic stressor (reviewed in 51 ). We and others have successfully used the protocol previously.52,53 Non-stressed animals had no access to food and water for the same period of time as stressed animals, and were handled for 2 min twice daily throughout the duration of experiment. All animals were weighed on D0 before stroke and D42 post-stroke.
Validation of stress protocol using the open field test
To detect spontaneous locomotor activity and exploration behaviour, all mice were tested in an open field environment on D42. The open field arena was 40 cm ×40 cm × 40 cm. Each mouse was placed into the center of the open field, and the activity was recorded by a camera above the apparatus for 5 min. Videos then were analyzed by EthoVision XT system (Noldus, Wageningen, The Netherlands). The software detected and tracked the mouse and reported the distance travelled in the center (12 cm × 12 cm, the center of the arena) and four corners (14 cm × 14 cm) (Supplementary materials Figure S1). All analysis was conducted by the computer and independent to the experimenter.
Validation of effectiveness of the stress protocol to acutely elevated circulating corticosterone
Blood samples were collected transcardially during euthanasia, and centrifuged (5000 r/min, 10 min, 4℃) to separate serum after staying in room temperature for 30 min. The corticosterone ELISA kit (Arbor Assay) was used to detect mouse serum corticosterone levels (Supplementary materials Figure S2).
Spontaneous forelimb asymmetry task (cylinder task)
To assess the motor function recovery, all mice were tested in the cylinder task on Day 0 (D0) prior to sham or stroke and again on D42. The animal was placed in a 10 × 20 cm transparent glass cylinder. Video cameras were set up to record from two opposite angles of the cylinder. Footage was collected for 3 min. Usage of right forelimb (impaired forelimb), left forelimb (non-impaired forelimb) and simultaneous (both) forelimbs to contact the cylinder wall to support the animal’s weight when rearing to a standing position were recorded by a blinded scorer for 20 contacts.54,55 The asymmetry score that was initially described by Schallert et al. 56 was calculated as follows [(non-impaired forelimb contact – impaired forelimb contact)/(non-impaired forelimb contact + impaired forelimb contact + both contacts)]. The higher the asymmetry score is, the greater the preference for using the non-impaired forelimb and thereby the more serious the motor dysfunction displayed.
Fixed tissue processing
Animals were deeply anesthetized via intraperitoneal injection of sodium pentobarbitol and transcardially perfused with ice cold 0.9% saline for 2 min followed by ice cold 4% paraformaldehyde (pH 7.4) for 13 min. Brains were removed and post-fixed for 4 h in the same fixative then transferred to a 12.5% sucrose solution in 0.1 M PBS for storage and cryoprotection. Serial coronal sections were sliced on a freezing microtome (−25℃) at a thickness of 30 µm.
Ipsilateral hemisphere tissue loss quantification
To analyze how stroke altered tissue loss in the infarcted cortex, the area of contralateral and ipsilateral hemispheres was measured across three adjacent sections which were used for Collagen IV, GFAP and NeuN staining (effectively spanning 900 µm with an inter section spacing of 180 µm) using Image J. 57 Images were acquired using Q-imaging camera mounted to a brightfield microscope connected to a computer. The software, Neurolucida v10, was used to mosaic and measure the size of the whole ipsilateral and contralateral hemisphere, respectively. The areas of the ventricles within the sections were measured and their area excluded of the total hemispheric area. Tissue loss was calculated as the tissue loss of each section, calculated as (the area of contralateral hemisphere – the area of the ipsilateral hemisphere), with a 900-µm distance between sections for three sections. All images were analyzed in a blinded manner.
Immunohistochemistry
For immunoperoxidase labelling, free-floating sections were immunostained as previously described 29 with the primary antibodies (see details in Supplementary materials Table 1). Sections immunostained by rabbit anti-collagen IV were carried out pepsin antigen retrieval as described. 58 Sections were rinsed with 0.1 M PBS and then endogenous peroxidases were quenched in 0.1 M PBS containing 3% hydrogen peroxide. Non-specific binding was blocked with 3% normal horse serum. Sections were incubated in primary antibody with 2% normal horse serum for 48 h at 4℃ and then were washed by 0.1 M PBS for 30 min and incubated with biotinylated goat a secondary antibody of corresponding species for 2 h at room temperature, rinsed, incubated in 0.1% extravadin peroxidase for 1 h, and then rinsed again. Immunolabelling was developed using a nickel-enhanced 3, 3′-diaminobenzidine (DAB) reaction. Details concerning the nature of the colour changes induced by DAB labelling are provided in the Supplementary materials. Tissues of three groups were performed simultaneously and the DAB reactions were developed for exactly the same length of time following the addition of glucose oxidase (1:1000).
Negative control process for DAB immunohistochemistry
Two main control processes were used to confirm the specificity of labelling. The first involved the processing of the tissue with only secondary antibody. In the second control approach, we utilized a non-immune isotype matched immunoglobulin, as a primary antibody, followed by standard processing. Images for each control were provided (see Supplementary materials Figure S3).
Final slide preparation
After DAB development was complete, sections were washed, mounted onto chrome alum-coated slides, and coverslipped.
Image acquisition, thresholding and cell count analysis
Images were acquired at 20× using a Q-imaging camera mounted to a bright-field microscope connected to a computer running Neurolucida v10. Mosaic images were acquired of the whole brain section at the level of the motor cortex (Bregma 0.0 mm) using Neurolucida v10. The quantitative analysis was undertaken specifically in the peri-infarct territory as defined by 0.01 mm from infarct, the region was 0.25 mm by 0.5 mm in size. Matlab software was used to crop regions of interest from the mosaics (Figure 1(a)), these cropped regions were thresholded and the data exported to excel. A pixel intensity level considered to be optimal for detecting genuine differences in immunoreactive signal was determined using Image J software (Supplementary materials Figure S4), and these threshold levels were used in independent t-tests (alpha = 0.05) for significance. Exhaustive (every cell) manual cell counts (Iba-1, GFAP, NeuN) were undertaken in the images that we utilised for the threshold analysis. Here our motivation was to determine whether an increase or decrease in immunoreactive material was driven by a change in cell number. One section from each brain was processed at the level of the infarct. All images were analysed in a blinded manner.
(a) Schematic representation (left) and representative section (right) of the somatosensory cortex and motor cortex regions at Bregma (0.0 mm). Red square is the peri-infarct zone, which is located in the primary somatosensory cortex forelimb region (S1FL) and was the primary subject of the investigations undertaken in the current study. Scale bar (bottom right panel a) represents 1 mm. The picture depicted in a (left) has been adapted from Paxinos and Franklin.
83
(b) Illustrates the tissue loss of the three groups examined. (c) Illustrates the placement of the mouse in the cylinder in which the spontaneous forelimb placement task is undertaken. (d) Provides the means levels of paw asymmetry prior to and 6 weeks following infarction. Data expressed as mean ± SEM for sham = 8, stroke = 10 and stroke stress = 12. ns: not significant, **p < 0.025, ***p < 0.016, Holm’s a priori analysis α correction procedure.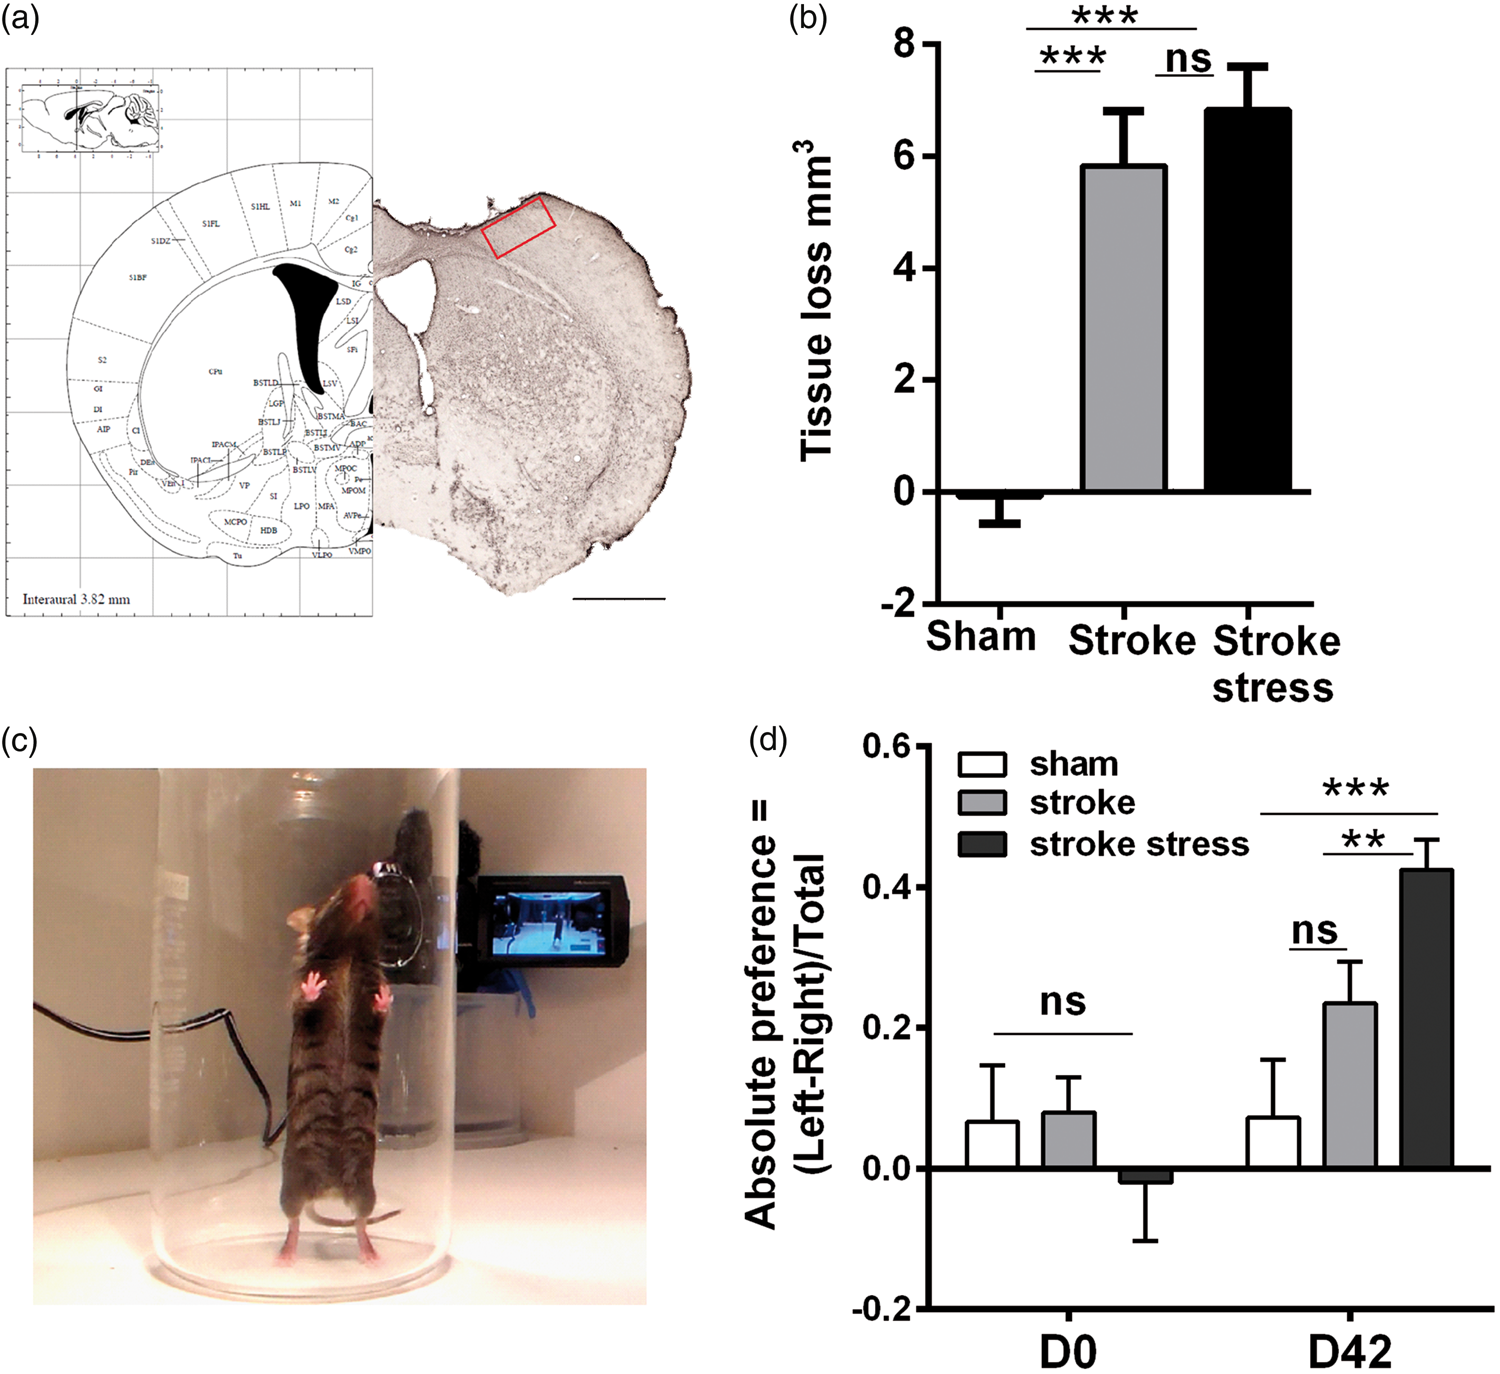
Western blotting of fresh tissue homogenate
Fresh tissue extraction and western blotting was performed as previously described 22 (also see Supplementary materials for further detail). Samples were mixed with sample buffer (2% sodium dodecyl sulfate, 50 mM Tris, 10% glycerol, 1% DTT, 0.1% bromophenol blue, pH 6.8) and 15 µg of total tissue protein samples were electrophoresed to Biorad Criterion TGC Stain-Free 4–20% gels. Gels were transferred to PVDF membranes in transfer buffer (25 mM Tris, 200 mM glycine, and 20% methanol pH 8.3). PVDF membranes were washed in Tris-buffered saline with tween (TBST) (150 mM NaCl, 10 mM Tris, 0.075% Tween-20, pH 7.5) and blocked in 5% skim milk powder (SMP) in TBST for 1 h at 25℃. Membranes were incubated with primary antibodies for overnight at 4℃ and secondary antibody for 1 h at 25℃ (see details in Supplementary materials Table 1). In between each incubation step, membranes were washed in TBST. Membranes were visualized on Amersham Imager 600 using Luminata Classico Western blotting detection reagents. The density of the bands was measured on raw blots using Amersham Imager 600 Analysis Software. For representative images, two out of eight bands per group were cropped from the raw blots and aligned together with MW markers. The bands were then minimally processed in term of brightness and contrast, and presented as the representative blots in the figures.
Data analysis
All data were analyzed using the Statistical Package for Social Sciences (SPSS, version 21, IBM). Estimates of effect size (d) during the design phase for variables ranged from 0.8 to 2.5. Using this d value, we calculated sampe size to be appropriate if between 3 and 11 per group, when we undertook a two-sided independent samples t-test, with alpha set to 0.05, and the desired power = 0.8.
Comparison logic
Western blotting and immunohistochemistry analyses of blood vessel markers, vascular growth factors, glial markers, and neuronal markers in peri-infarct territories across groups.
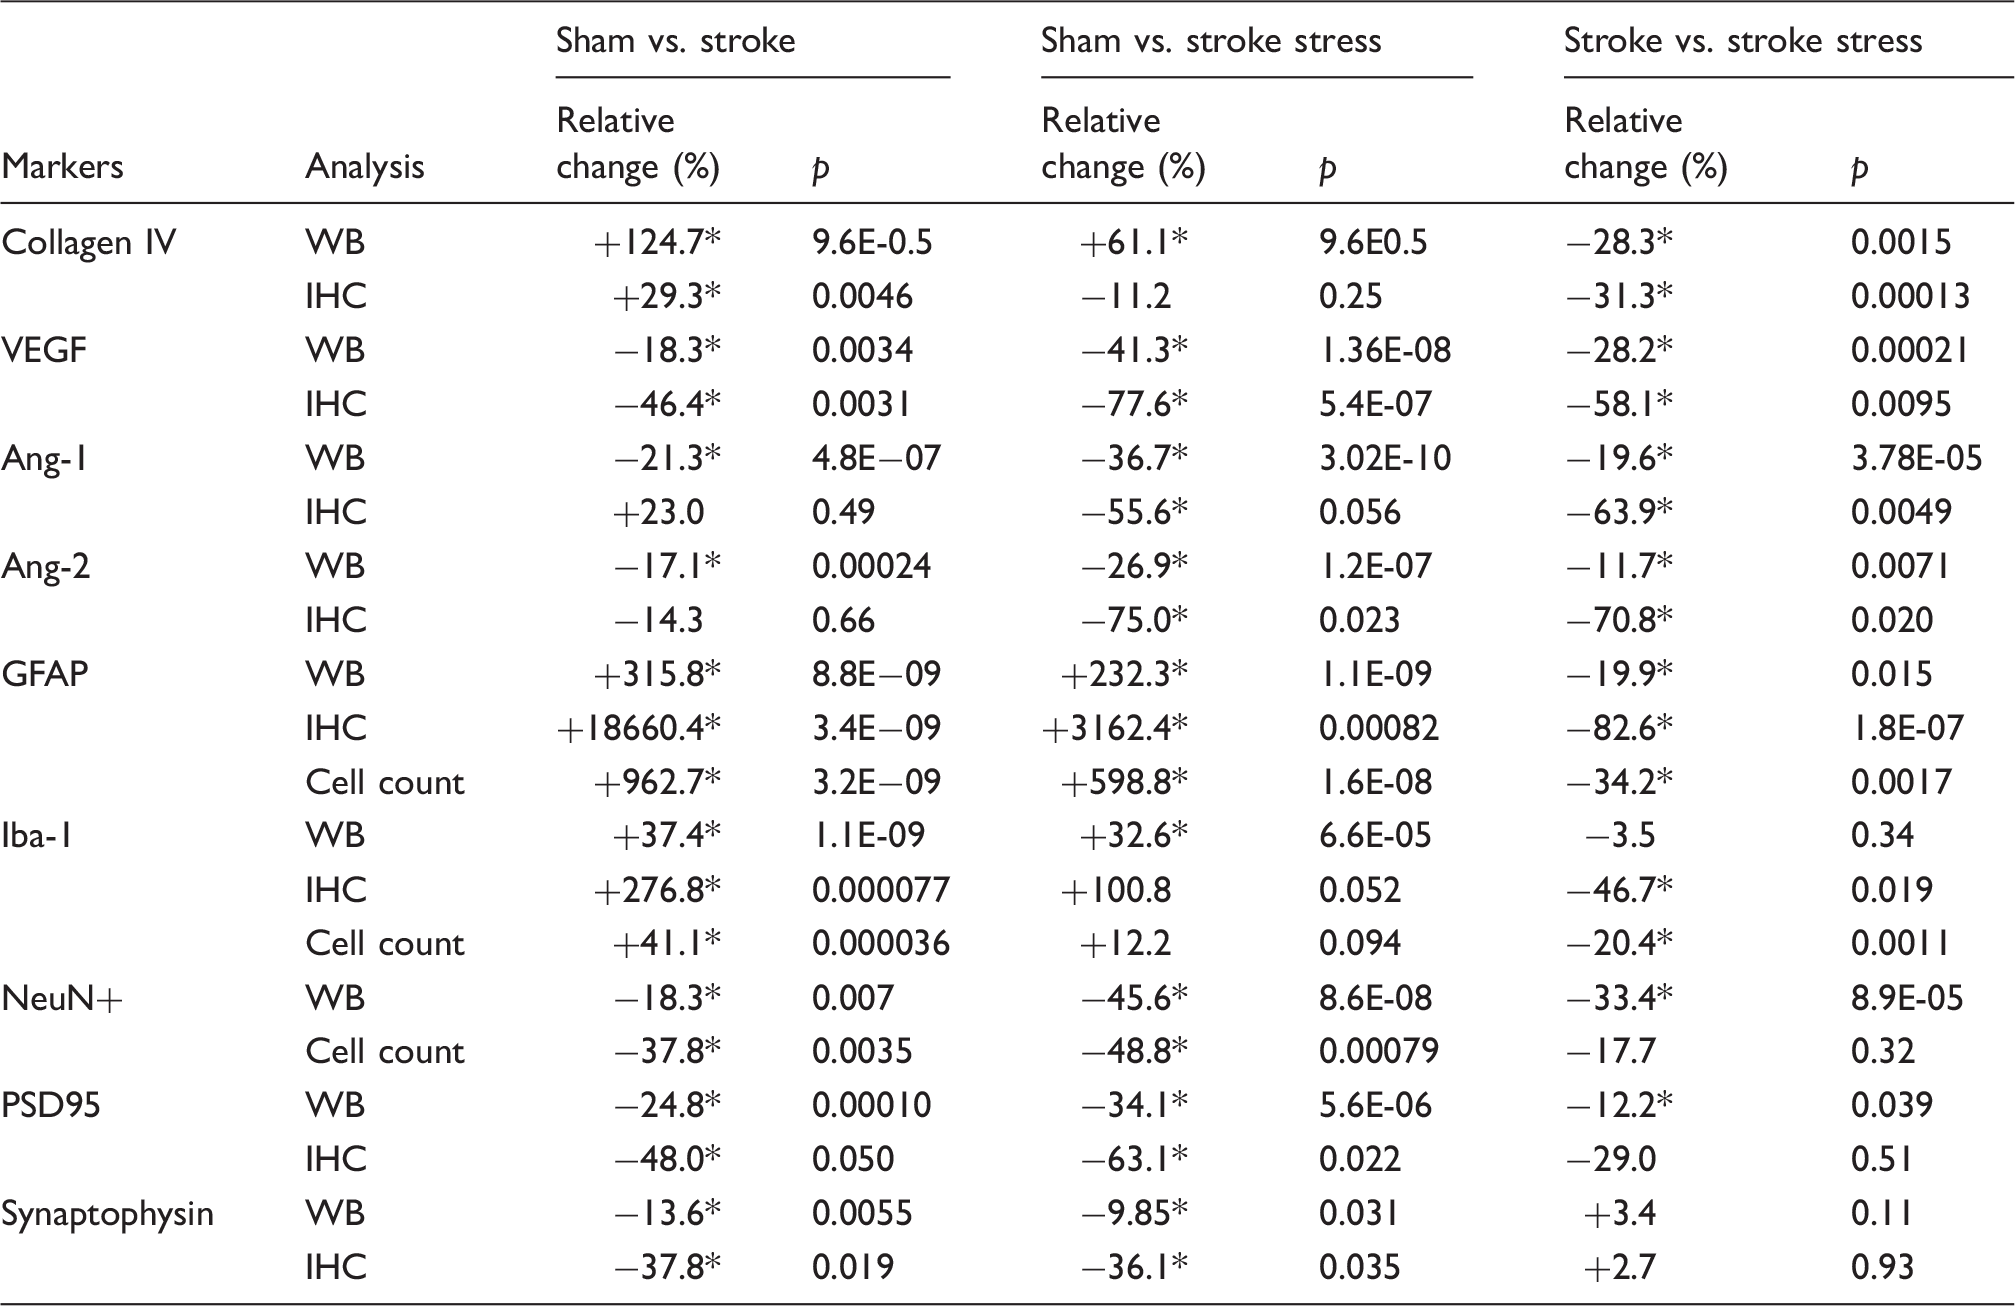
p < 0.05.
WB: western blotting; IHC: immunohistochemistry; VEGF: vascular endothelial growth factor; Ang-1: Angiopoientin-1; Ang-2: Angiopoientin-2; GFAP: glial fibrillary acidic protein; PSD95: postsynaptic density protein 95; df: degree of freedom; (+): relative increase; (−): relative decrease. n = 8–12 per group; relative difference is calculated by (stroke – sham)/sham; (stroke stress – sham)/sham: (stroke stress – stroke)/stroke respectively.
Results
Confirmation of the effectiveness of the stress protocol (Behaviour, Corticosterone, Weight Gain)
Behaviour
Exposure to chronic stress induced a mild anxiety phenotype in stroked mice exposed to chronic stress over stroke alone (p < 0.05, see Supplementary materials Figure S1).
Corticosterone release
We confirmed that a single exposure to restraint was able to robustly elevate circulating levels of corticosterone (see Supplementary materials Figure S2).
Weight
We utilised the measurement of weight gain, to confirm the persistent effect of stress exposure protocol. The baseline body weight was 24.6 ± 0.2 g (minimum =22.0 g; maximum = 27.3 g). Changes (delta Δ grams (g)) in body weight from baseline are shown in Supplementary materials Figure S5. Assessing the Δ body weight clearly indicated that exposure to stroke resulted in a statistically significant decrease in weight (p < 0.05), compared to sham animals. Further, the stroke and stress group exhibited reduced weight gain relative to the stroke alone condition (p < 0.016) (see Supplementary materials Figure S5).
Exposure to stress does not alter the tissue loss after stroke
Both stroke groups had significantly increased levels of tissue loss relative to the sham group at the level of assessment (p < 0.05, Figure 1(b)). However, there is no difference between stroke only and stroke stress groups.
Exposure to stress post-stroke significantly exagerates performance in the spontaneous forelimb asymmetry task
Pre- and post-stroke all three groups were evaluated using spontaneous forelimb asymmetry task. Specifically, this evaluates the paw preference that animals exhibit for stabilising themselves while rearing within a cyclinder (Figure 1(c)). Data on the mean asymmetry scores indicated that there were no significant differences in paw preference prior to stroke induction (p > 0.05, Figure 1(d)). Differences, however, were noted at D42 post stroke. Specifically, the chronically stressed group exposed to stroke exhibited a significantly stronger preference for using their unaffected paw relative to the stroke alone group (p < 0.016). No differences were observed between the stroke alone and sham groups (p = 0.12).
Chronic stress post-stroke decreased the expression of blood vessel marker Collagen-IV
To assess the vasculature after stroke, the vascular marker Collagen IV was analyzed by Western blotting. Compared to sham animals, stroke alone induced a significant increase in Collagen IV protein levels, while this response was suppressed significantly in stroke-stress animals. To confirm the Western blotting result, collagen IV was also investigated using immunohistochemistry and threshold analysis. Here we observed that stroke drove a significant increase in vessel formation, as indexed via Collagen-IV, and this response was significantly suppressed by exposure to chronic stress. For specific statistics see details in Figure 2 and Table 1.
(a) Representative immunoblots for Collagen IV and β-actin from the peri-infarct region. The results for Collagen IV level were calculated relative to β-actin levels. Data were expressed as a fold increase of the mean ± SEM for each group relative to the mean of the sham group. (n = 8 per group). (b) Vascular labelling using Collagen-IV within the peri-infarct region. Three left most panels in each row illustrate representative labelling for each protein investigated for the three groups, sham, stroke and stroke + stress. The right most panel of b illustrates the mean levels of % thresholded material. Data expressed as mean ± SEM for sham = 8, stroke = 10 and stroke stress = 12. ns: not significant, ***p < 0.016, Holm’s a priori analysis α correction procedure. Bar represents 100 µm.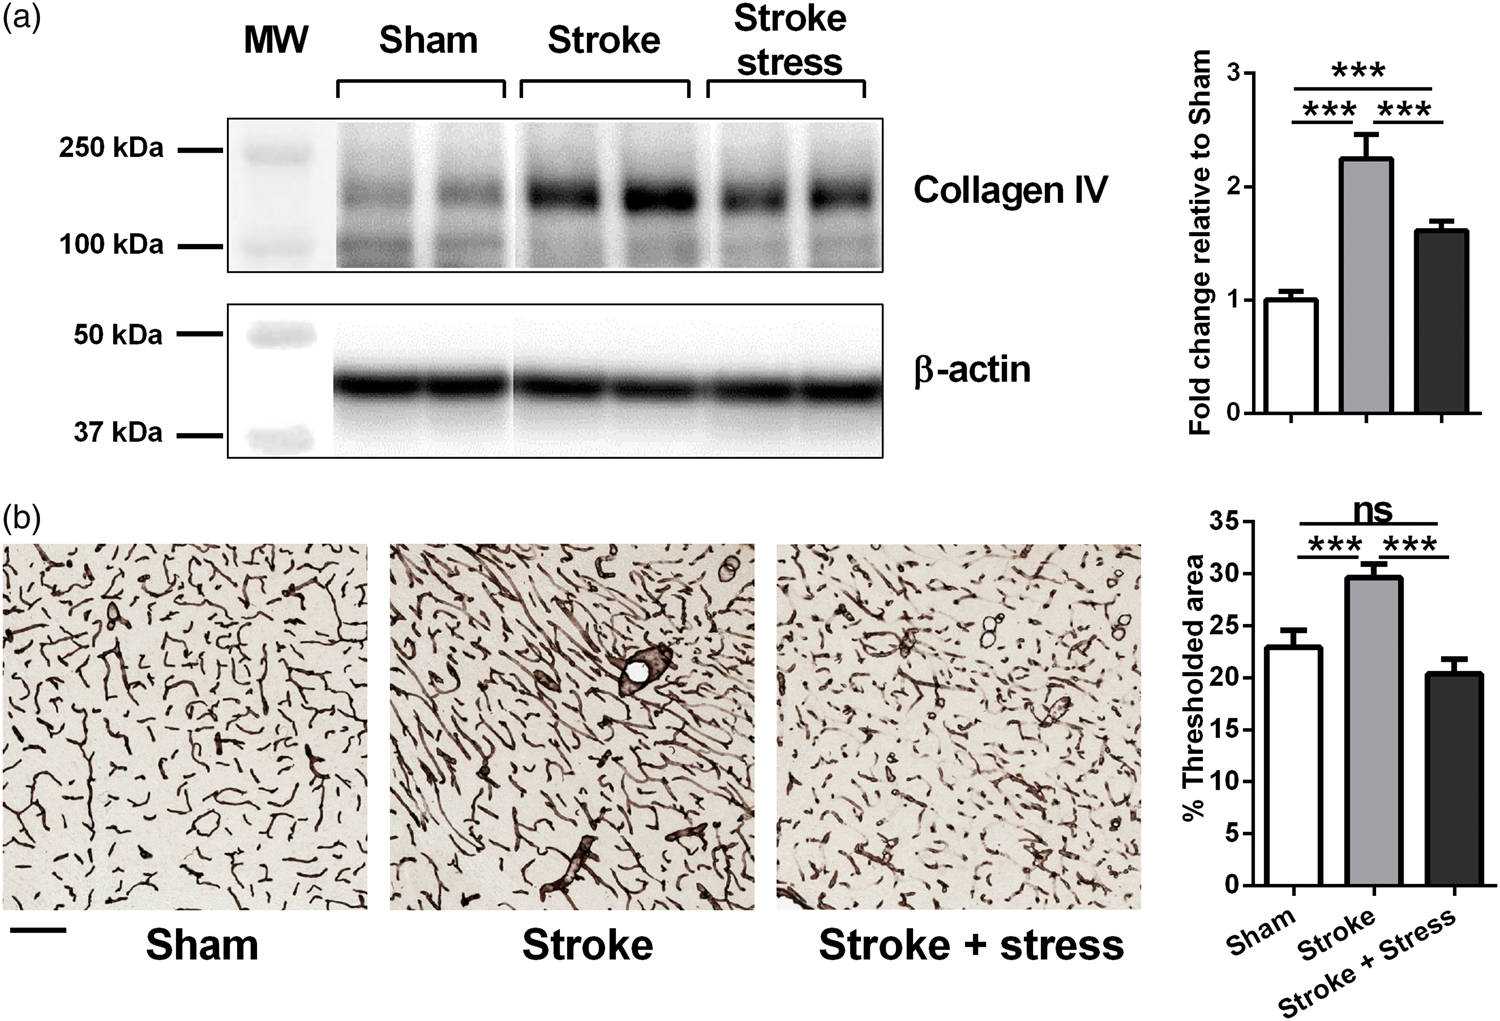
Stress post-stroke decreased the expression of vascular growth factors (VEGF, Ang-1 and Ang-2)
The expression of VEGF, Ang-1 and Ang-2 was examined by Western blotting and immunohistochemistry. The results are detailed in Figure 3 and Table 1. Briefly, for VEGF expression, Western blotting and immunohistochemistry analyses produced very similar patterns. Stroke alone induced a significant reduction of VEGF relative to sham animals, and stress induced a further reduction compared to stroke alone. The stroke stress group displayed significantly reduced levels of Ang-1 and Ang-2 relative to both the other treatment groups.
Representative immunoblots for VEGF (a), Ang-1 (b), Ang-2 (c) and β-actin from the peri-infarct region. The results for all the protein levels were calculated relative to β-actin levels. Data were expressed as a fold increase of the mean ± SEM for each group relative to the mean of the sham group. (n = 8 per group). Three left most panels illustrate representative labelling for VEGF (d), Ang-1 (e), Ang-2 (f) investigated for the three groups, sham, stroke and stroke + stress. The right most panels illustrate the quantification of the change in % of thresholded material for each of the proteins examined. Data expressed as mean ± SEM for sham = 8, stroke = 10 and stroke stress = 12. ns: not significant, ***p < 0.016, **p < 0.025, Holm’s a priori analysis α correction procedure. Bar represents 100 µm.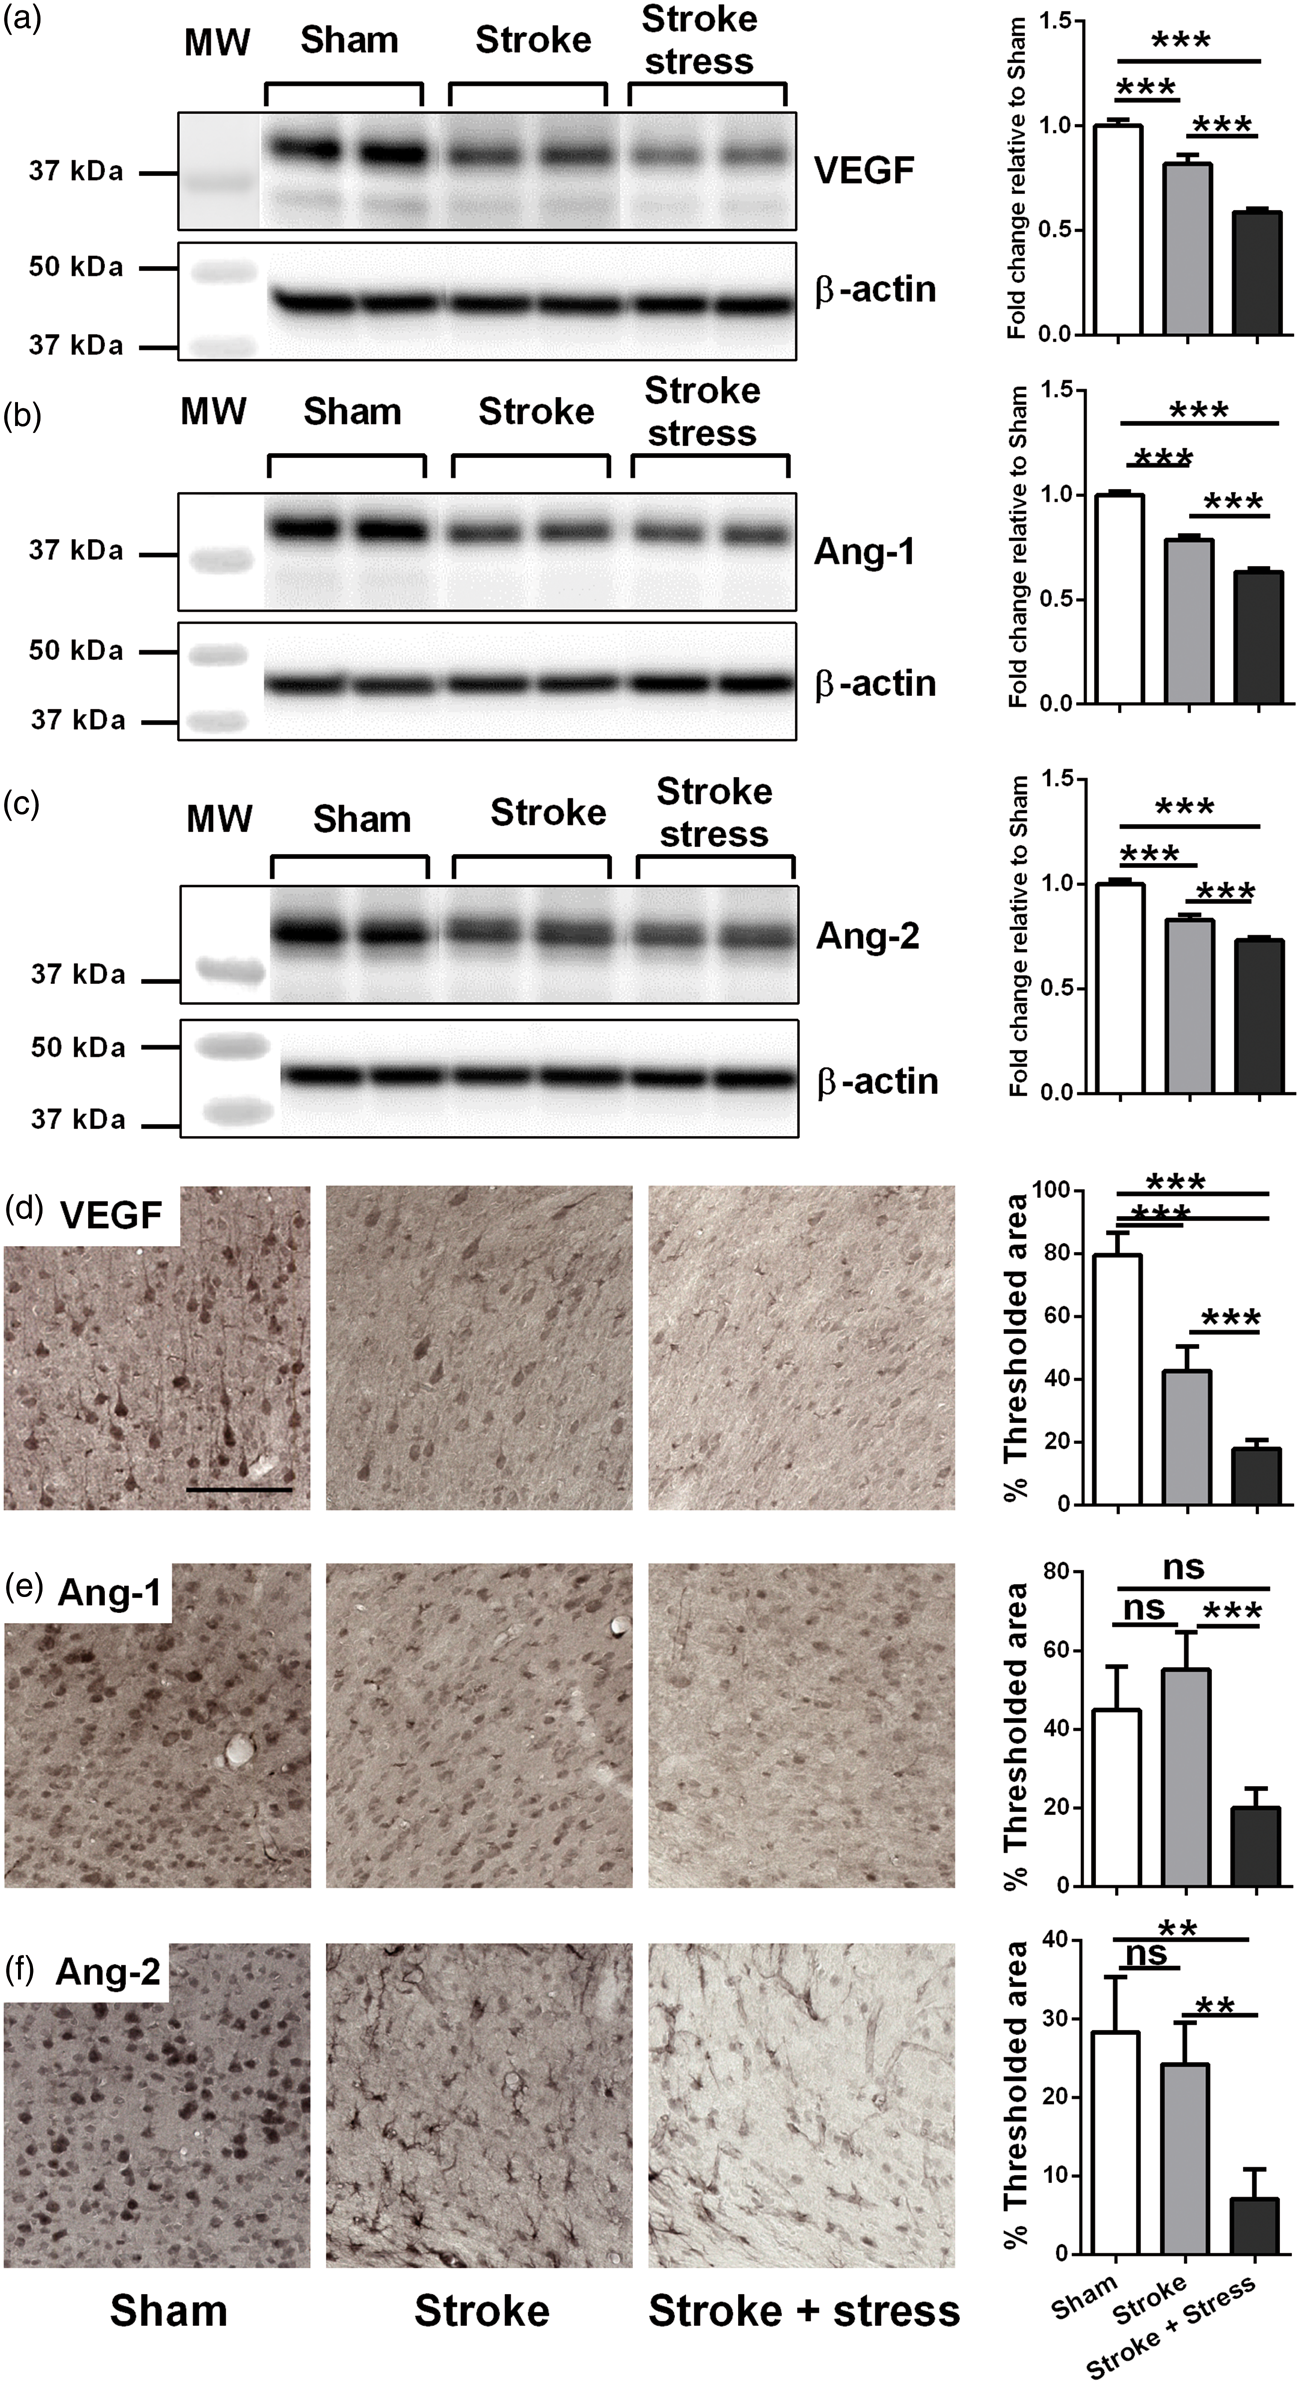
Chronic stress disrupts the expression of GFAP and Iba-1
Western blotting analysis indicated that the levels of both GFAP and Iba-1 were elevated in stroked animals (irrespective of the presence of stress) relative to sham animals. Stroke and stress animals had lower levels of GFAP relative to the stroke alone group but there was no observable difference in Iba-1 levels. In terms of the immunohistochemistry results, the expression levels of GFAP and Iba-1 demonstrated a similar pattern. Both GFAP and Iba-l were significantly elevated in the stroke groups relative to the sham group. Stroke and stress animals exhibited significantly lower expression of both GFAP and Iba-1 relative to the stroke alone group. See Figure 4 and Table 1 for details.
Representative immunoblots for GFAP (a), Iba-1 (b), and β-actin from the peri-infarct region. The results for all the protein levels were calculated relative to β-actin levels. Data were expressed as a fold increase of the mean ± SEM for each group relative to the mean of the sham group. (n = 8 per group). ns: not significant, ***p < 0.016, Holm’s a priori analysis α correction procedure. Three panels on top illustrate representative labelling for GFAP (c) and Iba-1 (d) respectively for the three groups, sham, stroke and stroke + stress. Insets of c and d demonstrate the cellular structures of astrocyte and microglia, respectively. The bottom panels illustrate the quantification of the change in % of thresholded material and cell counts for each of the protein examined. Data expressed as mean ± SEM for sham = 8, stroke = 10 and stroke stress = 12. ns: not significant, ***p < 0.016, **p < 0.025, Holm’s a priori analysis α correction procedure. Bar on top of 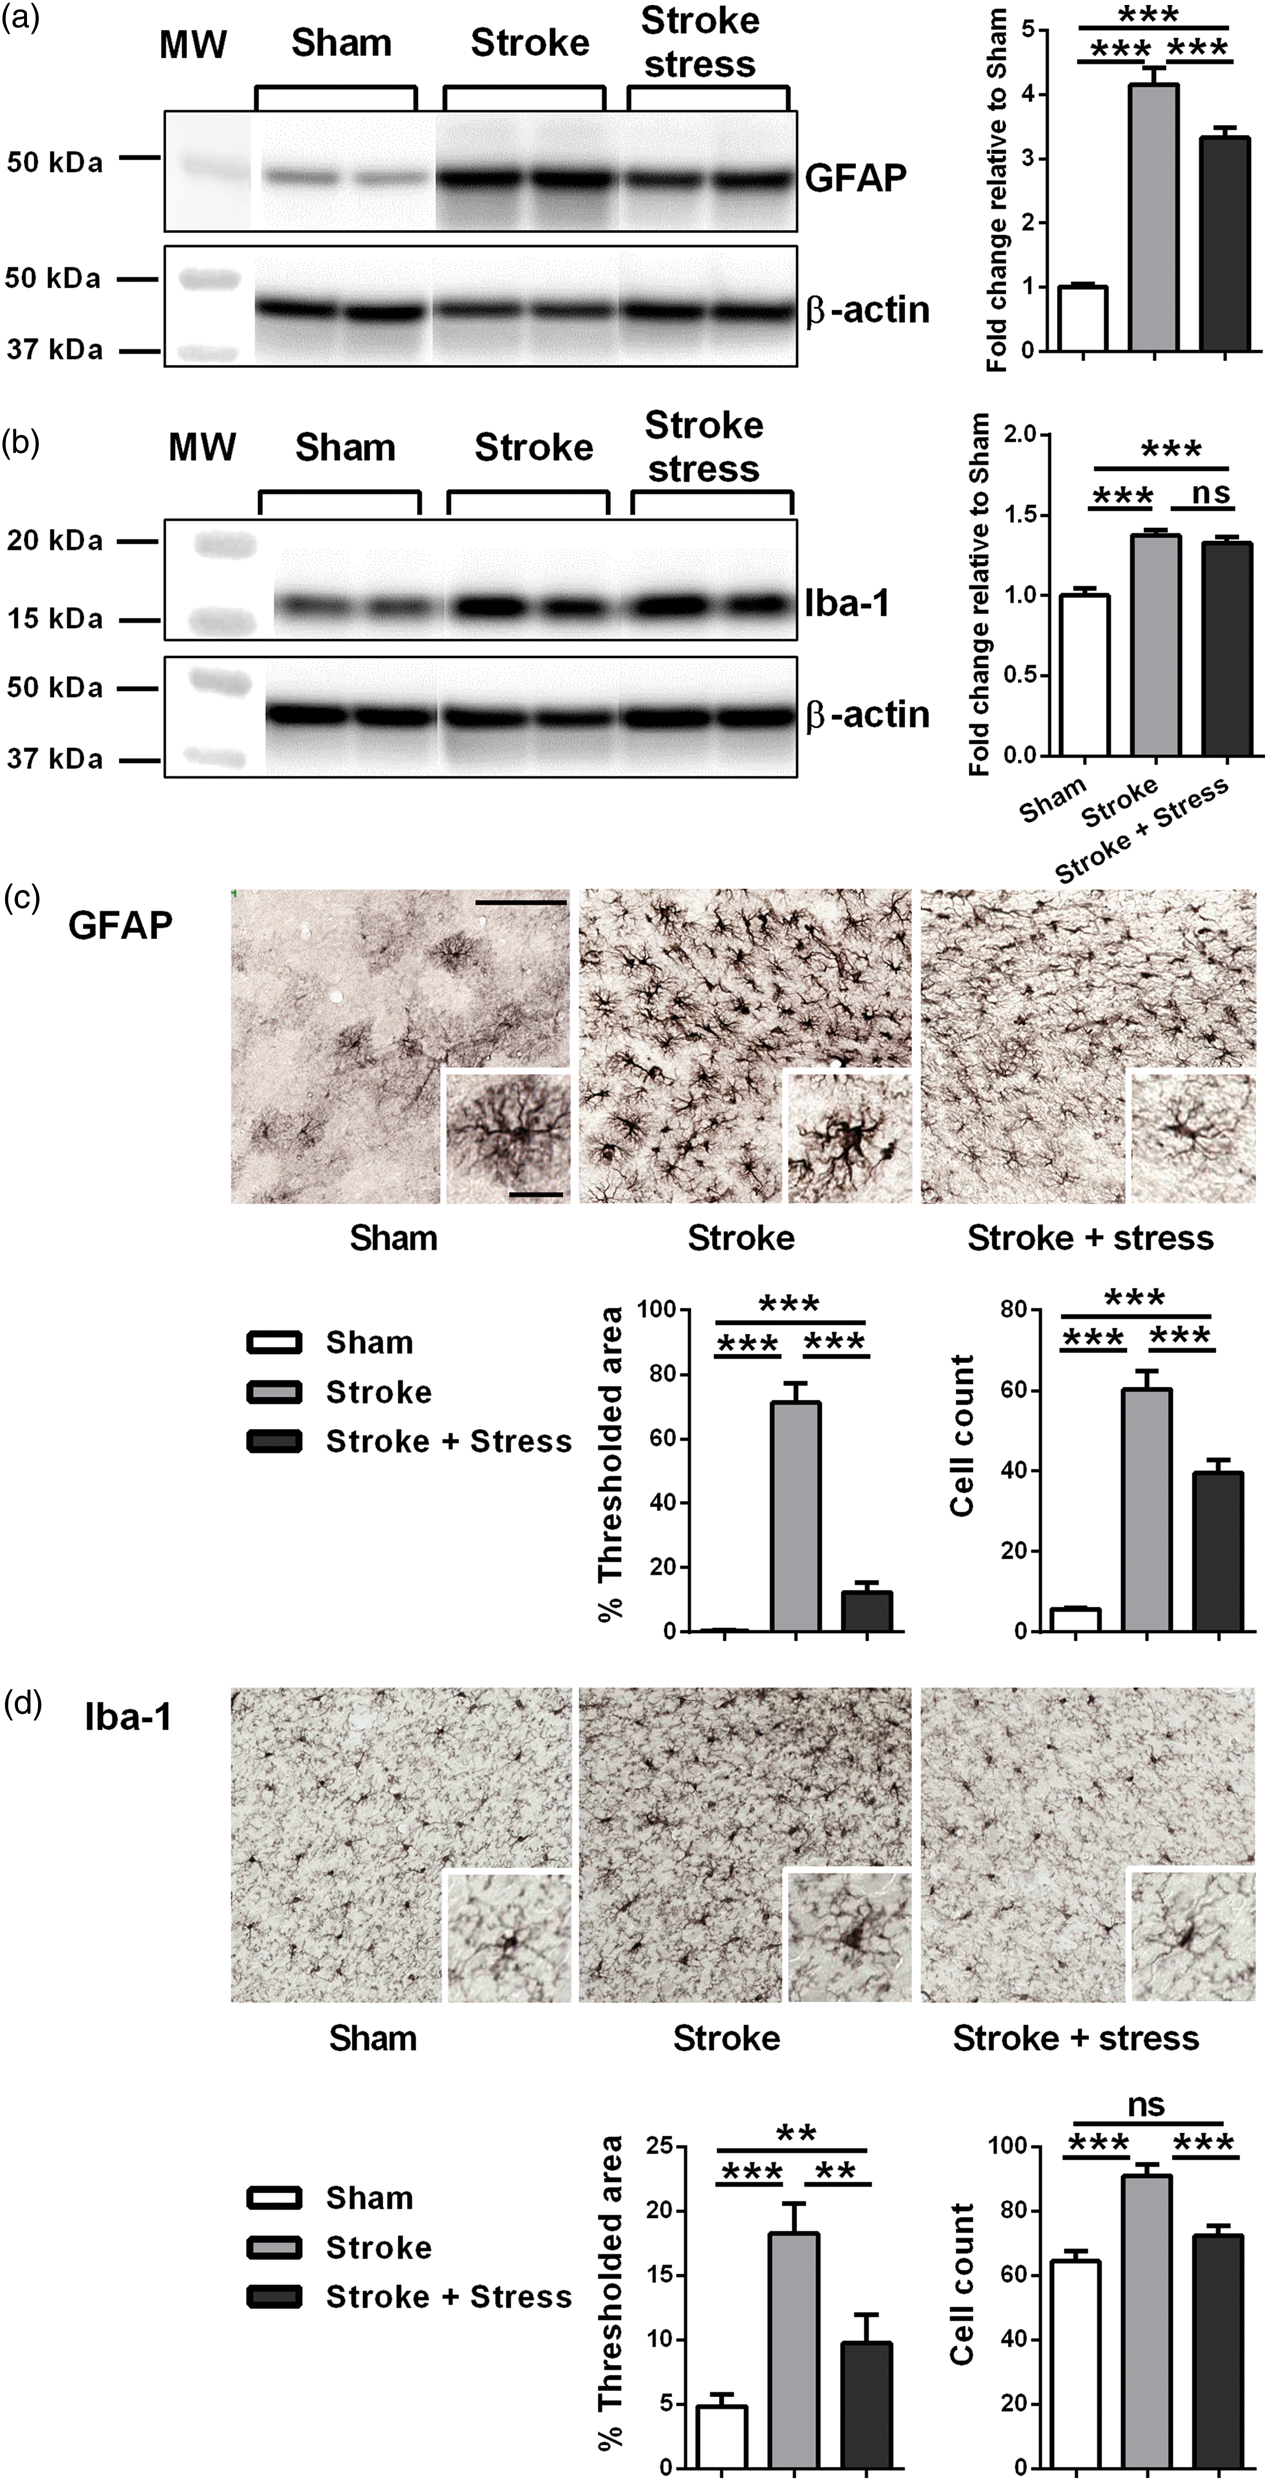
Chronic stress reduces the numbers of astrocytes and microglia present in the peri-infarct zone post stroke
With the same images used for the expression analysis, manual and exhaustive counting of GFAP positive and Iba-1 positive cells was undertaken. This indicated that stroke, irrespective of stress, significantly elevated the numbers of identifiable GFAP positive cells. Stroke animals exposed to stress presented with significantly fewer GFAP positive cells relative to the stroke alone group. Expression of Iba-1 followed a similar pattern, with the stroke groups exhibiting a significant increase in the number of Iba-1 positive cells. As was the case for GFAP, the stroke and stress group was also found to fewer Iba-1 positive cells than the stroke alone group. In contrast to GFAP, no statistically significant differences were found between the stroke and stress group relative to the sham group. See Figure 4 and Table 1 for details.
Chronic stress disrupts the expression of neuronal markers
Stroke, irrespective of stress, reduced the number of NeuN positive cells. Stroke also resulted in reduced protein expression of NeuN, PSD-96 and Synaptophysin. Further analysis indicated that stroke animals exposed to stress, exhibited significantly lower levels of NeuN, PSD-95 in comparison to stroke alone condition (p < 0.05). Only stroke effects were identifiable using IHC, with all markers down relative to the sham group. No additional effect for stress could be observed. See details in Figure 5 and Table 1.
Representative immunoblots for NeuN (a), PSD-95 (b), Synaptophysin (SYNAP) (c) and β-actin from the peri-infarct region. The results for all the protein levels were calculated relative to β-actin levels. Data were expressed as a fold increase of the mean ± SEM for each group relative to the mean of the sham group. (n = 8 per group). The three left most panels in each row illustrate representative labelling for NeuN (d), PSD-95 (e), Synaptophysin (SYNAP) (f) investigated of the three groups, sham, stroke and stroke + stress. The right most panel illustrates the quantification of the change in % of thresholded material. Data expressed as mean ± SEM for sham = 8, stroke = 10 and stroke stress = 12. ns: not significant, ***p < 0.016, **p < 0.025, *p < 0.05, Holm’s a priori analysis α correction procedure. Bar represents 100 µm.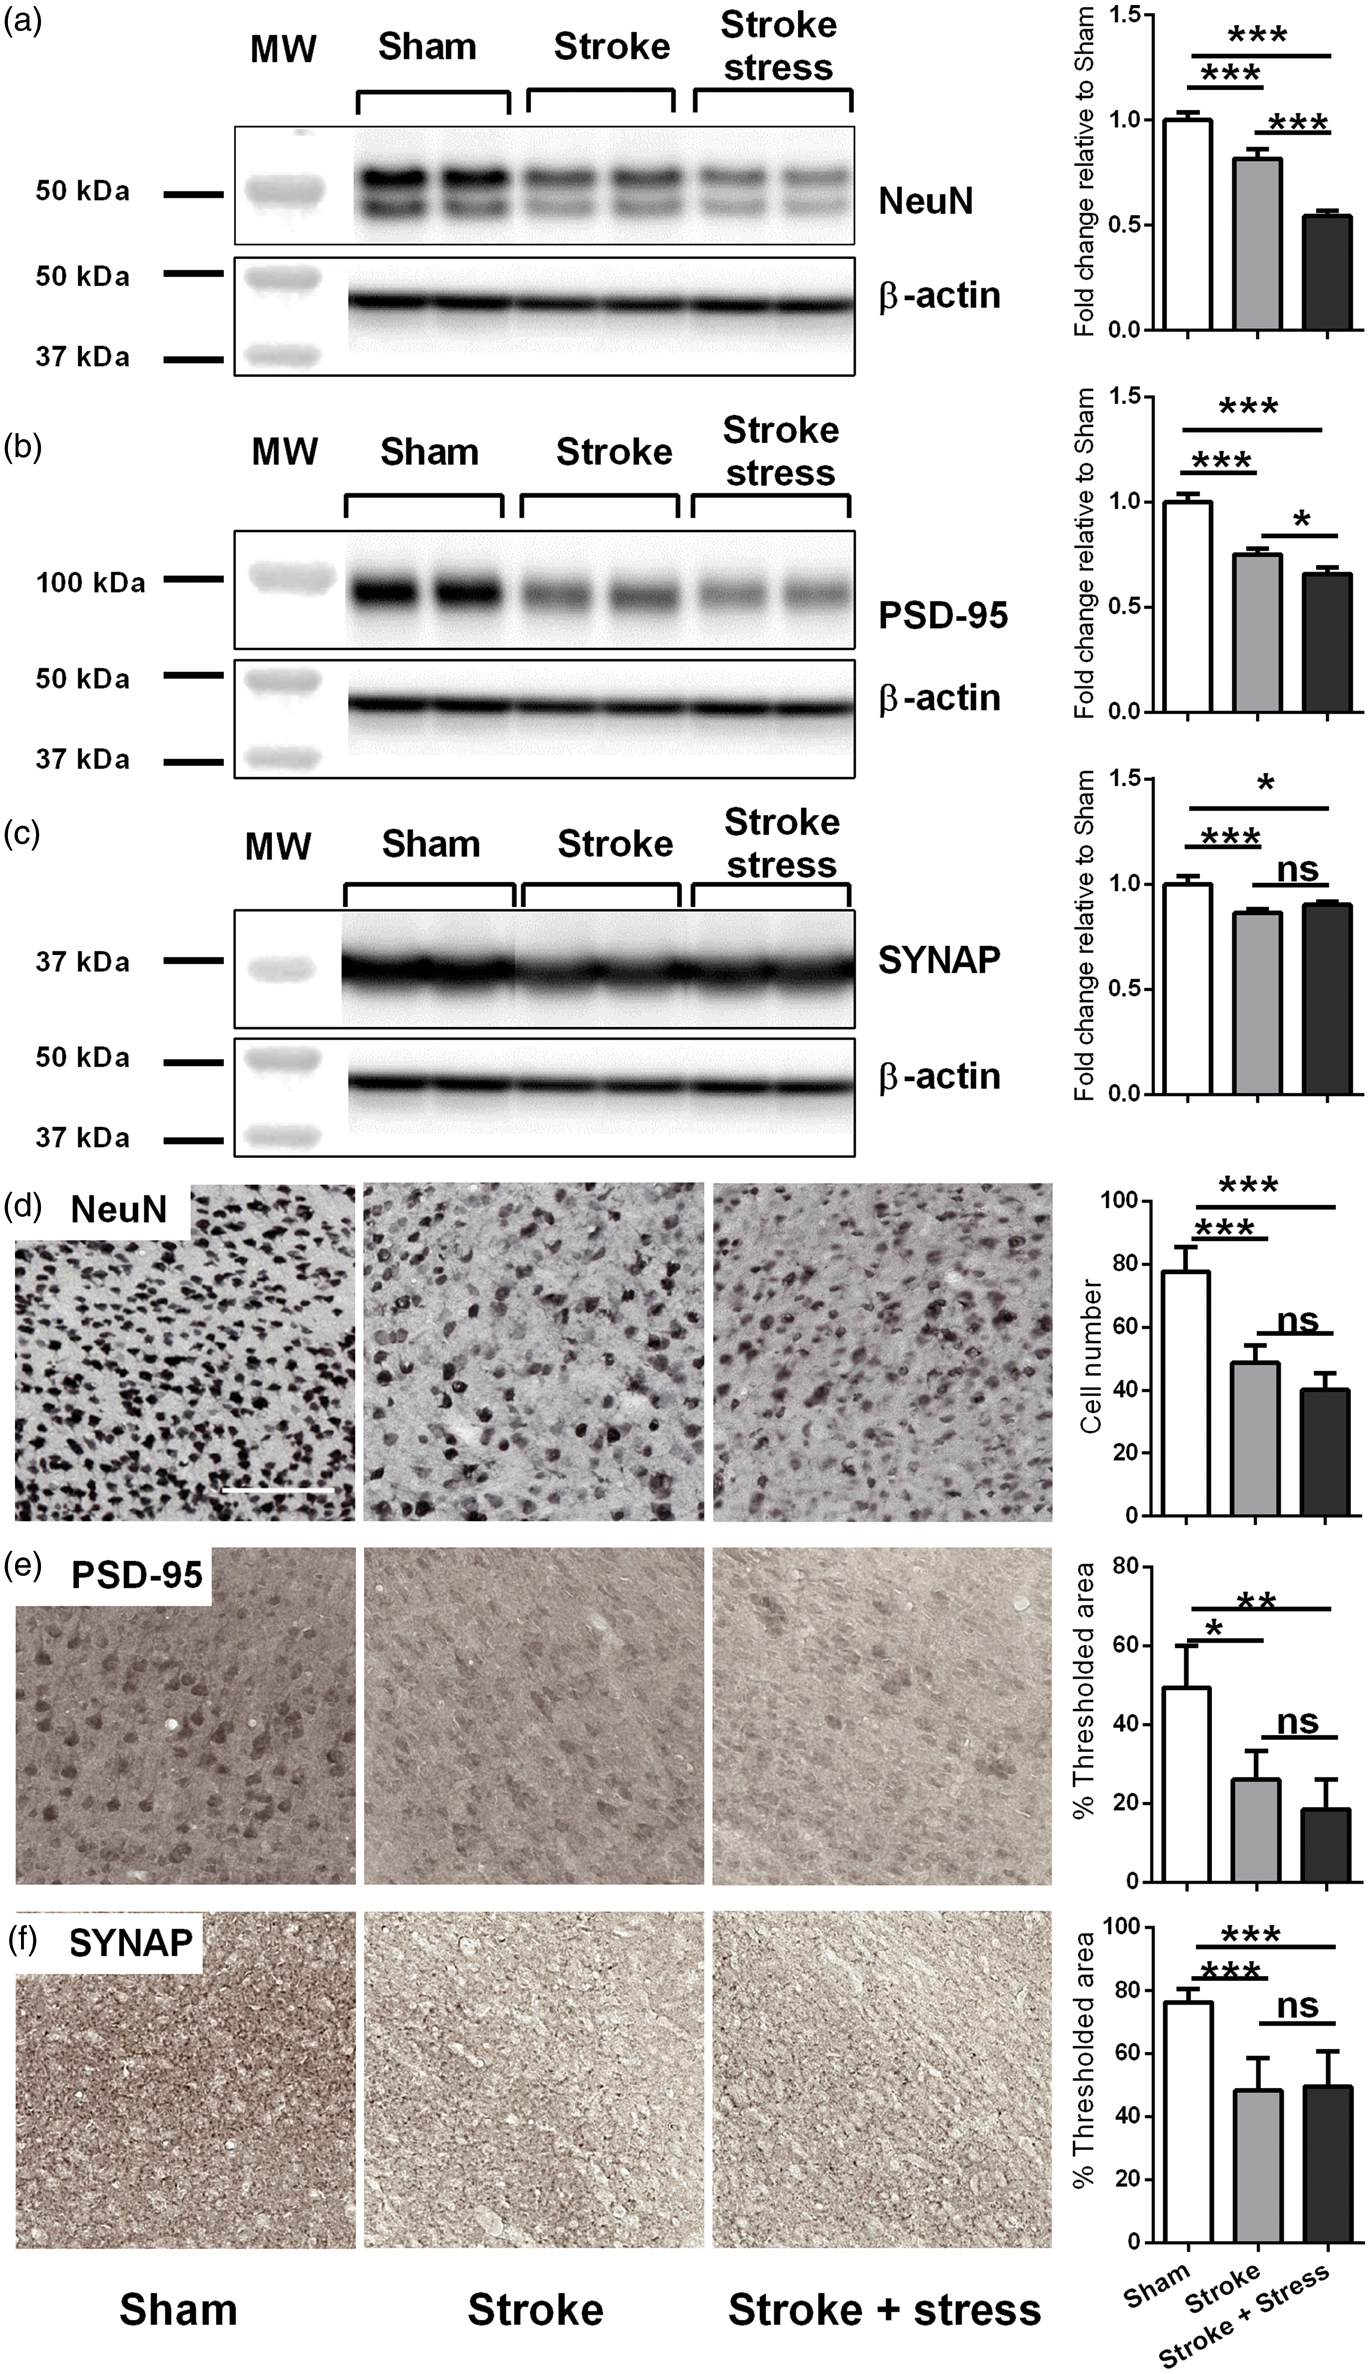
Discussion
In the current study, our focus was investigating several key components of the NVU and in particular, blood vessels, astrocytes, microglia and neurons. To our knowledge, this is the first study to examine how stress exposure during the recovery period modifies the NVU. In short, our approach involved comparing the differences between animals exposed to an experimentally induced stroke, in the presence or absence of chronic stress applied during the recovery process. In terms of our cellular analysis, we used a cross validating approach using both immunohistochemistry and Western blotting. The most significant and novel finding of the current study was that chronic stress exposure during recovery influenced nearly every aspect of NVU modelling. Chronic stress was observed to exacerbate motor deficits, reduce vascular growth factors, inhibit glial responses and increase loss of key neuronal proteins.
In the current study, restraint was used to induce stress throughout the recovery process. Restraint was chosen over other possible approaches, as it is the most commonly used stress induction approach in pre-clinical stroke studies, being used in approximately 70% of all prior studies examining the effects of stress on recovery (reviewed in 59 ). We have previously identified that the restraint stress model used in the current study is effective at inducing robust neurological changes. 53 In the current study, we have further demonstrated the effectiveness of the model in acutely elevating circulating corticosterone, inducing mild anxiety-like behaviour (as indexed through open-field assessment) and its ability to consistently suppressing weight gain, a hallmark of persistent stress. Each of these observations extends the evidence base concerning the ability of the restraint model to elicit stress both acutely and over longer term, a position that is also supported by the clear stress effects observed within the NVU.
The paw asymmetry task was used to evaluate motor function. 55 Research using the task has confirmed that prior to injury there are no observable differences in the use of the left or right forelimb for supported rearing. However, following injury to one hemisphere, a reduction in the use of the contralateral forelimb is observed. 60 This matches closely with our observation that animals exposed to stroke, irrespective of stress, exhibited a decreased preference for the contralateral forelimb usage. While this preference did not achieve statistical significance in animals exposed to stroke alone, animals exposed to stroke and stress had significantly higher levels of paw asymmetry, indicating increased injury severity, relative to the stroke-alone and sham control group. This data aligns well with that reported by Metz group in their studies in rats.18,61
Our examination of the key cellular components of the NVU involved a cross validation approach utilizing both immunohistochemical labelling and Western blotting. Immunohistochemistry was used to gain insight from a spatial perspective into the nature of changes occurring within the cortical territories following stroke recovery, whereas Western blotting was primarily used to access information on changes in total protein levels within the peri-infarct regions. In most instances, we found that the immunohistochemistry and Western blotting results were closely aligned in the same direction, yet some modest differences were evident, particularly with respect to the magnitude of the observed effects. We consider this variation to mainly reflect differences in the scale and volume of material assessed using the two approaches. Any notable differences between the two approaches are discussed.
Exactly how exposure to chronic stress alters vascular remodelling during recovery has not been extensively investigated to date. In the current study, we used Collagen-IV 58 to examine changes within the vasculature. Collagen-IV is a protein found within the basal lamina that is secreted by endothelial cells and is one of the most commonly used markers for vasculature. 62 Analysis of both protein levels and assessment of changes in density of labelling revealed a similar pattern of changes. Specifically, we observed, using both techniques, that stroke induced a clear and significant elevation in Collagen-IV in the stroke group relative to the control group. This finding aligns well that those recently reported. 63 The stroke group that was additionally exposed to stress exhibited significantly less Collagen-IV relative to the stroke alone group. Together, these results suggest that stress exposure reduces the typical post-stroke surge in vessel formation.
In an effort to explore some of the mechanisms involved in contributing to the stress induced reduction in vascular density, we next considered changes in vascular growth factors, namely VEGF, Ang-1 and Ang-2.38–41 It is worthwhile noting that although these vascular factors play a role in vascular function, they can be expressed by non-vascular cells.64–66 For instance, robust expression of VEGF has been shown in various compartments of the peripheral and central nervous system.67,68 With respect to the stroke alone group, VEGF was significantly reduced in its expression relative to controls. This differs somewhat with respect to previous reports in that Zhang et al.41,69 that identified an increase in VEGF after experimental stroke 41 that peaked between 3 and 7 days. However, it must be kept in mind that we could find no studies that have examined changes in vascular growth factors as late as six weeks following the primary injury. Animals exposed to stroke and stress exhibited a further reduction in levels of VEGF over than seen in the stroke alone condition. Stroke animals exposed to stress also presented with reduced protein and expression levels of Ang-1 and Ang-2 relative to the stroke alone condition. Together, these results suggest that stress resulted in a globally suppressive effect on the levels of vascular trophic factors, an outcome that aligns with reduction observed in vessel density.
One important issue that warrants discussion is why vessel density was observed to be increased by stroke, while vascular growth factors were suppressed. We would have expected to observe that vessel density and vascular growth factors to be positively correlated. The simplest explanation for these results is that there is temporal disparity between the primary window for vessel growth and the vascular growth factor release. If changes in vessel density occurred rapidly, as have been suggested, the effects of stress may have had less opportunity to act in a suppressive manner (although some effect is still clearly evident). In contrast, the release of vascular tropic factors may be suppressed across the whole six weeks, explaining why the suppressive effect is on these factors is more pronounced. It will certainly, be of interest for future studies to undertake a detailed time course to further characterise the precise timing of when stress is at is most disruptive on vessel formation.
Stroke has consistently been shown to evoke robust levels of gliosis70–72 and this was again confirmed in our study. As we have previously identified in the peri-infarct and thalamus regions, 53 we identified that stress was associated with significant reductions in the extent of gliosis. This was most robustly evident with both our GFAP immunohistochemical and Western blotting results. We also identified that there appeared to be a suppressive effect of stress on both microglial and astroglial proliferation. This suppressive effect is broadly in line with the effects that we have observed of stress on both the vasculature and vascular growth factors.
The vascular and glial markers results reported on in the current paper both follow a similar trend, with elevation in nearly all markers seen after stroke, with reductions observed in stroke animals exposed to stress. There are two distinct ways these results could be interpreted. The first interpretation that could be given is that the glial and vascular changes observed after stroke (in the stroke alone group) do not assist in the recovery process. If the glial and vascular responses in the stroke alone group are viewed as negative, then the effect of stress could be viewed as positive outcome, as it effectively limits the changes induced by stroke. This interpretation, however, is inconsistent with the behavioural data, which indicates that exposure to stress exacerbates, not improves, behavioural impairment. Accordingly, we favor the alternative interpretation that is: the increases in vasculogenesis and gliosis seen after stroke are ‘positive’ responses, in the sense that they promote brain repair. In support of this interpretation, numerous studies that have demonstrated that facilitating vasculogenesis post-stroke improves recovery outcomes73,74 and that removing glia, either astrocytes 7 or microglia 6 prior to stroke results in substantially greater levels of tissue damage and greater levels of functional impairment. In the context where increased levels of vessel density and gliosis are viewed as positive responses to injury then the stress effects should be interpreted as highly negative outcome, as it suppresses endogenous neuroprotective activities. This later interpretation is also totally aligned with the paw-asymmetry data obtained in the current study.
In terms of neuronal changes, pre-and postsynaptic markers (Synaptophysin and PSD-95) as well as a marker of mature neurons (NeuN) were examined. These analyses indicated that stroke suppressed all neuronal markers assessed, a result that is completely consistent with other studies that have identified the ability of stroke to prompt neuronal deterioration.75,76 With respect to stress, we identified a clear impact of stress on NeuN and PSD-95 protein levels. Changes in these proteins after stress have been shown previously.75,77,78 Moreover, previous studies examining the impact of stress have linked changes in synaptic protein expression, particularly changes in PSD-95, to behavioural disturbances.75,79,80 Again, these prior results align with our own observation that stroked animals exposed to stress exhibit modest motor deficits over mice only exposed to stroke.
The effects of stress on neuronal histological markers were less pronounced. While the same direction of effects were observed for PSD-95 and NeuN labelling, as were noted in our protein analysis, the results between stroke and stroke stress did not achieve significance. We interpret this difference to be most likely driven by slightly different volumes of tissue included in the analysis for each of the tissues (more for protein, less for the IHC analysis).
In summary, the current study was focused with examining how exposure to stress after stroke influenced the major cellular components of the NVU. From the results, it was clear that stroke was associated with pronounced increases in vessel density. Stroke was further associated with increased levels of micro – and astrogliosis and concomitant with these changes, stroke was associated with a disruption of key components of neuronal circuitry. The changes particularly in vessel density and gliosis are interpreted as positive adaptions to the ischemic brain injury. In support of this interpretation are multiple studies which have consistently demonstrated the importance of both new vessel growth and glial activity in supporting improved recovery outcomes.81,82 The current study further identified that stress was associated with a suppression of these largely neuroprotective responses, with significantly suppressed levels of vessel formation, vascular trophic factors, gliosis and key neuronal proteins in the stroke animals exposed to stress. Aligning with this interpretation is the fact that the motor disability (indexed via the paw asymmetry task) was more severe in stroke animals exposed to stress. These results suggest that future interventions directed towards combating the negative effects of stress on NVU remodeling should look specifically to changes in the glial and vascular compartments. In conclusion, these results draw attention to complex remodeling that occurs within the NVU of the peri-infarct territories and further highlight the ability of stress to act as a negative modulator of the remodeling process.
Footnotes
Funding
The author(s) disclosed receipt of the following financial support for the research, authorship, and/or publication of this article: This study was supported by the Hunter Medical Research Institute, Faculty of Health and Medicine Pilot Grant and The University of Newcastle, Australia.
Declaration of conflicting interests
The author(s) declared no potential conflicts of interest with respect to the research, authorship, and/or publication of this article.
Authors’ contributions
ZZ, MN and FRW designed the experiment. ZZ performed the majority of the experiments. LKO undertook all Western blotting analyses and prepared the results for these data. ZZ, LKO, SJ, MN and FRW analyzed the data and interpreted the results. SJ and MN revised all drafts and revisions and ZZ and FRW wrote the paper. We would also like to acknowledge the insights and comments provided by Prof Jörgen Isgaard on early versions of the manuscript.
References
Supplementary Material
Please find the following supplemental material available below.
For Open Access articles published under a Creative Commons License, all supplemental material carries the same license as the article it is associated with.
For non-Open Access articles published, all supplemental material carries a non-exclusive license, and permission requests for re-use of supplemental material or any part of supplemental material shall be sent directly to the copyright owner as specified in the copyright notice associated with the article.