
Abstract
There is a great need for a non-invasive methodology enabling the quantification of translocator protein overexpression in PET clinical imaging. [18F]DPA-714 has emerged as a promising translocator protein radiotracer as it is fluorinated, highly specific and returned reliable quantification using arterial input function. Cerebellum gray matter was proposed as reference region for simplified quantification; however, this method cannot be used when inflammation involves cerebellum. Here we adapted and validated a supervised clustering (supervised clustering algorithm (SCA)) for [18F]DPA-714 analysis. Fourteen healthy subjects genotyped for translocator protein underwent an [18F]DPA-714 PET, including 10 with metabolite-corrected arterial input function and three for a test–retest assessment. Two-tissue compartmental modelling provided
Introduction
Neuroinflammation is known to play a key role in the onset and progression of chronic neurodegenerative diseases such as Alzheimer's, Parkinson's and multiple sclerosis. Activated microglia is the main cellular component that characterizes neuroinflammation in these disorders. 1 The availability of a reliable imaging tool aimed at quantifying activated microglia in vivo might help to identify specific targets for anti-inflammatory neuroprotective strategies. The translocator protein 18 kDa (TSPO), previously named peripheral benzodiazepine receptor, is only expressed at low levels in the resting brain by quiescent microglial cells, but becomes markedly overexpressed when microglia is activated. 2
Although the biological role of TSPO remains poorly understood, with putative effects on cholesterol translocation, steroid synthesis, mitochondrial functioning, and cell apoptosis, it is a promising target for molecular imaging studies of neuroinflammation.3,4 The [11C]PK11195 radioligand was the first TSPO tracer used in humans 3 and has been investigated in several pilot imaging studies of neuroinflammation in brain diseases. 5 However, this tracer suffers from serious limitations, such as poor brain penetration and low specific to nonspecific binding ratio in brain and plasma, resulting in a suboptimal signal to noise ratio. Furthermore, the use of 11C radioactive labelling restricts its use to centers with onsite cyclotrons. This has led to the development of second-generation TSPO radiotracers with improved specificity, affinity and signal-to-noise ratio. 6 However, a drawback for the quantification of second-generation TSPO tracers is related to different binding sites 7 resulting in three affinity profiles, high-, mixed- and low-affinity binders (HAB, MAB and LAB), which is indicated by the rs6971 single polymorphism contained within the TSPO gene.
Several 18F-labelled second-generation compounds have been investigated in human and have showed favorable properties for imaging purposes in the brain of healthy subjects.8,9 However, among those, [18F]FEDAA1106 shows slow kinetics, [18F]FEPPA is rapidly metabolized and [18F]PBR06 produces brain-penetrant radiolabeled metabolites that could bias the in vivo imaging and suitable quantification.10,11
[18F]DPA-714 provides an improved signal to noise ratio compared to [11C]PK11195 in several preclinical models6,12,13 and was identified as one of the most promising TSPO ligands for in vivo imaging. The compartmental modeling of [18F]DPA-714 in the brain of healthy controls has been recently investigated and revealed that the two-tissue compartment model (2-TCM) best described the regional kinetics.14,15 Depending on the analyzed region, the VT (mL/cm3) estimate was about 50% higher in HABs compared to MABs, supporting the need to take the genetic affinity profile into account for the quantification of this tracer in human studies. 15
For all TSPO radiotracers, there are challenges that relate to the quantification of binding parameters.5,16 Compartmental modeling using the arterial input function is classically considered as the gold standard quantification method and was first employed for [11C]PK11195 studies using a 2-TCM with a K1/k2 value coupled to be the same across the whole brain cortex. 17
However, arterial blood sampling is an invasive procedure, and therefore a number of alternatives to the standard quantification have been recently proposed. In order to simplify [18F]DPA-714 quantification, a population-based input function (PBIF) was tested on healthy subjects using one or two arterial or venous samples and compared to the arterial input function (AIF) quantification. 15 A very good agreement between AIF and arterial PBIF was found, but the variability increased when late venous samples were used. In addition, this technique still required an invasive extraction of at least one arterial sample as well as the analysis of the blood metabolites.
Reference region methods have also been applied in several recent [11C]PK11195 clinical studies. Accordingly, the cerebellum has been the main choice as a reference region for TSPO ligands, in particular in ischemic stroke 18 and Alzheimer's disease.19–21 However, these particular properties cannot be generalized to all neurological disorders potentially affecting the cerebellum, such as for multiple sclerosis 22 or HIV. 23 To avoid a potential bias related to the a priori selection of the anatomical reference region, methods for the automatic extraction of reference region in PET images have been developed over recent years, such as the supervised clustering algorithm (SCA) that was introduced by Turkheimer et al. 26 (SuperPk) for [11C]PK11195. The SCA was then validated and used in a [11C]PK11195 multicenter study. 27 SCA is based on the creation of a set of predefined kinetic classes that guides the algorithm to select only voxels of no or low specific binding within the brain image.
Recently, a similar SCA approach was successfully applied to other tracers such as [11C]PIB 28 or [11C]TMSX. 29 An unsupervised clustering approach was also implemented for [18F]DPA-714 in Amyotrophic Lateral Sclerosis. 30 However, no predefined classes were identified and employed to supervise the kinetic shape of the time–activity curves (TACs) in the clusters, and the results were not validated with AIF-derived-2-TCM.
Data from different studies with [3H]PK11195, [11C]PBR28 and [11C]PK111957,24,25 have shown that displaceable binding has a non-negligible contribution to the distribution volume in the cerebellum. Moreover, recent studies31,32 suggest that TSPO is constitutively expressed in several cell types in the brain, including endothelial cells. Given these observations, it may be that there is no brain region entirely devoid of TSPO binding in vivo, and the aim here was to validate a method able to define a “pseudo-reference region” that is, tissue with the lowest/basal levels of constitutive TSPO and negligible amounts of microglia. Our objective is to be able to distinguish subjects with and without neuroinflammation due to pathological processes (activated microglia), irrespective of possible methodological bias in the absolute quantification.
In this study, we adapted and validated the SuperPK approach 26 to automatically extract the pseudo-reference region from [18F]DPA-714 images (SuperDPA) in a group of genotyped healthy subjects. The quantification using each reference region method (SCA methods or the a priori anatomically defined cerebellar gray matter) was compared to the AIF-derived 2-TCM quantification described in our previous [18F]DPA-714 study in the same healthy human subjects. 15 A further validation of the predefined classes for the SCA was performed in three ways. Firstly, the influence of the genetic affinity profile was evaluated. Secondly, the optimal set of predefined classes for SuperDPA was investigated by simulating a set of classes for a range of binding conditions based on the 2-TCM kinetic parameters. Finally, the reproducibility of the SCA method was tested with three subjects who underwent two [18F]DPA-714 scans.
Material and methods
Subjects
Fourteen healthy volunteers (mean age 46.8 ± 15.7 years, six females) were included from two clinical protocols conducted at the Service Hospitalier Frédéric Joliot and the Institut du cerveau et de la Moelle (NCT02305264 and NCT02319382). Written informed consent was obtained from all participants, and the protocols were approved by the Medical Bioethics Committee of Ile de France Region and in accordance with French legislation and the Declaration of Helsinki 1975 (and revised in 1983). All subjects were considered healthy according to their medical history record and physical examination. They all had a normal brain MRI.
Genomic DNA from blood samples was used to genotype the rs6971 polymorphism of the TSPO gene. The analysis revealed seven HAB (mean age 47.4 ± 16.0 years, three females) and seven MABs (mean age 46.3 ±16.7 years, three females). No LABs were found among the 14 subjects.
Imaging protocol
Each participant underwent a T1-weighted (T1-w) magnetic resonance image and an [18F]DPA-714 PET acquisition. More details on the imaging protocols can be found in Lavisse et al. 15 Three subjects (two HABs, one MAB) underwent a second PET acquisition (injected activity difference 30.2 ± 21.6 MBq) after seven to nine days to study the reproducibility of the quantification method.
T1-w imaging was performed using a turbo spin echo sequence (TSE) (TE/TR = 3/6300 ms; alpha = 10, resolution = 0.92 × 0.92 × 0.93 mm) in a 1.5T Philips Achieva (Best, The Netherlands) scanner or an MPRAGE (TE/TI/TR = 2.98/900/2300, alpha = 9 °, resolution = 1 × 1×1.1 mm) in a 3T Siemens Trio scanner (Erlangen, Germany).
[18F]DPA-714 was prepared according to standard conditions. 33 Subjects underwent [18F]DPA-714 PET scans in a high-resolution research tomograph (HRRT, Siemens, Knoxville, TN, USA). After a transmission scan using a 137Cs point source, a [18F]DPA-714 bolus was intravenously injected (198.4 ± 22.9 MBq). The dynamic PET acquisition in list mode lasted 90 min.
Ten subjects (seven HABs and three MABs) out of the 14 included in this study were the same as those described in Lavisse et al. 15 and had AIFs corrected for metabolites.
Image processing
PET acquisitions were corrected for random attenuation and scattered coincidences and reconstructed with the iterative-ordered subset expectation maximization (Ordinary Poisson [OP]-OSEM) 3D method (4 iterations using 16 subsets) including point spread function modeling within the reconstruction (using a 3D Gaussian kernel with 2 mm full-width at half-maximum). Dynamic data were binned into 27 frames (6 × 1 min, 7 × 2 min, 14 × 5 min). Reconstructed dynamic PET data were realigned for motion correction using the frame-to-reference image registration in PMOD 3.5 (PMOD Technologies Ltd., Zurich, CH).
T1-w images were segmented using Freesurfer 5.3 (http://freesurfer.net) and regions of interest (ROIs) were selected: thalamus, hippocampus, cerebellar gray matter, white matter and occipital, parietal, frontal and cingulate cortices. A whole brain mask was also extracted. T1-w images and ROIs were resampled into the PET space using a rigid registration in order to extract TACs from each ROI. Data from the left and right hemispheres were averaged. Kinetic modeling (2-TCM) was performed using the COMKAT library and Logan graphical analysis was proceeded using in-house software in Matlab (Math Works, Natick, MA, USA).
Implementation of the supervised clustering algorithm for [18F]DPA-714 (SuperDPA)
As in the SuperPK,
26
the SuperDPA algorithm includes three steps to extract the pseudo-reference region: (i) a normalization procedure to scale each frame and make the acquisition comparable across subjects; (ii) the creation of a set of predefined kinetic classes adapted to [18F]DPA-714 for use in the supervised algorithm; and (iii) a supervised clustering algorithm that calculates the contribution of each kinetic class to the signal of each voxel (Figure 1(a)).
(a) Description of the SuperDPA method and (b) evaluation of this method through affinity, validation and test–retest studies.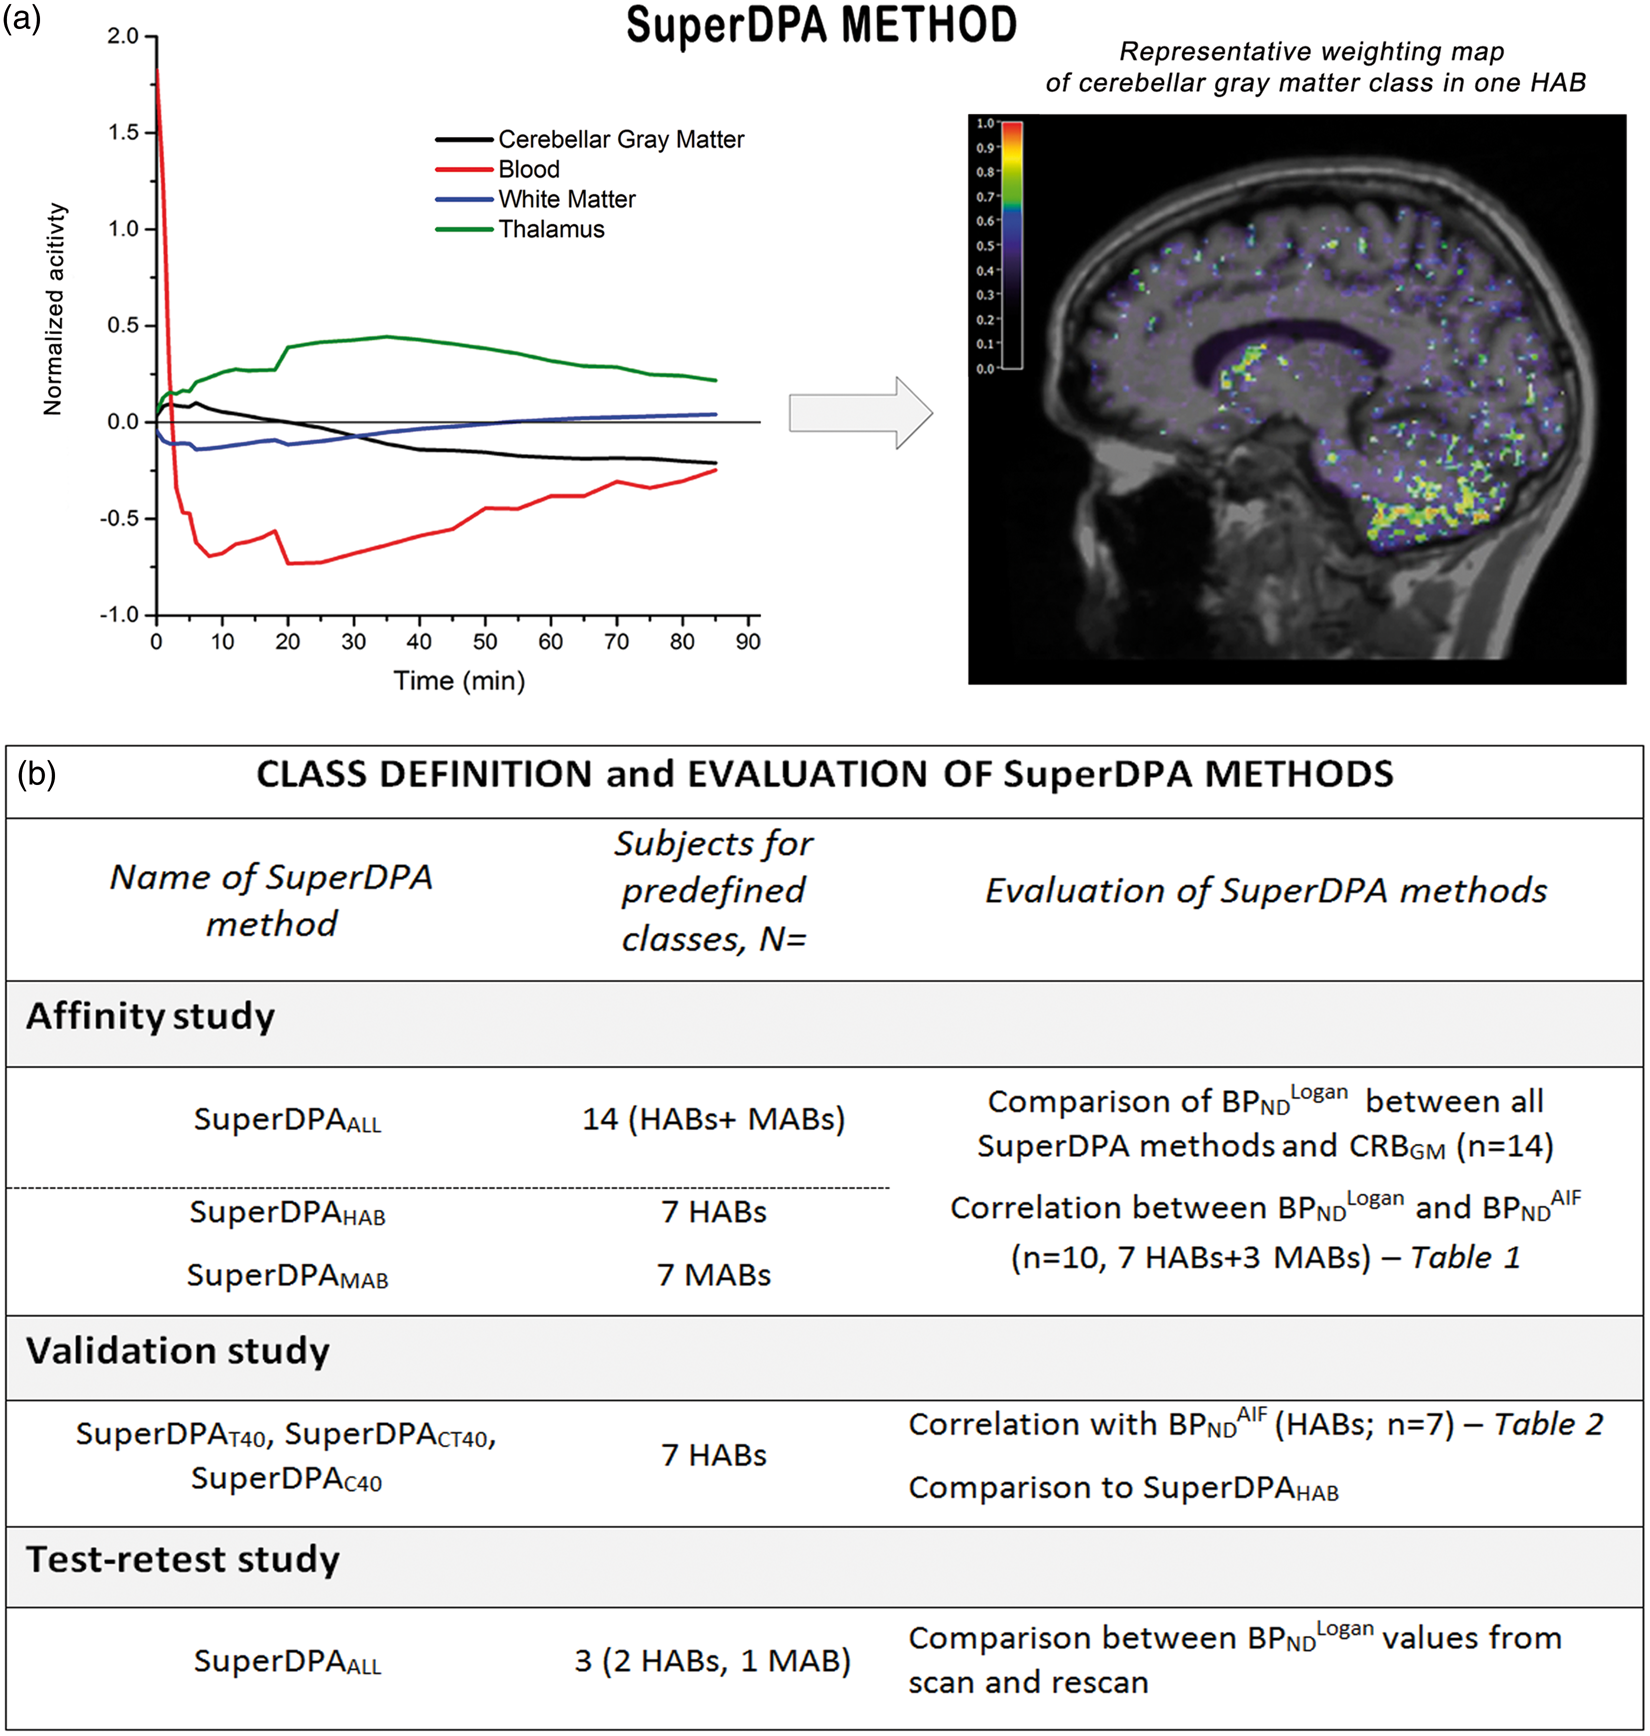
Normalization
Each frame is normalized to reduce variability across frames and subjects. The normalization step is carried out during the definition of the kinetic classes, as well as for each image analyzed using the SCA method. To normalize the scan, the mean value of the activity in the brain in each frame is subtracted from the activity of each voxel in that frame. The resulting “centered” values are divided by the standard deviation of the values over the whole brain at the same frame.
Definition of the kinetic classes of the SuperDPA
Because [11C]PK11195 and [18F]DPA-714 share the same target, we used the same four classes presented by Yaqub et al. 27 : blood pool class, white matter class, no to low specific binding class (pseudo-reference region) and high specific binding class. The blood pool class was extracted from the carotid arteries that were manually segmented using the PET image summed over the 2 first minutes of acquisition. The white matter class was defined using the Freesurfer automatic segmentation. In healthy controls, 15 the level of binding in the gray matter displayed significant variation, with the highest specific uptake being detected in the thalamus. We therefore chose the thalamus to define the high specific binding class. We chose the cerebellar gray matter (CRBGM) to define the low specific binding class for the following reasons. First, we have previously shown that the lowest binding was found in the CRBGM; second, TSPO mRNA expression was found the lowest in cortical gray matter across brain as derived from Allen Brain Altas (http://human.brain-map.org) 34 and finally, Turkheimer et al. observed most voxels of the extracted reference region in the cerebellar gray matter, using SuperPK. 26
In each subject, the TACs for each class were then extracted from normalized images (step i) and averaged across the subjects to create the set of classes used for the SuperDPA.
Supervised classification
In order to extract the pseudo-reference region in each PET image, the kinetics of each voxel was projected onto the kinetic classes using a non-negative least squares (NNLS) algorithm, yielding the percent contribution of the each class in that voxel. Voxels in which the TAC was at least 90% attributable to the pseudo-reference were accepted into the binary mask for the pseudo-reference region. The TAC from the pseudo-reference region is a simple average over all the TACs from the voxels included in the binary mask.
Validation of kinetic classes definition
Based on SuperDPA methodology, we developed two different approaches to validate the predefined classes. The first approach assumed that the kinetics of [18F]DPA-714 depends on the TSPO affinity profile of each given subject. Classes were therefore independently created for HAB and MAB subjects in a so-called “affinity study.” The second approach, a “validation study,” used simulated predefined classes with different characteristics to investigate whether using classes with higher or lower specific binding would yield a more appropriate reference curve (Figure 1(b)).
Affinity study
We investigated the impact of the genetic binding profile of the subjects on the shape of the classes and consequently on the extracted reference curves and estimated parameters. We therefore defined separate sets of classes based on the genetic affinity profiles: classes were created using either the seven MABs, yielding the SuperDPAMAB method to process the MAB subjects or the seven HABs subjects, yielding the SuperDPAHAB to process the HABs only. For comparison, we also generated a single set of classes from both HAB and MAB subjects pooled together (n = 14), yielding the SuperDPAALL applied on all subjects, whatever their genetic profile.
Validation of the classes
We generated two types of simulated classes: (1) a simulated reference region class with less specific binding than in the initial CRBGM TAC and (2) a simulated high specific binding class with higher specific binding (from the thalamus TAC). To create the simulated classes, we modified the k3 parameter previously determined in Lavisse et al. 15 using the 2-TCM. To generate the simulated CRBGM class with lower specific binding for each subject, the initial k3 of the cerebellum gray matter was decreased by −40%, while all other parameters (K1, k2, k4) remained unchanged. Similarly, to generate a simulated higher specific binding class, the initial k3 was increased by + 40%. Again, this was done for each subject. The resulting simulated TACs were used to create the classes for the pseudo-reference region class and the high specific binding class using the method described earlier. For each simulation, the white matter and the blood classes were kept the same as in SuperDPAHAB. For these simulations, the comparison with AIF-based quantification was made within the same genetic profile, and therefore only the HAB group was used (n = 7).
In total, three SuperDPA methods were defined in this “validation study”: the SuperDPAC40 method with a 40% reduction in the specific binding of the CRBGM (2) the SuperDPAT40 with a 40% increase in the specific binding of the thalamus and (3) SuperDPACT40 method with both 40% decrease in the CRBGM and 40% increase in the thalamus.
Binding parameter estimation
We previously showed
15
that the model that best described the kinetics of [18F]DPA-714 was the 2-TCM that was therefore used as ground truth in this study. For each ROI, BPND was indirectly estimated using the AIF as in previous studies26,27 to obtain

In parallel, [18F]DPA-714 binding in all ROIs was estimated using the Logan reference graphical method for all SuperDPA approaches and CRBGM,35 as previously described.
36
The Logan graphical analysis provided the distribution volume ratio (DVRLOGAN) that was converted into
Method evaluation and validation (Figure 1(b))
Affinity study
Validation of the classes
Test–retest study
The reproducibility of the SuperDPAALL, SuperDPAHAB/MAB and CRBGM was evaluated using the three subjects who had two PET acquisitions within seven to nine days. Each reference region method was applied for both the first and the second PET exams independently, yielding
Statistics
For each of the SCA methods investigated, a set of predefined classes were computed using a leave-one-out approach. Then, the pseudo-reference region for the remaining subject was extracted using the classes created without that particular subject.
All statistics were computed using the freely distributed software R (www.r-project.org). Pearson correlation was used as the correlation coefficient. The ICC measured the absolute agreement between the parameters derived when using the AIF and the reference region quantifications, according to the Shrout and Fleiss convention.
37
Coefficient of variation was defined as the standard deviation (SD) of the
Results
Pseudo-reference region extraction using the SuperDPA
Weighting maps were extracted from dynamic [18F]DPA-714 scans of HAB and MAB subjects, using the SuperDPAALL and the SuperDPAHAB/MAB approaches. The coefficient maps for blood and white matter kinetic classes displayed expected distributions (data not shown). Maps representing high specific binding showed voxels mainly located in the thalamus region. Interestingly, the majority of voxels assigned to the pseudo-reference region (probability higher than 90% of belonging to the reference region class) were located in the cerebellar gray matter and caudate and to some extent throughout the cortical gray matter. Representative probability maps from SuperDPAALL and SuperDPAHAB are displayed in Figure 2(a) for one HAB subject.
(a) Weighting maps of low/non-specific class (used for reference region selection) for one representative HAB subject using SuperDPAHAB (left) and SuperDPAALL (right). (b) 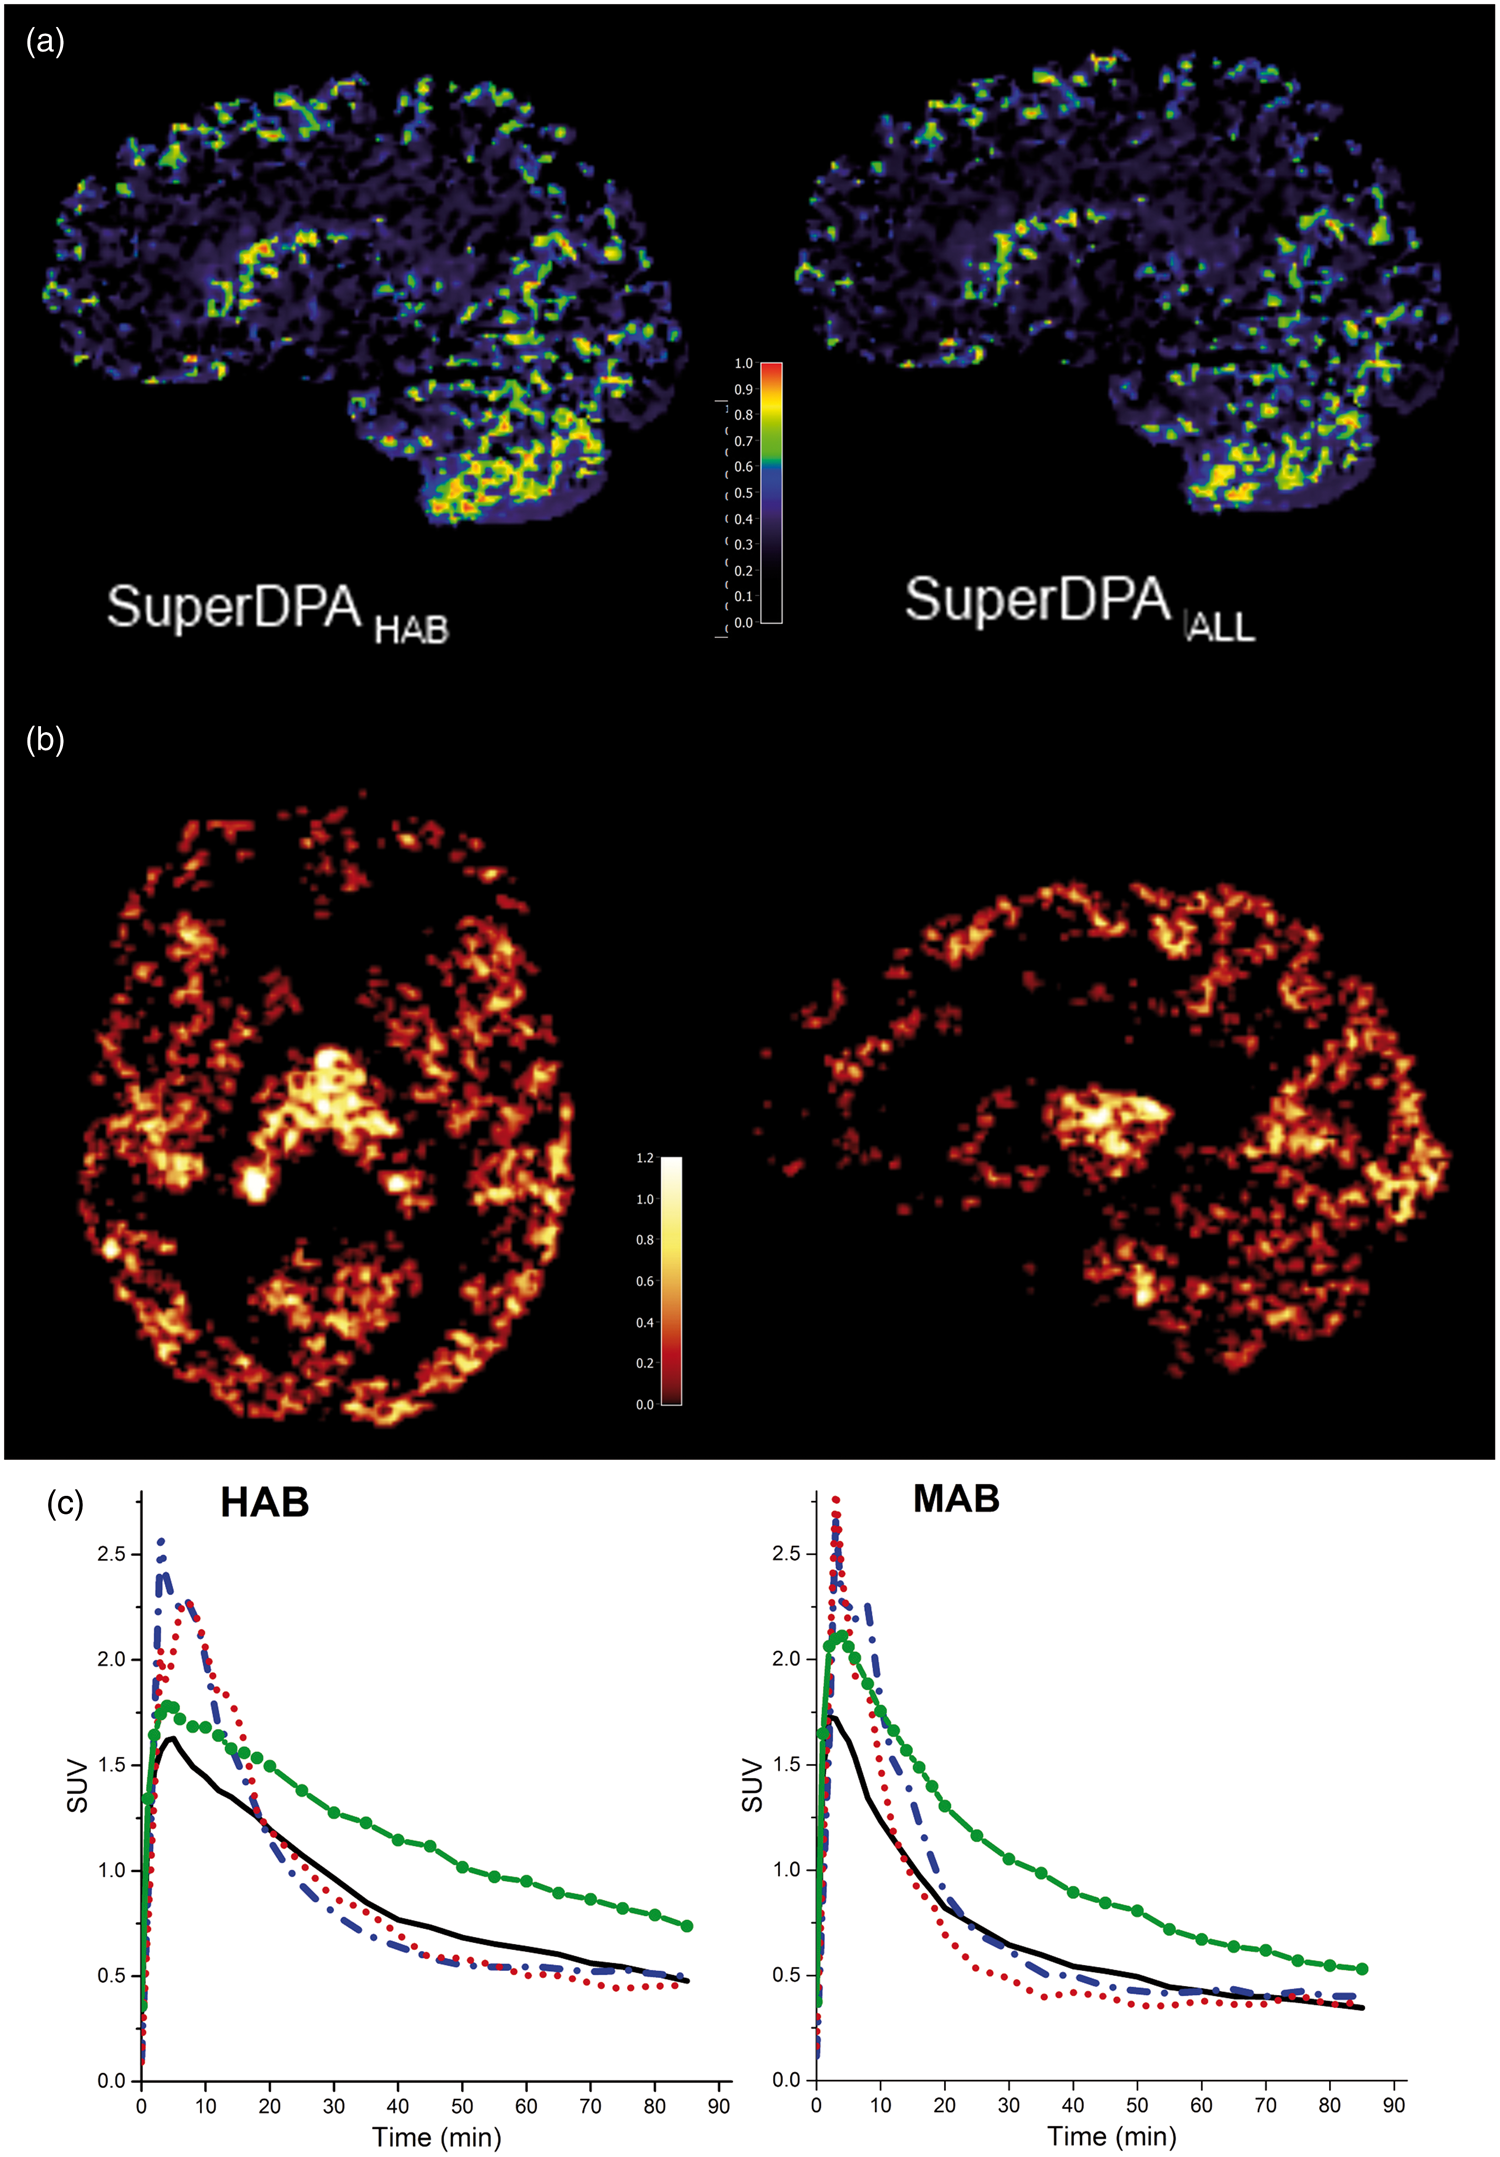
Mean TACs from the pseudo-reference region extracted using SuperDPAALL and SuperDPAHAB/MAB together with TACs of the CRBGM and thalamus are shown in Figure 2(c). TACs using both SuperDPAALL and SuperDPAHAB/MAB showed a higher peak and a faster wash-out than that obtained in the cerebellar gray matter and reached the same residual activity at 90 min.
Quantification of PET data
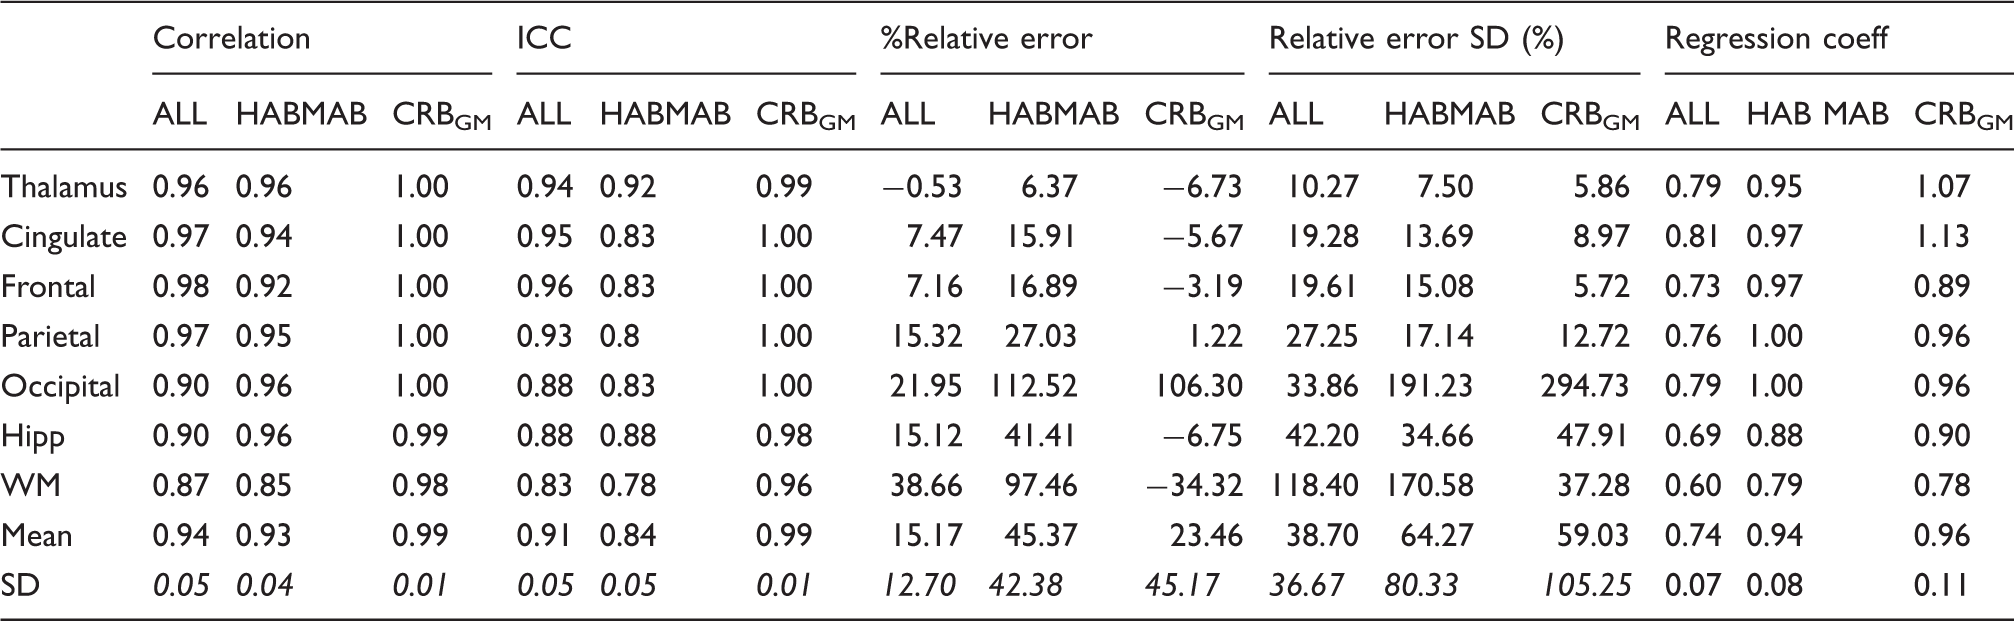
Representative Note: Correlation coefficients (r), ICC values, relative error (%), relative error SD (%) and regression coefficients between 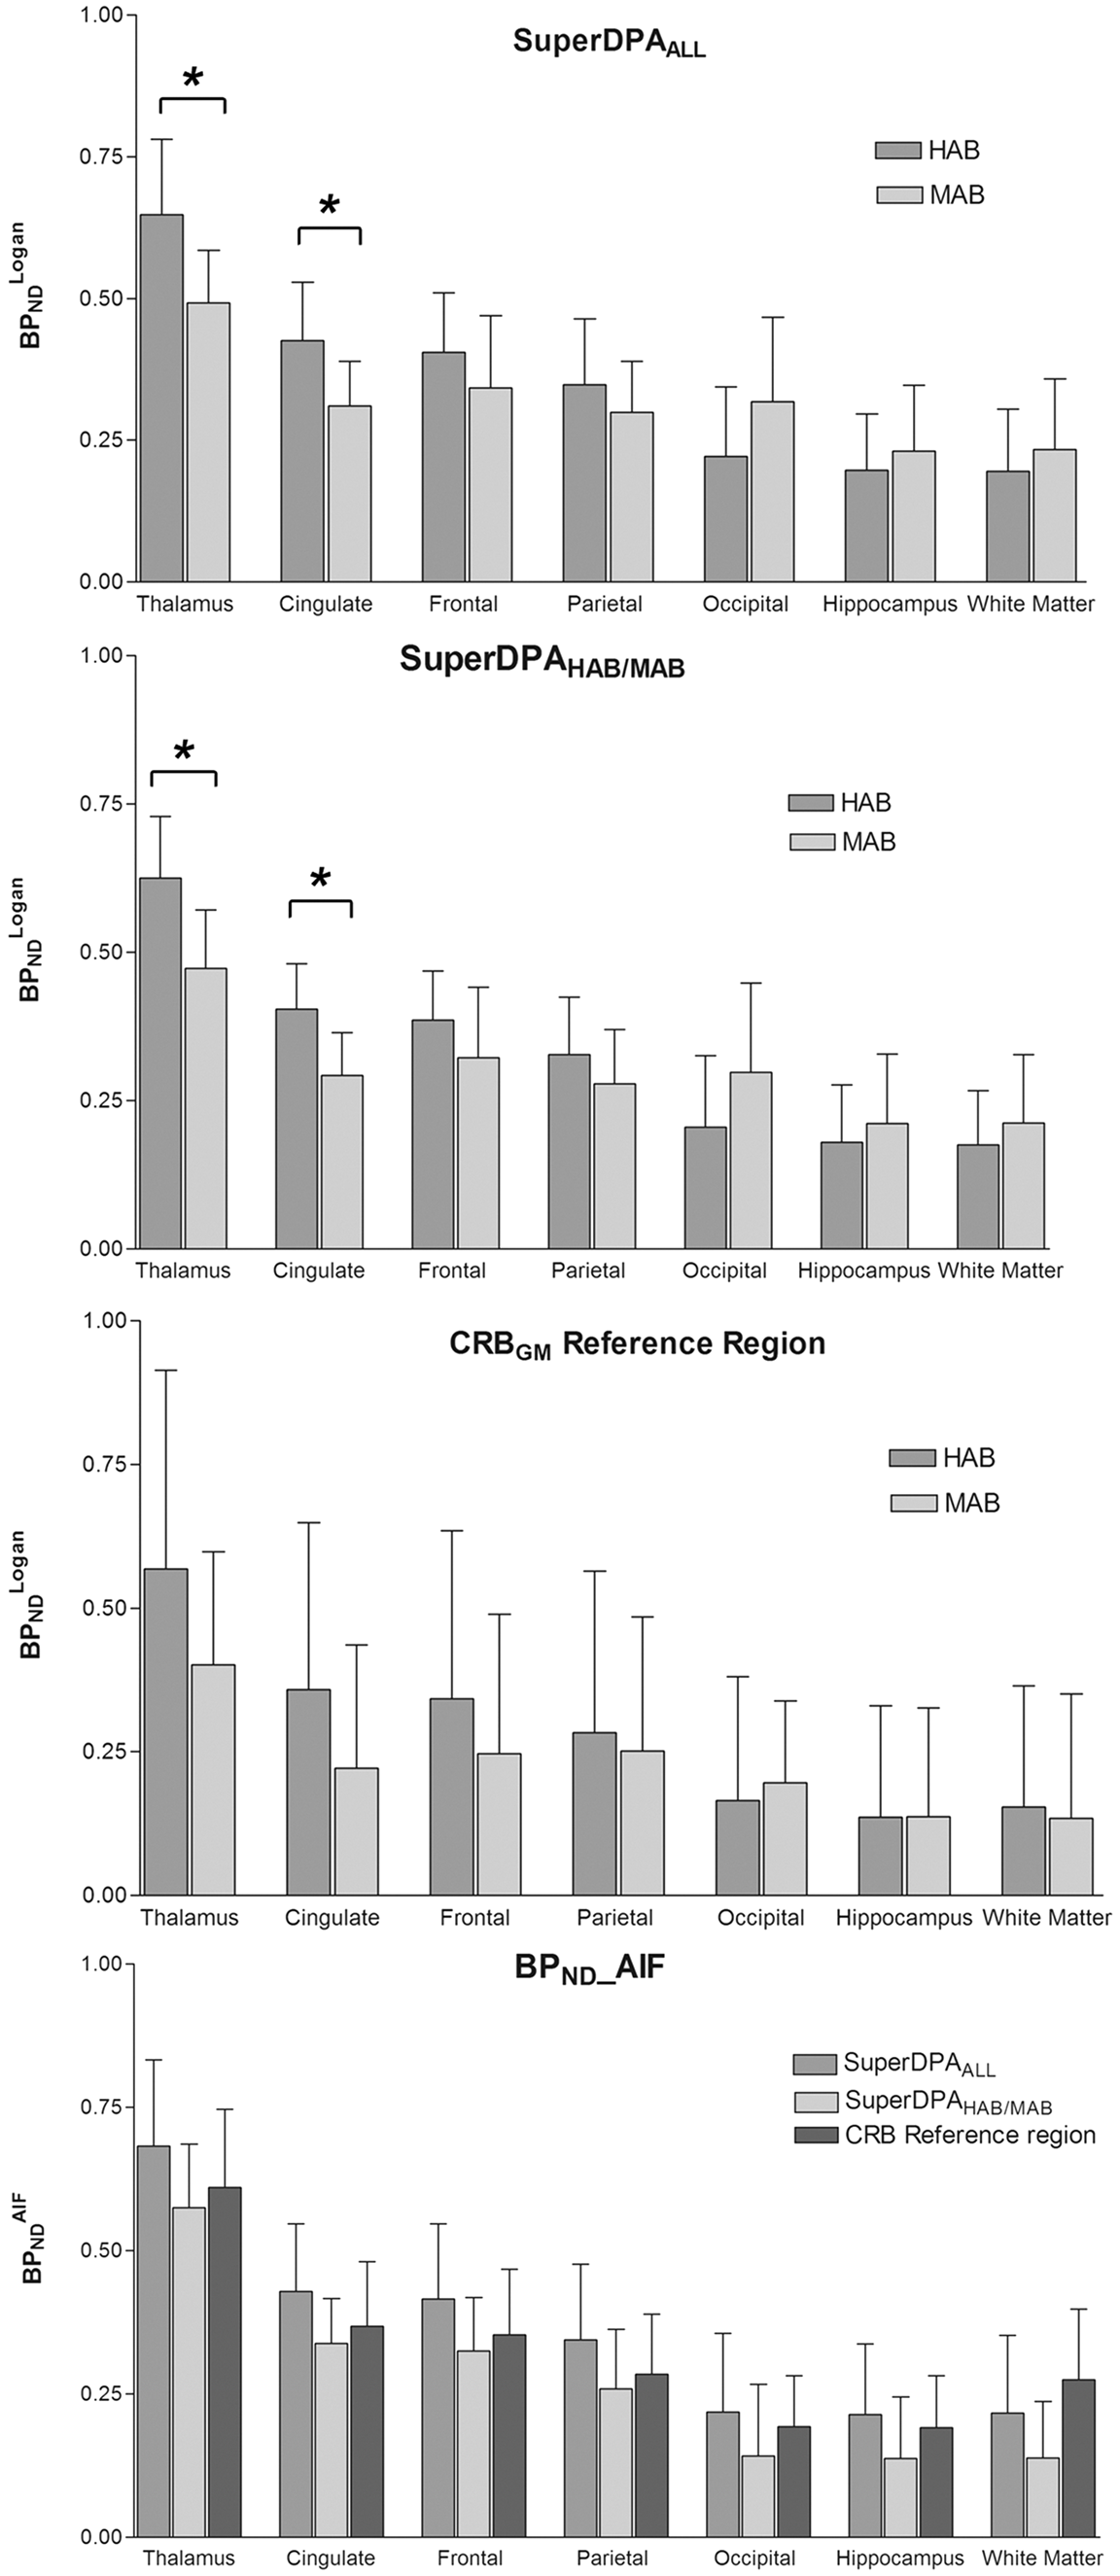
Influence of the genetic affinity profiles
For all methods (SuperDPAALL, SuperDPAHAB/MAB and CRBGM), the average TACs of the extracted pseudo-reference regions showed a slightly different shape between the HAB and the MAB groups (Figure 2(c)). Similar to the CRBGM TACs, both SuperDPAALL and SuperDPAHAB/MAB could identify TSPO affinity based on the TAC shapes, with a wider peak and a slower wash-out for the HAB group. Using SuperDPAALL, VT-REF in HABs was found ∼+28% higher than in MABs (VT-REF = 3.3 ± 1.6 and 2.4 ± 0.07 in HABs and MABs, respectively).
As shown in Figure 3, the mean
For all methods, the Relationship between BPND estimates with the arterial input function analysis (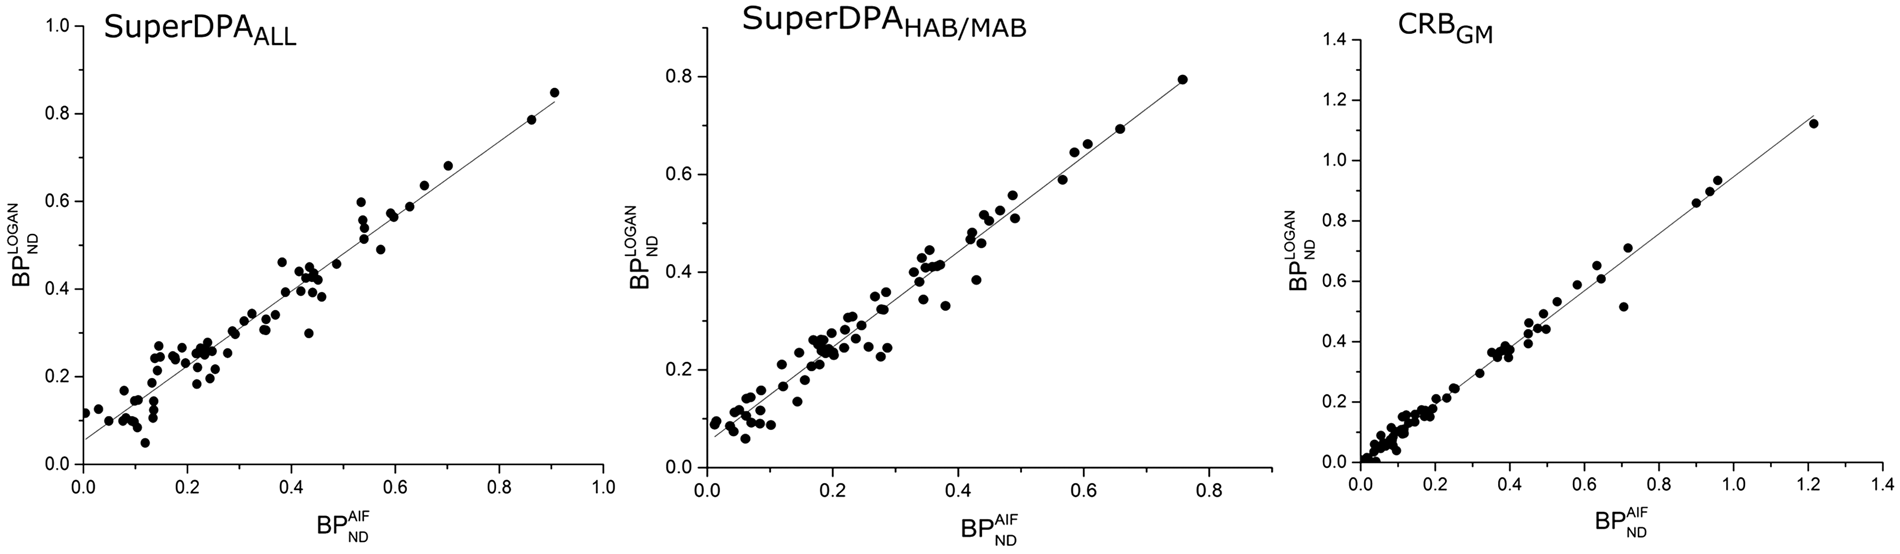
According to affinity group, the mean
Validation of the predefined classes
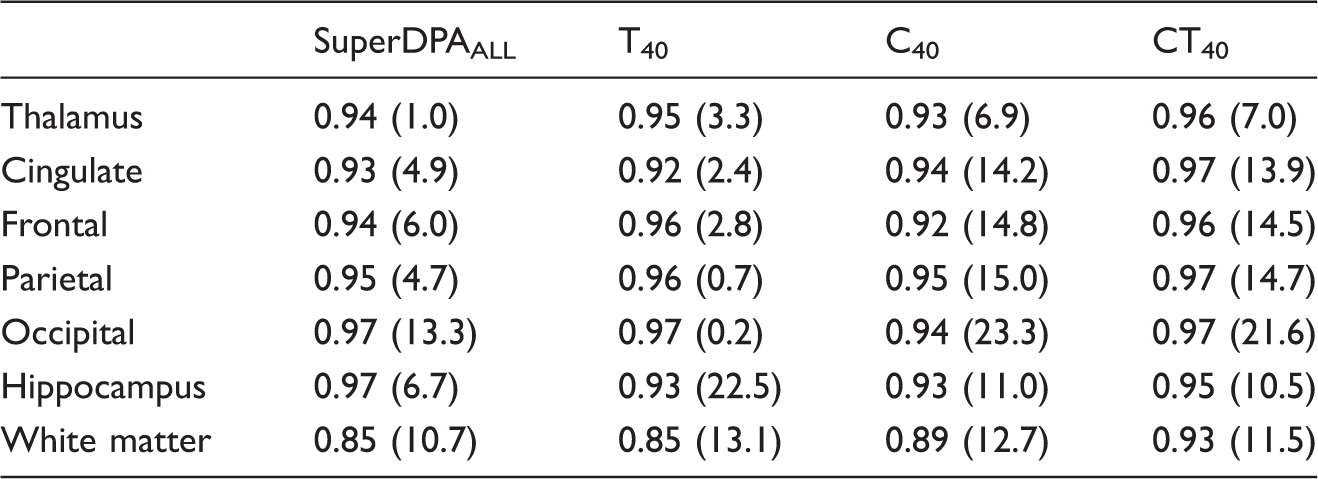
Note: Correlation coefficients (and relative errors in %) between
Test–retest study
With respect to the scan–rescan reproducibility, the SuperDPA methods showed a lower average absolute variability compared to the CRBGM (CRBGM: 6.3%, SuperDPAHAB/MAB and SuperDPAALL: 4.5% – Figure 5) with similar standard deviation around 3.5 % for all methods. Interestingly, regions with high specific binding (thalamus, cingulate, frontal and parietal cortices) displayed better reproducibility measures when using SuperDPA methods compared to the CRBGM.
Evaluation of intrasubject-variability (test-retest) of the [18F]DPA-714 scan measures of each ROI using CRBGM , SuperDPAALL and SuperDPAHAB/MAB methods. Test–retest variability is calculated as the absolute value of the difference as follows 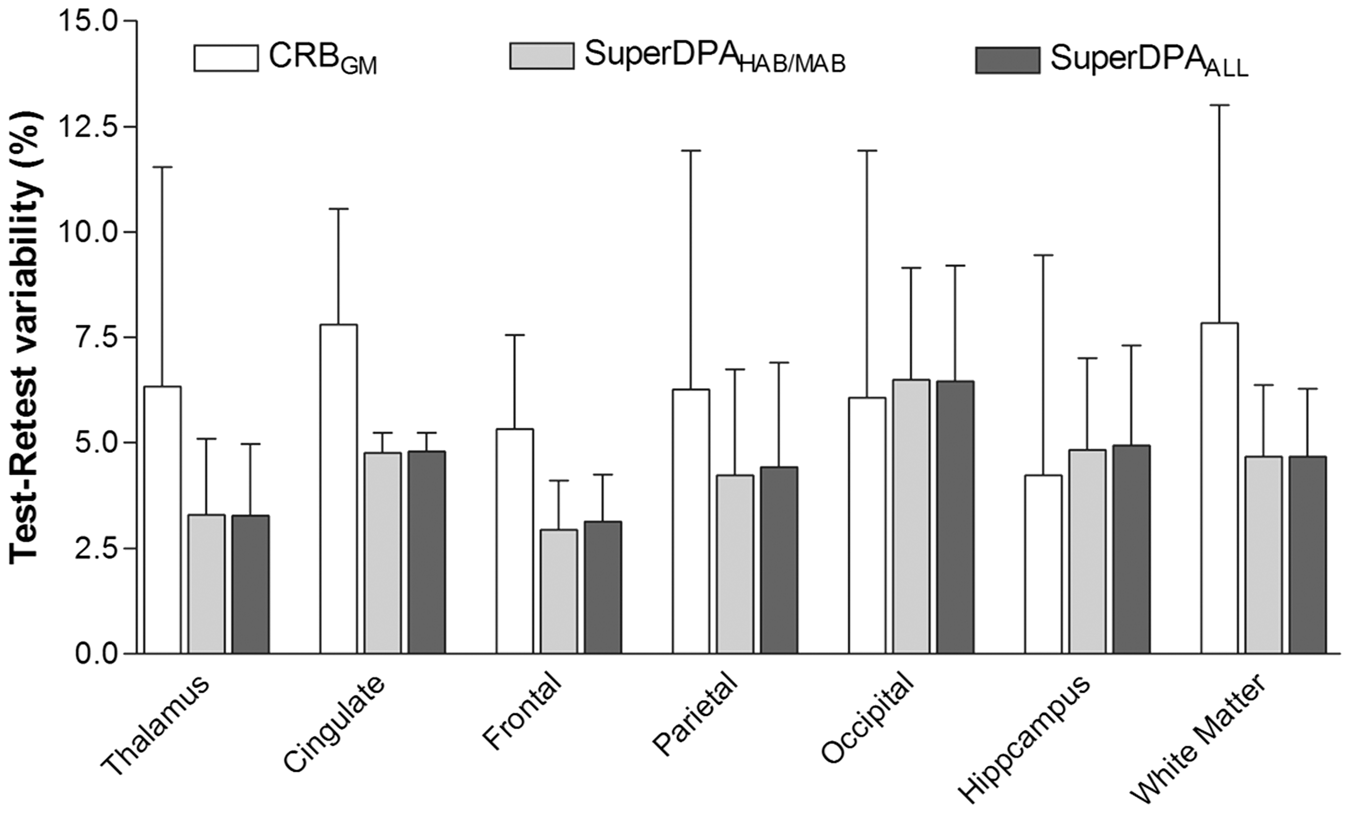
Discussion
In this study, we adapted a supervised clustering approach to automatically extract pseudo-reference regions within the brain from dynamic [18F]DPA-714 PET scans of healthy volunteers. This method provides a non-invasive quantification that has the potential to greatly simplify the use of this tracer in the clinical setting. The quantification performed using SuperDPA showed a very high agreement with the gold standard AIF quantification and a very low inter- and intra-subject variability. We found that the creation of the set of predefined classes using both HAB and MAB subjects is adequate to extract a pseudo-reference region, as it provided results with the same level of reliability than with the creation of two separate sets of predefined classes.
The SuperDPA method was found to be robust for the identification of voxels belonging to the pseudo-reference, i.e. tissue with the lowest levels of constitutive TSPO and the most negligible amount of microglia. This was further validated when the input regions to the SuperDPA classes were compared with optimized set of classes. Although these new classes were based on simulations from the 2-TCM quantification with lower or higher specific binding, they did not impact the correlation with
We found that the SuperDPA-based quantification had excellent agreement with the AIF-based quantification. Interestingly, correlations of the SuperDPA method with AIF quantification and reproducibility measures were both better in ROIs characterized by high specific binding compared to regions with low binding. This same finding was observed by Collste et al. 38 in healthy volunteers and by Park et al. in multiple sclerosis patients compared to healthy controls. 39 This suggests that the accuracy and reproducibility of the quantification using SuperDPA should be optimal in pathological conditions associated with a high level of TSPO expression in activated microglia.
The use of CRBGM as pseudo-reference region has previously provided consistent findings for differentiating healthy subjects and Alzheimer patients, at prodromal and dementia stages.17,19 This method also showed a strong correlation with AIF quantification among healthy volunteers
40
as we found in this study. However, only the SuperDPA method should enable to discriminate subtle microglial activation in brain diseases where the location and amplitude of neuroinflammation are unpredictable and may include the cerebellum. The pseudo-reference region extracted from the SuperDPA methods showed a faster wash-out kinetics than the CRBGM and a lower VT (mean VT-REF = 3.3 ± 1.6 and 2.4 ± 0.07 versus VT-CRBGM =3.7 ± 1.6 and 2.5 ± 0.04 in HABs and MABs, respectively). This suggests that SuperDPA method could provide reference region TAC closer to the shape of non-displaceable binding than that of the CRBGM. Consequently, SuperDPA provided significantly higher
Furthermore, inter-subject variability was found to be lower for SuperDPA than for CRBGM (Figure 3). For both SuperDPA methods, the coefficient of variation of the
The test–retest analysis performed here (n = 3) provided a very low BPND coefficient of variation, less than 7%, for all quantification methods. This coefficient was lower for the SuperDPA approach (4.5%) than for the CRBGM (6.3%), although not significantly. In comparison, poor reproducibility was found using the [11C]DPA-713 in healthy controls by Coughlin et al. 42 according to a regional VT systematically increasing from test to retest. For the [11C]PBR28, Collste et al. 38 showed a mean VT absolute variability of 18% in gray matter and of 48% in white matter in healthy subjects, while Park et al. 39 described a test–retest variability between 7 and 9% in healthy volunteers and MS patients. Using the SCA approach and [11C]PK11195, this variation was found of 10.6% in four AD patients. 26
Another goal of this study was to take into account the impact of genetic polymorphism related to the affinity of [18F]DPA-714 to TSPO binding site on the SCA quantification. We confirmed here that the [18F]DPA-714 binding parameters estimated are affected by the affinity binding status of each subject, similar to the other second generation TSPO tracers.
8
First, the VT estimates of the pseudo-reference region extracted were 28% higher in HABs compared to MABs. Likewise, the difference between HABs and MABs was high in TSPO-rich regions:
The ability of the SuperDPA method to detect the impact of the TSPO polymorphism on [18F]DPA-714 uptake finally confirms the superiority of this method over the CRBGM which failed to show a significant difference in binding parameters between HABs and MABs.
Compared to SuperDPAHAB/MAB, the
One limitation of the study is that our method was only applied to a healthy group of volunteers. However, healthy subjects have a low expression of TSPO throughout brain regions and the quantification is expected to be more challenging than in patients where higher levels of TSPO expression are observed and therefore statistical differences should be more easily detected. Simulating pathological condition here by increasing the specific binding in the corresponding class (SuperDPAT40) did not change the extracted reference region and resulting binding parameters. This suggests that our method, based on kinetic classes defined in a population of healthy volunteers, can be applied in patients to accurately detect and quantify neuroinflammation. In an ongoing work, our SCA approach has been applied to nine Alzheimer patients and similar extracted pseudo-reference curves as those obtained in our HAB and MAB subjects were found, which shows that the method can extract the pseudo-reference curve consistently (unpublished data).
In this study, the contribution of constitutive binding to TSPO within the reference region is accounted for by the modelling. However, the question of whether this can be a confounding factor remains to be assessed. The introduction of an extra irreversible compartment representing this endothelial cell binding on blood–brain barrier in the model (2-TCM-1K) has been showed to enhance the estimation accuracy of the [11C]PBR28 binding parameters.16,45,46 In the present study, the validation of the SCA-based parameter estimation methods was done using estimates from our previous quantification study of [18F]DPA-714 which describes the 2-TCM as an appropriate model. The question of whether it is necessary to include endothelial binding into the AIF-based quantification for [18F]DPA-714 and whether it needs to be accounted for in simplified modeling methods as for [11C]PK1119525,45 is still under investigation.
Conclusion
In this study, we adapted a supervised clustering approach to automatically extract pseudo-reference regions within the brain from dynamic [18F]DPA-714 PET images of healthy volunteers. The creation of a unique set of predefined classes from both HAB and MAB subjects was shown to be adequate to extract a pseudo-reference region as it provided results with the same level of reliability than when creating two separate sets of predefined classes. Thus, the knowledge of TSPO genetic status is not a prerequisite to run the SCA method but the 30% difference in
Footnotes
Funding
The author(s) disclosed receipt of the following financial support for the research, authorship, and/or publication of this article: This work was supported by France Parkinson (NCT 02319382), ANR-08-MNPS-016-02 and ANR-10-IAIHU-06(NCT02305264). A grant from “Investissement d'Avenir – ANR-11-INBS-0011” – NeurATRIS, CEA. The sponsor of the NCT02305264 study was AP-HP (Assistance Publique des Hôpitaux de Paris). BB was partly supported by ECTRIMS and Fondation ARSEP. CW was supported by the Eurotalent grant number 600382.
Acknowledgements
The authors would like to thank chemical/radiopharmaceutical, PET physicist and nursing staff of Service Hospitalier Frédéric Joliot for the synthesis of [18F]DPA-714, patient management and PET image reconstruction. We thank Lena Guillot, Isabelle Rebeix, Sylvie Forlani, and Luce Dauphinot for the genetic analysis.
Declaration of conflicting interests
The author(s) declared no potential conflicts of interest with respect to the research, authorship, and/or publication of this article.
Authors' contributions
DGL and SL contributed equally to this article. BS and MB contributed equally to this article. DGL, MV, FT, BS and MB made substantial contribution to the concept. DGL, SL, CL, MV, FT, BS and MB made substantial contribution to the design. SL, BB, PR and MB made substantial contribution to the data acquisition. DGL, SL, CL, CW and MB made substantial contribution to the data analysis. DGL, SL, CL, CW, BS and MB made substantial contribution to the data interpretation. DGL, SL, CL, CW, BS and MB drafted the article. BB, PR, MV and FT revised critically the article. All authors approved the last version.