
Abstract
Transcranial infrared laser stimulation (TILS) is a noninvasive form of brain photobiomulation. Cytochrome-c-oxidase (CCO), the terminal enzyme in the mitochondrial electron transport chain, is hypothesized to be the primary intracellular photoacceptor. We hypothesized that TILS up-regulates cerebral CCO and causes hemodynamic changes. We delivered 1064-nm laser stimulation to the forehead of healthy participants (n = 11), while broadband near-infrared spectroscopy was utilized to acquire light reflectance from the TILS-treated cortical region before, during, and after TILS. Placebo experiments were also performed for accurate comparison. Time course of spectroscopic readings were analyzed and fitted to the modified Beer–Lambert law. With respect to the placebo readings, we observed (1) significant increases in cerebral concentrations of oxidized CCO (Δ[CCO]; >0.08 µM; p < 0.01), oxygenated hemoglobin (Δ[HbO]; >0.8 µM; p < 0.01), and total hemoglobin (Δ[HbT]; >0.5 µM; p < 0.01) during and after TILS, and (2) linear interplays between Δ[CCO] versus Δ[HbO] and between Δ[CCO] versus Δ[HbT]. Ratios of Δ[CCO]/Δ[HbO] and Δ[CCO]/Δ[HbT] were introduced as TILS-induced metabolic-hemodynamic coupling indices to quantify the coupling strength between TILS-enhanced cerebral metabolism and blood oxygen supply. This study provides the first demonstration that TILS causes up-regulation of oxidized CCO in the human brain, and contributes important insight into the physiological mechanisms.
Introduction
Transcranial infrared laser stimulation
Photobiomodulation is a noninvasive intervention shown to regulate cellular functions in cell cultures, animal models, and clinical conditions.1–5 To avoid any confusion between the method we use for spectroscopy and the method we use for laser stimulation, let us clarify the terminology between them: Infrared light is in the wavelength range from 700 nm to 1 mm, a branch of which is 760–1440 nm and is often called near-infrared light (NIR). 6 Since we use “NIR” to express NIR spectroscopy (NIRS) utilized in our spectroscopy measurements, we name our laser stimulation at 1064 nm as “infrared” laser stimulation. Within the wavelength spectrum of approximately 620–1100 nm, the light absorption by tissue chromophores is weak. 7 The primary mechanism of photobiomodulation rests on photon absorption by cytochrome c oxidase (CCO), 8 which is the terminal enzyme in the mitochondrial respiratory chain that plays a key role in neuronal oxygen utilization for energy metabolism. 9 The greater the oxidized CCO increases, the greater oxygen consumption and metabolic energy is produced via mitochondrial oxidative phosphorylation. 10 This photonics-bioenergetics mechanism results in unique metabolic effects on the brain, with benefits for cognitive enhancement and neuroprotection.11,12 In recent years, brain photobiomodulation has gained attention for its therapeutic potential in many neurological and psychological conditions.10,13 It is reported being safe for treating ischemic stroke4,5 and chronic traumatic brain injury. 14 Schiffer et al. 15 also found that a single session of light at 810 nm to the forehead could have psychological benefits in patients with major depression and anxiety. Stimulating with the same light irradiance as Schiffer et al. 15 but at 1064 nm, Barrett and Gonzalez-Lima 3 conducted the first controlled study in healthy humans that demonstrated TILS improves frontal-cortex-based cognitive and emotional functions. Subsequent controlled studies by the same group showed that TILS improves executive functions 16 and reduces depression symptoms. 17 TILS is also as effective as vigorous aerobic exercise to improve cognition. 18
Despite the numerous preclinical studies and promising outcomes from a few clinical trials, however, brain photobiomodulation has not been widely adopted by mainstream medicine. One reason is that uncertainty still remains about the mechanism of action of photobiomodulation in the human brain in vivo. In order for TILS to be adopted as an objective scientifically-based brain intervention, it is essential to quantitatively assess and better understand the cerebral metabolic and hemodynamic effects of TILS.
Near-infrared spectroscopy
Also using light in the red to near-infrared range, near-infrared spectroscopy (NIRS) is an emerging optical imaging technique and measures hemodynamic changes in living tissues by measuring the light absorption of oxygenated hemoglobin (HbO) and deoxygenated hemoglobin (HHb).19–21 In addition, NIRS can monitor the redox state of mitochondrial CCO with suitable algorithms and broadband components.22,23 In particular, our group recently reported that broadband NIRS (bb-NIRS) can be used successfully to quantify the photobiomodulation effects of 1064-nm laser on the human forearm in vivo. 24 Both CCO and HbO up-regulation were primary metabolic and hemodynamic effects of photobiomodulation, which served as direct and quantitative measures of cellular oxygen metabolism. Because bb-NIRS shares similar pathways of light through the biologic and/or cerebral tissues with TILS, a combination of these two techniques may provide an ideal imaging tool for in vivo mechanistic study and treatment evaluation of TILS.
The present study integrated bb-NIRS and TILS to quantitatively assess the cerebral metabolic (CCO) and hemodynamic (HbO, HHb) effects of a single photobiomodulation session, as well as to assess their relationships. We tested two hypotheses: (1) single-session TILS induces reliable and measurable CCO changes in the human brain in vivo, and (2) these CCO changes result in and correlate with the subjects’ hemodynamic alterations.
Novel approaches and findings of this study
In the current study, we utilized a bb-NIRS system along with a TILS unit at 1064 nm; we interleaved TILS intervention and the bb-NIRS data acquisition on the right forehead of 11 human controls in vivo throughout the pre-, during, and post-TILS and placebo intervention. We were able to simultaneously assess/quantify concentration changes in CCO, HbO, and HHb (i.e. Δ[CCO], Δ[HbO], and Δ[HHb], respectively), which also allowed us to readily quantify total and differential hemoglobin concentrations (i.e. Δ[HbT] and Δ[HbD], respectively). Consequently, we were able to investigate relationships among up-regulation of oxidized [CCO] versus corresponding alterations of cerebral blood flow, cerebral blood volume, and cerebral hemodynamic oxygenation. Overall, the results of this study provided the first demonstration that photobiomodulation up-regulates oxidized CCO concentrations in the human brain in vivo. They also confirmed the feasibility of a non-invasive, cost-effective cerebral stimulation-with-imaging approach that integrates two transcranial optical technologies. This novel approach provided insight into the underlying mechanism of TILS-induced effects on brain and behavior. 10
Materials and methods
Participants
Eleven healthy human participants with a mean (±standard deviation) of 31 (±13.7) years of age were recruited from the local community of The University of Texas at Arlington (UTA). Interested individuals were screened based on the same inclusion criteria as those in Wang et al. 24 Eligible participants underwent two separate experiments in sequence: the placebo treatment was administered on their right forehead, followed by TILS administered on the same location, 5 min after the first experiment. The exclusion and inclusion criteria were the same as those in Wang et al. 24 The study protocol used was reviewed and approved by the Institutional Review Board (IRB) of the University of Texas at Arlington (UTA) as well as complied with all applicable federal and NIH guidelines. The methods were carried out according to the approved ethical guidelines that governed conduct of human experimentation by the IRB of UTA. Written informed consent was obtained from each participant prior to the experiments.
Instruments
It is noted that the laser stimulation and the spectroscopic measurement were two different optical methods that used two different light sources with nonoverlapping wavelengths. The laser stimulation used monochromatic infrared at 1064 nm, whereas the spectroscopic measurement used a broadband light source starting at 400 nm and filtered to 1000 nm.
An FDA-cleared 1064-nm continuous wave laser device (HD Laser Model CG-5000, Cell Gen Therapeutics LLC, Dallas, TX) was used for both placebo and laser treatments. Laser therapy has been approved by the FDA for various uses in humans.25,26 The laser was emitted from a handpiece, and the measured laser beam had an area of 13.6 cm2. There was a button to turn on/off the laser beam on the handpiece. To avoid any undesirable artifacts in the experiment, a 2-cm distance between laser aperture and stimulation site was kept during the stimulation process. Because of collimation, the laser beam’s size was kept approximately the same from the laser aperture to the stimulation spot on the participant’s forehead.
The laser power during the stimulation treatment was controlled at 3.4 W. The power density in the beam area was 0.25 W/cm2, the same as that used in our previous studies.3,16,24,27 For the placebo treatment, the same device was applied to the subject’s forehead while the laser power was tuned down to 0.1 W. The laser aperture was further covered by a black cap so that no laser was delivered to the subject. In this way, the sham appeared similar to the actual laser stimulation but without any light released.
To avoid any potential skin damage, the power density of the FDA-cleared Class 4 laser (International standard IEC 60825-1) was kept low corresponding to that of a Class 3b laser. Specifically, irradiance was kept at 0.25 W/cm2. Following previously successful studies,3,16,24,27 our safe laser stimulation parameters were as follows: Total laser power = 3.4 W; Area of laser beam radiation = 13.6 cm2; Power density = 3.4 W/13.6 cm2 = 0.25 W/cm2; Time radiated per cycle = 55 s; Total laser energy per cycle = 3.4 W × 55 s = 187 J/cycle. Total laser energy density per cycle = 0.25 W/cm2 × 55 s = 13.75 J/cm2/cycle.
A single-channel, bb-NIRS system was built to measure Δ[HbO], Δ[HHb], and Δ[CCO] in vivo during TILS and placebo experiments. Figure 1 shows (1) a tungsten-halogen lamp with a spectral range of 400–1500 nm (Model 3900, Illumination Technologies Inc., East Syracuse, NY), (2) a miniature high-sensitivity CCD bb-fNIRS spectrometer with a spectral range of 735–1100 nm (QE-Pro, Ocean Optics Inc.), (3) a self-designed, “I”-shaped probe holder to hold a 3.5-mm optical fiber bundle relayed to the white light, and (4) an optical shutter to switch on and off the white light. A low-pass filter with a cut-off frequency of 1000 nm was attached at the bundle tip within the holder to reduce the tissue heating effect from the broadband light of the tungsten halogen lamp (400–1500 nm) used as a light source for the spectroscopic measurement when the 1064 nm laser is turned off. The diffuse light was collected by another fiber bundle and relayed to the bb-NIRS spectrometer. The distance between two optodes in the holder was 3 cm (see Figure 1). A laptop computer was used to acquire, display and save the experimental data. Clinical nonresidual hypoallergenic double-sided tape (Noraxon USA Inc.) was used to minimize motion artifacts between the holder and forehead. In both experiments, the laser beam from CG-5000 was administered at the lower site of the holder, but above the eye brow (see Figure 1).
Schematic diagram of the experimental setup, including a bb-NIRS spectroscopic system. This bb-NIRS unit consisted of a tungsten halogen lamp as the light source and a miniature high-sensitivity CCD spectrometer as the detector for this study. TILS was administered underneath the “I”-shaped probe holder. The narrow, middle section of the holder was ∼8 mm in width. A laptop computer was used to acquire, display and save the data from the spectrometer. The shutter controlled the on and off function for the white light from the tungsten-halogen lamp to the subject’s forehead. A pair of protection goggles was worn during the whole experimental procedure.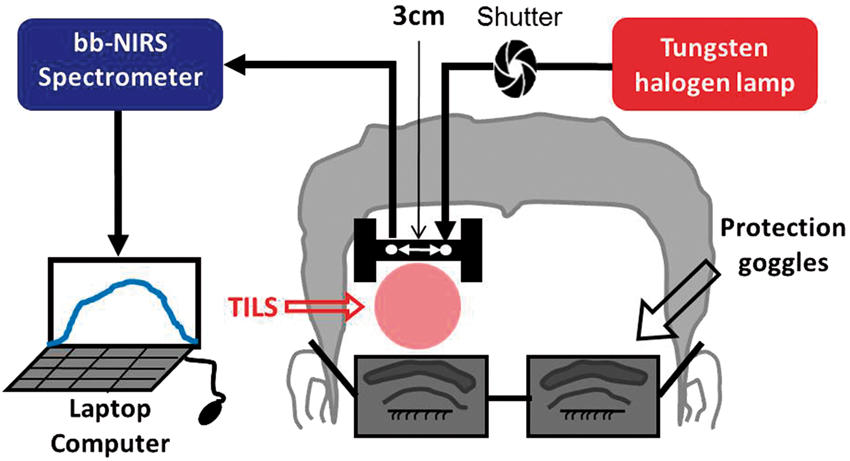
Experiments
The experiments were conducted in a similar environment as that reported in Wang et al. 24 and Tian et al. 27 Briefly, while investigators and participants wore protective goggles, the participants were instructed to close their eyes during the experiments. After each participant was comfortably seated, a quick measurement of absorption coefficient (µa) and reduced scattering coefficient (µs′) at 750 nm, 785 nm, 811 nm, and 830 nm from the participant’s right forehead was acquired using a frequency-domain NIRS tissue oximeter (OxiplexTS, ISS Inc., Champaign, IL). Then the I-shaped optical probe holder was firmly placed at the same location (see Figure 1). During both placebo and TILS experiments, a well-trained graduate researcher held the aperture of CG-5000 laser closely to the participant’s right forehead to deliver stimulations.
Each treatment session consisted of eight 1-min cycles, 55-s laser on and 5-s laser off per cycle (see the 2nd row from top in Figure 2). In each treatment session, a 2-min baseline was acquired by bb-NIRS. To avoid potential contamination between the laser from CG-5000 and white light for bb-NIRS readings, data acquisition and laser stimulation were interleaved: During the 5-s laser-off periods, the shutter for white light was on and bb-NIRS data were collected (see the top and bottom rows of Figure 2). Keeping the same acquisition format, data during pre-treatment baseline and post-treatment recovery were also acquired at 55-s intervals. A total of 15 data points (see Figure 2) were obtained throughout each experiment under placebo and TILS conditions. To minimize possible stimulation effect from the white light, the optical shutter was open only during the 5-s data acquisition per 60-s cycle.
Paradigm of the TILS/placebo treatment and interleaved bb-NIRS data acquisition. Each treatment session consisted of eight 1-min treatment cycles: 55-s laser on and 5-s laser off per cycle. During the 5-s laser-off periods, the bb-NIRS system (both the light source and detector) was switched on for bb-NIRS data acquisition. The same data acquisition format was followed for baseline and recovery sessions.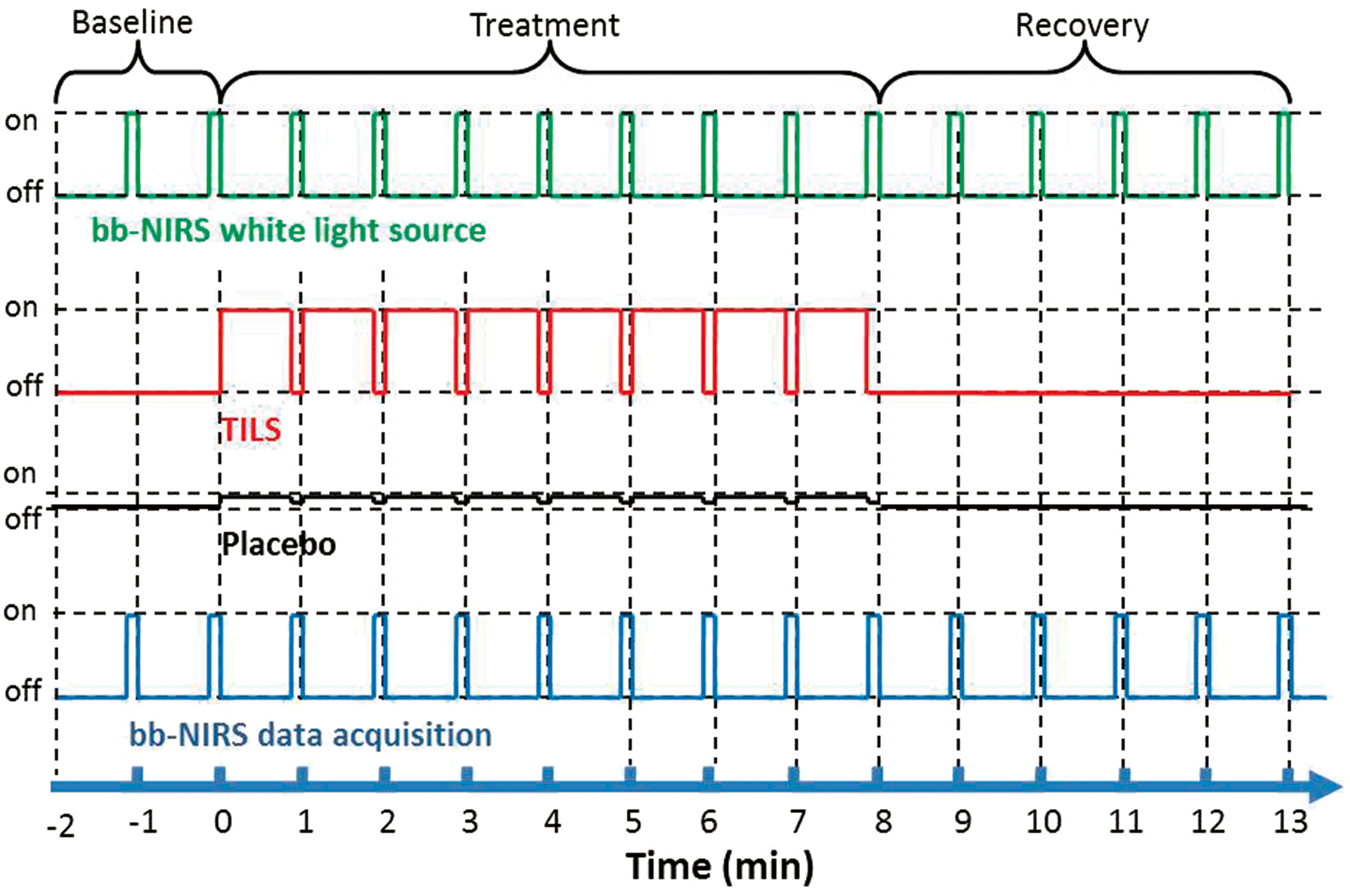
The participants were blinded for the placebo and TILS treatments. We verified that negligible heat was generated by TILS at the stimulation power of 3.4 W on the participants’ skin. 24 During the placebo experiment, the laser device was also turned on, so the participant could hear the same operation sound from the laser unit as that heard during actual TILS. Thus, the two experiments were designed to cause approximately the same sensations/expectations in the participants. The participant was given a 5-min break between the two experiments.
Data processing and statistical analysis
The estimations of Δ[HbO], Δ[HHb], and Δ[CCO] from raw spectral data taken by the bb-NIRS were performed, following the same steps given in Wang et al., 24 which is also given in the Supplementary Material of this paper. After completing the regression algorithm, we were able to obtain the best fit of the chromophore-specific concentrations to the measured spectrum. Then temporal values of Δ[HbO], Δ[HHb], and Δ[CCO] at 13 time points were evaluated for each human participant under either placebo or TILS conditions. Furthermore, since total and differential concentrations of hemoglobin are defined as Δ[HbT] = Δ[HbO] + Δ[HHb] and Δ[HbD] = Δ[HbO] − Δ[HHb], respectively, time courses of Δ[HbT] and Δ[HbD] at 13 points were readily obtained and averaged across all the subjects under either treatment condition. Further statistical analysis was followed to determine respective significant difference of Δ[HbO], Δ[HHb], Δ[HbT], Δ[HbD], and Δ[CCO] between the placebo versus TILS experiment across 11 human subjects.
To evaluate the TILS treatment effect with respect to the placebo treatment, the sample average and sample standard deviation of the 11 human participants in both treatments were calculated. A two sample t-test between these two treatment types was conducted for each chromophore (ΔHbO, ΔHHb, ΔHbT, ΔHbD, and ΔCCO) at each time point. A two-tailed level of 0.01 < p < 0.05 and p < 0.01 was chosen to be statistically significant in these tests.
Results
Time courses of TILS-induced Δ[CCO], Δ[HbO], Δ[HHb], Δ[HbT], and Δ[HbD]
Figure 3(a) shows two time courses of Δ[HbO] at pre-, during, and post-TILS (red symbols) or placebo (blue symbols) treatments for over 15 min (i.e. 2-min baseline, 8-min TILS/placebo, and 5-min recovery), with each data point being averaged across all the subjects (n = 11). Since laser energy density dose is often defined as exposure time × laser power density, Figure 3(a) illustrates the time-dependent dose-response relationship between TILS/placebo-induced transcranial Δ[HbO] and laser energy dosage at the group level. In a similar format to Figure 3(a), Figure 3(b) to (e) presents the group-averaged time courses of Δ[HHb], Δ[HbT], Δ[HbD], and Δ[CCO], respectively, under either TILS or placebo conditions.
Subject-averaged time courses of TILS/placebo-induced cerebral changes of (a) [HbO], (b) [HHb], (c) [HbT], (d) [HbD], and (e) [CCO] (all in µM) recorded from human foreheads in vivo (mean ± SE, n = 11). Time zero (t = 0) is the onset of TILS. In each subplot, the shaded region indicates the period of TILS/placebo treatment. “*” indicates significant differences (0.01 < p < 0.05, two sample t-test) in respective concentrations between TILS and placebo treatment. “**” indicates significant differences (p < 0.01, two sample t-test) in respective concentrations between TILS and placebo treatment.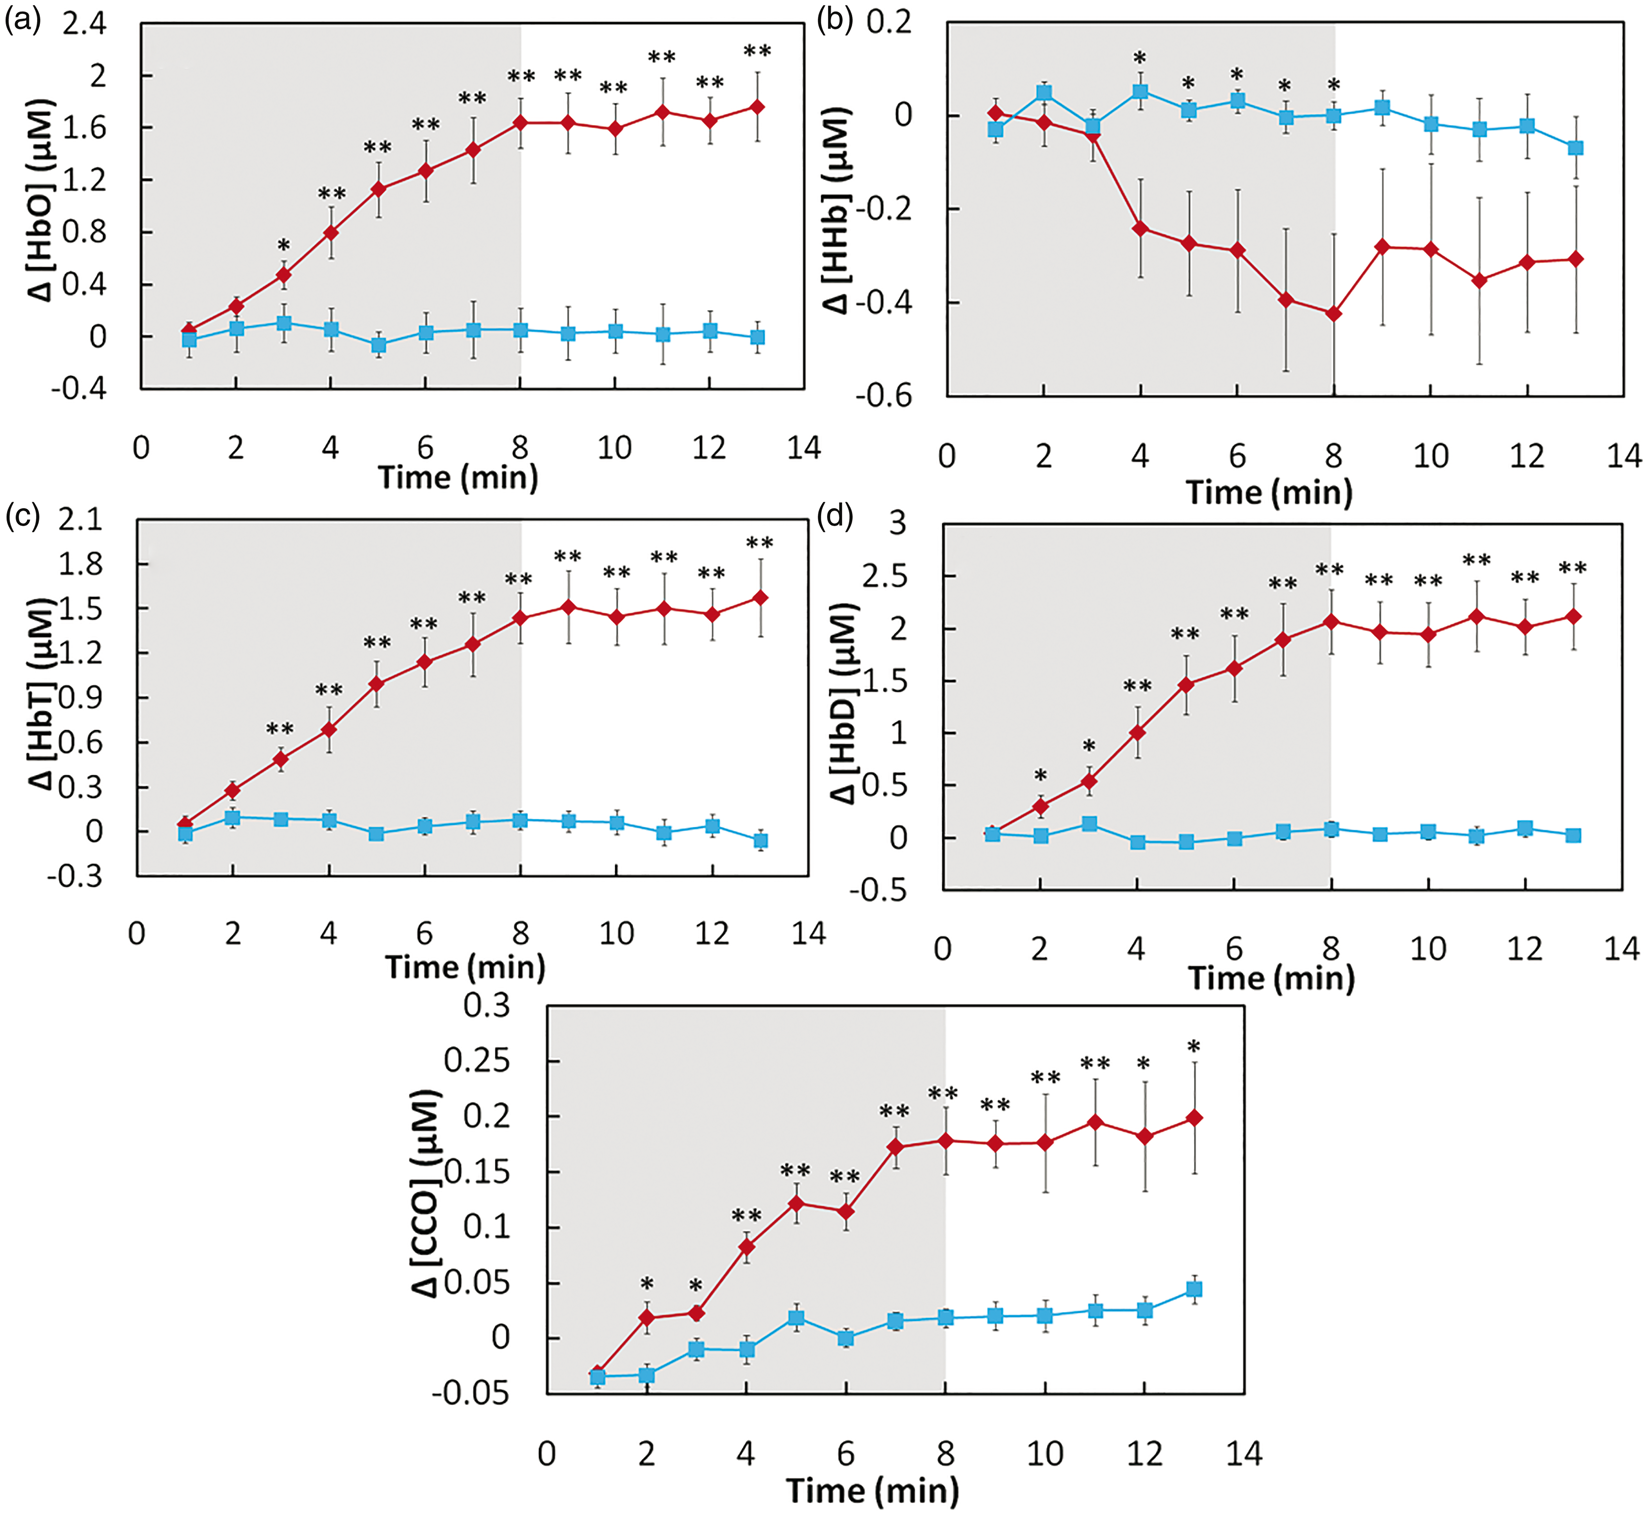
Focusing on the data shown in Figures 3(a), (b), and (e), it was clear that TILS significantly increased Δ[HbO] and Δ[CCO] and decreased Δ[HHb] as compared to the placebo treatment. Inspection on these three figures also revealed time-dependent TILS effects, as follows: (1) a significant TILS-induced increase in Δ[CCO] appeared to occur fastest in time, 2 min right after TILS started (Figure 3(e)); (2) the increase in Δ[HbO] became significant 3 min after the laser onset (Figure 3(a)), followed by (3) a steep significant decrease in Δ[HHb] 4 min after the initiation of TILS (Figure 3(b)).
Next, considering Figure 3(c) and (d), it is important to recall Tsuji et al.,28,29 Soul et al., 30 and Hupert et al. 31 indicating that cerebral Δ[HbT] is proportional to a change in cerebral blood volume (ΔCBV) while Δ[HbD] is closely correlated with changes in cerebral blood flow (ΔCBF). Thus, Figure 3(c) and (d) reflects significant increases of ΔCBV and ΔCBF induced by TILS. These two figures also revealed that TILS-induced Δ[HbD] (or ΔCBF) increased significantly as fast as Δ[CCO] while the corresponding Δ[HbT] (or ΔCBV) delayed a little with respect to Δ[CCO], but about the same increasing rate as Δ[HbO] (3 min after TILS onset).
Dependence of cerebral hemodynamic parameters on TILS-induced cerebral Δ[CCO]
By extracting chromophore concentrations differences in response to TILS and placebo, we reorganized and replotted the data to display the close dependence of each cerebral hemodynamic parameter on TILS-induced cerebral Δ[CCO], as shown in Figure 4. Figure 4(a) clearly exhibits a strong, positive linear relationship between Δ[CCO] versus Δ[HbO] (with a correlation coefficient of R2 = 0.968 and a p-value of p < 0.001), and a strong, negative linear relationship between Δ[CCO] versus Δ[HHb] (with a correlation coefficient of R2 = 0.965 and a p-value of p < 0.001). On the other hand, both open diamonds and open squares represent placebo-induced Δ[HbO] and Δ[HHb] values, which were all within a lower Δ[CCO] range without any obvious linear relationship shown in the figure. In addition, similar to Δ[HbO], Figure 4(b) also demonstrated strong, positive linear dependences of Δ[HbD] and Δ[HbT] on TILS-generated Δ[CCO] with R2 > 0.96.
(a) Relationships between subject-averaged Δ[CCO] vs Δ[HbO] and Δ[CCO] vs Δ[HHb] that resulted from TILS and placebo treatment (mean ± SE, N = 11). Solid red diamonds display the relationship of Δ[CCO] vs Δ[HbO]; solid blue dots display the relationship of Δ[CCO] vs Δ[HHb]. Both red open diamonds and blue open squares represent placebo-treated Δ[CCO] vs Δ[HbO] and Δ[CCO] vs Δ[HHb], respectively. (b) Relationships between subject-averaged Δ[CCO] vs Δ[HbT] and Δ[CCO] vs Δ[HbD] caused by TILS and placebo treatment. Solid purple circles display the relationship of Δ[CCO] vs Δ[HbT]; solid black triangles display the relationship of Δ[CCO] vs Δ[HbD]. Both red open circles and open triangles represent placebo-treated Δ[CCO] vs Δ[HbO] and Δ[CCO] vs Δ[HHb], respectively. All error bars represent standard errors of means from respective chromophore concentrations.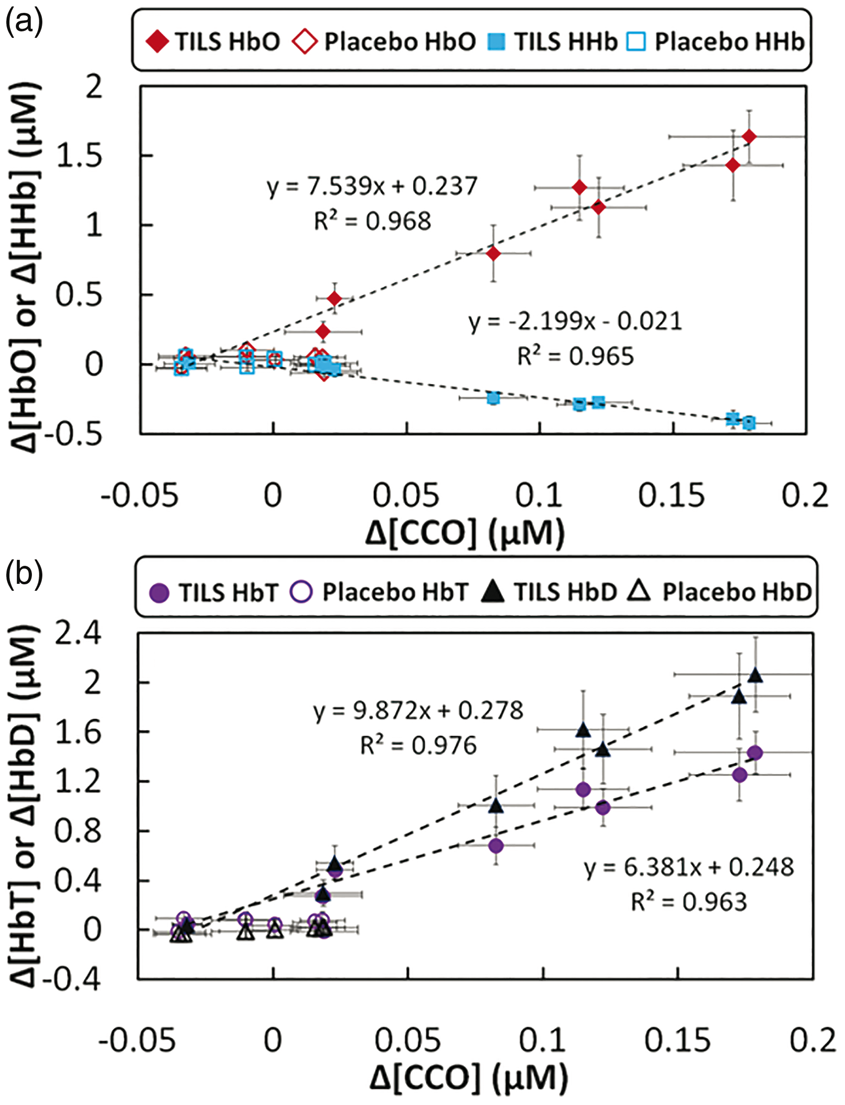
TILS-induced ratios of cerebral Δ[CCO] to increased cerebral hemodynamic parameters
Furthermore, we examined ratios of TILS-induced cerebral Δ[CCO] to three of the increased cerebral hemodynamic parameters, i.e. Δ[HbO], Δ[HbT], and Δ[HbD], since these three parameters reflect increased cerebral oxygenation, CBV, and CBF initiated by TILS, respectively. These ratios revealed quantitative physiological associations between the cerebral metabolic up-regulation of [CCO] and corresponding hemodynamic oxygen supply. In Figure 5(a), red symbols and lines plot the ratios of Δ[CCO]/Δ[HbO] at each time point during and post-TILS periods. It was clear that 2 min after TILS started, this ratio remained above or around 12.5–13%, with an initial but nonsignificant variability across the 11 subjects. Following the same format, we also plotted the subject-averaged ratio of Δ[CCO]/Δ[HbT] during and post-TILS periods, in Figure 5(c), by the red symbols and lines. Similar to Figure 5(a), we found that 2 min after TILS started, this ratio from the forehead recording reached above 15% and remained relatively constant across the entire 12 min (7 min during TILS and 5 min post-TILS).
Ratios of (a) Δ[CCO]/Δ[HbO], (c) Δ[CCO]/Δ[HbT], and (e) Δ[CCO]/Δ[HbD] during and after infrared laser stimulation on the right forehead of 11 human subjects (red symbols) and on the right forearm of another group of 11 human subjects (blue symbols). Time-averaged ratios of (b) Δ[CCO]/Δ[HbO], (d) Δ[CCO]/Δ[HbT], and (f) Δ[CCO]/Δ[HbD] with corresponding standard deviations in both forearm and forehead stimulation cases. “**” marks significant difference (p < 0.01, two sample t-test) of Δ[CCO]/Δ[HbO] or Δ[CCO]/Δ[HbT] between the stimulated cases. “*” marks significant difference (p < 0.05, two sample t-test) of Δ[CCO]/Δ[HbD] between the stimulated cases.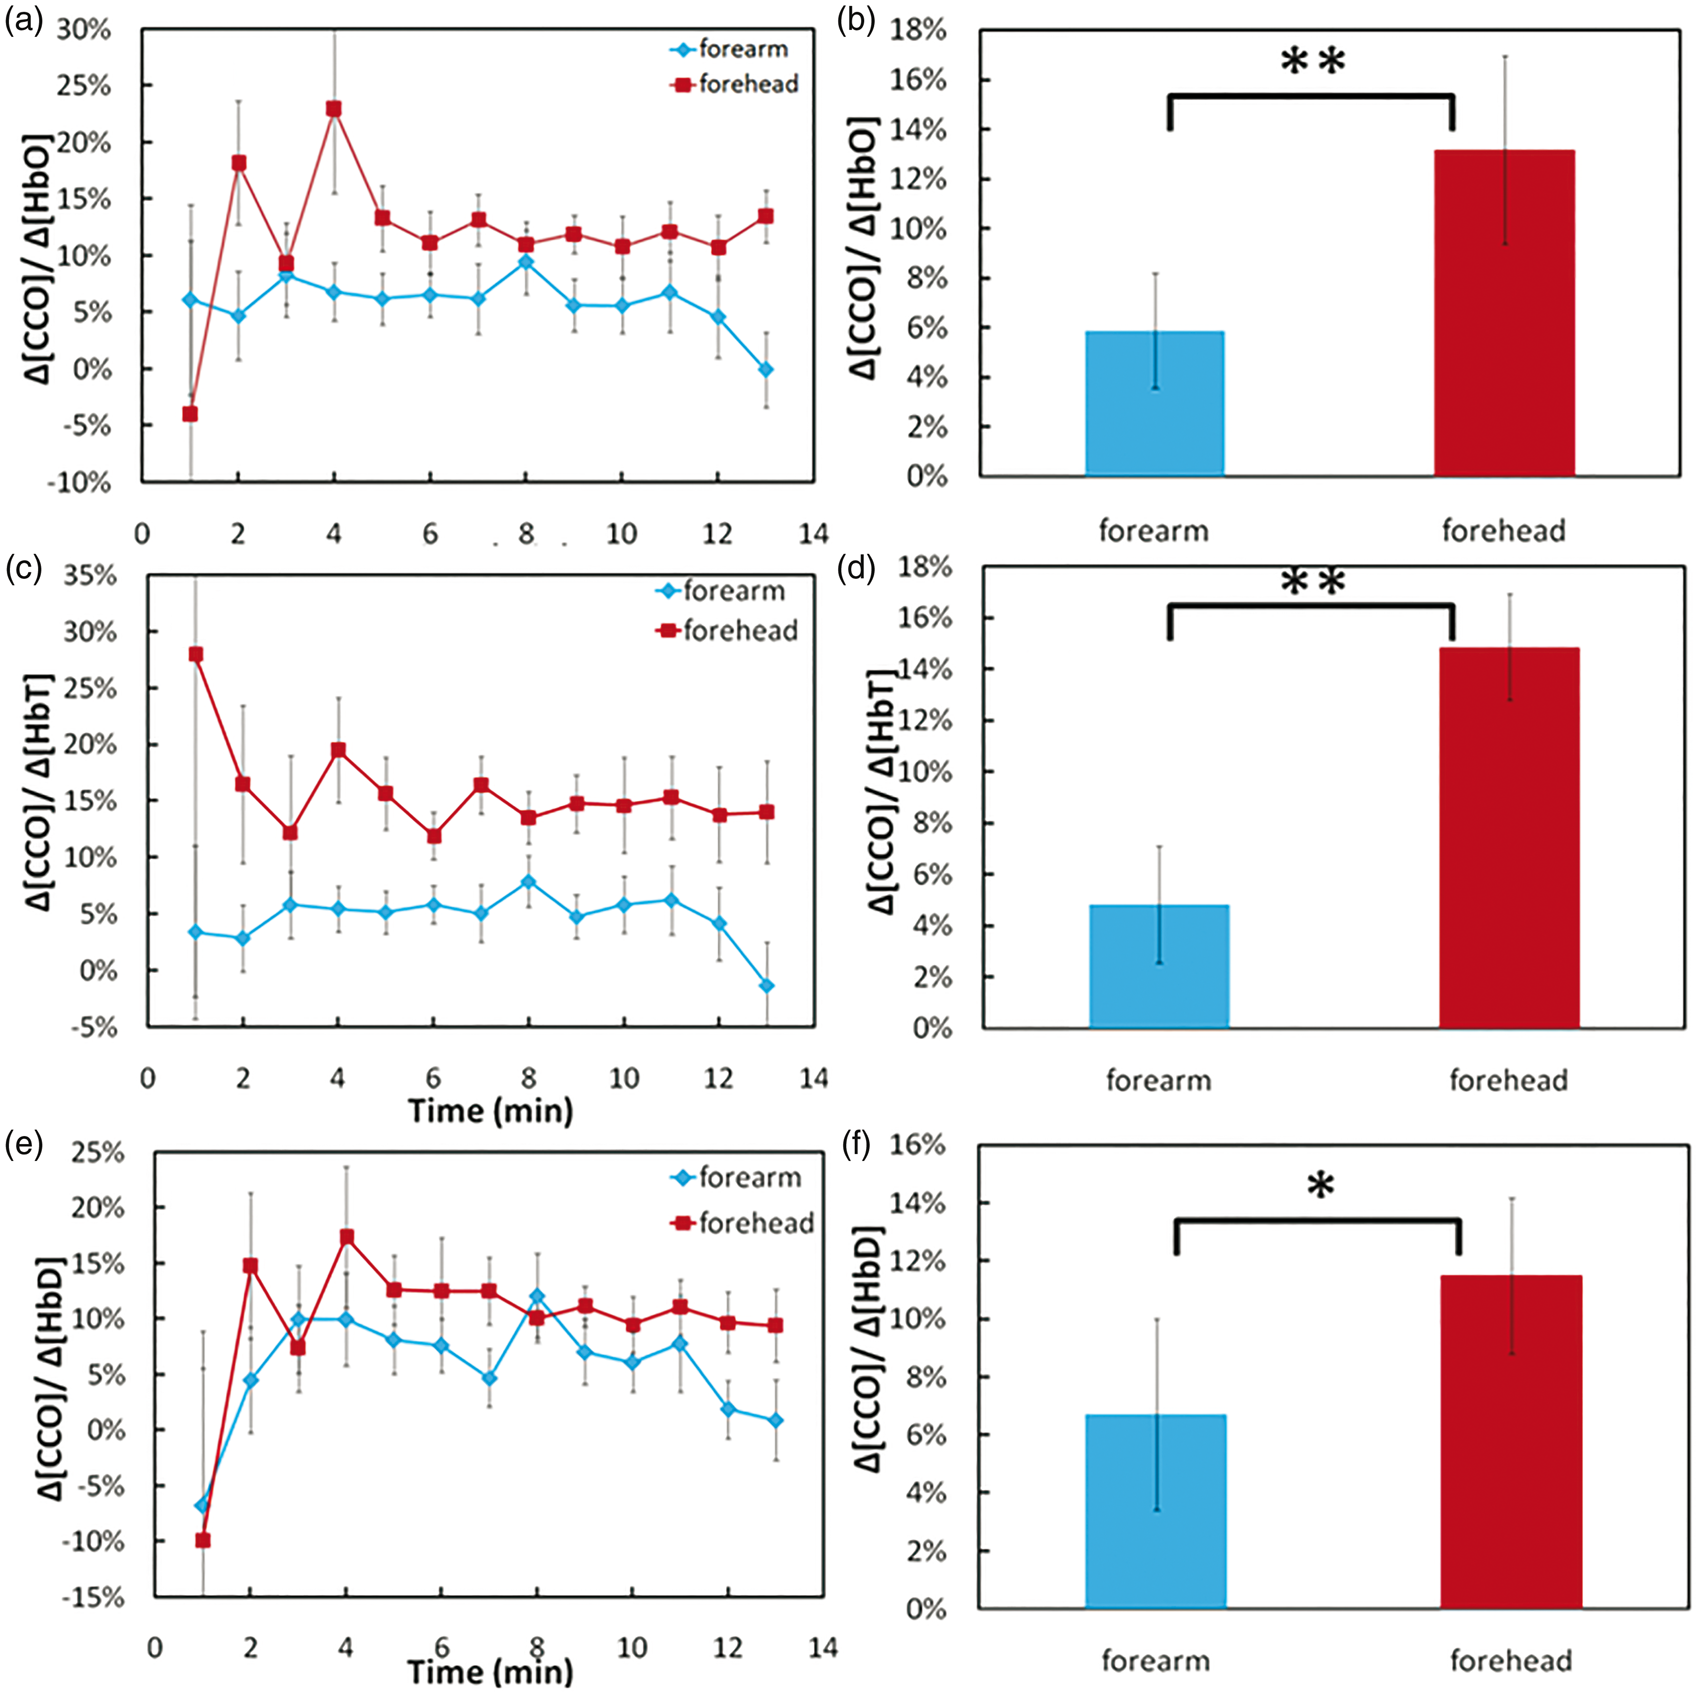
For a better comparison, we also quantified the ratios of the same parameters from identically laser-stimulated human forearms (n = 11) based on the data reported in our previous study. 24 The blue symbols and lines in Figure 5(a) represent the ratios of Δ[CCO]/Δ[HbO] obtained from the laser-stimulated human forearms, with an average of∼6% across all the subjects. The group-averaged ratio of Δ[CCO]/Δ[HbT] from the stimulated forearms were also small (∼5%), as illustrated in Figure 5(c). Similar trends also existed for Δ[CCO]/Δ[HbD] for both the laser-treated foreheads and forearms across most of time points, as illustrated in Figure 5(e).
In order to test for statistically significant group differences in these ratios between laser-treated foreheads and forearms, we further time-averaged the mean ratios of Δ[CCO]/Δ[HbO] Δ[CCO]/Δ[HbT], and Δ[CCO]/Δ[HbD] across the time during and post-TILS periods (excluding the 1st time point at t = 1 min) from 2 to 13 min for all three cases. Figure 5(b), (d), and (f) shows bar plots (mean ± SD, N = 11) and clearly demonstrated that these ratios of laser-induced Δ[CCO] to corresponding hemodynamic increases in the human forehead are significantly larger than those in the human forearms.
Discussion
New findings of this study
Following the first demonstration of increased oxidized CCO and hemoglobin concentrations in response to laser photobiomodulation on the human forearm in our previous study, 24 we utilized a similar experimental design and protocol and applied the same laser stimulation transcranially on the right forehead of 11 human subjects in this study. For the first time, bb-NIRS was used to quantify TILS-induced cerebral Δ[CCO] and four hemodynamic parameters, namely, Δ[HbO], Δ[HHb], Δ[HbT], and Δ[HbD] (Figure 3). With this novel approach and careful data acquisition and analysis, we demonstrated that 1064-nm laser could induce significant increases of cerebral Δ[CCO] and corresponding Δ[HbO], Δ[HbT], as well as Δ[HbD] in a dose-dependent manner over time, as compared with those under the placebo treatment (Figure 3). In addition, clear positive linear relationships between Δ[CCO] versus Δ[HbO], Δ[HbT], and Δ[HbD] (Figure 4) suggested that TILS resulted in not only rapid up-regulation of [CCO] but also subsequent increases of cerebral blood flow (in proportion to Δ[HbD]), blood volume (in proportion to Δ[HbT]), and blood oxygenation (in proportion to Δ[HbO]).
Furthermore, we carefully reviewed, derived, and quantified the wavelength-dependent DPF factor, DPF(λ), which played a critical role for this study to minimize crosstalk artifacts22,23 and improve the accuracy of [CCO] quantification. This study demonstrates the great utility of bb-NIRS as a noninvasive technology for mechanistic investigations and treatment evaluations of TILS that has great potential to become an intervention tool for improving cognitive and emotional functions in subjects with and/or without neurological disorders.3,13
Comparison of the results between this study and previous ones
We recently published two papers:24,27 In Wang et al., 24 we reported that laser-stimulated Δ[CCO] on the human forearm was strongly and linearly correlated with Δ[HbO], which is consistent with this study when the same laser and stimulation paradigm were performed on the human forehead. These consistent findings demonstrated a significant effect of photobiomodulation on human tissue CCO and a close interplay between metabolic CCO and hemodynamic oxygenation, which remains even after ending the laser treatment (i.e. in the recovery phase). Furthermore, Figure 3 clearly showed that a significant TILS-induced increase of Δ[CCO] started first, and was then followed in time by significant changes in Δ[HbO] and Δ[HHb]. This implies that the metabolic up-regulation of [CCO] occurred prior to any hemoglobin responses, and that Δ[HbO] increased a little faster than Δ[HHb]. This “Δ[CCO]-lead-Δ[HbO]” observation was also confirmed in Wang et al. 24
One difference between this paper and Wang et al. 24 is noted below: Laser-induced Δ[HHb] on the human forearm showed a gradual, nonsignificant increase while TILS-induced Δ[HHb] on the human forehead exhibited a significant decrease. One important observation of the current study is that TILS-induced Δ[HbT] and Δ[HbD] correlated highly and linearly with Δ[CCO] on the human forehead (Figure 4(b)), implying TILS-driven increases in CBV and CBF at the treated site. For quantitative comparison, we went back to the human forearm data and calculated the relationships between laser-induced Δ[HbT] versus Δ[CCO] and Δ[HbD] versus and Δ[CCO]. This additional calculation confirms that the laser-treated arms also exhibited increases in Δ[HbT] and Δ[HbD] and, thus, in total blood volume and blood flow, consistent with the observation seen in the treated human forehead, as reported in this paper.
In Tian et al., 27 with use of a dual-wavelength NIRS system, we reported significant increases in Δ[HbO], Δ[HbD], and Δ[HbT] as well as a decrease in Δ[HHb] in response to TILS given on the human forehead. All the trends in changes of chromophore concentrations were very consistent with the results shown in this current paper. Note that the sites to deliver TILS and to acquire NIRS data were about at the same location on each subject’s right forehead in both studies, supporting good reproducibility and reliability for our findings. However, the magnitude of decreased Δ[HHb] in the current study is much smaller than that in Tian et al. 27 This quantitative difference in Δ[HHb] could be attributed to the exclusion of Δ[CCO]. In principle, dual-wavelength measurements permit determinations of concentration changes in only two chromophores (i.e. Δ[HbO] and Δ[HHb]) without consideration of Δ[CCO]. In contrast, this current study carefully analyzed wavelength dependence of DPF(λ) by applying a frequency domain OxiplexTS tissue oximeter to accurately determine absorption and reduced scattering coefficients on the human forehead. Instead of employing two wavelengths, we applied a total of 161 wavelengths to perform a broadband linear regression. All of these procedures should minimize calculation errors and lead to improved accuracy of Δ[HbO], Δ[HHb], and Δ[CCO] determination,22,32 and thus more accurate Δ[HbT] and Δ[HbD] as well. Furthermore, with the bb-NIRS approach in this study, we observed larger increases in blood volume, which is consistent with a previous report that laser stimulation could lead to an increase of blood flow. 33
Interpretation of TILS mechanism
Based on the results observed in this study and the existing literature, we can better interpret and understand the mechanism of TILS, which can be explained schematically using Figure 6(a). Specifically, infrared light initiates a series of reactions linked to energy production inside mitochondria, which may be summarized into six biochemical processes: CCO photon absorption, CCO oxidation, proton pumping and nitric oxide (NO) release, CCO-catalyzed oxygen reduction to water, ATP synthesis by oxidative phosphorylation, and coupled hemoglobin oxygen transport. Each of these processes may be briefly explained as follows: (1) (a) Model of the photobiochemical mechanism of action of infrared light on the measured cytochrome c oxidase oxidation (CCO oxidized) and hemoglobin oxygenation (HbO2). While some of the initial steps may occur at the same time, the proposed biochemical processes are numbered sequentially to better explain the observed increased concentration of oxidized CCO during 1064-nm laser stimulation. See text for detailed explanation. (b) The right most panel shows a pyramidal neuron of the cerebral cortex, which is modified from a figure in Huettel et al.
41
The middle dashed rectangle is a zoomed section of apical dendrite, containing an abundant amount of mitochondria, with which CCO can be photo-stimulated and oxidized by TILS. This photobiomodulation consequently drives increases of HbO, HbT, and HbD. (c) A flow chart to show the conventional neuro-vascular coupling by the black-colored notations and our newly-defined TILS-induced metabolic-hemodynamic coupling by the red-colored notations. The blue-colored notations represent common endpoints of both mechanisms on the cerebral circulation.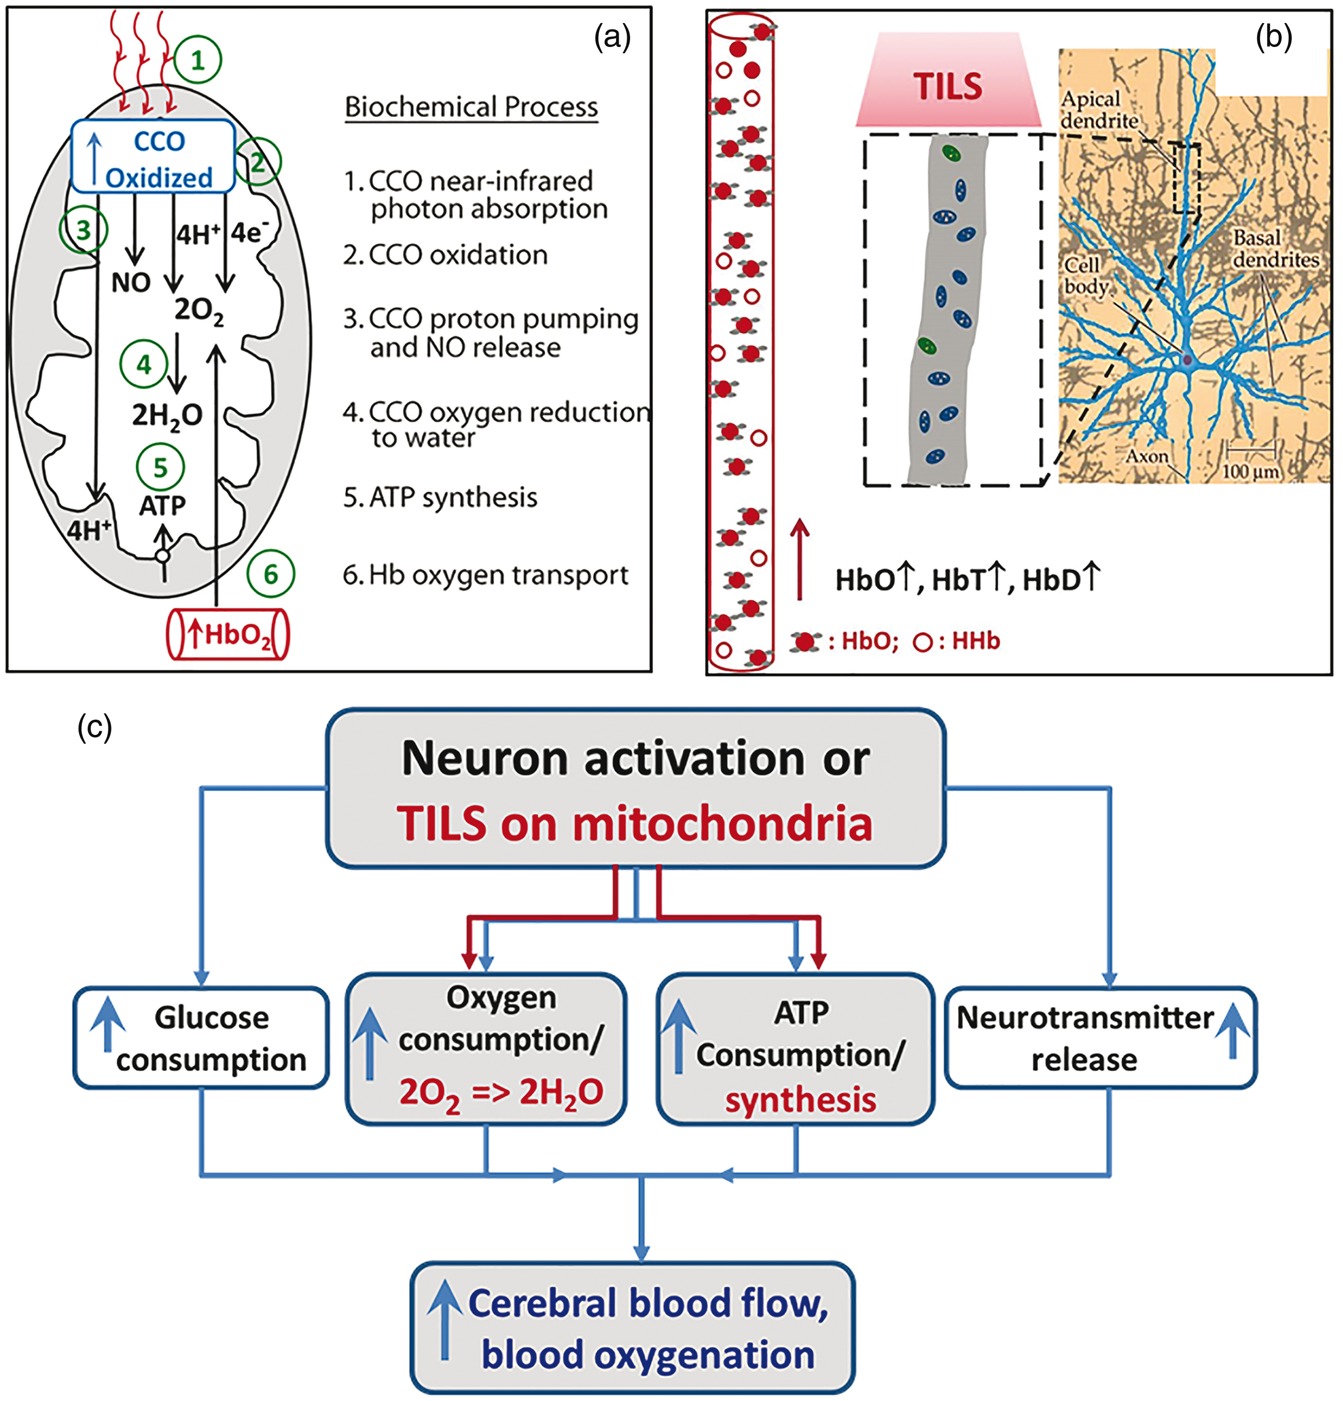
Since TILS delivers light to a stimulated cortical tissue area much larger than a single mitochondrion or larger than a single neuron, a large group of mitochondria receive the laser stimulation, which would lead to significant increases of oxidized CCO concentration and corresponding hemodynamic activities. As a result, significant increases in cerebral HbD, HbT, and HbO would occur in the adjacent region of TILS, as we have detected by our bb-NIRS. Indeed, the observed increases of these hemodynamic parameters reflect TILS-triggered increases of regional CBF, CBV, and cerebral hemoglobin oxygenation (i.e. HbO), as schematically shown in Figure 6(b).
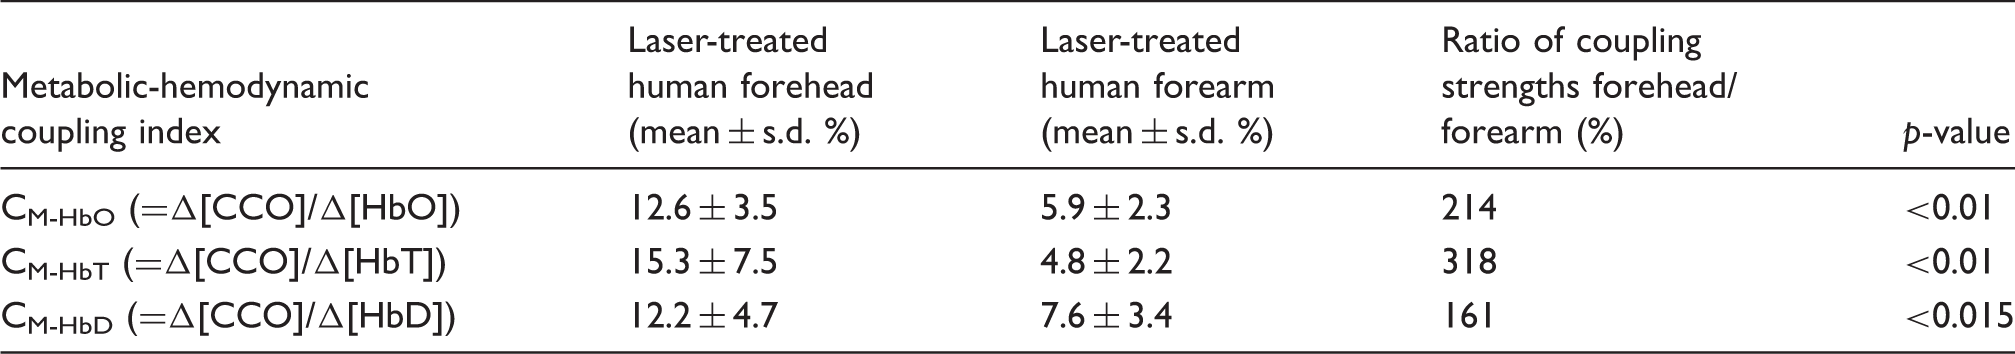
TILS-induced metabolic-hemodynamic coupling
Comparison of laser-induced metabolic-hemodynamic coupling strength determined in the human forehead and forearm.
The large difference in metabolic-hemodynamic coupling strength could be expected because neurons do not store energy and need fast/efficient conversion to extract oxygen from the blood supply. Using the principle of conventional neuro-vascular coupling as an example for comparison, the flow chart written in black in Figure 6(c) demonstrates how neural activation drives consumption increases of glucose, oxygen, and ATP, as well as neurotransmitter release. All of these increased consumptions then lead to increases of cerebral blood flow and blood oxygenation. 41 The metabolic-hemodynamic coupling that we introduced above for explaining the mechanism of TILS can be thought and explained by analogy to neuro-vascular coupling, following the flow chart with red-colored notation in Figure 6(c). Namely, TILS provides CCO photobiomodulation on a large group of mitochondria from the laser-stimulated human forehead. This laser intervention drives CCO-catalyzed oxygen reduction to water and NO release coupled with ATP synthesis, as explained/illustrated in detail by Figure 6(a). Subsequently, cerebral CBF, CBV, and hemoglobin oxygenation are promptly elevated in order to meet the oxygen demand caused by TILS.
Earlier in section “Time courses of TILS-induced Δ[CCO], Δ[HbO], Δ[HHb], Δ[HbT], and Δ[HbD]”, we described our observation of “Δ[CCO]-lead-Δ[HbO]”, which can be explained well by our metabolic-hemodynamic coupling concept, as shown by Figure 6(c). Furthermore, we also observed from Figure 3 that the significant decrease in Δ[HHb] occurred last compared to Δ[CCO] and all other hemodynamic parameters. This observation matches well the results reported in Huettel et al. 41 and Malonek and Grinvald 42 about the interaction between neural electrical activity and the microcirculation, and thus can be explained as follows: In the initial phase of TILS, Δ[HHb] would increase due to the higher consumption and demand of O2 caused by [CCO] up-regulation/oxidation (this is similar to the “initial dip” phase). Since this process should occur fast right after TILS onset, our bb-NIRS system would not be able to catch or record it due to the limited time resolution. Then, under low local O2 conditions, CCO-catalyzed NO release 39 would induce vasodilation and significant increases in both CBF and CBV. This occurred quickly following the onset of TILS and over-supplied oxygenated blood, leading to a large increase of Δ[HbO] but a delayed decrease of Δ[HHb], which was recorded by our bb-NIRS.
Limitations of this study and future work
There are still a few limitations in this study. First, due to the single-channel bb-NIRS system, the readings were taken with a single source-detector (S-D) separation of 3 cm. This large S-D separation enabled a deep photon penetration depth to reach cerebral tissue underneath the skin and skull.20,21 However, in the meantime, the measured optical signals had to go through multiple layers of the subject’s head. In other words, the quantified values of Δ[HbO], Δ[HHb], and Δ[CCO] in our experiments might be contaminated by those from the skin and skull. In future studies, therefore, a two/multiple channel bb-NIRS system with a short S-D separation of 1 cm needs to be implemented; the corresponding 1-cm readings can be used to regress the scalp/skull effect from the cerebral metabolic and hemodynamic response from the 3-cm channel. Second, the temporal resolution of the combined TILS/bb-NIRS protocol is limited to 1 min because of the interleaved design between the laser stimulation and bb-NIRS data acquisition. We are not able to observe any fast response of cerebral tissue to TILS. A possible solution may be to apply a low pass filter at the laser aperture so as to filter out the affecting optical signal within the bb-NIRS wavelength range.
A recent study reported that photobiomodulation by 810-nm and 980-nm lasers operated via different mechanisms of action in the same tissue cultures of adipose cells. 43 It is known that the absorption of CCO peaks around 800 nm and decreases onwards to 1000 nm. 22 It is highly likely that CCO absorbs less light at 1064 nm than at 980 nm. Water is expected to be another common chromophore at both wavelengths, with more absorption at 980 nm. However, many different factors and conditions existed between Wang et al. 43 and our study, such as: in vitro versus in vivo measures, adipose cells versus brain cells, 810 nm and 980 nm vs. 1064 nm lasers, so it is difficult to obtain a fair comparison. Since there is no study done with pure CCO or isolated mitochondria using 1064 nm, further studies are needed by using 810-nm laser/LEDs to repeat our in vivo experiments and examine if similar changes in ΔHbO, ΔHHb, and ΔCCO will occur.
It is known that the NIR absorption peak of CCO is around 800–850 nm, but within this spectral region light scattering is also rather strong. The latter aspect will prevent the NIR light from traveling deep into the brain tissue. At 1064 nm, on the other hand, while light absorption of CCO is reduced compared to that at 810 nm, the light scattering effect is significantly reduced too. It implies that the 1064-nm laser may be able to travel deeper into the cortex through the scalp and skull and provide photobiomodulation. 24 No other in vivo human studies in the literature demonstrated yet that other lower wavelengths, such as 810 nm, have the same effects on CCO. The answer to whether 1064-nm laser is the optimal wavelength for neuromodulation is out of the scope of this paper. Future computer simulations and laboratory experiments are good approaches to provide solid and quantitative answers.
Conclusion
In conclusion, the findings suggest the hypothesis that 1064-nm laser stimulation causes CCO oxidation, and oxidized CCO is the conformation of the enzyme that has the highest activity. We reported for the first time that TILS can induce significant increases of [CCO], and such hemodynamic parameters as [HbO], [HbT], and [HbD] on the human forehead in vivo. Particularly, the treatment effect on [CCO] and [HbO] can last for at least 5 more minutes after TILS stops. Strong linear interplay between Δ[CCO] versus Δ[HbO] and Δ[CCO] versus CBF (in proportion to Δ[HbD]) as well as Δ[CCO] versus CBV (in proportion to Δ[HbT]) were observed for the first time on human forehead during TILS, indicating a hemodynamic response of oxygen supply coupled to the increase of cellular oxygen metabolism induced by transcranial photobiomodulation. This gives a potential biochemical and physiological explanation of the beneficial effects of TILS to a variety of clinical and psychological conditions.4,5,10–18 Furthermore, we introduced TILS-induced metabolic-hemodynamic coupling indices, which allowed us to better understand the interaction between neural electrical activity and the microcirculation or between the TILS-enhanced cerebral metabolism and corresponding blood oxygen supply. Overall, this study provides the first demonstration that TILS causes up-regulation of CCO in the human brain, and contributes important insight into the cerebral physiological mechanisms. The results also reveal a tremendous potential for bb-NIRS as a noninvasive optical means to study in vivo mechanisms of cerebral blood flow and metabolism and perform treatment evaluations of TILS.
Footnotes
Funding
The author(s) disclosed receipt of the following financial support for the research, authorship, and/or publication of this article: This study was supported in part from the University of Texas BRAIN Initiative Seed Funding (#362718) and from the National Institutes of Health grant R03-EB022956 (F. Tian). Dr Gonzalez-Lima reported receiving support from an institutional research fellowship from the College of Liberal Arts of the University of Texas at Austin. Dr Gonzalez-Lima holds the George I. Sanchez Centennial Endowed Professorship in Liberal Arts and Sciences.
Declaration of conflicting interests
The author(s) declared no potential conflicts of interest with respect to the research, authorship, and/or publication of this article.
Authors’ contributions
XW performed the experiment, developed data analysis algorithms, analyzed the data, and prepared/wrote the manuscript. DDR and SN assisted the experimental preparation, subject recruitment, and data acquisition. FT designed the original experiment, discussed, and interpreted the results with XW. Furthermore, DWB participated data interpretation and discussion as well as diagram preparation for the manuscript. GL initiated the study with HL, discussed and interpreted the results, and participated in manuscript revision. HL initiated and supervised the study, discussed and interpreted the results, as well as reviewed and revised the manuscript.
References
Supplementary Material
Please find the following supplemental material available below.
For Open Access articles published under a Creative Commons License, all supplemental material carries the same license as the article it is associated with.
For non-Open Access articles published, all supplemental material carries a non-exclusive license, and permission requests for re-use of supplemental material or any part of supplemental material shall be sent directly to the copyright owner as specified in the copyright notice associated with the article.