
Abstract
Cerebral ischemia has been clearly demonstrated after traumatic brain injury (TBI); however, neuroprotective therapies have not focused on improvement of the cerebral microcirculation. Blood soluble drag-reducing polymers (DRP), prepared from high molecular weight polyethylene oxide, target impaired microvascular perfusion by altering the rheological properties of blood and, until our recent reports, has not been applied to the brain. We hypothesized that DRP improve cerebral microcirculation and oxygenation after TBI. DRP were studied in healthy and traumatized rat brains and compared to saline controls. Using in-vivo two-photon laser scanning microscopy over the parietal cortex, we showed that after TBI, nanomolar concentrations of intravascular DRP significantly enhanced microvascular perfusion and tissue oxygenation in peri-contusional areas, preserved blood–brain barrier integrity and protected neurons. The mechanisms of DRP effects were attributable to reduction of the near-vessel wall cell-free layer which increased near-wall blood flow velocity, microcirculatory volume flow, and number of erythrocytes entering capillaries, thereby reducing capillary stasis and tissue hypoxia as reflected by a reduction in NADH. Our results indicate that early reduction in CBF after TBI is mainly due to ischemia; however, metabolic depression of contused tissue could be also involved.
Keywords
Introduction
Traumatic brain injury (TBI) is a major cause of death and long-term disability contributing to 30% of all injury-related deaths. 1 The primary injury is usually followed by secondary complications resulting from contusion, low cerebral blood flow (CBF), brain edema, blood–brain barrier (BBB) disruption, hemorrhage, and reduced cerebral metabolic rate for oxygen (CMRO2).2–4 Whether the reduction in CMRO2 is due to ischemia, and thereby inadequate oxygen delivery, or due to an inability to utilize the oxygen delivered (depressed metabolism), and thus reduced oxygen demand, is debated.5,6 However, early neuronal damage following TBI is believed to stem from the contusion and ischemic cascade.7,8 Post traumatic CBF reduction leads to oxygen and glucose deprivation, reduced metabolism and energy depletion resulting in a rapid expansion of neuronal death.9–11
Delayed secondary injury which may persist for days, is the primary target in neuroprotection.12,13 Unfortunately, all neuroprotective therapies for TBI, succeeding in pre-clinical studies, have failed in clinical trials. 14 None of the therapies have attempted direct rheological modulation of the cerebral microcirculation to remedy ischemia after TBI.15,16 However, it is known that outcome in patients who proceed to develop hyperemia early after TBI was better than in those with hypoperfusion. 16 In animals, contusions occur in regions with severe reductions in CBF as early as 30 minutes after injury, 17 and therapies increasing CBF may be effective. A few studies have targeted posttraumatic hypoperfusion by vasodilation through various agents; however, those tested were categorically clinically ineffective, 14 probably because they are pharmacological and depend on receptors that likely are altered after TBI.
Our novel therapeutic approach is based on rheological modulation of blood flow to enhance cerebral microvascular perfusion and, hence, oxygen delivery to tissue using nanomolar concentrations of biologically inert blood soluble, non-toxic macromolecules – drag-reducing polymers (DRP). Intravenous DRP were shown to significantly improve hemodynamics and survival in animal models of ischemic myocardium, 18 ischemic limb, 19 and hemorrhagic shock. 20 However, the effects of DRP have not been explored in brain circulation except for qualitative investigations performed over 30 years ago21,22 and our first report on the use of DRP in the cerebral microcirculation in the hypertensive brain. 23
In this work, our aim was to examine the effects of intravenous DRP on the progressive changes in cerebral microcirculation, oxygenation, metabolism, and neuronal survival after TBI using in vivo two-photon laser scanning microscopy (2PLSM), and to analyze mechanisms of the DRP phenomena in brain circulation. In this work, we used a fluid percussion injury (FPI) model of TBI to show that DRP alleviates capillary stasis in peri-lesion regions of traumatized rat brain.
Materials and methods
Animals and surgical procedures
All procedures were performed as previously described in our studies,23–25 as detailed in Online Supplement Methods and briefly described here. The protocol #101191 was approved by the Institutional Animal Care and Use Committee of the University of New Mexico and the studies were conducted according to the NIH Guide for the Care and Use of Laboratory Animals and the ARRIVE guidelines (Animal Research: Reporting in Vivo Experiments) for animal experiments report. Briefly Sprague-Dawley male rats (n=40, 300–350 g, Harlan Laboratories, Indianapolis, IN) were mechanically ventilated on 2% isoflurane/29% oxygen/69% nitrous oxide (Harvard Apparatus, Holliston, MA). Femoral venous and arterial catheters (PE 50) were inserted for fluid and drug administration, arterial pressure monitoring and blood sampling, respectively. A catheter (PE 50) inserted into the cisterna magna through the atlanto-occipital membrane was used to monitor intracranial pressure (ICP). For imaging and TBI, a craniotomy was made over the left parietal cortex. Brain and body temperatures were maintained at 37℃ and 37.5℃, respectively.
Experimental paradigm
The animals were randomly divided into four groups of 10 rats each: (1) TBI-DRP (DRP solution injected i.v.); (2) TBI-Saline (equal volume of saline injected i.v.); (3) Sham-DRP (DRP); and (4) Sham-Saline (saline).
After baseline 2PLSM imaging, TBI or Sham was induced and followed by reimaging. Within 30 min after TBI, DRP or saline was slowly injected (∼60 s) and imaging continued for 4 h at 30-min intervals. After the 2PLSM imaging, the animals were moved to the magnetic resonance imaging (MRI) scanner (4.7T Bruker Biospin; Billerica, MA, USA) and after the MRI session underwent transcardiac perfusion with phosphate-buffered saline (PBS) followed 4% paraformaldehyde (PFA) in PBS. Brains were harvested, postfixed in 4% PFA followed by cryoprotection in 30% sucrose, and frozen for Fluoro Jade C staining. Monitored physiologic variables were: microvascular diameters, blood flow velocity and flow volume (capillaries and arterioles); tissue oxygenation; and BBB permeability. Arterial blood was sampled (0.1 ml) hourly and blood gases, pH, hematocrit, glucose, and electrolytes were measured by an iSTAT point-of-care device with a CG8 + cartridge (ABAXIS, Union City, CA) and maintained within normal limits. Variations in blood gases were adjusted by manipulation of the rate and volume of the ventilator. Base deficits less than −5.0 mEq/L were corrected by slow i.v. infusion of 8.4% sodium bicarbonate. Arterial and intracranial pressures were continuously monitored using Biopac system (Goleta, CA).
TBI
TBI was induced by well-characterized FPI.26,27 To induce moderate extradural FPI, rats were subjected to a fluid pressure pulse of 1.5 atmospheres at 50 ms duration, sham animals were subjected to craniotomy only. 23
DRP preparation and use
Polyethylene oxide (PEO, MW ∼4000 kDa, Sigma-Aldrich) was dissolved in saline to 0.1% (1000 ppm) concentration and dialyzed overnight using a 100 kDa cutoff membrane. Before injection, the PEO solution was diluted with saline to 50 ppm and slowly rocked for ∼2 hours. 18 The solution was sterilized using a 0.22 μm filter and i.v. injected over 2 min to achieve a final blood concentration of 2 μg/ml. The volume of DRP solution (ml) to be injected was determined by: ([rat weight (grams) × 0.07]/50 ppm) × 2.20,28
In vivo 2PLSM
2PLSM was used as we previously described.23–25 Imaging was done using the Prairie View Ultima multiphoton system with water-immersion LUMPlan 20×/0.50W objective. Excitation (740 nm) was provided by a Millennia Prime 10 W diode laser source pumping a Tsunami Ti: sapphire laser (Spectra-Physics, Mountain View, CA). Imaging was performed at stereotactic coordinates 1.5 mm posterior from coronal suture and 1.5 mm lateral from sagittal suture, through an optical window over the peri-contusional area which according to our MRI and histology studies corresponded to the peri-contusional region after TBI.
Blood plasma was labeled by i.v. injection of fluorescein isothiocyanate dextran (MW=2000 kDa) in physiological saline (5% wt./vol). All microvessels in the imaging volume (500 × 500×300 µm = 0.075 mm3) were scanned at each study point, measuring the diameter and blood flow velocity in each vessel. Fluorescein fluorescence was band pass filtered at 510–550 nm (Channel 2), and nicotinamide adenine dinucleotide (NADH) autofluorescence, reflecting tissue oxygenation, was band pass filtered at 425–475 nm (Channel 1). Fluorescein extravasation was used for evaluation of BBB permeability. Imaging data processing and analysis were done using NIH ImageJ.
RBC flow velocities through microvessels were detected by line-scans, i.e. repetitive scans along the central axis of a microvessel. A line scan through a microvessel led to a sequence of alternating bright and dark diagonal bands in a space-time image corresponding to labeled fluorescent plasma and unlabeled dark RBC, with the slope of the stripes inversely proportional to flow velocity. Arteriolar RBC flow velocity gradient profiles were obtained by a series of line scans of flow velocity in 5 μm steps from the vessel centerline to the vessel wall.
Evaluation of microvessels density and vascular diameter
Three-dimensional anatomy of the vasculature in the region of interest was reconstructed from Z-series of two-dimensional (planar) scans (500 × 500 µm) obtained in 10 µm steps from brain surface to 300 µm in depth at each study point. In offline analyses, the microvessels diameters were measured to differentiate capillaries from other microvessels and density was quantified assuming that one capillary is a microvessel from bifurcation to bifurcation. Capillary selection was based on tortuosity, degree of branching, diameters 3–8 µm, with a mean ∼5 µm, and single file RBC flow velocity <1 mm/s. Pial, penetrating, and precapillary arterioles were differentiated from other vessels by morphology, bright NADH signal of smooth muscles layer in tunica media, RBC flow velocity and range in diameter from 11 to 100 µm.
Arteriolar blood volume flow
A blood flow profile was presented as a sum of circular 3D paraboloid and a bottom cylinder (Figure 2(a)), which was calculated using the following algorithm:
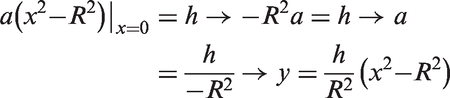
A general parabola equation:
Volume of the bottom cylinder:
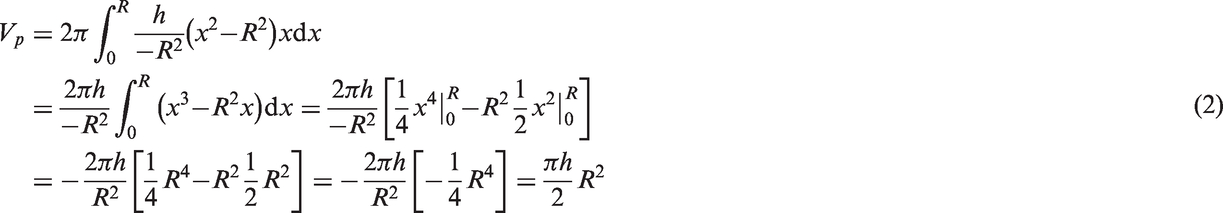
From that, the total volume of the circular paraboloid and the base (or bottom) cylinder, which is equal to the arteriolar flow rate

MRI
MRI was performed on 4.7 Tesla (Bruker Biospin; Billerica, MA, USA), equipped with a 40-cm bore, a 660 mT/m (rise time within 120 µs) gradient and shim systems. Signal transmission and reception were done with a small-bore linear RF coil (Inner Diameter = 72 mm) and a single tuned surface coil (RAPID Biomedical, Rimpar, Germany). The rats were kept intubated under the same anesthesia as used during 2PLSM imaging. All data processing was performed using in-house developed software written in 64-bitMATLAB (MathWorks, Natick, Massachusetts) running on a UNIX machine.
Anatomical T2-weighted images were acquired with a fast spin-echo sequence (RARE) (TR/TE = 5000 ms/56 ms, FOV=4 cm × 4 cm, slice thickness = 1 mm, interslice distance = 1.1 mm, number of slice = 12, matrix = 256 × 256, number of average = 3). Multi-slice, multi-shot, diffusion-weighted echo-planar imaging (EPI) (TR/TE = 3800 ms/38 ms; b-values = 600 and 1900 s/mm 2 in 30 directions; FOV = 4 cm × 4 cm, slice thickness = 1 mm, matrix = 256 × 256) was performed to assess tissue architecture.
CBF was measured using arterial spin labeling (ASL). The sequence: Flow-sensitive Alternating Inversion Recovery Rapid Acquisition with Relaxation Enhancement (FAIR-RARE) was used to implement ASL with parameters: TE/TR = 46 ms/16,000 ms, FOV = 4 cm × 4 cm, slice thickness=1 mm, number of slice =1, matrix = 128 × 128. Perfusion map was calculated using ASL Perfusion Processing macro in ParaVision 5.1 (Bruker Biospin MRI GmbH). Perfusion associated with specific areas of the brain was determined using interpolation method and corresponding T2-weighted MRI scans.
Fluoro Jade C staining
Coronal sections (20 μm) were obtained on a freezing sliding microtome, mounted on slides, and stained with Fluoro-Jade C for dying/degenerating neurons using standard protocol. Every 20th brain section was chosen for cell counts using uniform random sampling. Images were taken using 10 × objective of an Olympus TH 4-100 inverted fluorescent microscope and number of dead neurons in the contusion and peri-contusion cortex were counted by the investigator blind to the treatment groups. Total positive cell numbers were counted for the volume of 45 mm3 (5 × 5×1.8 mm XYZ) starting from the brain surface and centered to the injury.
Statistical analyses
The statistical analysis was done by independent Student's t-test or Kolmogorov–Smirnov tests where appropriate. Differences between groups and between time points were determined using two-way repeated measures (ANOVA) for multiple comparisons and post hoc testing using the Mann–Whitney U-test using GraphPad Prism (GraphPad Software, Inc., La Jolla, CA). Statistical significance level was set at P < 0.05. Data are presented as mean ± SEM or as box and whiskers plots.
Results
Physiological parameters
Arterial pressure, blood gases, electrolytes, hematocrit and pH; rectal and cranial temperatures were within normal limits and with no difference between the groups. However, in TBI-saline group, there was an increasing trend for creatinine and lactate concentrations and blood plasma acidosis during the time of the experiment that was not so prominent in TBI-DRP group. Blood glucose levels were similarly elevated in all rats likely due to the stress of surgery and anesthesia as in our previous reports.23–25
TBI
FPI resulted in a transient fall (∼70 ms) in mean arterial pressure to ∼80% of baseline (73.4 ± 8.4 mmHg), followed by a slow recovery to 100% within 11 ± 3.6 min (94.2 ± 9.6 mmHg). ICP was unchanged and remained at 10.1 ± 4.8 mmHg throughout the study. Animals failing to recover arterial pressure within 15 min after TBI or showed a decrease in hematocrit below 60% of the baseline were excluded from the study.
Blood flow through cortical arterioles
Red blood cells (RBC) flow velocity profiles in cortical arterioles (56.1 ± 24.6 µm of diameter, 10–12 per rat) were obtained by a series of line scans of flow velocity in 5 μm steps from the vessel centerline to the vessel wall (Figure 1(a)). Baseline 2PLSM scans revealed steep arteriolar RBC flow velocity gradient profiles with a low near-wall velocity of 14.7 ± 4.8 mm/s (Figure 1(b)) and a high centerline flow velocity of 37.2 ± 4.3 mm/s.
DRP-induced elevation of the near-wall blood flow velocity increases blood flow rate in arterioles. (a) 2PLSM micrograph (maximum intensity projection of 10 planar scans acquired in 10 µm steps, starting at 50 µm from the brain surface) of rat cortex microvasculature with line scans settings for arteriolar blood flow velocity profiling (black stripes). (b) A representative baseline RBC flow velocity profile form the cortical arterioles in the sham group created by measuring of arteriolar blood flow velocity at different distances from the midline shows sharp decrease of velocity from the centerline to the near-vessel wall. (c) DRP significantly increased near-wall velocity, and thus a total flow rate (Δ shows a difference between center and near-wall flow velocities in mm/s, ##P < 0.01 from baseline). (d) TBI decreased RBC flow velocity across the vessel lumen with the similar gradient between the centerline and near-vessel wall. (e) DRP significantly increased near-wall velocity increasing total flow rate (¤P < 0.05 from post-TBI). Data are presented as mean ± SEM, #P < 0.05 and ##P < 0.01 from a baseline, *P < 0.05 from saline, n=10 rats/group, 10–12 arterioles/rat. DRP cause an increase in the near-wall blood flow velocity, and, as a result, the volume of blood flow in arterioles. DRP cause an increase in blood flow volume in arterioles as a result of the near-wall blood flow velocity enhancement. (a) Schematic model of blood flow profile in arteriole used for calculation of blood flow volume expressed as a sum of total volumes of the circular paraboloid and the base (or bottom) cylinder, which is equal to the arteriolar flow rate: 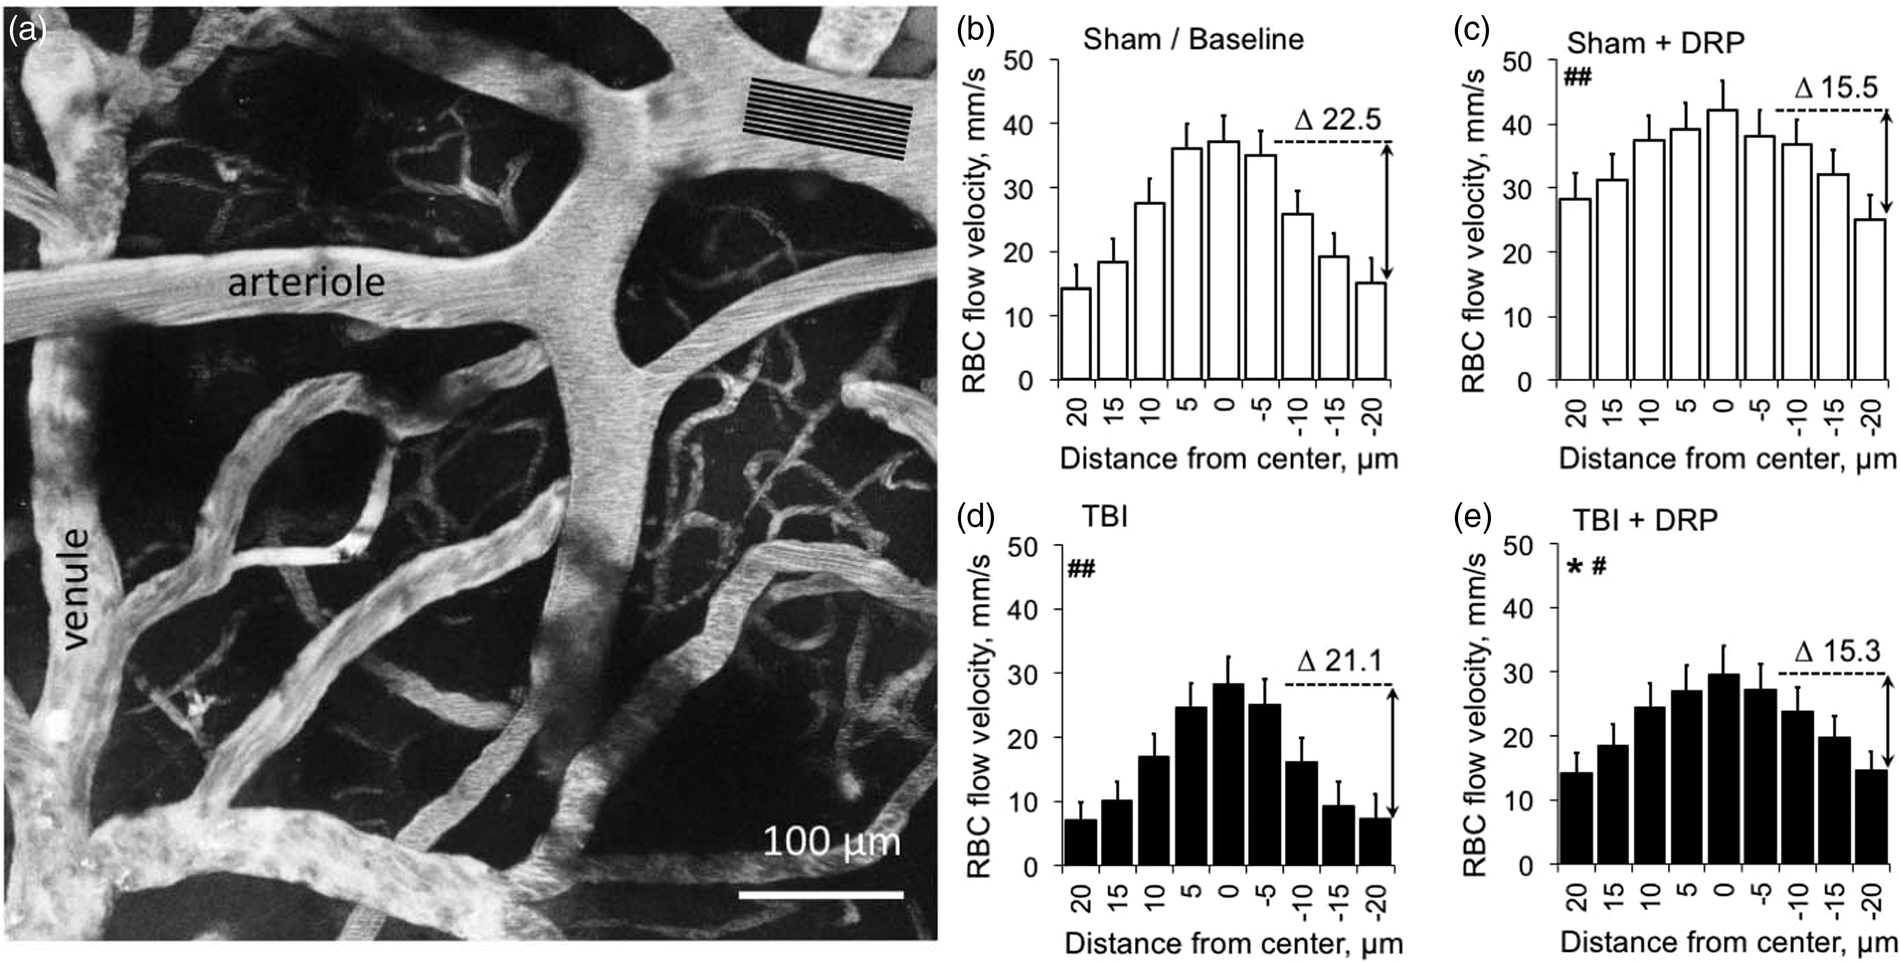
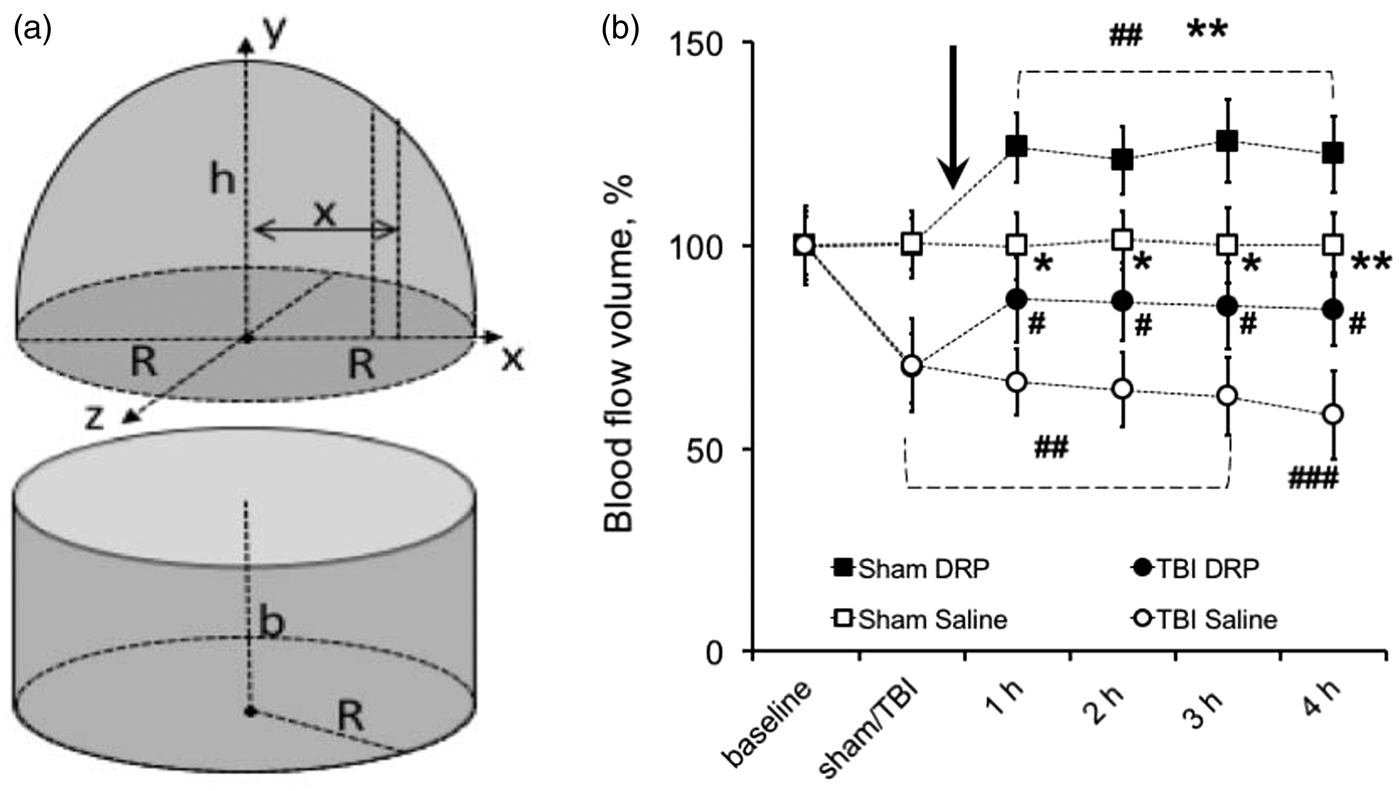
TBI decreased blood flow velocity across the entire vessel diameter, but the gradient (Δ) between centerline and near-wall flow velocities remained the same (Figure 1(d)). This resulted in a significant decrease in blood volume flow through the arterioles to 70.5 ± 11.6% and 69.7 ± 8.7% from baseline in TBI-saline and TBI-DRP groups, respectively, as was calculated using the equation # 3 (Figure 2(a) and (b), Supplement Table 1, P < 0.01). The i.v. injection of DRP after TBI dramatically increased near-wall flow velocity from 7.2 ± 2.6 (post-TBI) to 14.4 ± 33 mm/s (Figure 1(e), Supplement Table 1) resulting in a significant increase in CBF volume flow to 86.6 ± 10.5% of baseline that was maintained throughout the study (Figure 2(b), P < 0.05 to post TBI). Saline did not affect neither the blood flow velocity profile, nor blood flow volume, which gradually decreased to 58.1 ± 10.9% of baseline over four hours (Figure 2(b)).
In sham animals, DRP slightly increased centerline flow velocity, and, more prominently, near-wall blood flow velocity (Figure 1(c)) resulting in a significant increase in total blood volume flow to 124.0 ± 8.4% of baseline, which remained at nearly the same level over 4 h (Figure 2(b), P < 0.01 from baseline). In the saline-treated sham group, blood volume flow was unchanged throughout the study (Figure 2(b)).
Cortical capillary perfusion
The number of perfused capillaries at baseline ranged from 203.7 ± 23.5 to 204.1 ± 18.8 per volume of 0.075 mm3 without differences between sham DRP and saline groups (Figure 3(a) and (b), Supplement Table 1). TBI compromised capillary blood flow and decreased the number of perfused capillaries in the peri-contusion zone to 138.8 ± 20.6 and 136.8 ± 23.5 in TBI-saline and TBI-DRP groups, respectively (Figure 3(b), P < 0.01), reflecting a 34% decrease in the number of perfused capillaries. DRP restored capillary perfusion increasing the number of functioning capillaries to 173.5 ± 26.4 (P < 0.05 compared to the saline group) followed by a gradual decrease to 150.0 ± 32.3 after 4 h (Figure 3(b)). Saline had no effect on the number of perfused capillaries, which decreased over time to 95.9 ± 29.4 per 0.075 mm3 (Figure 3(b)).
Enhancement of capillary perfusion by DRP. (a) Left: 2PLSM micrograph of a region from which microvascular flow was recorded (maximum intensity projection of five planar scans acquired with 10 µm steps, starting at 50 µm from brain surface). Right: Line-scan data for blood flow velocities in the outlined capillary (black line) in the left panel indicating the baseline RBC flow velocity (top scan) and its increase after DRP injection (bottom scan). The slope of the stripes inversely reflects RBC flow velocity. (b) Graph showing a significant reduction in the number of functioning capillaries after TBI in the imaged volume and re-recruitment of capillaries after DRP injection (mean ± SEM, n=10 rats / group, *P < 0.05 from saline, #P < 0.05, ##P < 0.01, and ###P < 0.001 from a baseline, arrow points the time of DRP or saline injections). (c) Time series plots showing reduction of average RBC flow velocity in capillaries after TBI and an increase after DRP injection in both, TBI and sham groups (mean ± SEM, *P < 0.05 and **P < 0.01 from saline, #P < 0.05, ##P < 0.01, and ###P < 0.001 from a baseline, n=10 rats/group, ∼200 capillaries/rat, arrow points the time of DRP or saline injections). (d) A representative frequency histograms and Gaussian fits created for a one rat showing increased RBC flow velocity in capillaries (3–8 µm) in the cortex after DRP injection comparing to the baseline as reflected by shifting of flow velocity distribution to the right (arrow, #P < 0.05 from a baseline, n=20 rats).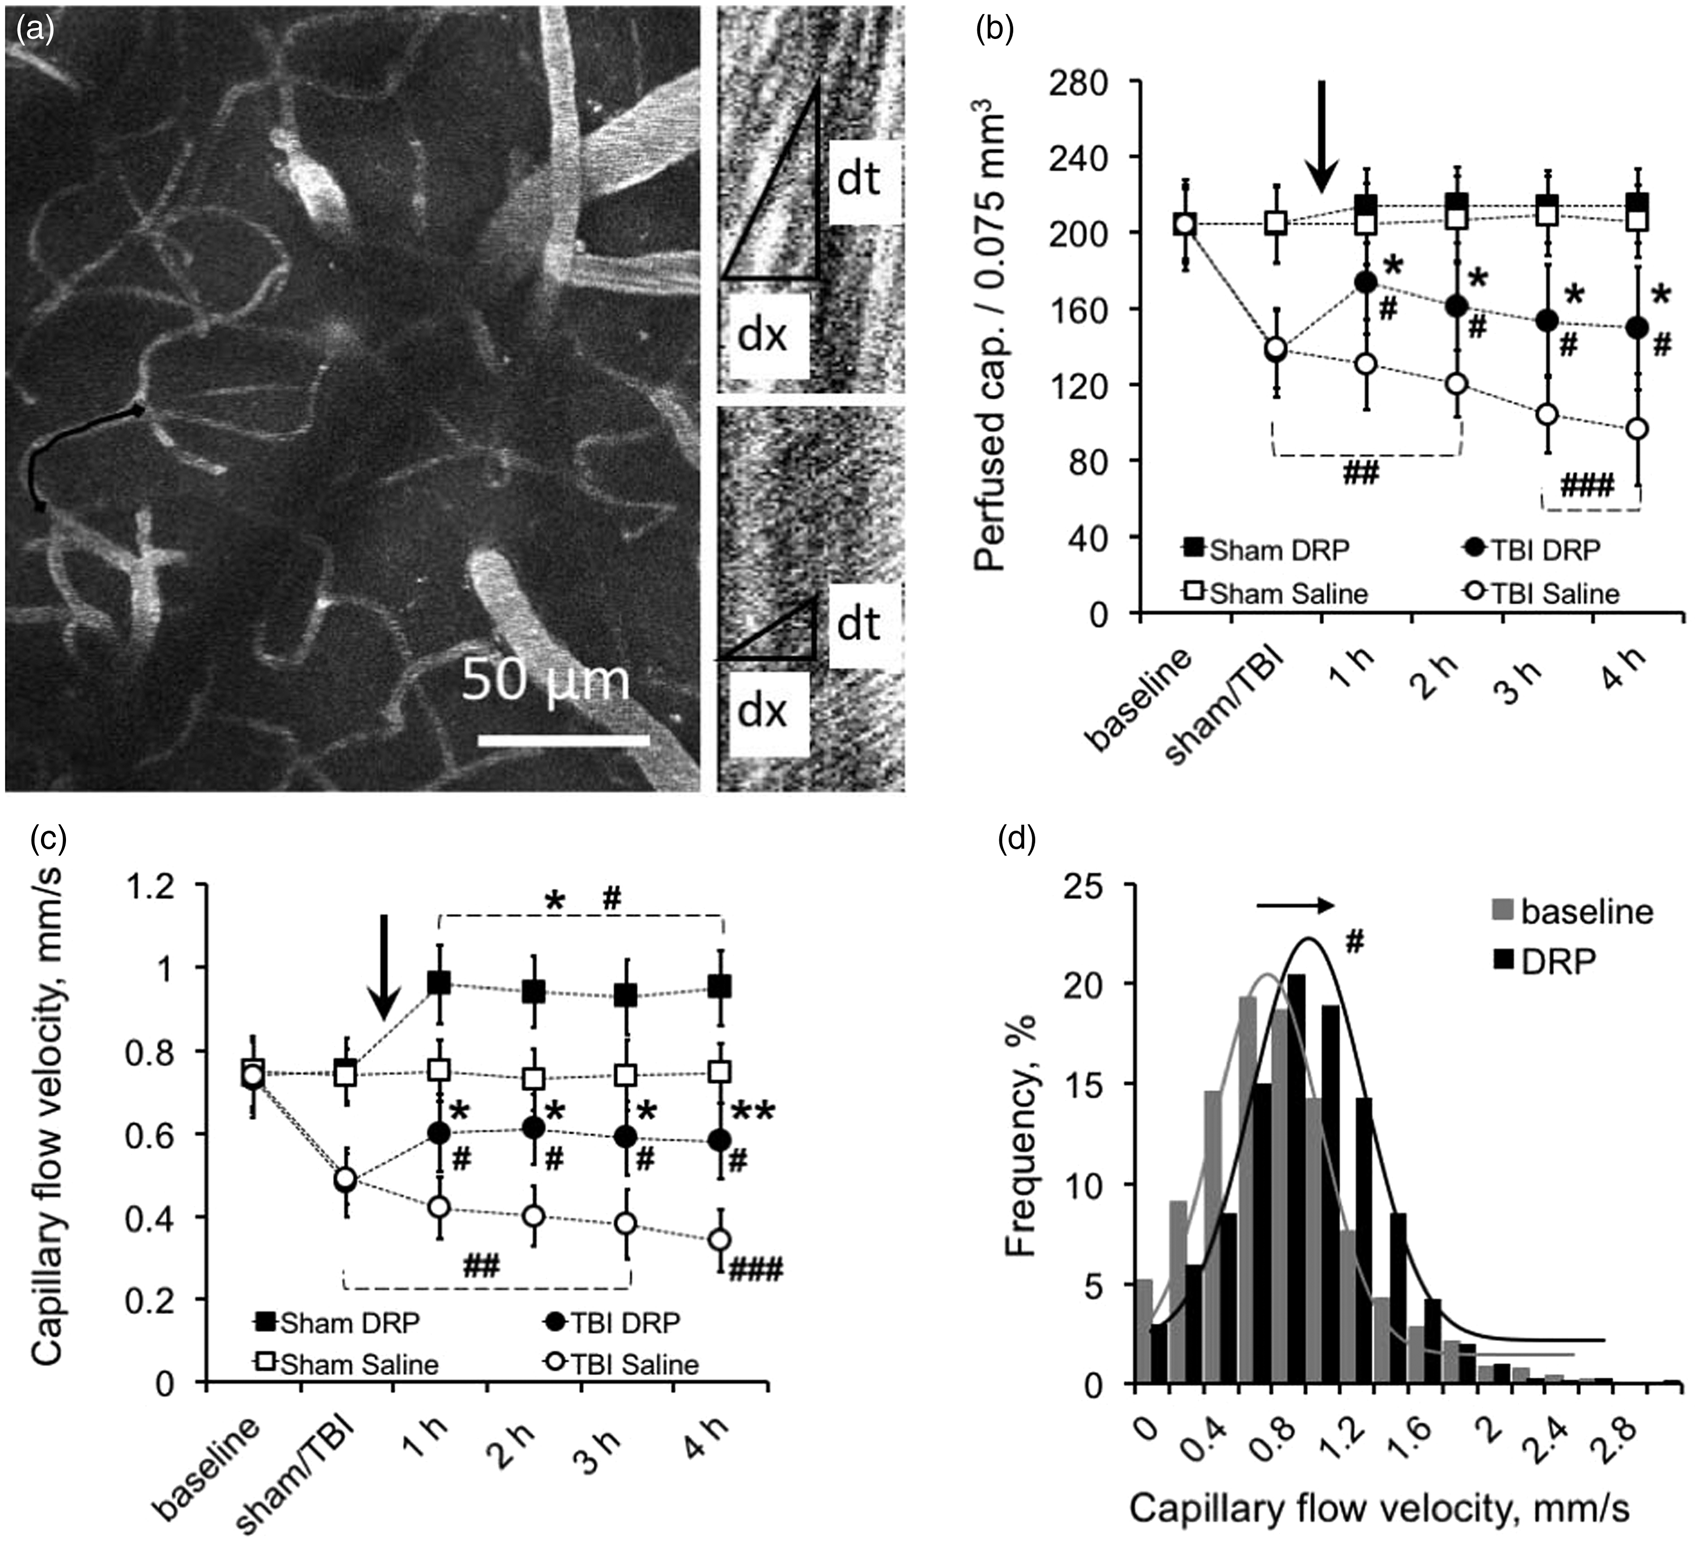
In sham rats, the number of perfused capillaries was unchanged from baseline over the 4 h of monitoring. However, after DRP injection, we observed an apparent but non-significant (P = 0.11) increase in the number of perfused capillaries by 4.8% (Figure 3(b)).
RBC flow velocities were measured in each individual capillary in an imaging volume by line scans (Figure 3(a), Supplement Table 1) and average flow velocity for all capillaries was calculated and was within a range of 0.74 ± 0.09 mm/s at a baseline. TBI caused a dramatic decrease in RBC flow velocity to 0.49 ± 0.06 and 0.48 ± 0.08 mm/s in TBI-saline and TBI-DRP groups, respectively (Figure 3(c), P < 0.01 from a baseline). The injection of DRP increased RBC flow velocity in capillaries to 0.60 ± 0.09 mm/s, which remained at this level throughout the monitoring period (Figure 3(c), P < 0.05 from saline group). In the TBI-saline group, RBC flow velocity further decreased to 0.34 ± 0.07 mm/s at 4 h after TBI (Figure 3(c)).
In sham-saline rats, capillary RBC flow velocity remained unchanged with time (Figure 3(c)). Interestingly, DRP increased flow velocity in capillaries from 0.72 ± 0.09 to 0.96 ± 0.09 mm/s which remained at this level for at least 4 h (Figure 3(c), P < 0.05 from baseline). In both DRP-treated groups, RBC flow velocity increased in each capillary as reflected by a frequency shift toward higher flow velocities on the frequency histograms with Gaussian fits (Figure 3(d)).
Vascular tone
Brain injury caused progressive, but statistically insignificant constriction of microvessels in TBI-saline group probably due to vasospasm development (Figure 4(c)). In TBI-DRP group, injection of DRP partially dilated some vessels; however, the effect was also insignificant (Figure 4(d)). The microvascular tone (diameter of microvessels) was unchanged in the sham-saline group (Figure 4(a)). DRP injection in sham-DRP group caused insignificant bi-directional change of the diameters of microvessels, i.e. diameter decreased in some vessels and increased in other but overall average of all diameters was unchanged (Figure 4(b)).
Effects of TBI and DRP on arteriolar tone. Box and whiskers time plots showing no changes in diameters of arterioles at a baseline (a) and insignificant redistribution after DRP injection (b). (c) TBI caused trend to a progressive constriction of the arterioles attenuated by DRP injection in TBI-DRP group (d) Data expressed in box-whiskers plots where median is centerline, mean is +, Q1 and Q3 are top and bottom of boxes and whiskers are minimums and maximums, n=10 rats/group.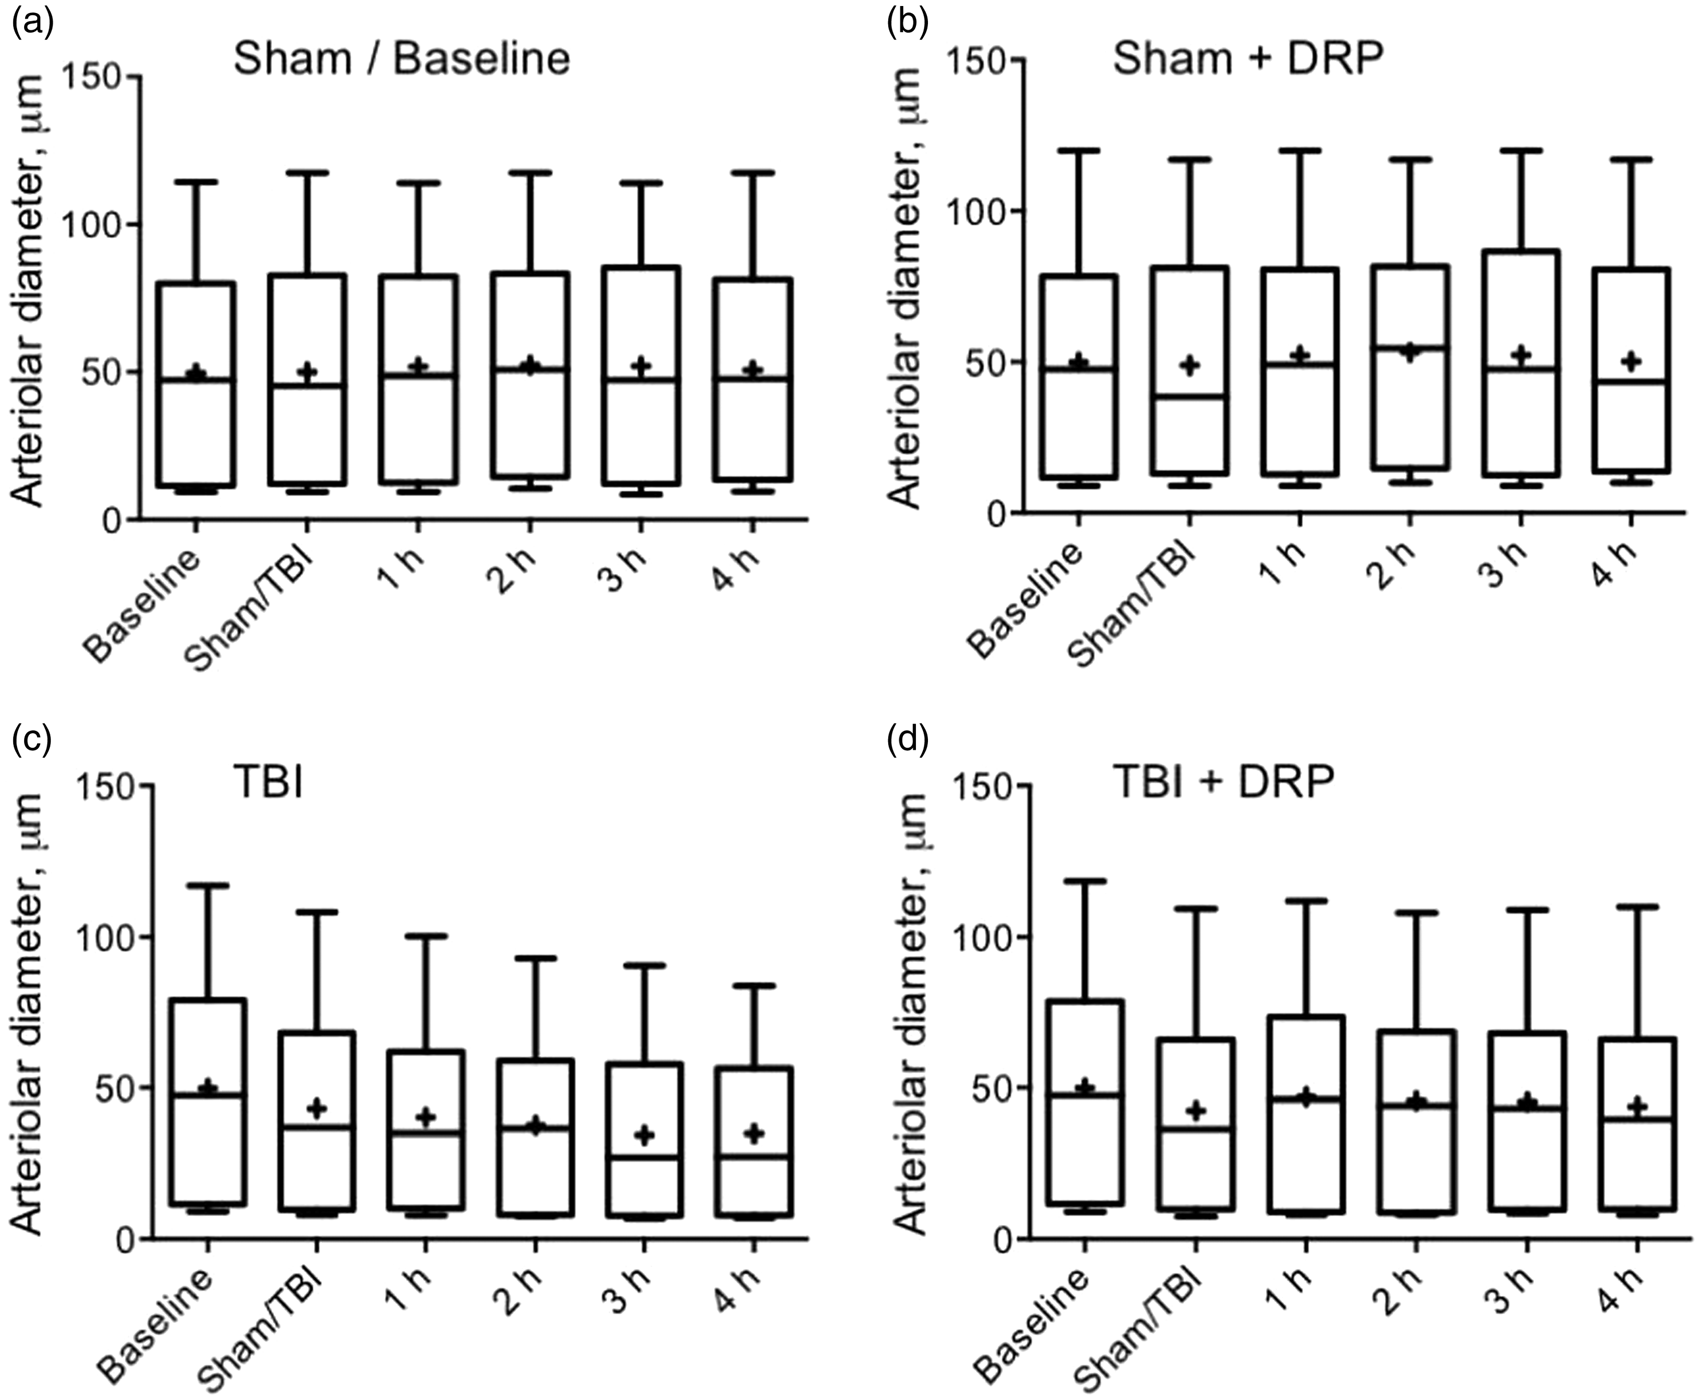
Cortical tissue oxygenation
The coenzyme NADH is the primary electron donor in oxidative phosphorylation and its redox state reflects mitochondrial activity, which depends on tissue oxygenation. NADH is fluorescent, while oxidized NAD + is not. Therefore, NADH fluorescence is a sensitive indicator of cellular oxidation
29
and is used to evaluate tissue oxygenation/level of hypoxia where an increase in NADH reflects a relative decrease in mitochondrial oxidative phosphorylation and oxygenation. At baseline, NADH autofluorescence was evenly distributed in the cortex with a gradual increase in intensity with distance from the microvessels reflecting oxygen gradient as previously reported (Figure 5(a), Supplement Table 1).
30
Microvascular flow impairment after TBI led to tissue hypoxia as reflected by increased NADH autofluorescence to 143.0 ± 6.1% and 141.8 ± 6.3% above baseline (P < 0.001) in TBI-saline and TBI-DRP groups, respectively (Figure 5(b) and (c)). Improved microvascular flow in the DRP-treated group reduced tissue hypoxia as reflected by a decrease in NADH autofluorescence to 126.4 ± 6.0% after DRP injection (P < 0.05 compared to saline group) and stabilized at this level 129.8 ± 5.9% (Figure 5(c)). In the saline-treated group, tissue hypoxia progressed over time and increased to 160.5 ± 8.3% at 4 h after injury (Figure 5(c)).
DRP increase tissue oxygenation and attenuate blood-brain barrier (BBB) degradation. (a) In-vivo 2PLSM images of NADH autofluorescence in a rat cortex at baseline and (b) after TBI with regions of interest representing increased NADH autofluorescence, reflecting reduced tissue oxygenation. (c) Time series plot showing that DRP injection decreased progressive cortical tissue hypoxia in TBI group, and increased tissue oxygenation in sham group following DRP injection (mean ± SEM, n=10 rats/group, *P < 0.05, **P < 0.01, and *P < 0.001 from saline, #P < 0.05, ##P < 0.01, and ###P < 0.001 from a baseline, ¤ P < 0.05 from a previous time point within the group, data presented as % of baseline, arrow points the time of DRP or saline injections). Representative micrograph of non-fluorescent brain parenchyma over bright vessels filled with fluorescein at intact BBB. (e) Micrograph of the same area with fluorescent brain parenchyma due to fluorescein dextran extravasation reflecting BBB breakdown in peri-lesion area 4 h after traumatic brain injury. The squares on the micrographs show tissue fluorescence at baseline (d) and after trauma (e) with extravasation of dye into the tissue. (f) Graph illustrating that DRP injection mitigates further BBB degradation after traumatic brain injury and does not induce changes in sham groups (mean ± SEM, n = 10 rats/group, *P < 0.05 and **P < 0.01 from saline, ###P < 0.001 from a baseline, ¤P < 0.05 from a previous time point within the group; tissue fluorescence is normalized to baseline; arrow points the time of DRP or saline injections).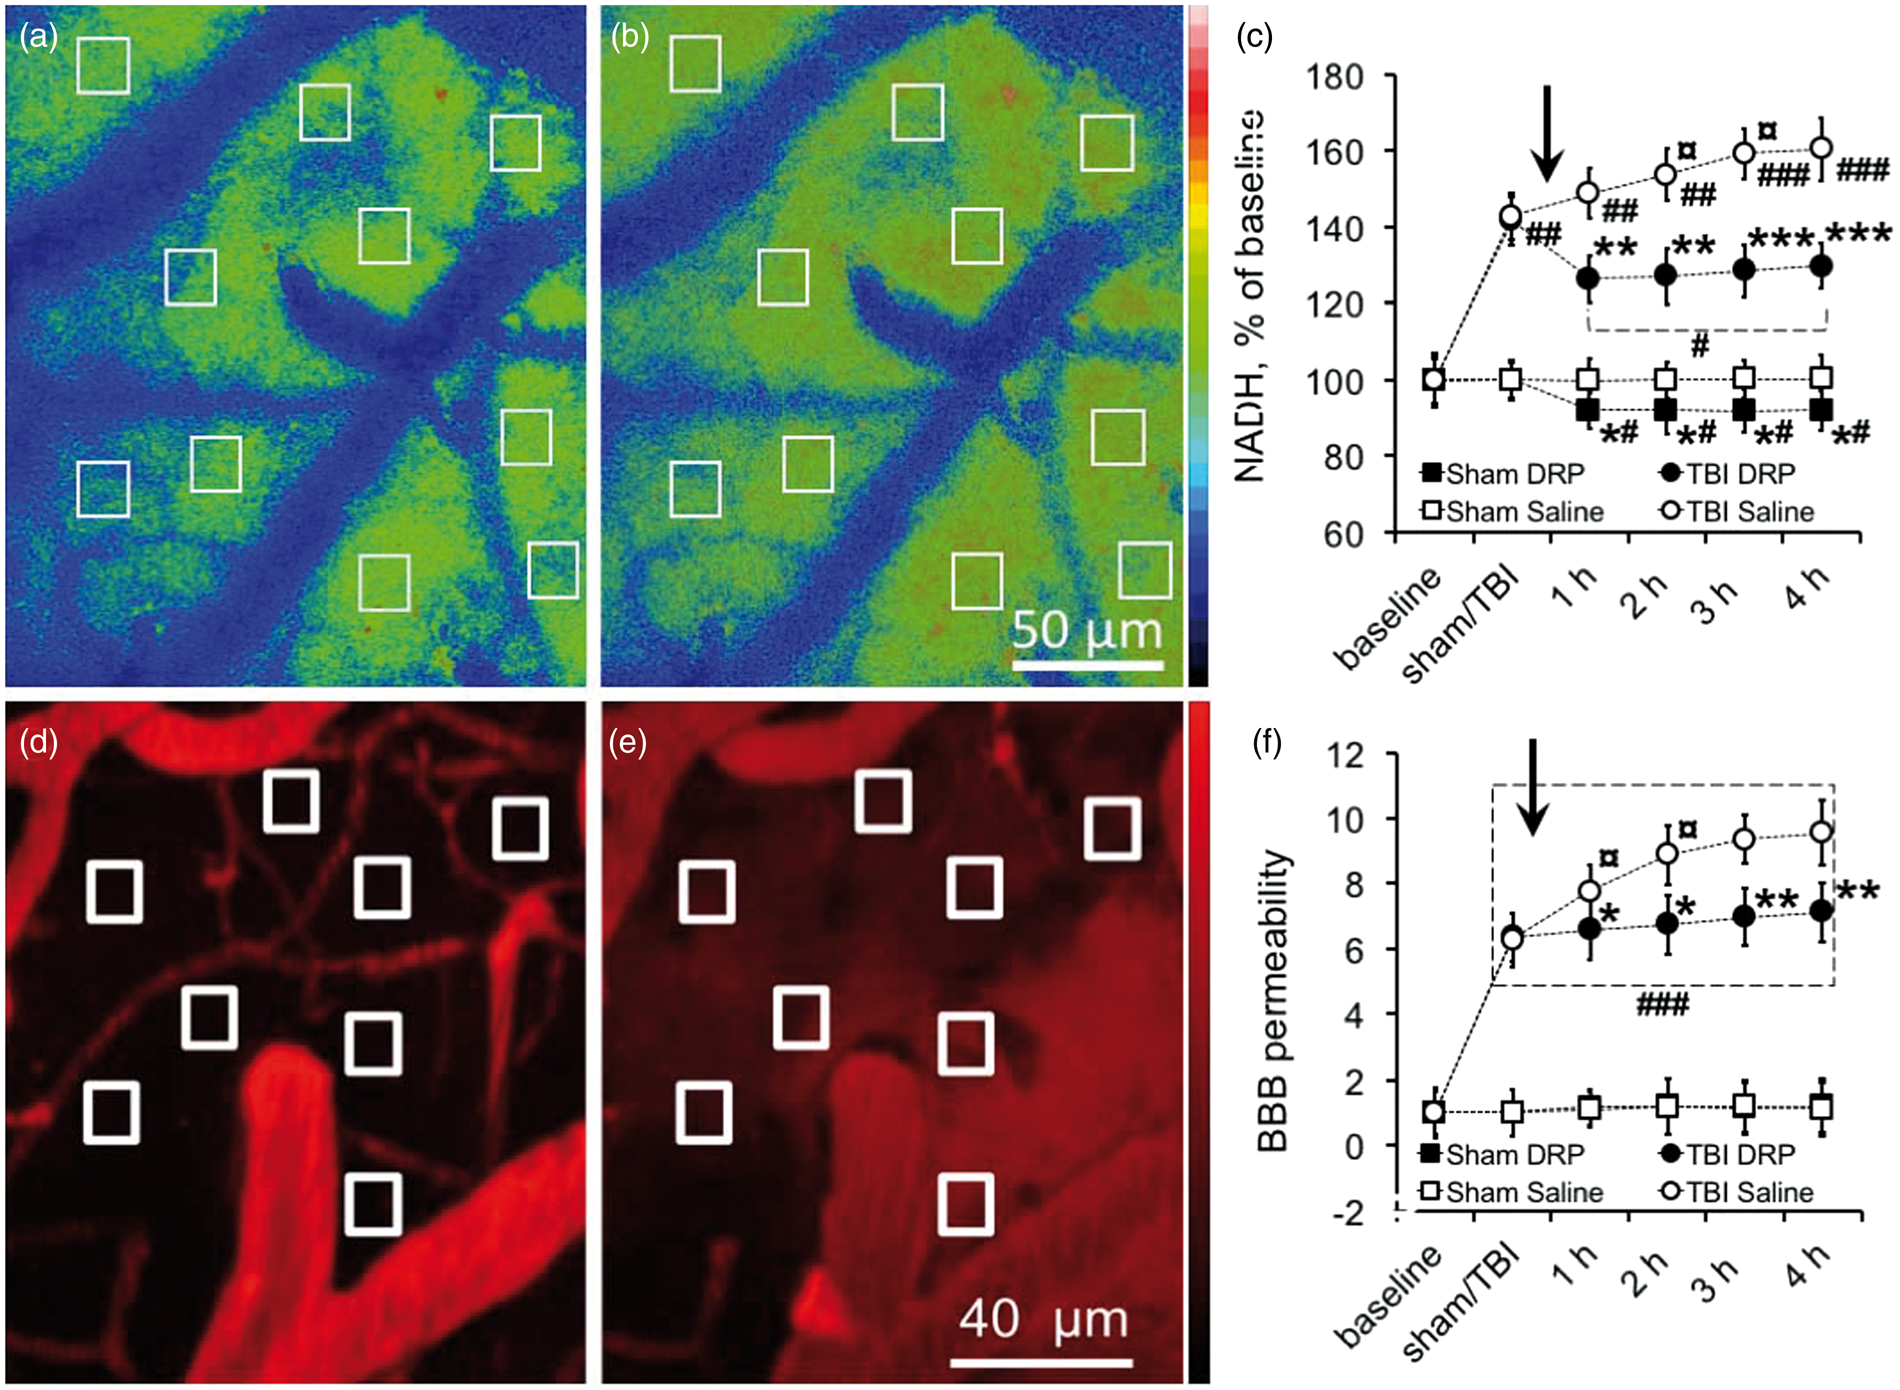
In sham animals, after DRP injection, NADH autofluorescence gradually decreased and stabilized at a lower level (Figure 5(c)). The average NADH autofluorescence at 1 h after DRP injection was 92.1 ± 4.8% compared to baseline (P < 0.05), reflecting increased oxygenation in capillary due to enhanced tissue blood perfusion that persisted for 4 h (Figure 5(c)). Saline injection in sham animals did not alter NADH autofluorescence (Figure 5(c)).
BBB
BBB permeability was continuously monitored by measuring perivascular tissue fluorescence. At baseline, bright vessels filled with fluorescein-dextran were clearly seen over the dark background of unstained tissue reflecting intact BBB (Figure 5(d), Supplement Table 1). TBI increased BBB permeability as reflected by the increase in perivascular tissue fluorescence due to fluorescein leakage through microvessels into brain parenchyma (Figure 5(e) and (f), ΔF/Fo[pre-injury] = 6.26 ± 0.83 and 6.35 ± 0.78, in TBI-Saline and TBI-DRP rats, respectively, P < 0.001 to a baseline). BBB permeability increased with time as reflected by the increase in tissue fluorescence with ΔF/Fo[pre-injury] = 9.55 ± 0.98, (P < 0.05 to post TBI) at 4 h after TBI in the saline group (Figure 5(c)). DRP administered after TBI reduced the progression of BBB damage as reflected by ΔF/Fo[pre-injury] = 7.13 ± 0.89 at 4 h after TBI (P < 0.01, Figure 5(c)). In both sham groups, BBB remained intact with a slight increase in tissue fluorescence ΔF/Fo[pre-sham] = 1.21 ± 0.31 at the end of the monitoring period due to spontaneous extravasation of fluorescein (Figure 5(c)).
MRI
T2 MRI anatomical sequence, taken at 5 h post TBI at the end of 2PLSM session, revealed a developing contusion core in the parietal cortex without significant differences between TBI groups (Figure 7(a)). Tissue perfusion was measured by ASL quantification of CBF. Color-coded perfusion maps for all four groups are shown in a Figure 6. TBI induced a significant decrease in CBF in the injured cortex and hippocampus (P < 0.001, compared to sham-saline control), and insignificant CBF change in the contralateral cortex, and hippocampus (Figure 6(c) and (e)). In the TBI-DRP group, CBF was significantly higher than in TBI-saline group (P < 0.05) but still significantly lower than in sham-saline control (Figure 6(d) and (e), P < 0.01). In the sham group, DRP injection increased CBF compared to the saline group (Figure (a), (b) and (e), P < 0.05). The ASL measurements, however, represent a combined flow in all blood vessels and thus could not fully reflect the changes in the capillary flow detected by two-photon microscopy.
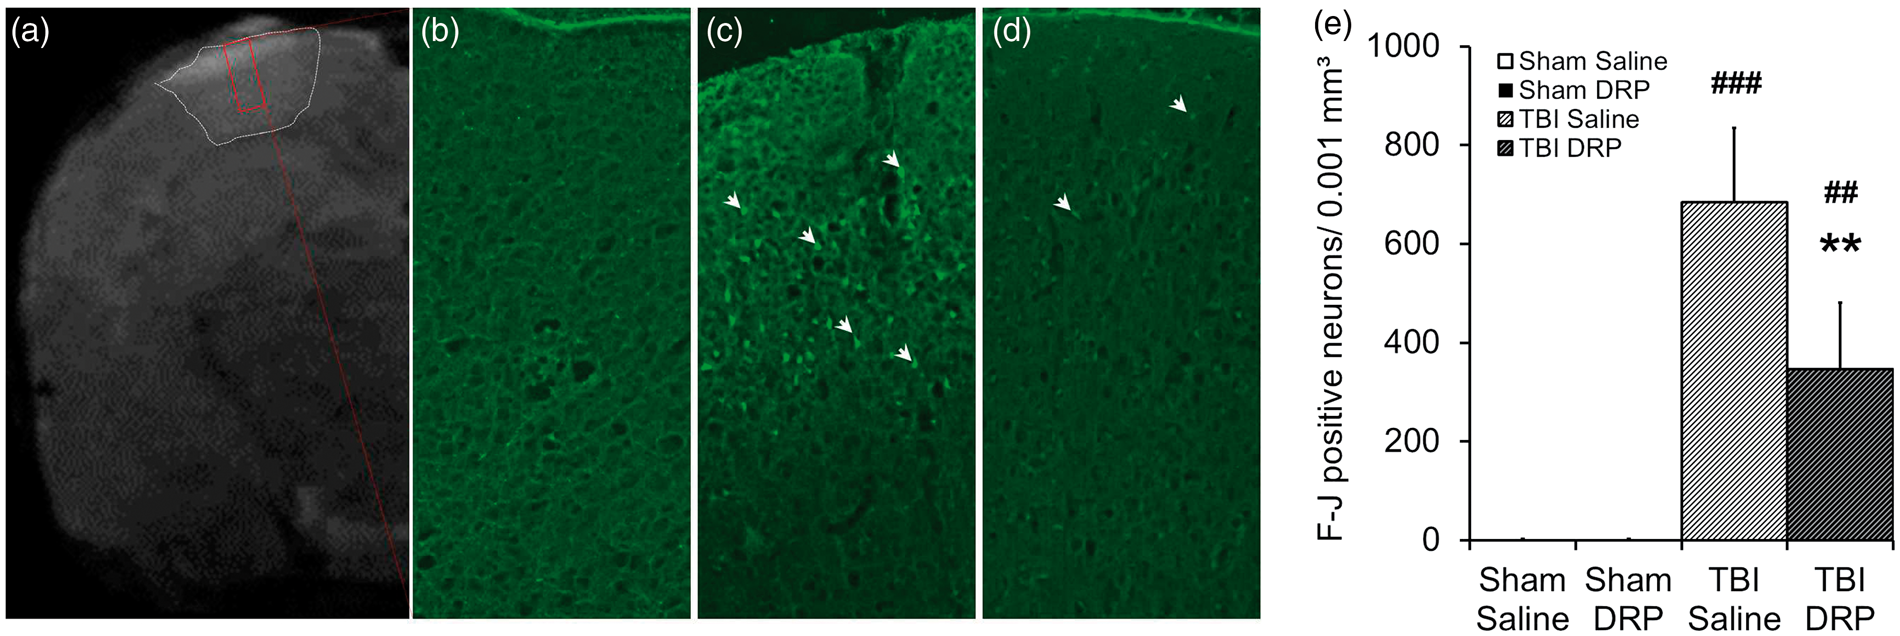
DRP increase cerebral blood flow (CBF) in sham and TBI as measured by magnetic resonance imaging. (a) Representative color CBF maps of rat brains from the four groups at 5 h after TBI: (a) Sham with saline; (b) Sham with DRP; (c) TBI with saline; and (d) TBI with DRP. (e) CBF values for a whole section, ipsilateral and contralateral hemispheres, ipsilateral and contralateral cortex and ipsilateral and contralateral hippocampus. Data are presented as mean ± SEM, n=10 rats/group, *P < 0.05 from TBI-saline, #P < 0.05, ##P < 0.01, and ###P < 0.001 from sham-saline. Intravenous injection of DRP reduces neurodegeneration as measured 6 h post-TBI by Fluoro-Jade C staining. (a) Representative coronal T2 anatomical scan with contusion outlined in white box and Fluoro-Jade C imaging plane outlined in a red box. (b) Normal cortex without dying neurons. (c) Fluoro-Jade C staining reveals dying neurons (bright green pointed by arrows) in layers I-III of the peri-contusional cortex at 6 h after TBI in TBI-saline group. (d) Representative Fluoro-Jade C image showing reduction of neuronal degeneration in TBI-DRP group. (e) Bar graph illustrating TBI induced degeneration of neurons and neuroprotective effect of DRP. Data are presented as mean ± SEM, n=10 rats/group, **P < 0.01 from saline, ##P < 0.01, and ###P < 0.001 from a baseline.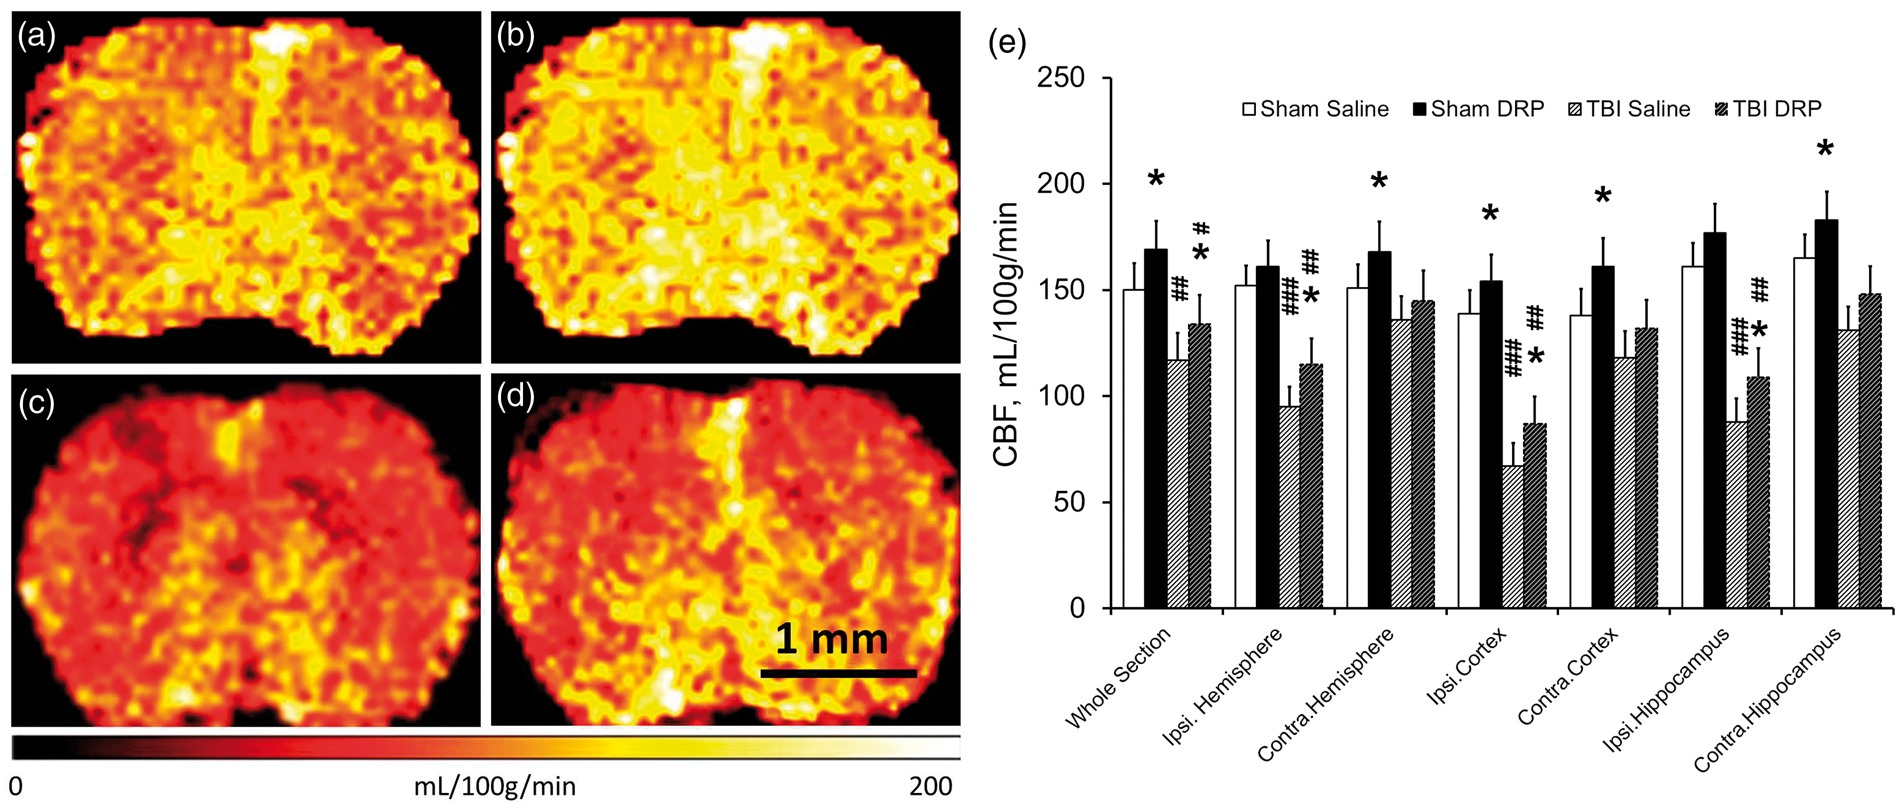
Fluoro Jade C histology
Blood flow restriction and reduction of oxygen delivery to tissue in a contusion and peri-contusion regions after TBI led to degeneration of neurons as it shown by Fluoro Jade C staining of sections, collected from the brains 6 h after TBI (Figure 7(c) and (e)). DRP significantly decreased the number of dying neurons in a lesion volume as it shown on a Figure 7(d) and (e) (684 ± 151 vs. 346 ± 135 Fluoro-Jade positive dying neurons per 45 mm3 in TBI-saline vs. TBI-DRP groups, respectively, P < 0.01). In such an acute phase (6 h after TBI), the volume of dying neurons was limited to cortical layer I-III in the contusion and peri-contusion zones of the brain (Figure 7(a)). In both sham groups, Fluoro-Jade C positive neurons were not observed (Figure 7(b)).
Discussion
In our recent publication, we have reported on hypertensive brain, for the first time, the increase of cerebral circulation and tissue oxygenation after DRP injection 23 ; however, the dynamics and mechanisms were not studied. This study is the first to show in detail, the dynamics and mechanisms of how modulation of the rheological properties of blood by DRP improves brain microcirculation, increases tissue oxygenation, and attenuates BBB degradation after TBI. This rheological approach represents a novel, effective treatment of circulatory complications after TBI suggesting that cerebral ischemia is an early component of secondary injury. The effects of DRP, enhancing cerebral microcirculation evidenced by improved arteriolar flow velocity profiles, reduction of plasma skimming, increasing RBC flow through capillaries, increasing oxygen and nutrient delivery, and improved survival of neurons are indicative of the beneficial effects of DRP in improving perfusion in TBI.
Previous studies targeting posttraumatic hypoperfusion have used the effects of vasodilators31–33 or agents limiting vasoconstriction. 34 These therapies rely on the integrity of the cerebrovasculature and cerebrovascular reactivity, which may be unresponsive due to impaired autoregulation or vasoparalysis after TBI in patients 35 and animals. 36 In contrast, hemorheological modulation of blood flow by DRP does not depend upon the response of the tissue, vascular tone, or reactivity 37 and therefore DRP treatment may provide therapeutic effects over vasodilatory agents.
Mechanisms of DRP effects
The mechanisms of action of nanomolar DRP concentrations in blood are not completely understood, but several have been proposed and some experimentally proven. One of them is a reduction of flow separations and vortices at blood vessel bifurcations due to viscoelastic properties of DRP. This leads to reduction of pressure gradients across the arterial system and an increase in the precapillary blood pressure enhancing capillary perfusion which has been demonstrated in vitro and confirmed in vivo. 37
Another recently discovered mechanism is the ability of DRP to reduce the near-wall cell-free layer (CFL), 38 which is actually RBC free layer, that naturally exists in microvessels with diameters below 300 μm 39 and which was proposed to be an important factor in the regulation of hemodynamics. Reduction in the near-wall cell-free layer increases wall shear stresses promoting release of nitric oxide and vasodilation. In addition, it reduces plasma skimming at the vessel bifurcations thereby increasing hematocrit and diminishing near-wall concentration of platelets in daughter branches of microvessels as observed in vitro 40 and recently in vivo. 41 Reduction of plasma skimming increases the number of RBC flowing through capillaries and thereby increases oxygen delivery to the tissues and the efficiency of gas exchange. 38 These effects of DRP could explain the increased capillary density in diabetic animals, 42 increased myocardial perfusion and animal survival after induced myocardial infarction, 43 and a significant increase in tissue perfusion and animal survival rate after exposure to lethal hemorrhage, and others. 38
Increased in near-wall shear stress and occupation of the near-wall space by RBC, due to presence of DRP in the blood, may explain the significant reduction in the inflammatory reaction to implants observed in animals 28 potentially due to reduction of the near-wall rolling leukocytes, their attachment to vessel walls, and extravasation.
Cerebral microcirculation
In this study, we have also described post-traumatic dynamics and mechanisms of the early changes in cerebral microcirculation and metabolism with high spatial and temporal resolution using in-vivo 2PLSM. Structural damage after TBI reduces CBF, glucose consumption, and oxygen extraction in animals 9 and humans.44,45 Early post-traumatic reductions in CBF have been reported to reach ischemic levels, initiating a cascade of secondary injury events and energy mediating secondary injury processes2,8,46,47 However, some studies undertaken from 12 h to three days after TBI were unable to document cerebral ischemia, showing instead matched oxygen demand to delivery suggesting that at later times after TBI low CBF was due to metabolic depression and reduced oxygen demand.5,6,48 Our results suggest the development of ischemia early after TBI because blood flow enhancement by DRP ameliorated tissue hypoxia. Metabolic depression likely develops at later stage of TBI resulting from detrimental effects of secondary complications.
DRP injection partially dilated some vessels in TBI group and caused insignificant bi-directional change of the diameters of microvessels, i.e. diameter decreased in some vessels and increased in other in sham group. This phenomenon could be explained by cerebrovascular autoregulation, which, in response to increased blood flow and increased tissue oxygen supply, tends to constrict vessels. On the other hand, increased shear stress on a vessel wall tends to dilate vessels, which has been shown in the cremaster muscle of rats in a previous study. 37 Since TBI probably impaired autoregulation, the dilatory effect off DRP in this group is prevalent.
Hemodynamic changes in CBF after TBI are characterized by vasoconstriction, vasospasm, and microthrombi. 49 Post-traumatic microvascular thrombosis and capillary stasis are developed for various reasons including: abnormal platelet activation and accumulation, increased endothelial adhesion of leukocytes, elevated blood viscosity, capillary compression by astrocytic endfeet swelling and widespread pericyte constriction and dislocation 15 which are all targets in experimental studies. However, they do not directly affect the primary trigger for all of these processes – reduced vascular wall shear stress. These changes in the microcirculation would serve to increase brain tissue oxygen and nutrient delivery to the traumatized brain and improved recovery and reflected by preservation of the integrity of the BBB.
Increased BBB permeability that we observed after TBI is in agreement with previous reports of abnormalities in the vascular endothelium leading to BBB damage after TBI. 50 DRP protected BBB from further injury that could be partially explained by DRP-induced increase in vascular wall shear stress that plays a universal role in maintaining the integrity of the endothelium that lines the inner vascular wall. 51 Maintenance of a normally functioning endothelium and vasculature requires the maintenance of a vascular wall shear stress and its decline results in activation of tissue destructive responses such as breakdown of the BBB, inflammatory infiltration, thrombosis, and apoptosis.52,53 Thus, it would appear that low shear stress as in the flow stagnation or due to ischemia would lead to the development of self-destructive processes through the activation of genes leading to disruption of the BBB.
Tissue oxygenation
In our studies, FPI causes tissue hypoxia as reflected by increase of NADH. DRP, by restoring microvascular perfusion, attenuated tissue hypoxia. The advantages of NADH measurement are not only in its ability to assess tissue oxygenation in a real time, and minimally invasively, but it also reflects tissue oxygenation at the mitochondrial level, where the oxygen tension is below 1 mmHg, vs. 23 mmHg in tissue, 54 thereby allowing evaluation of mitochondrial oxygenation at its point of consumption. The brain is a highly aerobic, energy demanding tissue and is dependent upon mitochondria to maintain cerebral function requiring a continuous oxygen supply. Since mitochondria are the key in neuronal death, many treatments are targeting protection of mitochondrial function that strictly dependent on oxygen which require persisted blood microcirculation. Therefore, treatment supporting mitochondria in the absence of microvascular perfusion would fail and a first target should be a microvascular perfusion. In this study, DRP restored microcirculation improving tissue oxygenation and mitochondrial function, impaired by FPI, consistent with the notion that the early reduction in CBF after TBI is due to ischemia rather than metabolic depression but could also be attributable to a combination of both. 55
In summary, our studies showed that the purely hemorheological effect of intravenous nanomolar DRP enhanced and restored brain microvascular perfusion and tissue oxygenation after TBI thereby diminishing the severity of ischemia and hypoxia and preserving the integrity of the BBB. DRP increased near-wall blood flow velocity and number of RBC in arterioles leading to increased blood volume perfused through the microvessels. The result is a reduction in plasma skimming and an increase in the number of RBC entering capillaries that could counter the effects of capillary stasis. Demonstration of the wide-ranging effects of DRP in improvement of tissue perfusion, oxygenation, and metabolism of the injured brain simply through its rheological effects, suggests that DRP may succeed in neuroprotection of the brain after TBI as well as such cerebrovascular accidents as stroke, intracerebral hemorrhage, and subarachnoid hemorrhage.
Footnotes
Funding
The author(s) disclosed receipt of the following financial support for the research, authorship, and/or publication of this article: This work was supported by the National Institutes of Health (1R21NS091600-01A1, 8P30GM103400 and P20GM109089-01A1) and American Heart Association (14GRNT20380496).
Acknowledgements
We thank J DeMoss, A Gravagne, and J Behrendt at UNM Physics and Astronomy Department Machine Shop for the custom made Pneumatic Percussion Device.
Declaration of conflicting interests
The author(s) declared no potential conflicts of interest with respect to the research, authorship, and/or publication of this article.
Authors' contributions
Conceived and designed the experiments: DB, MK, and EN.
Performed the experiments: DB, OB, GS, and YY.
Data analysis: OB, DB, ST, and DL.
Manuscript preparation: DB, MK, and EN.
References
Supplementary Material
Please find the following supplemental material available below.
For Open Access articles published under a Creative Commons License, all supplemental material carries the same license as the article it is associated with.
For non-Open Access articles published, all supplemental material carries a non-exclusive license, and permission requests for re-use of supplemental material or any part of supplemental material shall be sent directly to the copyright owner as specified in the copyright notice associated with the article.