
Abstract
Experimental stroke models producing clinically relevant functional deficits are often associated with high mortality. Because the mechanisms that underlie post-stroke mortality are largely unknown, results obtained using these models are often difficult to interpret, thereby limiting their translational potential. Given that specific forms of post-stroke care reduce mortality in patients, we hypothesized that inadequate food and water intake may underlie mortality following experimental stroke. C57BL/6 mice were subjected to 1 h of intraluminal filament middle cerebral artery occlusion. Nutritional support beginning on the second day after filament middle cerebral artery occlusion reduced the 14-day mortality rate from 59% to 15%. The surviving mice in the post-stroke support group had the same infarct size as non-surviving control mice, suggesting that post-stroke care was not neuroprotective and that inadequate food and/or water intake are the main reasons for filament middle cerebral artery occlusion–induced mortality. This notion was supported by the presence of significant hypoglycemia, ketonemia, and dehydration in control mice. Taken together, these data suggest that post–filament middle cerebral artery occlusion mortality in mice is not primarily caused by ischemic brain damage, but secondarily by inadequate food and/or water intake. Thus, providing nutritional support following filament middle cerebral artery occlusion greatly minimizes mortality bias and allows the study of long-term morphological and functional sequelae of stroke in mice.
Keywords
Introduction
Ischemic stroke is one of the three most common causes of death and the most common cause of disability in industrialized countries. 1 Despite significant research, more than 90% of stroke patients do not receive causal therapy.1,2 This shortcoming likely did not originate from insufficient knowledge or any key differences in the pathophysiology of stroke between patients and mice 3 ; rather, it stems from the inability to translate well-understood, therapeutically exploitable concepts from the laboratory to the bedside. 4 A plethora of reasons have been proposed to explain this so-called “translational roadblock,”5–7 including the way in which stroke is modeled in the laboratory.7,8
Discussions of the relevance of experimental stroke models usually focus on issues such as species and strain differences, the technique used to induce ischemia, the behavioral tests that are used, and the interval between ischemia and assessment. 9 To date, however, few researchers have focused on the fact that most experimental stroke models—particularly models of stroke in mice—have a high mortality rate, resulting in a strong mortality bias. This bias arises from the assumption that mortality is caused by the infarct and that a reduction in mortality reflects neuroprotection.10,11 In fact, direct causality between ischemic brain damage and mortality following experimental stroke has never been demonstrated and underlying mechanisms are not entirely clear yet.
Based on the fact that adequate post-stroke care reduces mortality in patients, 1 we hypothesize that nutritional support may also improve mortality in experimental stroke models. To test this hypothesis, we used two different nutritional support protocols and compared them with the protocol previously used in the laboratory. If nutritional support indeed improves mortality after experimental stroke in mice, the translational potential of these models may increase significantly.
Materials and methods
Animal handling
A total of 112 male C57BL/6N mice (8 weeks old, 20–22 g, Charles River Laboratories) were used for this study. The animals were housed under a 12 h/12 h light/dark cycle and were provided with pellet food and water ad libitum. All experiments were approved by the Ethics Review Board of the Government of Upper Bavaria (protocol number 82-15).
Experimental design
The aim of this study was to investigate the effects of optimized post-stroke care on primary and secondary stroke-related outcomes following filament middle cerebral artery occlusion (fMCAo) in mice. This was tested by comparing mice that received no nutritional intervention (control mice, pellet food only, “p”) with animals that received partial nutritional support (pellet food and oral feeding with jelly food, “po”) or maximal nutritional support (pellet food, oral feeding with jelly food, and jelly food on the cage floor, “poj”; see Figure 1(a)). M-poj group was the main experimental group and M-po group was designed as a cross-over group to test the hypothesis that a maximized (both time- and amount-wise) food and water support (in the form of poj) is necessary for survival.
Schematic overview of the stroke model and nutritional support protocols. (a) Illustration of the three post-stroke protocols. (b) Timeline depicting the study design and two experiments. The primary outcome of experiment 1 was 14-day survival. Experiment 2 focused on locomotor activity (via open field analysis), water and food intake, blood levels of glucose, beta-hydroxybutyric acid, urea, electrolytes, pH, and white blood cells. (c) Summary of the mice in the various groups. aThese animals were excluded due to the presence of a brain lesion following sham surgery; bThese animals were excluded due to intestinal trauma caused by repeated insertion of a rectal probe in ischemic/dehydrated animals. Note that experiment 2 did not include a rectal probe; therefore, the animals with ischemia did not develop intestinal trauma.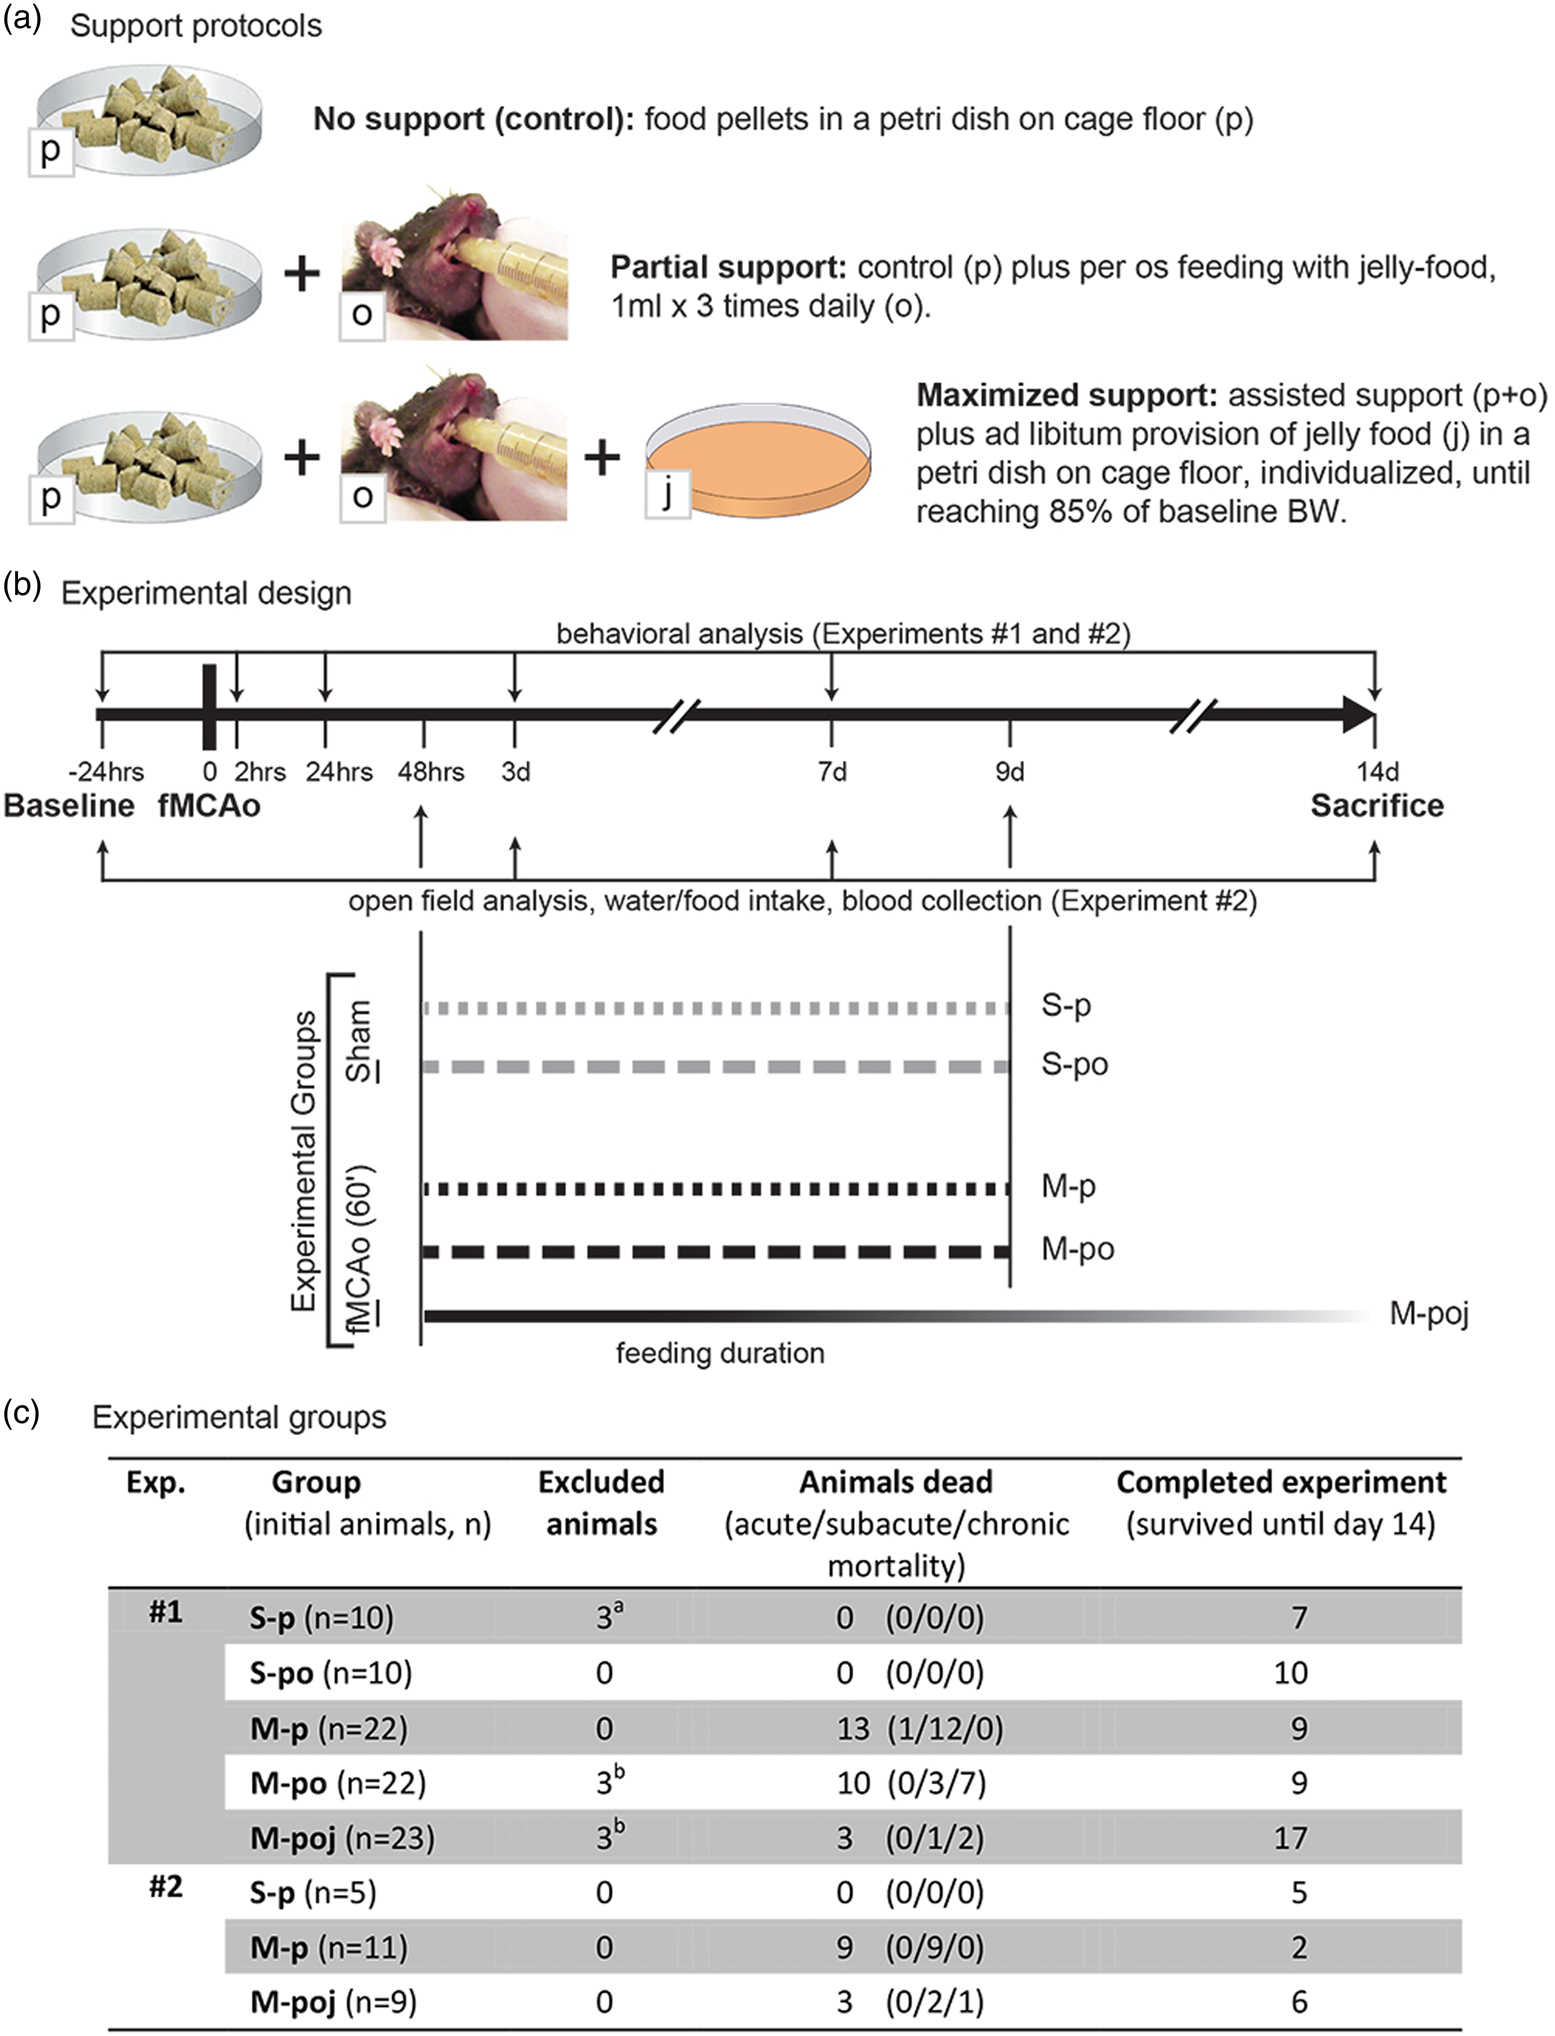
Functional outcome was assessed as being directly related to the brain injury (focal stroke deficits) or as a systemic process triggered and/or affected by stroke severity (systemic stroke effects). Mortality was classified as acute (2–48 h post-fMCAo), subchronic (3–7 days post-fMCAo), or chronic (>7 days post-fMCAo). Death was verified at necropsy as primarily stroke-related when attributed to brain herniation due to brain edema formation, or as systemic when attributed to hypothermia and/or weight loss (Figure 1(b) and (c)).
Experiment 1 (Figure 1(b)) was designed to evaluate whether post-stroke care can reduce fMCAo-associated mortality within 14 days (primary endpoint). This experiment consisted of three ischemic groups and two sham-operated groups (Figure 1(b) and (c)). The inclusion and exclusion criteria are described in Supplementary Materials and Methods. The secondary endpoints were focal stroke deficits (infarct volume on day 14 and focal neurological deficits; see the relevant sections below) and systemic stroke effects (systemic behavioral deficits, body weight loss, “time-to-85% baseline weight,” and hypothermia; see below). Animals that died during the 14-day observation period were examined by necropsy, and the brains were collected and used to measure infarct size.
Experiment 2 was designed to evaluate why animals die following fMCAo and to examine the effect of providing nutritional support on mortality (Figure 1(b) and (c)). The parameters measured included food and water consumption, open field locomotion, blood and plasma metabolic parameters, and immune responses following fMCAo or sham surgery (see below). Focal and systemic behavioral deficits were measured using the Experimental Stroke Scale (ESS) test battery (see below). Animals at the end of observation period were perfused with 4% PFA; those that died earlier were examined by necropsy and organs (brains, lungs) were post-fixed in 4% PFA. All data are reported in accordance with the ARRIVE criteria. 6
Induction of cerebral ischemia using the 60-min fMCAo model
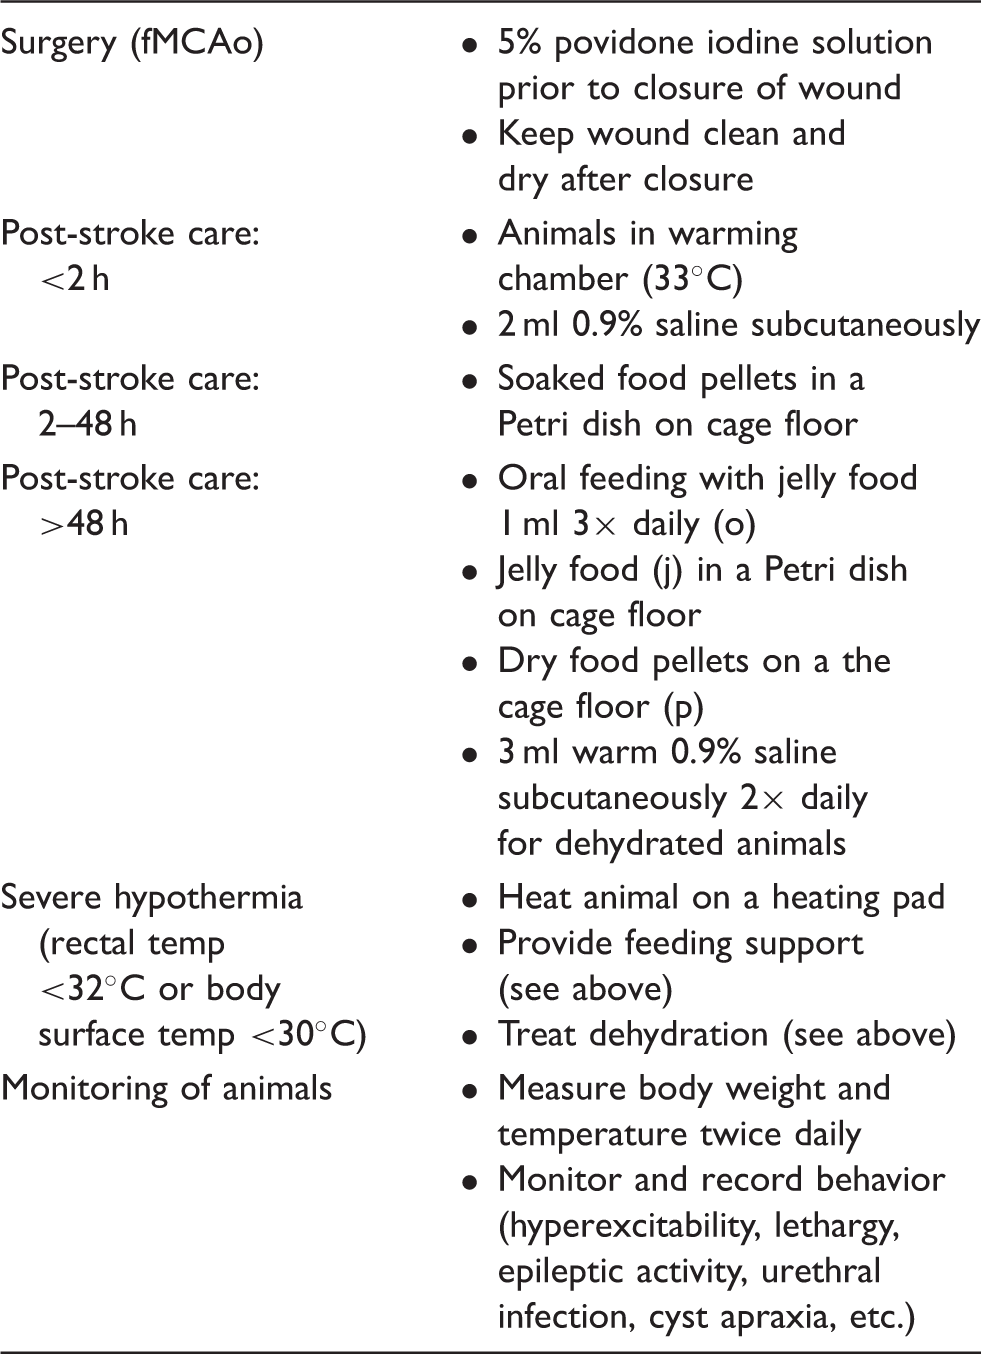
The middle cerebral artery was occluded for 60 min using the filament model (fMCAo) as described previously 12 (see Supplementary Materials and Methods for additional details). Acute post-operative animal care was provided for up to 2 h as described previously. 12 Post-operative analgesia (100 µg Caprofen, s.c.) was administered for 3 days.
Stroke care support protocols
All nutritional support and control protocols used the same food (catalog number V1530, normal mouse/rat maintenance food containing 12.8 KJ/g of metabolizable energy; ssniff-Spezialdiäten GmbH, Soest, Germany) provided in different formulations (dry pellets, soaked pellets, or jelly form). For the production of the jelly-based form, food powder containing xanthan gum was prepared fresh each day by mixing with water at a ratio of 1:3.
During the first 48 h following surgery, all mice received soaked food pellets in a Petri dish (Figure 1(a)). After 48 h, the two control groups (S-p and M-p) received dry pellets in a Petri dish (Figure 1(a)) for an additional 7 days (i.e. until post-surgery day 9), with no additional nutritional support; this is the protocol commonly reported in the literature.12–14 The supported groups (S-po, M-po, and M-poj) received additional oral feeding (Figure 1(a)) until post-surgery day 9. In brief, awake mice were restrained by hand and given 1 ml of jelly food 3 times daily by oral feeding (stepwise administration of 50 μl portions of jelly food). This approach is milder, less stressful and less traumatic compared with oral gavage. 15 In addition, the maximal support group (M-poj) received dry pellets on the cage floor, oral feeding with jelly food, and jelly food in Petri dishes (refilled twice daily to provide ad libitum access to food) until the end of the study. Both oral feeding and jelly food on the floor were provided until each animal returned to at least 85% of its baseline body weight.
Analysis of neurological deficits, body weight, and temperature
Focal neurological deficits were measured using the classic Bederson scale, 12 the modified Neurological Stroke Scale (mNSS), 16 the modified Bederson scale (mBS), 16 and the focal component of the Neuroscore (fNS). 17 Systemic behavioral deficits were measured using the general component of the Neuroscore (gNS); for details regarding these scales, see Supplementary Materials and Methods. In addition, to improve our detection of focal and general deficits induced by fMCAo using a single, practical scale, we derived an “experimental stroke scale” (ESS) using the aforementioned tests. This new ESS scale includes a focal component (fESS), which evaluates focal neurological deficits, and a general component (gESS), which evaluates systemic behavioral deficits (see Supplementary Materials and Methods). The time points for the evaluations are shown in Figure 1(b).
Body weight (BW) and core body temperature (cBT, measured daily using a rectal probe) were measured prior to surgery (i.e. baseline) and daily thereafter until day 14 (Figure 1(b)). The change in BW is reported as the percent change relative to baseline. In addition, we calculated the percent daily change in BW using the formula [(BWday n − BWday(n−1))/(BWday(n−1)) × 100] to identify when the animals began to gain weight again.
Analysis of infarct volume, hemispheric atrophy, and lesion site
The brains of the animals in experiments 1 and 2 were collected on day 14 and snap-frozen. Coronal sections (10 -µm thick) were taken at 750 -µm intervals. Brains of animals that died prior to day 14 were collected, post-fixed in 4% paraformaldehyde overnight, cryopreserved in 30% sucrose, and sectioned as described above.
Corrected infarct volume (%Vinf) and hemispheric atrophy (% atrophy) was measured on day 14 using MAP2 immunohistochemistry as described previously 18 (see Supplementary Materials and Methods). Nissl staining was used to estimate infarct volume and hemispheric atrophy/swelling in the brains collected from animals that died prior to day 14.
Analysis of post-stroke behavioral activity
To evaluate whether post-fMCAo locomotor behavior affects feeding and vice versa, the animals’ activity was recorded using the open field test. The arena contained three zones: a rectangular “open zone” in the center, a peripheral “wall” zone, and a cumulative zone comprised of the four corners (“+”). All videos were analyzed using Ethovision XT 11.5 software (Noldus Information Technology, Wageningen, The Netherland). Additional details are provided in Supplementary Materials and Methods.
Food and water consumption on days 3, 7, and 14
Food and water consumption was measured on post-surgery days 3, 7, and 14 in experiment 2 (the S-p, M-p, and M-poj groups), as well as in naïve animals (n = 7, receiving dry pellets). During the evaluation, the animals were housed individually for 24 h (observation period) and were provided with a premeasured amount of food (dry pellets—named as “spontaneous intake” of food—or jelly food, depending on their group allocation) and 100 ml water in a bottle (named as “spontaneous intake” of water). At the end of the observation period, the remaining food and water was measured, and the difference was used to calculate water consumption (ml/day) and dry food consumption (g/day) per animal. In the M-poj group, the weight of the jelly food was adjusted to correct for the change in weight due to water evaporation during the observation period (using measurements from Petri dishes placed in empty cages). Food and water consumption were correlated with the infarct volumes of the corresponding animals.
Blood glucose, beta-hydroxybutyrate, urea, electrolytes, and pH
Blood from mice without access to food for 3 h was collected on post-surgery days 3, 7, and 14 from the facial vein. Fasting glucose (mg/dl) was measured using a standard glucometer (Accucheck Aviva, Roche). Blood electrolytes (Na+, Ca2+, and K+), pH, and hematocrit were measured using a blood gas analyzer (RAPIDLab 248/348 System, Siemens). The remaining blood (approximately 100 μl) was collected into EDTA tubes for plasma separation and isolation of the white blood cells (WBCs; see below). Beta-hydroxybutyric acid (bHB, mmol/L) was measured using commercially available assays in accordance with the manufacturer's instructions (bHB assay kit: Abcam ab83390). Beta-hydroxybutyrate is one of the three ketone bodies produced by oxidation of free fatty acids in the liver, 19 and its blood levels can be used to accurately diagnose ketoacidosis. 20
Analysis of lung bacterial load with real-time PCR
To evaluate whether mortality was associated with pneumonia, we used rtPCR to detect bacteria in the lung. 21 Two primer sets were used: one for eukaryotic bacteria (EuB) as a measure for total bacterial load and one for mouse intestinal bacteria (MIB) as marker for aspiration. 22 Lungs from naive animals and mouse feces were used as negative and positive controls, respectively. The detailed protocol is provided in Supplementary Materials and Methods.
White blood cell count and FACS analysis
The presence of post-stroke immune depression was assessed via counts of WBC in peripheral blood, on days 3, 7, and 14 using a SCiL vet blood cell counter. FACS analysis of PBMCs was performed on blood samples using a FACS Verse flow cytometer (BD Biosciences). Naïve animals (n = 6) served as controls. A detailed FACS protocol is provided in Supplementary Materials and Methods.
Statistical analysis
Statistical analyses were performed using SPSS version 22.0 (IBM Corporation). The primary outcome of experiment 1 was mortality in the M-poj group compared with the M-p group; the primary outcome in experiment 2 was the change in blood glucose and ketone bodies compared with naïve animals. Group size analysis was based on primary outcomes and was performed using a power of 0.8 and alpha error of 0.05. Differences between two groups and >2 groups were analyzed using appropriate parametric or nonparametric tests (t-test and ANOVA with post-hoc comparisons or Mann–Whitney U test and Kruskal–Wallis, respectively) after checking data for normality. Survival was analyzed by performing a log-rank pairwise comparison (Mantel-Cox). Repeat data were analyzed using repeated measures general linear modeling (rmGLM) and post hoc analyses between groups. Correlations were determined by calculating Pearson's r or Spearman’s rho. Curve fit analysis was used to determine which neurological scale best predicts infarct volume on post-surgery days 1 and 14 (based on the F-value). Except were indicated otherwise, all summary data are presented as the mean ± SEM or as box plots (showing the median, first quartile, third quartile, and 5–95% range) with individual values superimposed on the plot. Differences were considered to be significant at p < 0.05.
Results
Mortality
The initial group sizes and the number of animals that were excluded, died, or completed the study in each group are summarized in Figure 1(c). Physiological data from the animals are described in Supplementary Table 1.
A primary goal of the study was to determine whether providing nutritional support reduces mortality following fMCAo. In the maximal nutritional support (M-poj), 85% of mice survived for 14 days as compared with only 41% in the control group (M-p; p = 0.001; Figure 2(a)). In addition, survival was significantly prolonged in the M-poj group compared with the M-p group (p = 0.01; Figure 2(b)). Although the mice in the M-po group had prolonged survival compared with control mice (p = 0.001), their 14-day survival rate was similar to the mice in the M-p group (47%; Figure 2(a) and (b)). Importantly, the positive effect of maximal nutritional support on survival was replicated in experiment 2 (Supplementary Figure 1), although animals in this group were exposed to a more stressful protocol as compared with those used for experiment 1. Taken together, post-stroke nutritional support reduces 14-day mortality after fMCAo by up to 75%.
Nutritional support reduces mortality. (a) A Kaplan–Meier survival plot shows that maximal nutritional support (M-poj group) doubled the 14-day survival rate compared with control mice (M-p). (b) Both nutritional support protocols delayed fMCAo-associated mortality; however, only maximal support reduced the total number of dead animals. (c) Representative MAP2-stained brain sections (+1.0 mm or −2.0 mm relative to Bregma); the infarct lesion appears as white tissue. (d) Summary of %Vinf (corrected for atrophy and/or edema) in animals that survived to day 14 (“survived,” black filled symbols) and animals that died before day 14 (“dead,” open gray symbols). (e) Representative Nissl-stained brain sections adjacent to the respective sections shown in panel (c), showing left hemispheric atrophy. (f) Summary of ipsilateral atrophy. The horizontal lines in (b), (d), and (f) represent the mean values. *p < 0.05; **p < 0.01.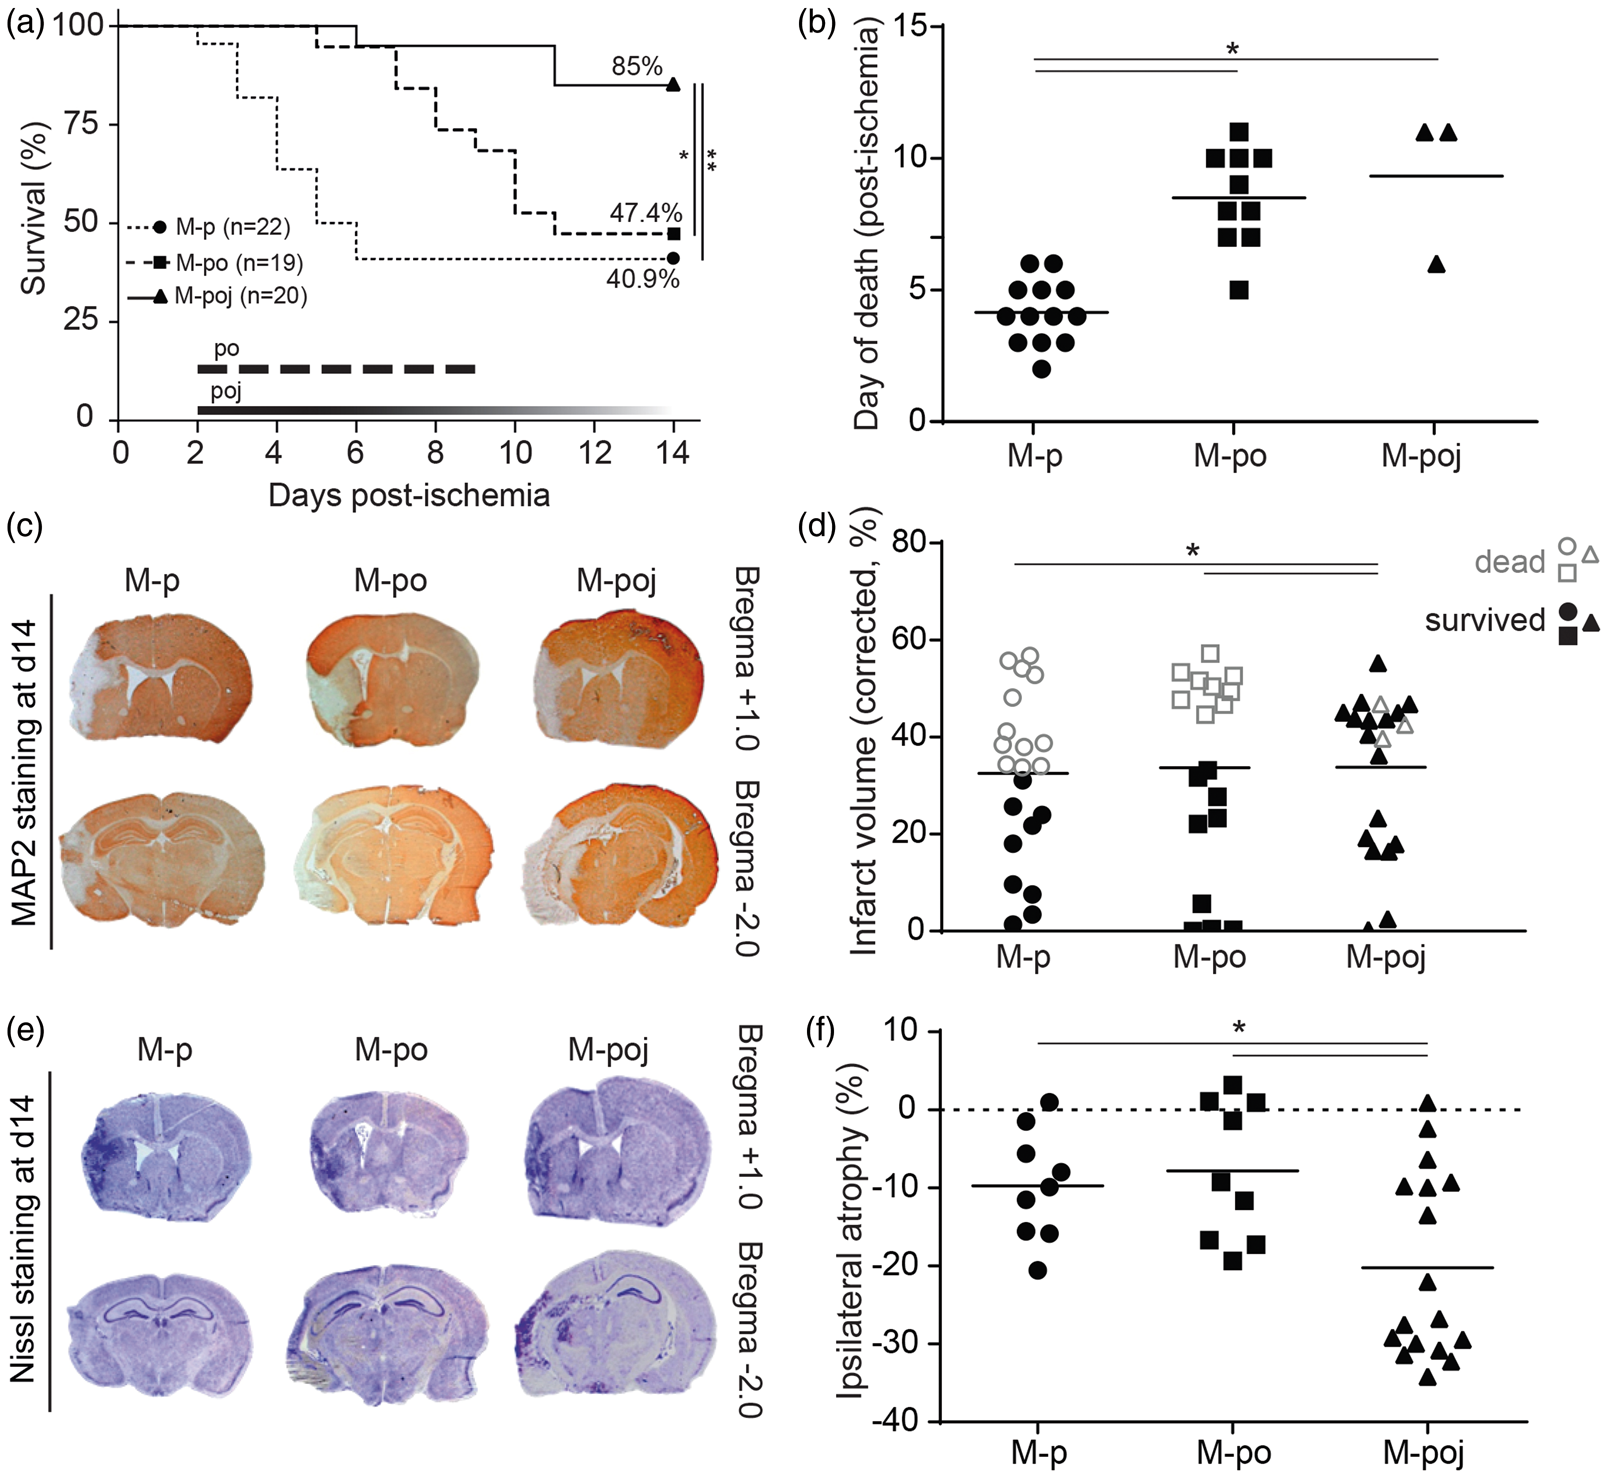
Infarct volume
Next, we examined whether the positive effect of post-stroke care on mortality was mediated by neuroprotection. Our analysis revealed that the mean overall infarct size (%Vinf) was similar in all groups (experiment 1: 33.4 ± 3.4%, 33.2 ± 4.7%, and 33.6 ± 3.6% for M-p, M-po, and M-poj, respectively; Figure 2(c) and (d)) suggesting that post-stroke care was not neuroprotective. However, the comparison between surviving (up to day 14) and dead (prior to day 14) animals revealed that the surviving M-p and M-po animals had smaller infarcts (15.8 ± 3.6% and 16.0 ± 4.7%, respectively) than the surviving M-poj animals (32.0 ± 4.1%; p = 0.04 and p = 0.04 versus M-p and M-po, respectively; Figure 2(c) and (d)). As a result of larger infarcts, surviving animals of M-poj group developed more atrophy compared with the surviving M-p and M-po mice (p = 0.05 and p = 0.017 versus M-p and M-po, respectively; Figure 2(e) and (f)). On the other hand, the infarct volume of dead animals (prior to day 14) was similarly large in all three groups (infarct volume was 43.9 ± 2.6%, 50.4 ± 1.3%, and 43.0 ± 2.1% in the M-p, M-po, and M-poj groups, respectively; p > 0.05, Figure 2(d), open gray symbols, named as “dead”). However, within each group, the dead animals in groups M-p and M-po had significantly larger lesions compared with the corresponding surviving (up to day 14) animals (p = 0.0001 and p = 0.000003, respectively, Figure 2(d)); in contrast, dead and surviving animals in the M-poj group had similarly large lesions (p > 0.05), suggesting that survival in this group was not primarily affected by infarct size. Overall, these results demonstrate that providing nutritional support following fMCAo does not reduce infarct size or brain atrophy. Thus, post-stroke nutritional support per se is not neuroprotective.
Behavioral deficits
To evaluate the neurological deficits following fMCAo, we developed a new experimental stroke scale (ESS; see Materials and Methods). Using this scale, we found that fMCAo induced both focal (Figure 3(a)) and general (Figure 3(c)) deficits that lasted 14 days. The po and poj support protocols had no true significant effect on either focal or general behavioral outcomes measured in the sham-operated (S-p versus S-po) or fMCAo animals (M-p versus M-po, rmGLM; p > 0.05). The phenomenically worse scores of the M-poj group in comparison to M-p group (after day 7, p < 0.05) were attributed to the mortality bias of the M-p group, which removed animals with large stroke and biased the data towards lower behavioral deficits (Figure 3a and 3b, Supplementary Figure 2). Interestingly, fESS was strongly correlated with infarct volume measured at day 14 (Figure 3(b)) and strongly predicted the final ischemic lesions both one (F = 20.2, p < 0.001) and 14 days (F = 31.7, p < 0.0001) after stroke. In contrast, gESS did not correlate with infarct volume (Figure 3(d)). Last, a hierarchical cluster analysis of fESS scores from the M-poj group on post-stroke day 1 revealed four clusters of stroke severity based on the fESS score: 0–2 corresponds to no lesion (i.e. no stroke), 3–7 corresponds to a mild lesion, 8–14 corresponds to a moderate lesion, and 15–42 corresponds to a severe lesion (Figure 3(e), severity cluster). The results of the individual behavioral scales (mNSS, mBS, gNS, and fNS) are given in Supplementary Figure 2 and confirm the results obtained with the ESS.
Post-stroke nutritional support does not reduce fMCAo-induced focal neurological or systemic behavioral deficits measured using the experimental stroke scale (ESS). (a) Summary of focal deficits (fESS) in the indicated groups at the indicated times following fMCAo or sham surgery. Note that the apparent improvement in the M-p group at day 7 was due to the high mortality rate in this group, which resulted in a bias toward surviving animals. (b) The fESS scores were correlated with infarct volume measured on day 14; the data depict the M-poj group. (c) Summary of general systemic behavioral deficits (gESS) in the indicated groups at the indicated times following fMCAo or sham surgery. The symbols correspond to the groups shown in panel (a). (d) The gESS scores do not correlate strongly with infarct volume measured on day 14. (e) Distribution of the stroke severity in the indicated groups based on fESS clustering, showing the degree of bias in the M-p group due to high mortality and the subsequent loss of severely affected animals from the analysis. *p < 0.05 versus M-poj; ‡p < 0.05 versus M-po.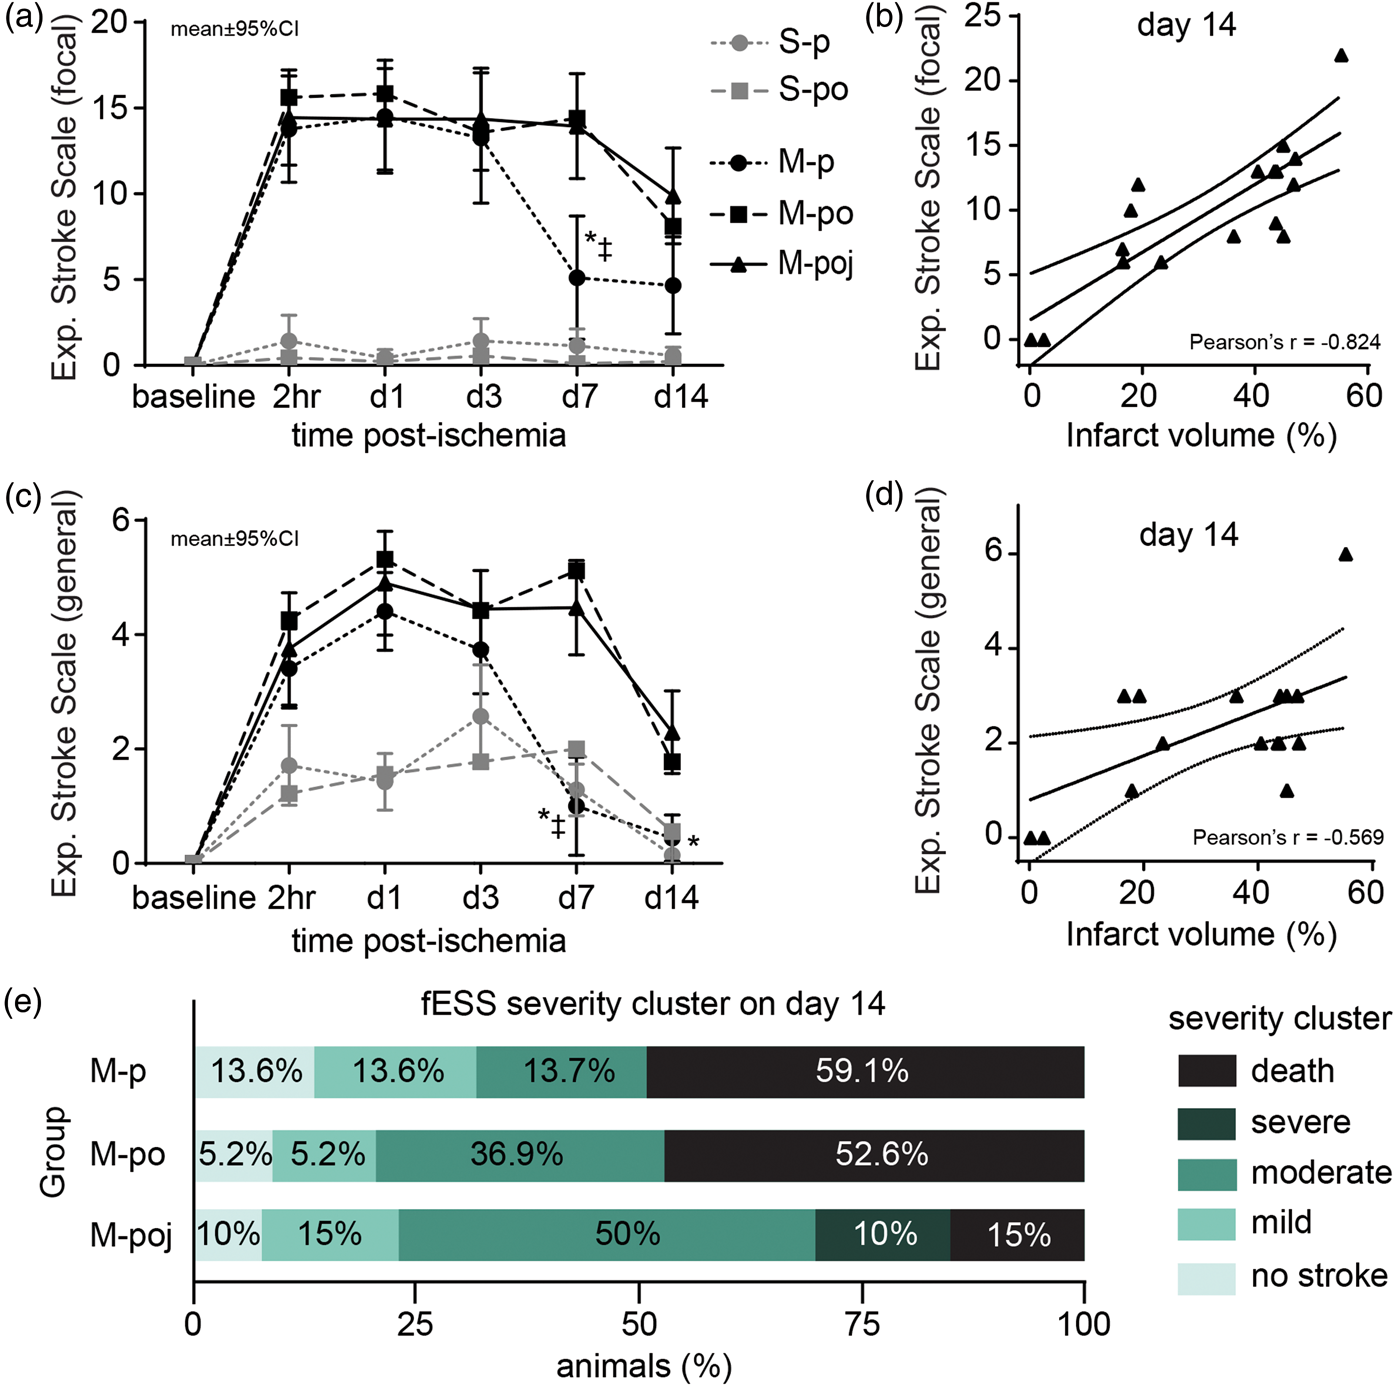
Overall, these data illustrate the clear mortality bias of fMCAo and show that this bias is largely eliminated by providing nutritional support.
Catabolism and hypothermia
Although nutritional support improved post-stroke survival, it did not prevent the characteristic loss of body weight (BW) and hypothermia that develop following fMCAo (Figure 4(a) and (c)). Sham-operated animals (i.e. the S-p and S-po groups) developed mild BW loss and hypothermia, neither of which was affected by nutritional support (p > 0.05). Interestingly—and despite receiving nutritional support—the mice in the M-po and M-poj groups had more severe BW loss compared with the M-p group (p = 0.009 and p = 0.002, respectively), reaching peak weight loss on day 5 (−26.7 ± 1.9%) and day 7 (−30.3 ± 2.4%), respectively. Similarly, the mice in the M-poj group (but not in the M-po group) developed more severe hypothermia than the M-p group (p = 0.001) (Figure 4(c)). Both peak weight loss (Figure 4(b)) and peak hypothermia (Figure 4(d)) were significantly correlated with infarct volume in the M-poj group (p < 0.005). An analysis of “time-to-85% baseline BW” in the M-poj group revealed that 14 out of 17 (82%) of surviving mice reached 85% of their baseline BW within 10.1 ± 0.8 days. Overall, when these data are combined with the fact of high survival in M-poj group, they suggest that severe BW loss and hypothermia are inherent characteristics of fMCAo with large lesions and that the changes of these parameters are masked when mortality occurs.
Maximal nutritional support facilitates the ability to measure fMCAo-associated weight loss and hypothermia by reducing mortality. (a) Summary of body weight loss in the indicated groups at the indicated times following fMCAo or sham surgery (expressed as the percent loss relative to baseline BW; the horizontal gray line at −15% corresponds to “85% baseline BW”). (b) Maximum body weight loss is significantly correlated with infarct volume. (c) Summary of body temperature measured in the indicated groups at the indicated times following fMCAo or sham surgery. The symbols correspond to the groups shown in panel (a). The horizontal gray line corresponds to 37.5℃ (normothermia). (d) Maximum hypothermia (i.e. the lowest body temperature measured in the animal) is significantly correlated with infarct volume. The data in panels (b) and (d) show the M-poj group.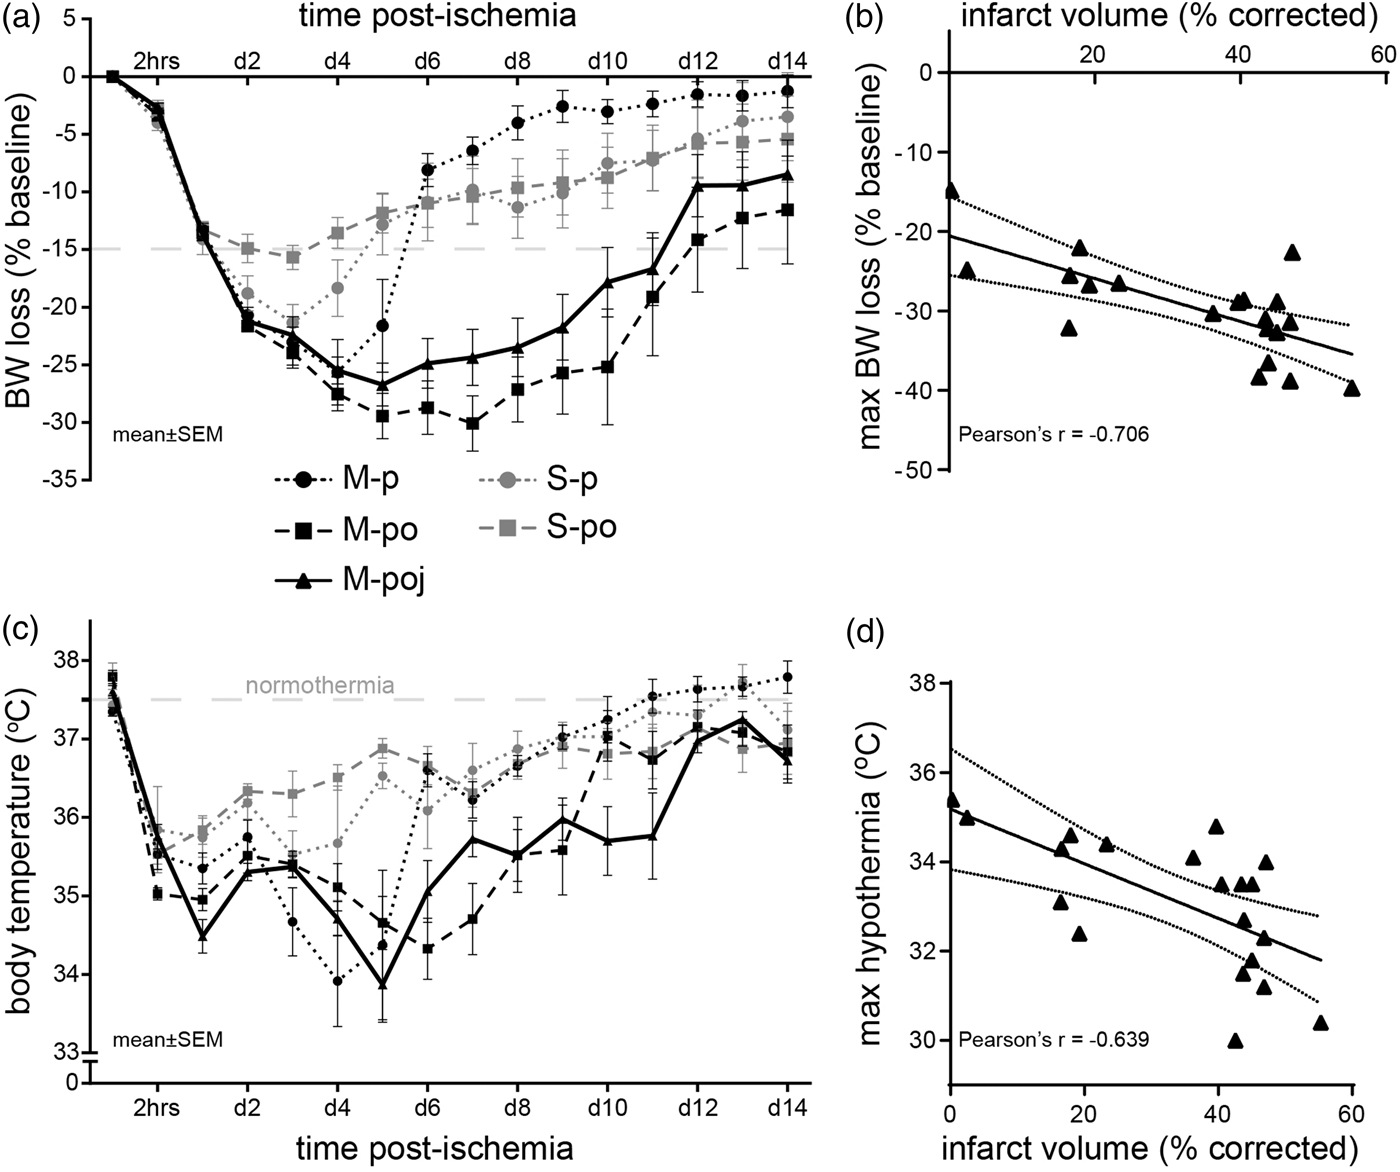
Electrolytes and blood pH
Next, we examined whether providing nutritional support affects post-fMCAo electrolyte balance by measuring blood pH, Na+, K+, and Ca2+ on post-surgery days 3, 7, and 14 (Supplementary Table 2). On day 3, the S-p, M-p, and M-poj groups had similar levels of transient acidosis (p < 0.01 versus naïve); we were unable to determine whether this was respiratory or metabolic acidosis, since we sampled venous blood. Similarly, all three groups developed a transient electrolyte imbalance on day 3 (increased Na+ and Ca2+ levels), which gradually returned to normal levels by day 7–14. Collecting repeat blood samples from the animals did not induce anemia; the increased hematocrit values measured on day 3 indicate dehydration. Taken together, these data suggest that the changes in blood electrolytes and pH are due to the surgical procedure itself and are not due to ischemia.
Food and water intake, serum glucose and serum beta-hydroxybutyric acid
Next, we investigated why mice die following severe stroke and why providing nutritional support reduces mortality by measuring the consumption of food and water, as well as measuring blood levels of glucose and beta-hydroxybutyric acid (bHB). Our results show that on post-stroke day 3, M-p animals do not eat or drink spontaneously (p < 0.0001 and p < 0.01 for food and water, respectively, versus naïve mice; Figure 5(a) and (b)). Providing maximal nutritional support restored food and water consumption (p < 0.08 and p < 0.001 for food and water, respectively, compared with the M-p group) almost to the levels of naive. By post-stroke day 7, the surviving animals in the M-poj group consumed overall higher amounts of food (p < 0.05) and water (p < 0.001) as compared with naïve mice, thereby compensating for their reduced intake in previous days. The amount of spontaneous food and water intake on day 3 (dry pellets or spontaneous drinking from the bottle) was inversely correlated to the infarct volume (p < 0.002 and p < 0.05, respectively), suggesting that the larger the infarct volume an animal had, the less it ate and drank (Figure 5(c) and (d)). This behavior was still evident for spontaneous food consumption on day 7 (Pearson's r = −0.749, p < 0.005) but not water. Because of the high mortality rate in the M-p group after day 3, no further analysis could be performed for these animals.
fMCAo reduces water and food intake in mice, leading to changes in blood glucose and bHB levels. (a) Summary of food intake (grams/day per mouse) in the indicated groups at the indicated times following fMCAo or sham surgery. For days 3 and 7, animals in M-poj group consumed food either spontaneously as pellets (part of the bars with oblique lines) or assisted (white part of the bars). (b) Summary of water intake (ml/day per mouse) in the indicated groups at the indicated times following fMCAo or sham surgery. Note that the jelly food given to the M-poj group contains water. Similar to (a), on days 3 and,7 M-poj animals consumed water either spontaneously from the cage bottle (oblique lines) or from the assisted feeding (white part of the bars). (c,d) Graphs showing the negative correlation between the infarct volume and the spontaneous food (c) and water (d) consumption on day 3, indicative of anorexia. (e,f) Summary of blood glucose levels (e) and plasma bHB levels (f) in the indicated groups at the indicated times following fMCAo or sham surgery. (g) Total bacterial load in lungs of naive, S-p, M-p, and M-poj groups at the time of death or sacrifice for each animal (“pos.c.” and “neg.c.” stand for positive and negative technical control samples (i.e. fecal sample and water, respectively). (h) White blood cell (WBC) count on days 3–14 post-fMCAO. *p < 0.05, **p < 0.01, ***p < 0.001 for comparisons with naive; ##p < 0.01, ###p < 0.001. Bars show means ± s.e. Dotted gray lines in (a), (b), (e), (f), and (h) indicate the range (95% confidence intervals) of food (a) and water (b) consumption as well as the blood glucose (e), plasma ketone bodies (bHB, f) and WBCs (h) in mice that were not subjected to surgery (naïve).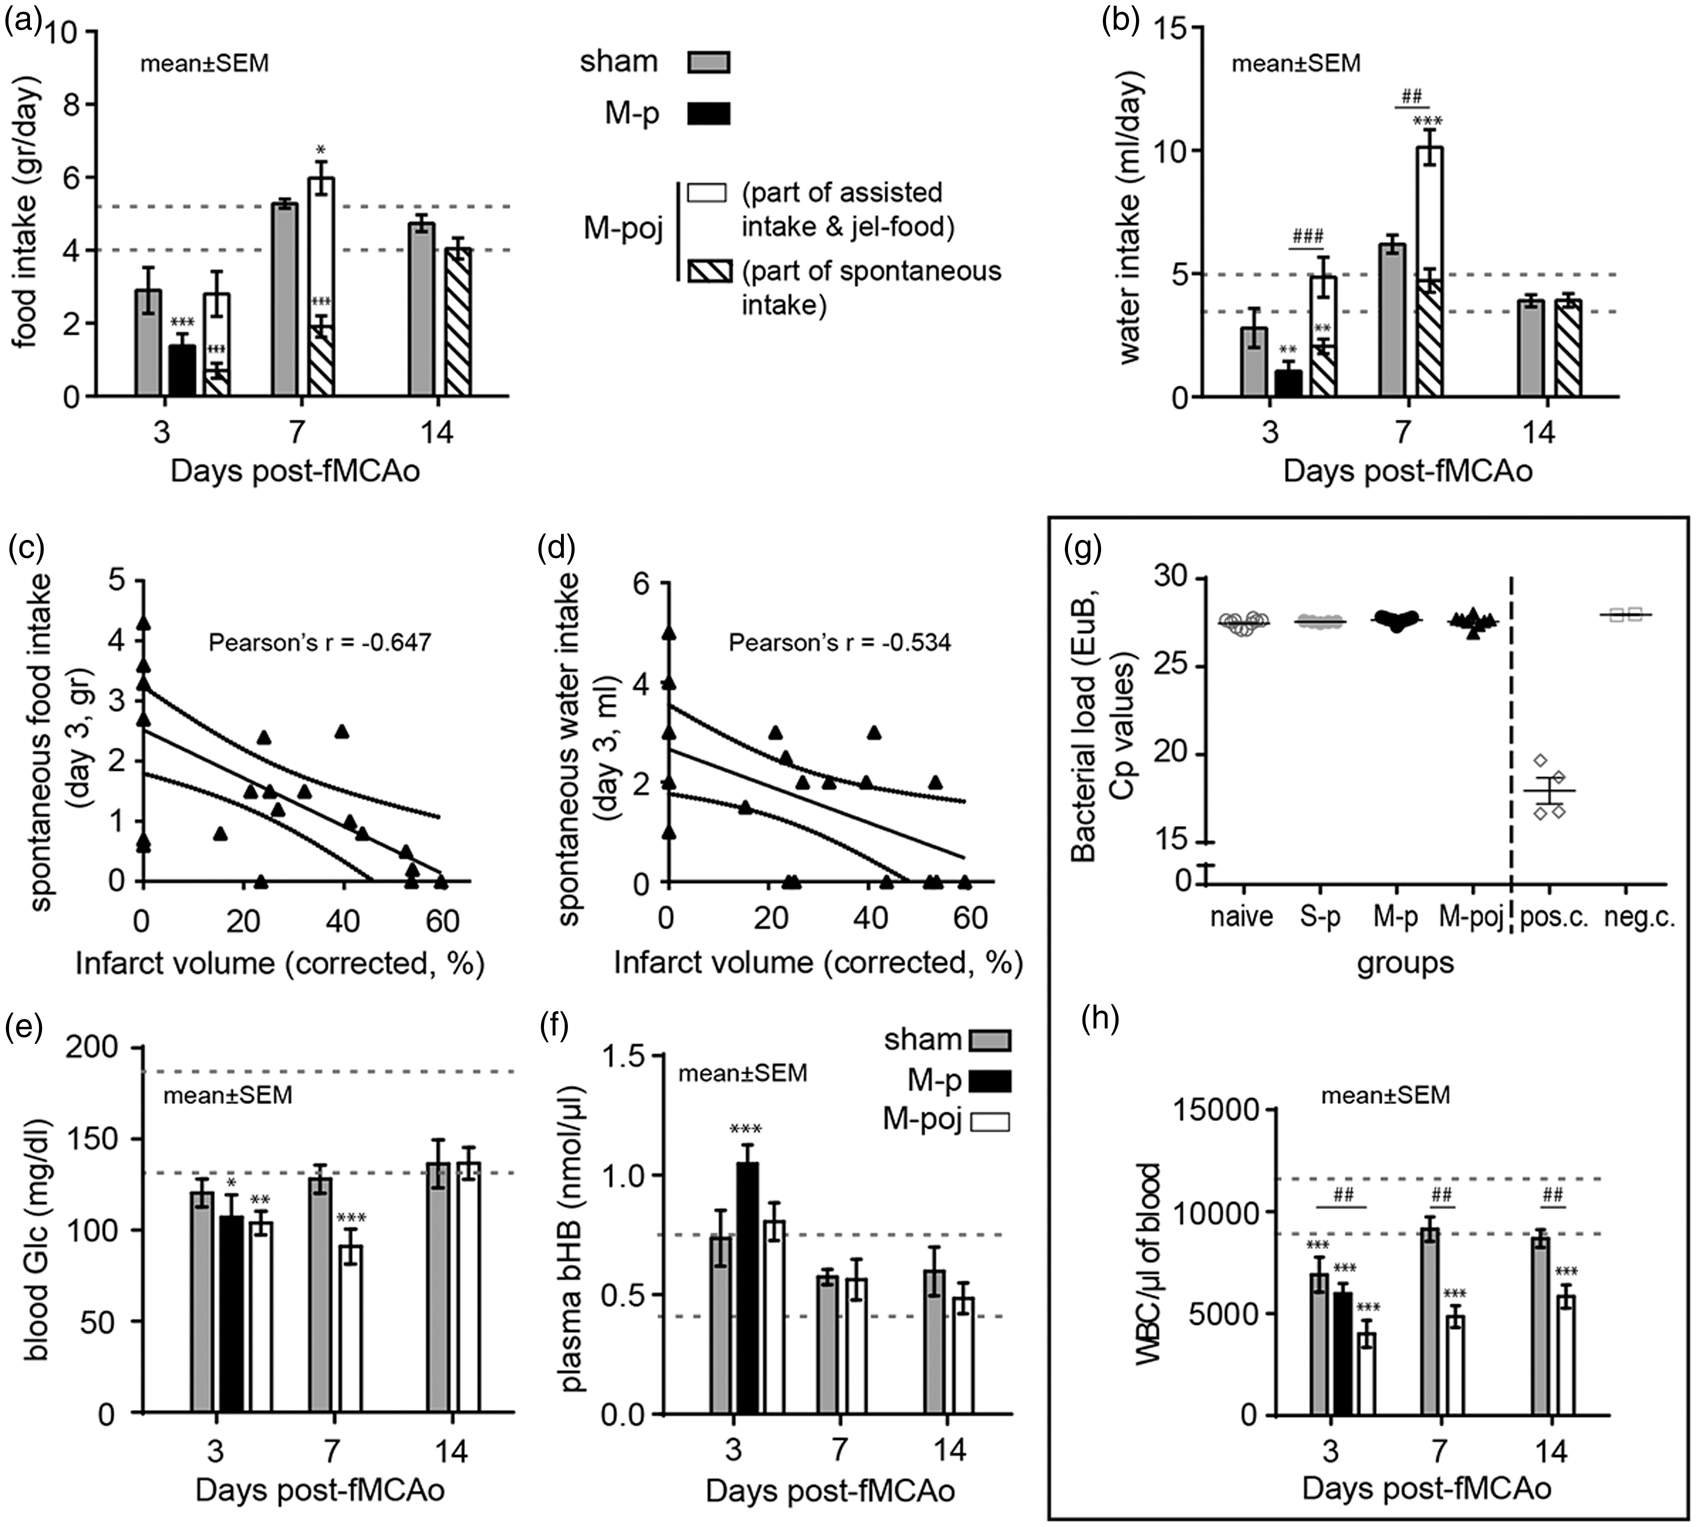
In addition to reducing food intake, fMCAo induced low blood glucose levels in mice. The surgical procedure alone (i.e. the sham control mice; S-p) caused a slight but non-significant transient reduction in blood glucose on day 3 (p > 0.05 versus naïve; Figure 5(e)). Ischemia induced a more robust decrease in blood glucose, which was evident on day 3 in both the M-p and M-poj groups (p < 0.05 versus naïve mice) and was sustained through day 7 in the surviving mice in the M-poj group (p < 0.001 and p < 0.04 versus naïve and S-p, respectively; Figure 5(e)). Similarly, bHB levels increased on day 3 in the M-p group compared with naïve animals (p < 0.005; Figure 5(f)), suggesting compensatory production of ketone bodies to provide energy. This response at day 3 was not present in the mice that received maximal nutritional support; the bHB levels in the M-poj mice were similar to the levels measured in both S-p and naïve mice (Figure 5(f)). Beginning on day 7, the bHB levels in both the S-p and M-poj groups were the same as in naïve mice. Taken together, these data show that providing maximal nutritional support provides—at least partially—the required cellular substrates (e.g. carbohydrates, fats, and proteins), thereby eliminating the need for a compensatory increase in bHB levels.
Bacterial load in the lungs of deceased animals
To investigate whether animals died from pneumonia, 23 we analyzed the bacterial load in the lungs by rtPCR. With this quite sensitive technique, we could not detect any bacteria in the lungs of our animals (Figure 5(g)). These data demonstrate that pneumonia was not the cause of death during the current experiments.
White blood cells counts and relative changes in immune subpopulations
Finally, we measured the absolute counts of WBCs to examine the presence or absence of post-stroke immune depression and/or sepsis (Figure 5(h)). We found that all fMCAo animals had significantly low WBC counts on day 3, suggesting post-stroke immune depression and not sepsis. The post-stroke immune depression (low WBCs) was still present in M-poj animals on day 7 and 14, while it had reverted to normal levels for sham-operated mice. In addition, neutrophils (CD11b + Ly6Ghi cells) did not differ between the fMCAO and sham operated animals on day 3 (Supplementary Figure 3), a finding that was against septic neutrophilia in the fMCAo groups. No similar analysis was possible after day 3 for the control fMCAo animals (M-p group), due to high mortality between day 3 and 7.
Locomotion
Our analysis of locomotion in an open field arena revealed that locomotor activity was reduced on post-surgery days 3 and 7 (Figure 6). The high mortality rate in the M-p group precluded any analysis beyond day 3 (thus, no representative animals are shown in Figure 6(a) for the M-group on day 7 or 14). Our analysis of total distance traveled (Figure 6(c)), total velocity, total body movement (Figure 6(d)), and total mobility revealed that these parameters were reduced by more than 50% in the S-p, M-p, and M-poj groups (expressed as percent change relative to the respective baseline values) on day 3, remained reduced by day 7 (for S-p and M-poj), and recovered by day 14. A subanalysis of animal mobility, visits, and time spent per zone revealed similar changes on days 3 (S-p, M-p, and M-poj) and 7 (S-p and M-poj), with recovery by day 14 (S-p and M-poj). Thus, the reduced post-operative locomotion was transient, recovered by day 14, and was attributed primarily to the experimental surgical procedures, as reflected by the similarities between the sham and fMCAo groups. Last, the finding that locomotion was reduced to a similar extent in the S-p and M-p groups—despite a striking difference in mortality rate between these two groups—suggests that mortality and low locomotion are not correlated.
Locomotor activity in the S-p, M-p, and M-poj groups (experiment 2; see Figure 1). (a) Cumulative heat maps depicting the time spent by each animal in the open field arena at baseline and on days 3, 7, and 14 following fMCAo or sham surgery. Note that data were not available for the M-p group on days 7 and 14, as 9 of the 11 animals died prior to this time point. (b) Schematic diagram depicting the open field arena used together with Ethovision software. The open zone in the middle, four walls, and four corners (“+”) are indicated. (c,d) Percent change in total distance covered (c) and percent change in movement (d) relative to baseline (0%) for the indicated groups at the indicated times following fMCAo or sham surgery. Note that the high mortality rate in the M-p group precluded analysis after day 3. *p < 0.05 versus baseline.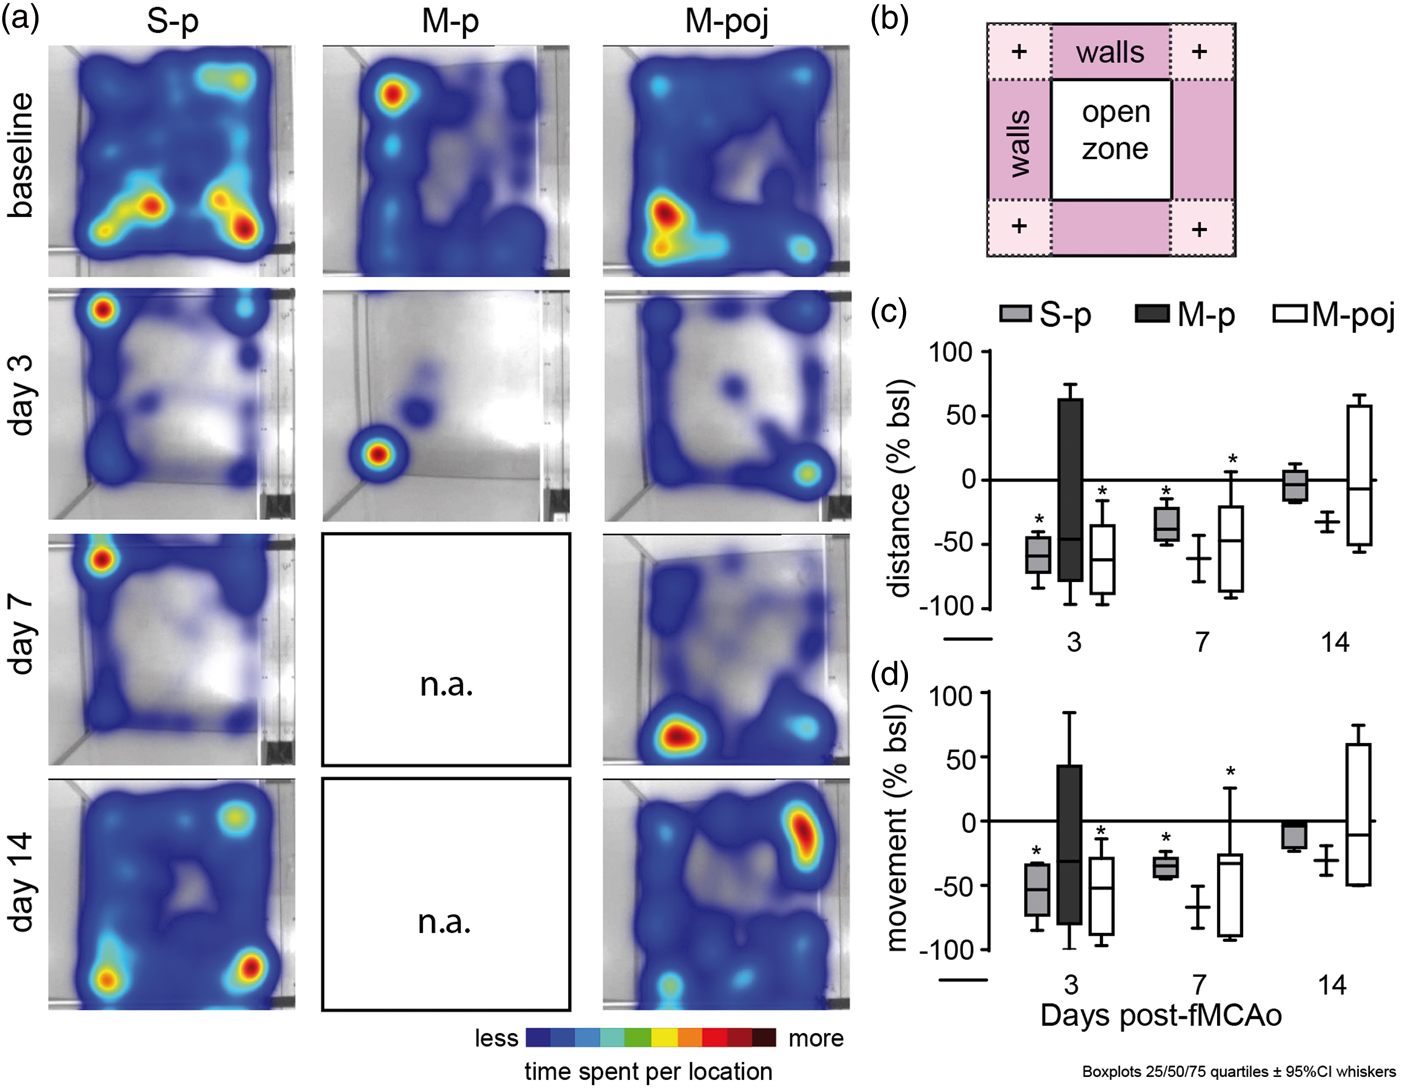
Discussion
Maximal nutritional support protocol (“mouse post-stroke care”).
Ischemic stroke has been extensively studied in both rats and mice. However, mouse models are preferred because of the ability to perform genetic manipulation, which allows researchers to study the underlying molecular mechanisms. Moreover, experimental stroke in mice recapitulates most of the pathophysiology of ischemic stroke in humans, specifically with ischemia times larger than 60 min, which induce large cortico-striatal infarcts together with significant focal neurological deficits. 3 However, in mice, fMCAo causing cortico-striatal infarcts and subsequent severe neurological deficits has a high mortality rate of 30–90%, particularly in animals that have a large infarct, thereby biasing the experimental data toward animals with a smaller striatal lesion.12,13,23,24 To date, the mechanisms underlying post-stroke mortality have been attributed either to the infarct itself12,13,24 or to post-stroke infection. 23 Consequently, in many studies, a reduction in mortality is considered to reflect neuroprotection.10,23 An additional downside of the high mortality rate when using the fMCAo model is that mortality has been regarded to be an inherent artifact of the large infarct size produced with this model. Accordingly, researchers have reduced the level or the time of ischemia—and thus, infarct size—to improve long-term survival. However, this approach results in fewer acute—and nearly absent chronic—functional impairments,25,26 thereby further reducing the translational potential of the model.
Here, we investigated the mechanisms that underlie the high mortality rate associated with fMCAo in mice. Our study was based on the finding that the mortality rate among stroke patients is reduced by the application of general post-stroke care such as nutritional/fluid support and control of body temperature, which can minimize the systemic effects of stroke. 27 Based on this observation, we hypothesized that fMCAo-associated mortality may be attributed to systemic processes that arise secondary to the stroke event. Indeed, we found that mice do not consume an adequate amount of food and water following fMCAo, leading to a metabolic phenotype that resembles fasting and results in significant weight loss and death. Specifically, post-fMCAo mice consumed less water, carbohydrates, proteins, and lipids and consequently developed low blood glucose levels, increased plasma Na+ levels, and low hematocrit values, which are clinical indications of hypoglycemia and dehydration. Low serum glucose triggered ketonemia 19 due to the animal’s attempt to produce energy through glycogenolysis and gluconeogenesis via lipolysis and proteolysis, consistent with previous reports. 28 Both the lipolytic and proteolytic processes ultimately result in increased fat and muscle catabolism, processes that lead to a reduction of fat and muscle mass in post-fMCAo mice. 14 Together, these processes lead to severe loss of body weight and, in combination to the severe, sustained hypothermia observed in our study, appear to be sufficient to significantly increase mortality within 7 days of fMCAo. Thus, we conclude that inadequate food and water intake—not the infarct itself—is the predominant mechanism underlying fMCAo-associated mortality in mice.
The cause of reduced food and water intake following stroke is poorly understood. Interestingly, we found that even sham surgery (i.e. without fMCAo) resulted in a significant decrease in locomotion, reduced food intake, decreased body weight, and hypothermia, particularly during the first 3 days following surgery. These observations suggest that anesthesia, surgery at the neck, and ligating the common carotid artery are sufficient to induce post-operative disability that ultimately results in reduced locomotion and reduced body weight. The addition of focal cerebral ischemia to the surgery did not further reduce locomotion, but further aggravated and prolonged body weight loss and hypothermia. Possible explanations for these findings are that surgery alone causes a systemic cytokine release resulting in a general sickness behavior characterized by reduced locomotion, hypothermia, and reduced food and water intake.29,30 When surgery is followed by cerebral ischemia the sequels of brain damage further aggravate and prolong the general sickness behavior described above. Underlying mechanisms are—among others—suggested to be reduced food intake due to limb paresis, malabsorption due to reduced intestine mobility, 31 anorexia triggered by brain injury–induced aseptic inflammation, 30 impaired hypothalamic temperature regulation,32,33 and reduced muscle thermogenesis due to low blood glucose levels. 34 This suggests that ischemia-specific sequels together with the effects of surgery and anesthesia drive the loss of body weight and hypothermia after fMCAo, which finally result in death of the most severely affected animals.
Given that nutritional support after fMCAo reduced the 14-day mortality rate from 60% to 15%, we conclude that fMCAo-associated mortality in mice is primarily driven by anorexia and a sequential lack of adequate food and water intake. The degree of anorexia and the decrease in body weight positively correlated with infarct size, suggesting that the degree of brain damage drives this process.32,33 As a proof-of-concept, appropriate nutritional support of these animals reduced their mortality by at least 70%.
Pneumonia was suggested as an alternative mechanisms for post-fMCAo mortality. 23 Depending on the vendor, the strain used, and the hygiene status of the mice before fMCAo, this may be a viable explanation; however, in the current study, we did not detect any signs of pneumonia or other infections in our C57BL/6 animals. Thus, we ruled out pneumonia or sepsis as a cause of death in our experiments, in agreement with previous studies. 29
The key advantage of post-fMCAo nutritional support is that it significantly increases the long-term survival of mice subjected to 60 min of MCAo, a model that is associated with severe and easily measurable neurological deficits. Thus, experiments that use nutritional support will enable researchers to assess clinically relevant long-term neuroprotective effects on behavior and infarct size in animals with minimal mortality, thereby providing a more realistic model of stroke in patients. 35 Importantly, our results demonstrate that the mortality of animals with a large stroke is caused mainly by anorexia, a secondary process that is systemic and largely preventable. Thus, our data dissociate mortality from ischemic brain damage and suggest that fMCAo-associated mortality should be considered a separate, independent process. This is particularly important, as it dissociates increased survival from neuroprotection. 10 This implies that any treatment cannot be considered neuroprotective if it does not reduce the primary lesion, regardless of the treatment’s effect on mortality and/or systemic stroke sequelae. Furthermore, post-stroke nutritional support minimizes the mortality-related bias when using the fMCAo model, allowing researchers to perform chronic studies of large and/or severe cortico-striatal infarcts, thereby uncovering the underlying pathophysiological mechanisms. Finally, our study helps to bridge the gap between one of the most commonly used preclinical stroke models—the fMCAo model in mice—and clinical practice.1,27 Thus, any new therapeutic intervention that shows promise in our experimental approach will have an increased likelihood of successfully translating to the clinic and may facilitate our understanding of ischemia-related processes and co-morbidity. For example, post-stroke care in experimental models may provide a platform for the translational study of post-stroke infection, 23 post-ischemic hypothermia, 36 post-stroke weight loss and the obesity paradox, 37 and long-term complications such as post-stroke dementia and depression. 38
In conclusion, we report that stroke–induced mortality in mice is primarily caused by anorexia and can be significantly reduced by post-stroke nutritional support. Therefore, the application of post-stroke care in preclinical studies fulfills one of the prerequisites of translational models of animal stroke 8 and facilitates long-term animal studies of large strokes. Future preclinical multicenter studies7,8 that combine our protocol with models of stroke co-morbidity and drug testing may help bridging the gap between experimental and clinical stroke studies.
Footnotes
Funding
The author(s) disclosed receipt of the following financial support for the research, authorship, and/or publication of this article: Marie-Curie IntraEuropean Fellowship Grant (FP7-PEOPLE-2013-IEF, project number 625970).
Acknowledgments
The authors would like to thank Dr. Vikram Singh for provision of EuB and MIB primers.
Declaration of conflicting interests
The author(s) declared no potential conflicts of interest with respect to the research, authorship, and/or publication of this article.
Authors' contributions
AL (Athanasios Lourbopoulos) designed the study, performed the experiments, analyzed the data, and wrote the manuscript; UM performed the fMCAo surgeries; SR performed FACS analyses; MB and JS provided animal support; AL (Arthur Liesz) helped writing the manuscript; FH provided critical feedback; NP designed the study and edited the manuscript.
References
Supplementary Material
Please find the following supplemental material available below.
For Open Access articles published under a Creative Commons License, all supplemental material carries the same license as the article it is associated with.
For non-Open Access articles published, all supplemental material carries a non-exclusive license, and permission requests for re-use of supplemental material or any part of supplemental material shall be sent directly to the copyright owner as specified in the copyright notice associated with the article.