
Abstract
Glucose hypometabolism in the pre-clinical stage of Alzheimer’s disease (AD) has been primarily associated with the APOE ɛ4 genotype, rather than fibrillar β-amyloid. In contrast, aberrant patterns of metabolic connectivity are more strongly related to β-amyloid burden than APOE ɛ4 status. A major limitation of previous studies has been the dichotomous classification of subjects as amyloid-positive or amyloid-negative. Dichotomous treatment of a continuous variable, such as β-amyloid, potentially obscures the true relationship with metabolism and reduces the power to detect significant changes in connectivity. In the present work, we assessed alterations of glucose metabolism and metabolic connectivity as continuous function of β-amyloid burden using positron emission tomography scans from the Alzheimer’s Disease Neuroimaging Initiative study. Modeling β-amyloid as a continuous variable resulted in better model fits and improved power compared to the dichotomous model. Using this continuous model, we found that both APOE ɛ4 genotype and β-amyloid burden are strongly associated with glucose hypometabolism at early stages of Alzheimer’s disease. We also determined that the cumulative effects of β-amyloid deposition result in a particular pattern of altered metabolic connectivity, which is characterized by global, synchronized hypometabolism at early stages of the disease process, followed by regionally heterogeneous, progressive hypometabolism.
Keywords
Introduction
The recent advent of positron emission tomography (PET) tracers for noninvasive quantification of β-amyloid deposits in human brain has dramatically improved our ability to explore potential relationships between β-amyloid burden and other biomarkers of Alzheimer’s disease (AD).1–3 The inverse relationship between fibrillar β-amyloid plaque load and regional glucose metabolism is particularly intriguing,4–6 and recent studies have interrogated the complex relationship between β-amyloid, metabolism, and genotype.3,7–11 Jagust and Landau 7 reported that the apolipoprotein E ɛ4 (APOE ɛ4) status, and not aggregated fibrillar β-amyloid, contributes to glucose hypometabolism in cognitively normal, elderly subjects. This observation has been confirmed in a population of subjects with mild cognitive impairment (MCI). 12 Lehmann et al. 8 demonstrated that APOE ɛ4 carriers with AD showed a comparable degree of temporal-parietal hypometabolism, but greater medial temporal hypometabolism, in the presence of a lower cortical β-amyloid burden relative to that found in age-matched, APOE ɛ4 non-carriers. In contrast, Lowe et al. 9 did not observe any significant differences in glucose metabolism between cognitively normal APOE ɛ4 carriers and noncarriers.
While these previous studies have focused on measures of regional glucose metabolism, the assessment of metabolic connectivity in AD has also received particular attention.13–18 In their seminal article, Horwitz et al. 13 introduced the concept of metabolic connectivity as a measure that evaluates across-subject correlations of glucose metabolism between different brain regions. Remarkably, it was demonstrated that correlation patterns based on [18F]FDG PET scans were consistent with anatomical network architecture, thereby validating the assertion that functional interactions reflect underlying anatomical pathways. 13 As such, evaluation of the relationship between β-amyloid burden, APOE ɛ4 genotype, and metabolic correlation patterns has recently gained attention. 12 Our group has demonstrated that decreased regional glucose metabolism is intimately linked to APOE ɛ4 carrier status in MCI subjects, while alterations in metabolic correlations are significantly related to the presence of fibrillar β-amyloid deposits and do not appear to be modulated by the APOE ɛ4 genotype. 12
One potential limitation of the aforementioned studies is the categorical classification (i.e., dichotomization) of subjects into “amyloid-low” (AβL) and “amyloid-high” (AβH) groups (note that we prefer this terminology, rather than “amyloid-negative” and “amyloid-positive” which requires neuropathologic confirmation). Such classification into subpopulations with different β-amyloid levels depends either on visual reads or the specification of a threshold/cutoff value that discriminates individuals according to the amount of tracer binding in a pre-defined, target region-of-interest (ROI).19–21 Notwithstanding the issues related to determination of an appropriate threshold value, the dichotomization of a continuous variable, such as β-amyloid, potentially masks physiologically relevant relationships and can yield invalid relationships between that variable and the outcomes of interest. For example, dichotomization of β-amyloid measurements could produce spurious, statistically significant effects on both glucose metabolism and metabolic correlations (false positives),22–24 or suggest the lack of an apparent relationship despite the fact that one may truly exist in the population under study (false negatives). Based on statistical theory, the cost of loss of measurement information due to the dichotomization of a single predictor in the context of multiple regression analysis translates into underestimated effect sizes and a reduction of power in statistical hypothesis tests.23,24 In practice, dichotomization of a quantitative variable with a linear effect yields a loss of one-fifth to two-thirds of the variance that may be explained in the original variables, with a corresponding loss of statistical power to detect a true, non-zero effect, which is effectively equivalent to discarding over one-third of the data.22–24
The categorization of continuous β-amyloid measurements potentially limits our capacity to understand the recently-reported dose-dependent effect of β-amyloid on metabolism, 9 particularly in the range where β-amyloid burden may be increasing at a rapid rate. Lowe et al. 9 demonstrated that an increase in β-amyloid, measured with Pittsburgh compound B (PiB), yielded a pronounced decrease (with a dose-dependent effect) in metabolism in 600 normal control (NC) subjects. This observation contrasts with the study of Jagust and Landau, 7 who observed no effect of β-amyloid, measured by [18F]florbetapir ([18F]AV-45) PET, in 175 NC subjects. Although there are a number of differences between these studies, the statistical approaches could underlie the contrasting results. While Jagust and Landau 7 dichotomized the β-amyloid measurements, Lowe et al. 9 employed four different categories to express the high variability of β-amyloid load across the whole sample. Given the potential methodological issues associated with dichotomization and categorization of continuous measurements, our current work seeks to exploit the continuous nature of the β-amyloid accumulation process and models β-amyloid as a continuous variable. Our goals are to re-assess the effects of β-amyloid burden and APOE ɛ4 status on both regional glucose metabolism and metabolic connectivity using a theoretically more powerful approach, and to quantify the differences between modeling approaches. As such, this study has been designed to test the extent to which the traditional subject dichotomization approach can limit our ability to detect significant effects of β-amyloid burden on glucose metabolism and metabolic connectivity. To this end, we have employed the general linear model (GLM) framework with linear-by-linear interaction terms, where the interaction term represents the combined (multiplicative) effect of β-amyloid and glucose metabolism in a particular brain region. In this study, we have assessed alterations of glucose metabolism and metabolic connectivity as functions of β-amyloid burden in 454 subjects with varying degrees of cognitive impairment participating in the Alzheimer’s Disease Neuroimaging Initiative (ADNI) study. The dichotomous and continuous models in this study are evaluated on three metrics, namely (1) statistical model fit, (2) power of each statistical model, and (3) significance of the effects.
Materials and methods
Subjects and image acquisition
Data used in the preparation of this article were obtained from the ADNI database (http://adni.loni.usc.edu). The ADNI was launched in 2003 by the National Institute on Aging (NIA), the National Institute of Biomedical Imaging and Bioengineering (NIBIB), the Food and Drug Administration (FDA), private pharmaceutical companies and non-profit organizations, as a $60 million, 5-year public private partnership, which has since been extended. The primary goal of ADNI has been to test whether serial magnetic resonance imaging (MRI), PET, other biological markers, and clinical and neuropsychological assessment can be combined to measure the progression of MCI and AD. Determination of sensitive and specific markers of very early AD progression is intended to aid researchers and clinicians to develop new treatments and monitor their effectiveness, as well as lessen the time and cost of clinical trials. ADNI is the result of efforts of many co-investigators from a broad range of academic institutions and private corporations, and subjects have been recruited from over 50 sites across the USA and Canada. To date, the ADNI, AND-GO, and ADNI-2 protocols have recruited over 1500 adults, aged 55–90, to participate in the research, consisting of cognitively normal older individuals, people with early or late MCI, and people with early AD. For up-to-date information, see www.adni-info.org.
The subjects of this study consisted of 454 subjects from the ADNI study who had available [18F]florbetapir PET, [18F]2-fluoro-2-deoxyglucose (FDG) PET, 3D T1-weighted anatomical MRI, and APOE genotyping. NC subjects had Mini-Mental State Exam (MMSE) scores between 24 and 30 inclusively, a Clinical Dementia Rating (CDR) of 0, and did not have depression, MCI, or dementia. Subjects classified as MCI included both early MCI (EMCI) and late MCI (LMCI) sub-categories. EMCI subjects had MMSE scores between 24 and 30 inclusively, CDR of 0.5, a reported subjective memory concern, an absence of dementia, an objective memory loss measured by education-adjusted scores on delayed recall of one paragraph from Wechsler Memory Scale Logical Memory II, essentially preserved activities of daily living, and no impairment in other cognitive domains. LMCI subjects had the same inclusion criteria, except for objective memory loss measured by education adjusted-scores on delayed recall of one paragraph from Wechsler Memory Scale Logical Memory II. AD subjects presented with MMSE scores ranging from 20 to 26 inclusively, a CDR of 0.5 or higher, and met the NINCDS/ADRDA criteria of the National Institute of Neurological and Communicative Disorders and Stroke and the Alzheimer’s Disease and Related Disorders Association for probable AD. 25
A detailed description of the ADNI MRI and PET image acquisition protocols can be found at http://adni.loni.usc.edu/methods. ADNI studies are conducted in accordance with the Good Clinical Practice guidelines, the Declaration of Helsinki, and U.S. 21 CFR Part 50 (Protection of Human Subjects), and Part 56 (Institutional Review Boards). This study was approved by the Institutional Review Boards of all of the participating institutions. Informed written consent was obtained from all participants at each site.
Image processing
MR and PET images were processed using the PIANO™ software package (Biospective Inc., Montreal, Canada). T1-weighted MRI volumes underwent image nonuniformity correction using the N3 algorithm, 26 brain masking, linear spatial normalization utilizing a 9-parameter affine transformation, and nonlinear spatial normalization to map individual images from native coordinate space to Montreal Neurological Institute (MNI) reference space using a customized, anatomical MRI template derived from ADNI subjects. The resulting image volumes were segmented into gray matter (GM), white matter (WM), and cerebrospinal fluid (CSF) using an artificial neural network classifier 27 and partial volume estimation. 28 The GM density map for each subject was transformed to the same final spatial resolution (i.e., re-sampled to the same voxel size and spatial smoothness) as the FDG PET data in order to account for confounding effects of atrophy in the statistical model. The cerebral mid-cortical surface (i.e., the midpoint between the pial surface and WM) for each hemisphere was extracted to allow for surface projection of PET data using a modified version of the CLASP algorithm. 29
The [18F]florbetapir and [18F]FDG PET images underwent several pre-processing steps, including frame-to-frame linear motion correction, smoothing with scanner-specific blurring kernels, and averaging of dynamic frames into a static image. The scanner-specific blurring kernels that were used to obtain isotropic spatial smoothing of 8 mm full-width at half-maximum (FWHM) across all PET data were based on the work of Joshi et al. 30 to reduce the between-scanner differences in the ADNI multi-center study. The resulting smoothed PET volumes were linearly registered to the subject’s T1-weighted MRI and, subsequently, spatially normalized to reference space using the linear and nonlinear transformations derived from the anatomical MRI registration. Voxelwise standardized uptake value ratio (SUVR) maps were generated from both [18F]florbetapir and [18F]FDG PET using full cerebellum and pons as reference regions, respectively.
Subject characteristic analysis
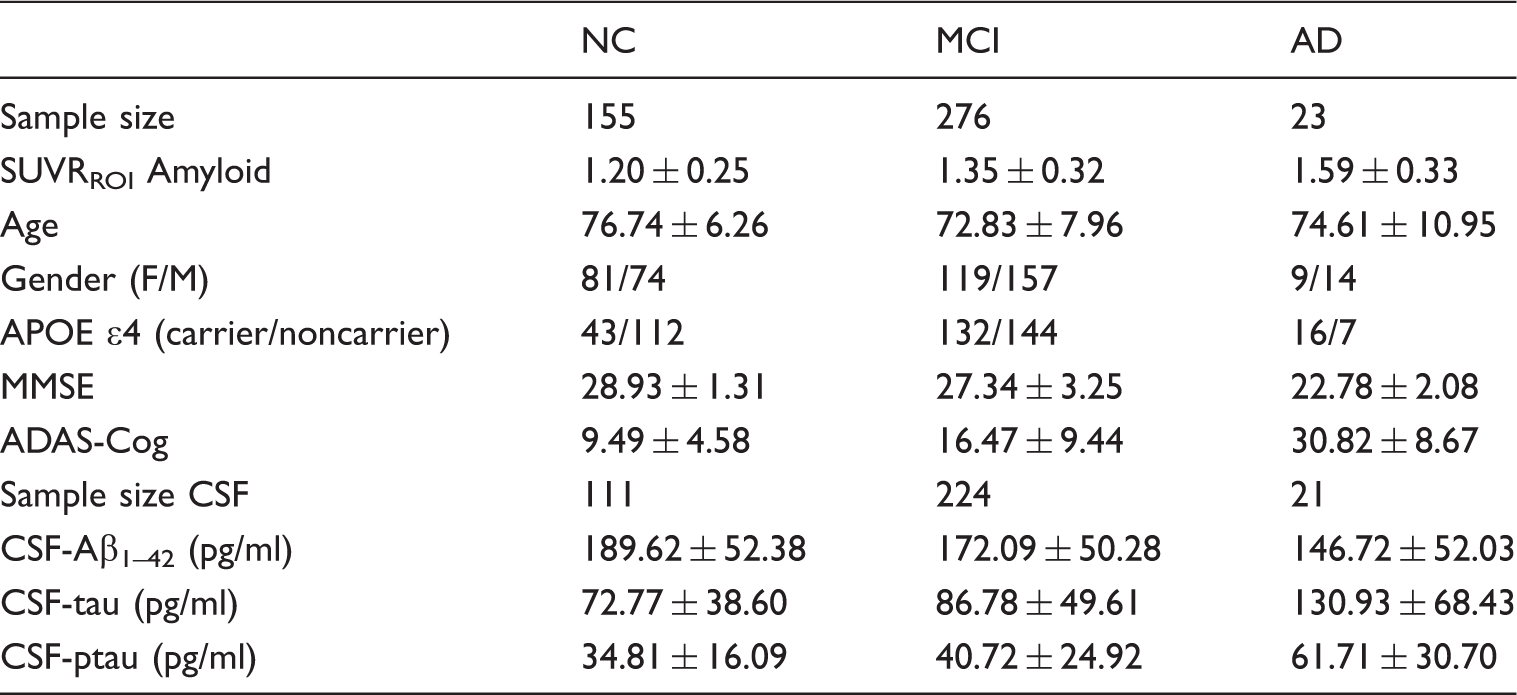
Summary of subject characteristics.
Dichotomous subject classification
For comparison to the proposed continuous model, a dichotomous classification of subjects was performed based on individual measurements of β-amyloid burden. The target ROI for SUVR measurement (SUVRROI) for the present work was the statistically derived ROI from our previous analysis of [18F]-florbetapir images from the same subjects. 31 Briefly, this iterative process is initiated by labeling subjects into low (AβL) and high (AβH) β-amyloid levels based on the global average SUVR. A voxelwise, regularized discriminant analysis (RDA) is then employed to identify an optimal target region for classification and receiver operating characteristic (ROC) analysis in order to identify the optimal threshold for classification. The RDA and ROC analyses are repeated until the subject classification converges. The resultant ROI consisted of bilateral regions of the precuneus and medial frontal cortex.
Voxelwise analysis of FDG SUVR
A voxelwise, analysis-of-covariance (ANCOVA) model that included FDG SUVR as dependent variable, age, gender, cognitive measurements (MMSE and ADAS-Cog) as global covariates, GM density as a voxelwise covariate, and β-amyloid burden (Amyloid), APOE ɛ4 status, and Amyloid × APOE ɛ4 status interaction as predictors-of-interest was assessed

The GM density was included as a covariate to minimize the potential confounding effect of inter-subject differences in brain atrophy. 32
Post hoc, two-tailed Student’s t-tests were performed to assess the main effects-of-interest and interaction terms. Two different variants of this model were evaluated. The first variant, reported previously, 12 treats Amyloid as a dichotomous variable resulting from the classification of subjects into AβL or AβH, as described above. In contrast, the second variant treats Amyloid as a continuous variable. The intent of these two variants was to show that dichotomization of the continuous variable Amyloid in the first variant could lead to spurious, statistically significant effects22–24 and/or fail to detect other statistically significant effects.
The voxelwise statistical analysis was performed using the SurfStat toolbox (http://www.math.mcgill.ca/keith/surfstat), where statistical maps were projected onto the cortical surface for visualization purposes only. The t-statistic maps corresponding to each effect-of-interest were thresholded using the false discovery rate (FDR) procedure (α = 0.05) to control for multiple comparisons. 33
Modulated, seed-based metabolic correlation analysis
The average FDG SUVR values were computed within several “seed regions” for each subject. These seeds were selected based on our previous metabolic connectivity analysis.12,17 These seeds were identified as hubs (i.e., highly correlated regions from the population analysis) located in the precuneus, fusiform gyrus, pars opercularis, supramarginal and angular gyri, inferior temporal gyrus, medial frontal cortex, and paracentral lobule. Each seed region consisted of a 6 mm-radius sphere centered at the anatomical location defined by stereotaxic coordinates.
The seed-based cross-correlation patterns were evaluated by the following interaction model


Over the range of Amyloid values, as a whole, our primary interest is the interaction term
In order to estimate metabolic correlations at any particular value of Amyloid, s, we utilized the t-test associated with the slope 
Model comparisons
The differences between the dichotomous and the continuous approaches were evaluated using the Akaike Information Criterion (AIC)
34

Results
Subject characteristics
The analysis of the subject characteristics revealed statistically significant differences in SUVRROI Amyloid measurements (F = 15.15, p < 0.001) among the three different clinical classification groups (NC, MCI, and AD), as well as between APOE ɛ4 carriers and APOE ɛ4 noncarriers (t = 10.01, p < 0.001). Strong, statistically significant correlations were found between SUVRROI Amyloid and MMSE (r =−0.29, p < 0.001), ADAS-Cog (r = 0.41, p < 0.001), CSF Aβ1-42(r = −0.72, p < 0.001), CSF tau (r = 0.52, p < 0.001), and CSF ptau (r = 0.55, p < 0.001).
We also identified statistically significant associations between the clinical classification and APOE ɛ4 status (χ2 = 23.94, p < 0.001), gender (χ2 = 3.81, p = 0.02), and age (F = 8.72, p < 0.001). The cognitive measures MMSE (F = 37.85, p < 0.001) and ADAS-Cog (F = 56.11, p < 0.001), as well as Aβ1-42 (F = 5.37, p = 0.0012), tau (F = 8.96, p < 0.001), and ptau (F = 8.22, p < 0.001), also showed statistically significant differences based on the clinical classification.
The SUVRROI threshold of 1.22 separated the sample into two populations (AβL and AβH), composed of 237 and 217 subjects, respectively. The SUVRROI values were highly correlated (r = 0.95) with the global average (over the whole cortex) SUVR. The average SUVRROI in the AβL and AβH groups was 1.05 ± 0.09 and 1.60 ± 0.21, respectively. The dichotomization accounts for only 75.7% of the variance explained in the continuous Amyloid variable measurements.
The average [18]FDG SUVR maps for the whole sample, as well as for the AβH and AβL groups, are shown in Supplementary Figure 1(a), (b) and (c), respectively. Note a clear reduction in metabolism in the AβH group relative to the AβL group, particularly in the medial prefrontal and posterior cingulate cortices. The average [18]florbetapir SUVR map corresponding to all subjects is shown in Supplementary Figure 1(d). Relatively higher levels of cortical uptake are observable in a number of cortical regions, including the cingulate gyrus, precuneus, parieto-temporal cortex, and frontal regions. Supplementary Figure 1(e) shows the distribution of the [18]florbetapir SUVRROI across the whole sample, as well as an estimation of the probability distribution functions for the AβL and AβH groups. A clear separation of both distributions is evident around the cutoff value of 1.22.
FDG SUVR versus Amyloid and APOE ɛ4 status
The main effects of β-amyloid and APOE ɛ4 status on FDG SUVR were assessed by statistical inference over the coefficients Main effect of β-amyloid on glucose metabolism under the continuous (a) and dichotomized variants (b) of Model (1). Statistically significant regions in (a) correspond to a decreasing glucose metabolism associated with increasing β-amyloid burden. The effect of β-amyloid burden on metabolism is not as evident in (b) due to the dichotomization of the Amyloid variable. (c, d) Main effect of APOE ɛ4 genotype on glucose metabolism for the continuous (a) and dichotomized (b) variants of Model (1). As expected, both variants produce almost identical statistically significant regions of APOE ɛ4 genotype effect. Results (a–d) are shown at an FDR-corrected threshold of 0.05. (e) AIC difference between the continuous and the dichotomous models. Positive values greater than 10 indicate the better model fitting of the continuous variant.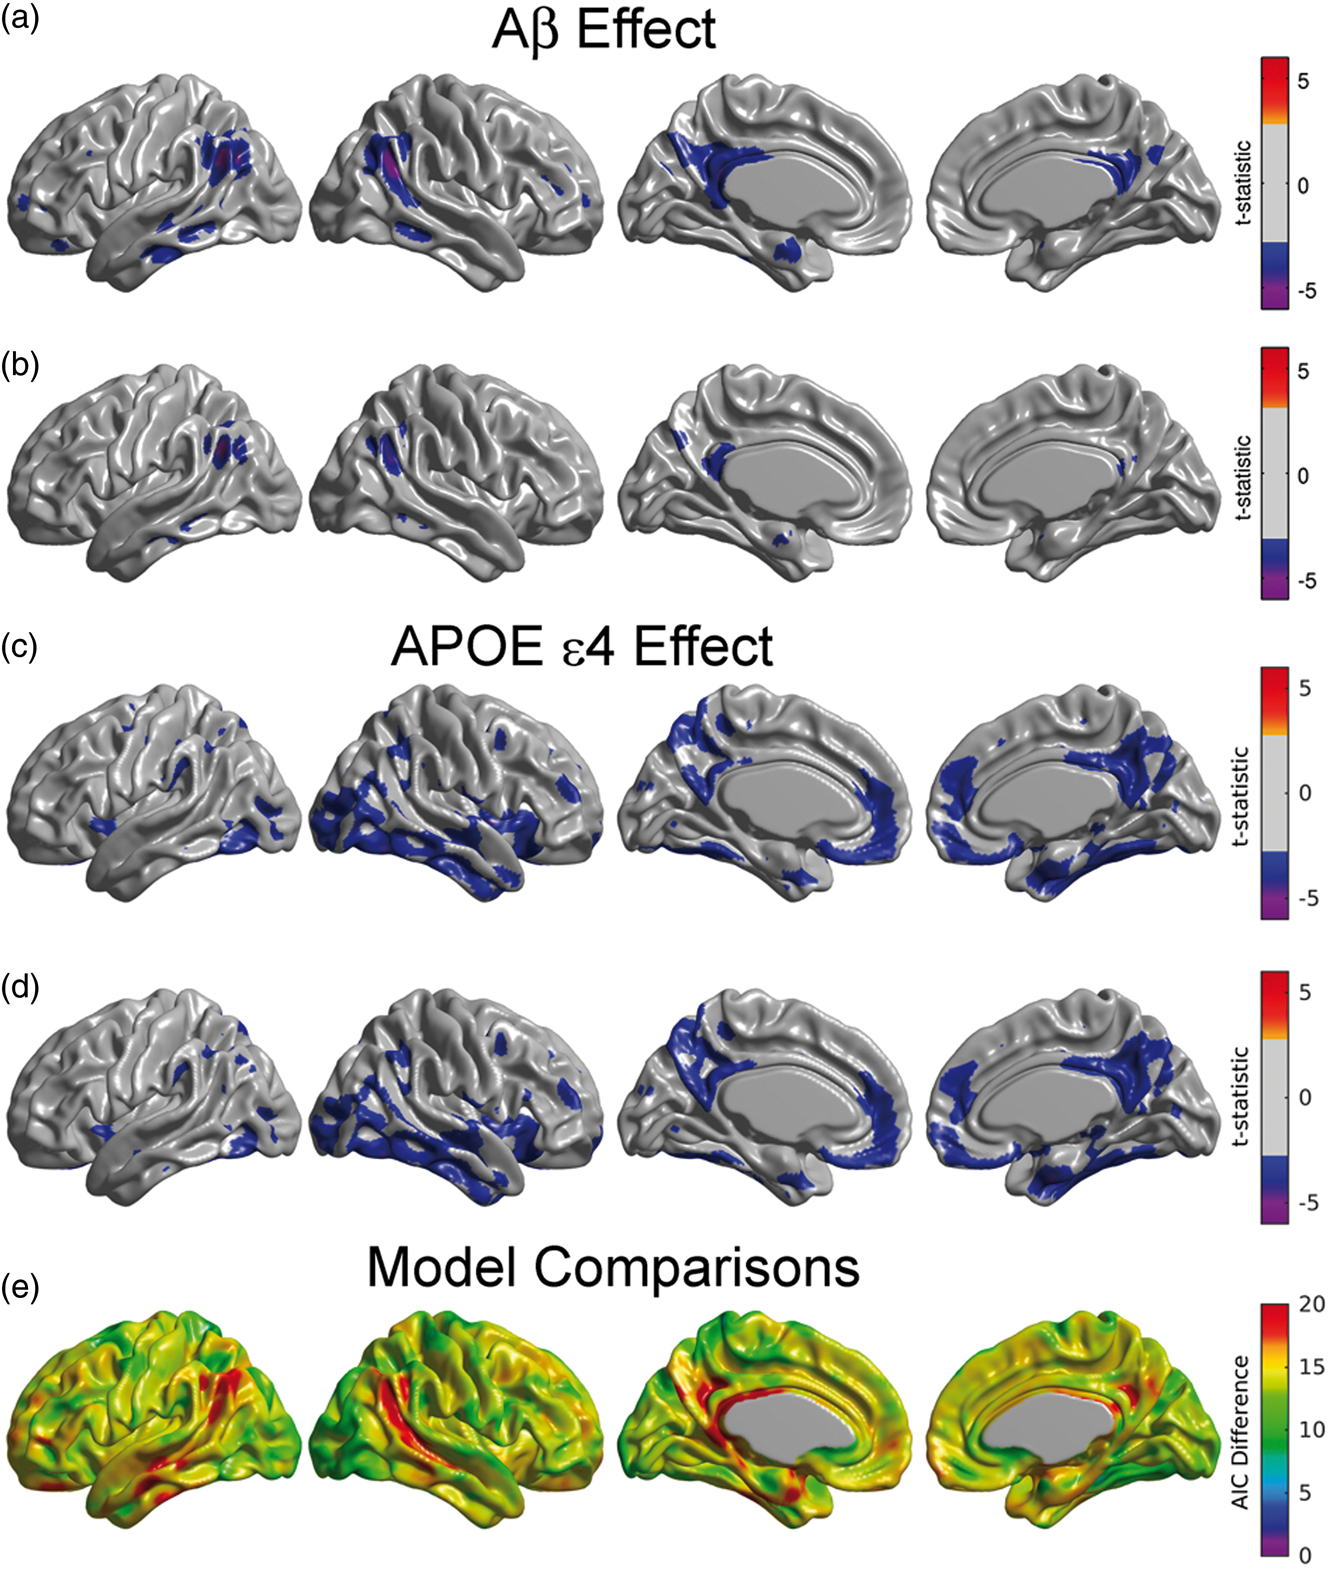
As expected, the effect of APOE ɛ4 status did not differ substantially when treating Amyloid as either a continuous (Figure 1(c)) or a dichotomous variable (Figure 1(d)). APOE ɛ4 carriers had significantly reduced glucose metabolism in a number of brain regions, including in the right lateral temporal and parietal lobes, bilaterally in the posterior cingulate/precuneus, entorhinal cortex, and regions of the medial frontal cortex (Figure 1(c) and (d)).
Figure 1(e) shows that the AIC values across the whole cortex for the continuous model were lower than for the dichotomous model, thereby providing evidence of a better model fit in the continuous variant. The largest differences were observed in the angular gyrus, extending to the middle temporal gyrus, and in the posterior cingulate cortex. The average of AIC difference over the set of common statistically significant regions was 17.2. For the voxels that were statistically significant in the continuous model, the AIC difference was 18.3.
We subsequently re-evaluated Model (1) with the continuous approach separately for each diagnostic group, as well as a combined NC/MCI cohort. There was no significant effect of Amyloid on metabolism for any of the individual sub-populations (Figure 2(a) to (c)). In contrast, we observed significant relationships between Amyloid burden and glucose metabolism in the angular gyrus and posterior cingulate cortex in the combined NC/MCI cohort (Figure 2(d) and (e)). These regions were similar to those observed across the whole sample (Figure 1(a)). It should be noted that the sample size for the AD cohort was relatively small, which could account for the lack of significance in this group.
(a–c) Unthresholded statistical effects of β-amyloid on glucose metabolism corresponding to NC, MCI, and AD subpopulations. No statistically significant effect of β-amyloid was detected in any of the three cohorts. (d) Unthresholded statistical effect of β-amyloid on metabolism for a combined cohort of NC and MCI subjects. (e) Thresholded t-statistic maps for this combined cohort show statistically significant regions of glucose hypometabolism associated with increasing β-amyloid burden (FDR-corrected threshold at 0.05).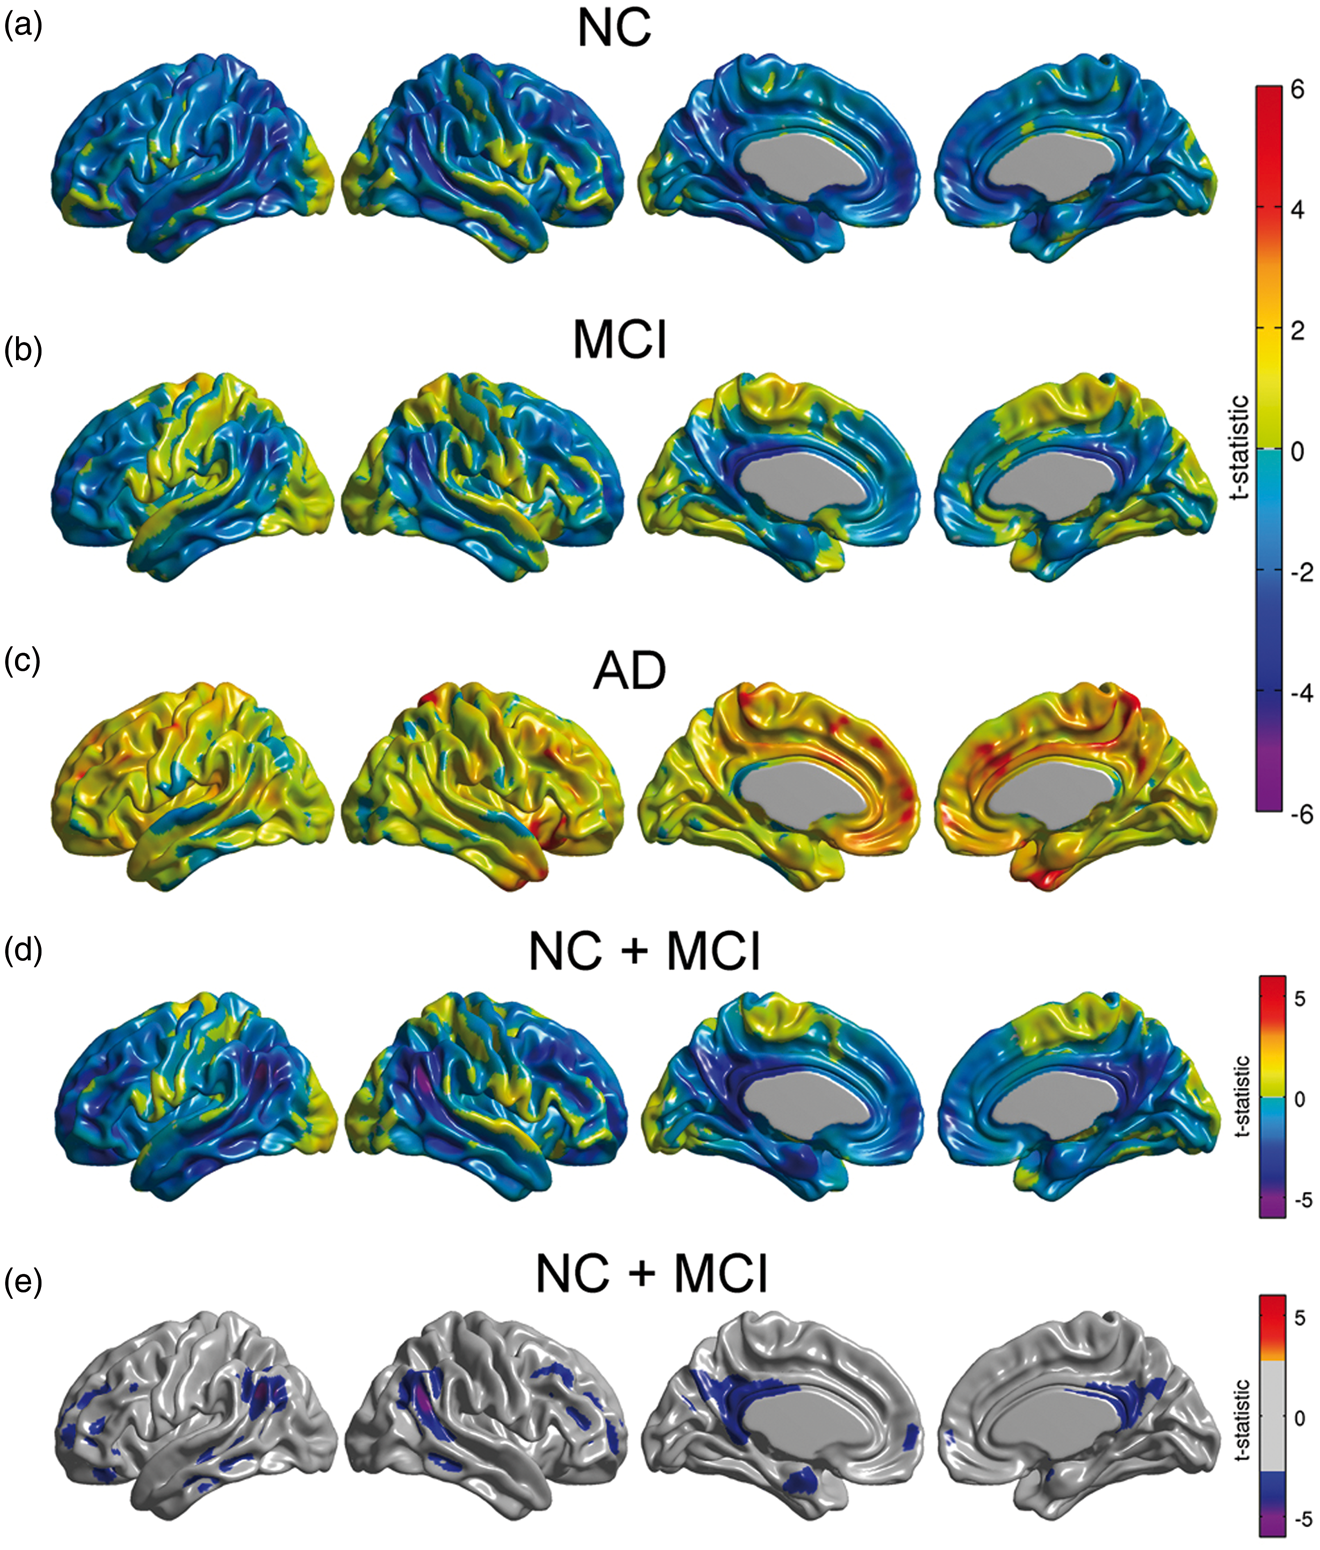
Metabolic correlations
Modulation of seed-based metabolic correlations by Amyloid was analyzed with the Interaction Model (2). In this model, the term
For illustrative purposes, we only present the results from the right angular seed region. Although not presented here, the metabolic slopes/correlations corresponding to the inferior temporal gyrus, fusiform gyrus, right frontal gyrus, right precuneus, right posterior temporal gyrus, and left angular gyrus seeds also showed significant modulation by β-amyloid. When treating Amyloid as a continuous variable, we observed statistically significant, negative values of (a) Regions where the interaction between the right angular seed and β-amyloid burden showed statistically significant correlation with glucose metabolism. Significant negative values should be interpreted as those regions where the seed-based metabolic slopes decrease with increased β-amyloid burden. (b) Significant differences between AβL and AβH groups for right angular gyrus-based slopes under the dichotomous variant of Model (1). The statistically significant regions are more spatially extended using the continuous variant compared to the dichotomous variant. (c) There is no main effect of APOE ɛ4 genotype on right angular gyrus-based slopes. Results (a–c) are shown at an FDR-corrected threshold of 0.05. (d) AIC difference between the continuous and the dichotomous models shows overall better model fitting for the continuous variant.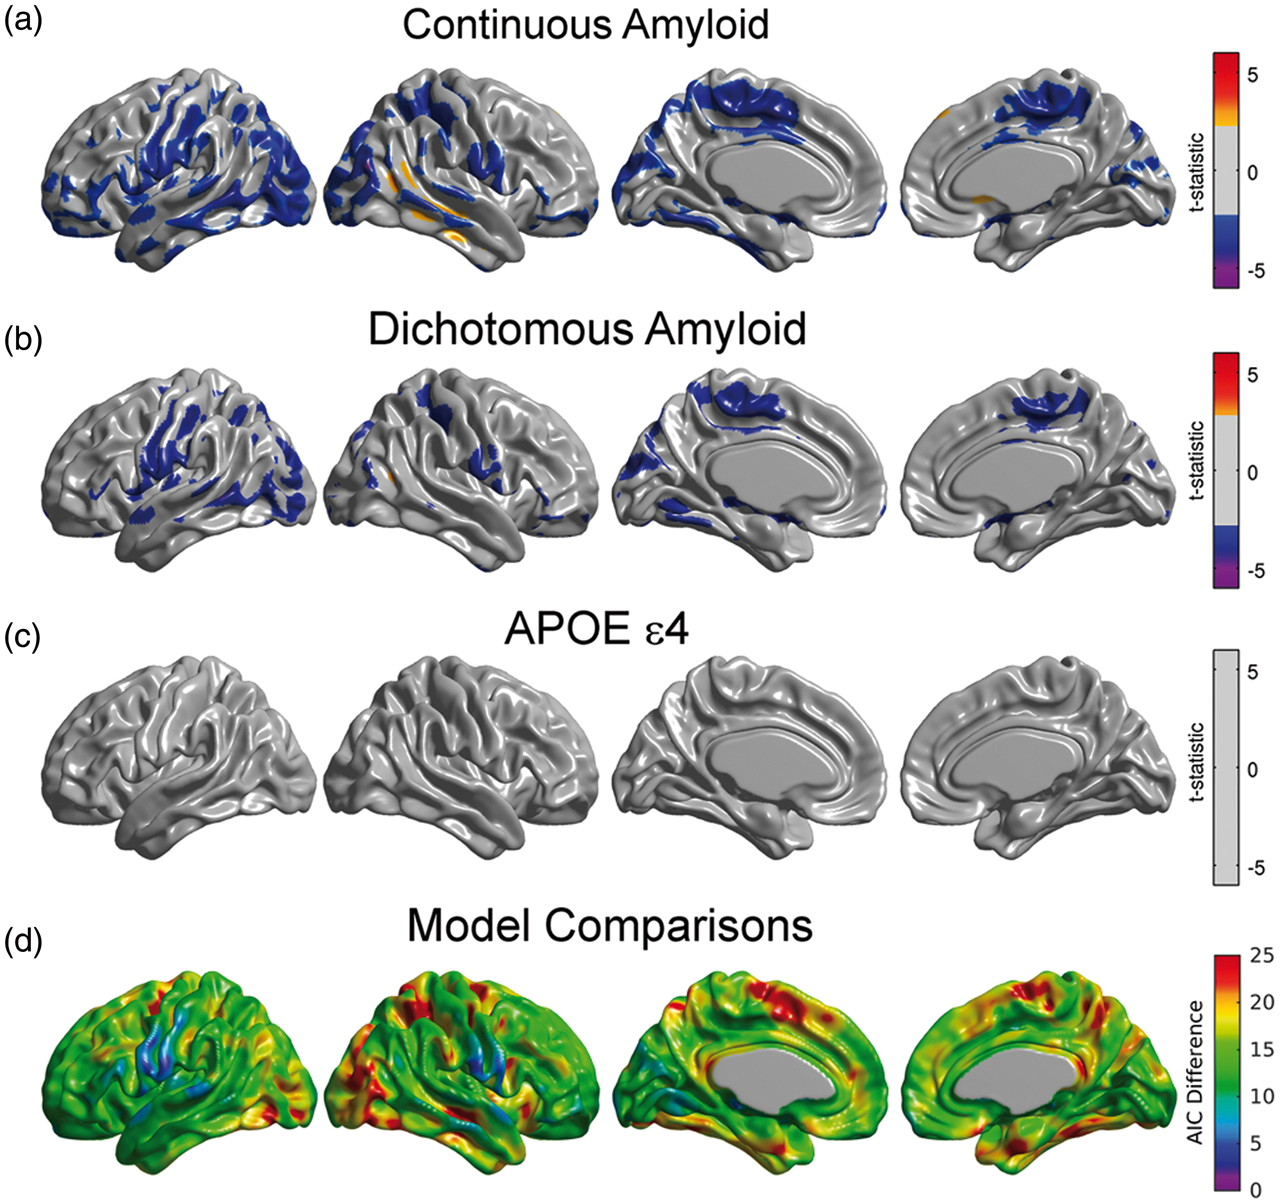
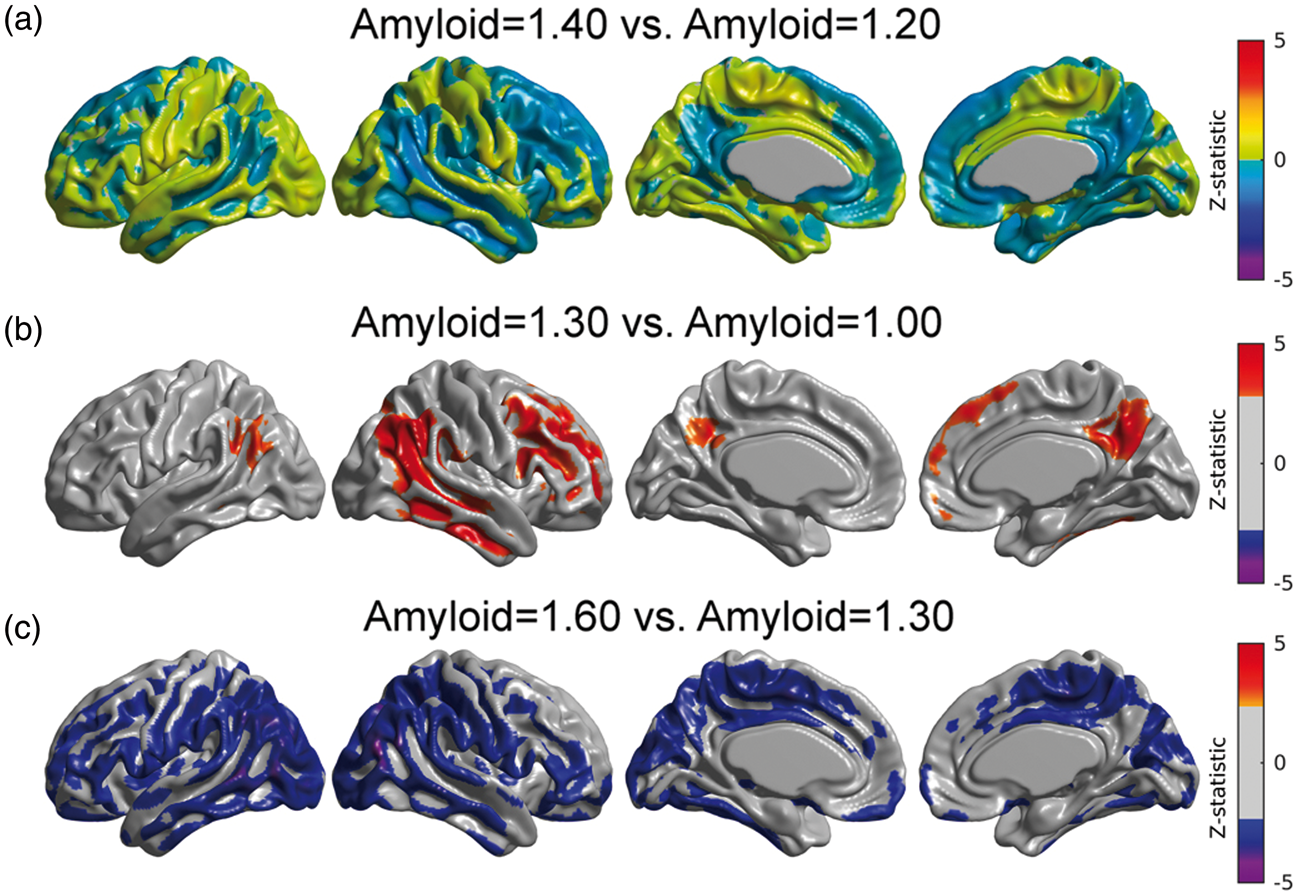
Using equation (3) in conjunction with Model (2), we illustrate the metabolic correlation patterns at three different values of Amyloid (SUVR = 1.00, 1.30, and 1.60; Figure 4(a), (b), and (c), respectively). We observed a Gaussian-shaped pattern of metabolic correlations across a number of target regions (Figure 4(d)). The right angular gyrus-based correlations increase from Amyloid = 1.00 to Amyloid = 1.30, followed by a decrease from Amyloid = 1.30 to Amyloid = 1.60 (Figure 4(a) to (c)). Three of the five correlation curves in Figure 4(d) correspond to seed target regions in the left fusiform gyri, right paracentral lobule, and left pars opercularis, which were regions of statistically significant decrease in metabolic slopes (Figure 3(a)). The other two curves correspond to seed target regions in the right posterior cingulate cortex and entorhinal cortex, where no significant change in metabolic slope relative to the increase of β-amyloid burden was observed. The peak of maximum correlation in these five curves occurred at Amyloid = 1.29, 1.31, 1.27, 1.31, and 1.31, respectively. The peak of maximum correlation is different for each target voxel, with an average (over the cortex) of 1.30 ± 0.07. As such, we illustrate the overall changes in metabolic correlations relative to Amyloid = 1.30 in Figure 4. The statistical comparisons between metabolic correlations at different values of Amyloid are shown in Figure 5. Figure 5(a) shows no statistically significant differences between metabolic correlations at Amyloid = 1.20 and Amyloid = 1.40, which are symmetric points around the “peak” Amyloid = 1.30. Figure 5(b) shows large regions of right angular seed-based differences between the metabolic correlations at Amyloid = 1.00 and Amyloid = 1.30. The statistically significant increase in correlations is primarily observed locally at the right angular gyrus seed and extends to the temporal gyrus, as well as between the seed and the left angular gyrus, right temporal-frontal cortex, and bilateral posterior cingulate cortex. The areas of statistically significant decreases in metabolic correlations from Amyloid = 1.30 to Amyloid = 1.60 (Figure 5(c)) include extended regions of the bilateral middle temporal gyrus, paracentral lobule, and parietal and posterior cingulate cortices. Thus, the SUVR value of 1.30 can be interpreted as a cutoff point that clearly differentiates two different patterns of changes in metabolic correlations along the spectrum of β-amyloid. The increase in metabolic correlations below SUVR Amyloid = 1.30 can potentially be explained by a globally synchronized decrease in metabolism at early, “pre-deposition” stages of increased β-amyloid brain concentrations, followed by more regionally-specific rates of metabolic decreases with higher levels of aggregated β-amyloid deposits. This idea is supported by Supplementary Figure 2(a) and (b), which shows the t-statistic maps relative to the association, according to Model (1), between FDG SUVR and β-amyloid for Amyloid ≤ 1.30 and Amyloid > 1.30, respectively. Although not statistically significant, an overall negative association can be seen in individuals with Amyloid ≤ 1.30, in contrast to a more restricted and regionally specific negative association in individuals with Amyloid > 1.30.
(a–c) Estimated right angular seed correlations at three different values of the Amyloid variable. The black arrows indicate the anatomical location of the seed placed at the right angular gyrus (RANG). (d) Metabolic correlations as a continuous function of the β-amyloid burden for different target locations: left fusiform gyri (LFUSI), right paracentral lobule (LPCL), left pars opercularis (LOPER), right entorhinal cortex (RENT), and right posterior cingulate cortex (RPCC). Note the evident change in correlation patterns around Amyloid = 1.30. Comparison between metabolic correlations at different Amyloid values. (a) No statistically significant differences in correlations between Amyloid = 1.40 and Amyloid = 1.20, which are symmetric points around the peak (Amyloid = 1.30). (b) Statistically significant regions where right angular gyrus-based metabolic correlations increase from Amyloid = 1.00 to Amyloid = 1.30. (c) Significant decreases in correlations from Amyloid = 1.30 to Amyloid = 1.60. Results (b, c) are shown at an FDR-corrected threshold of 0.05.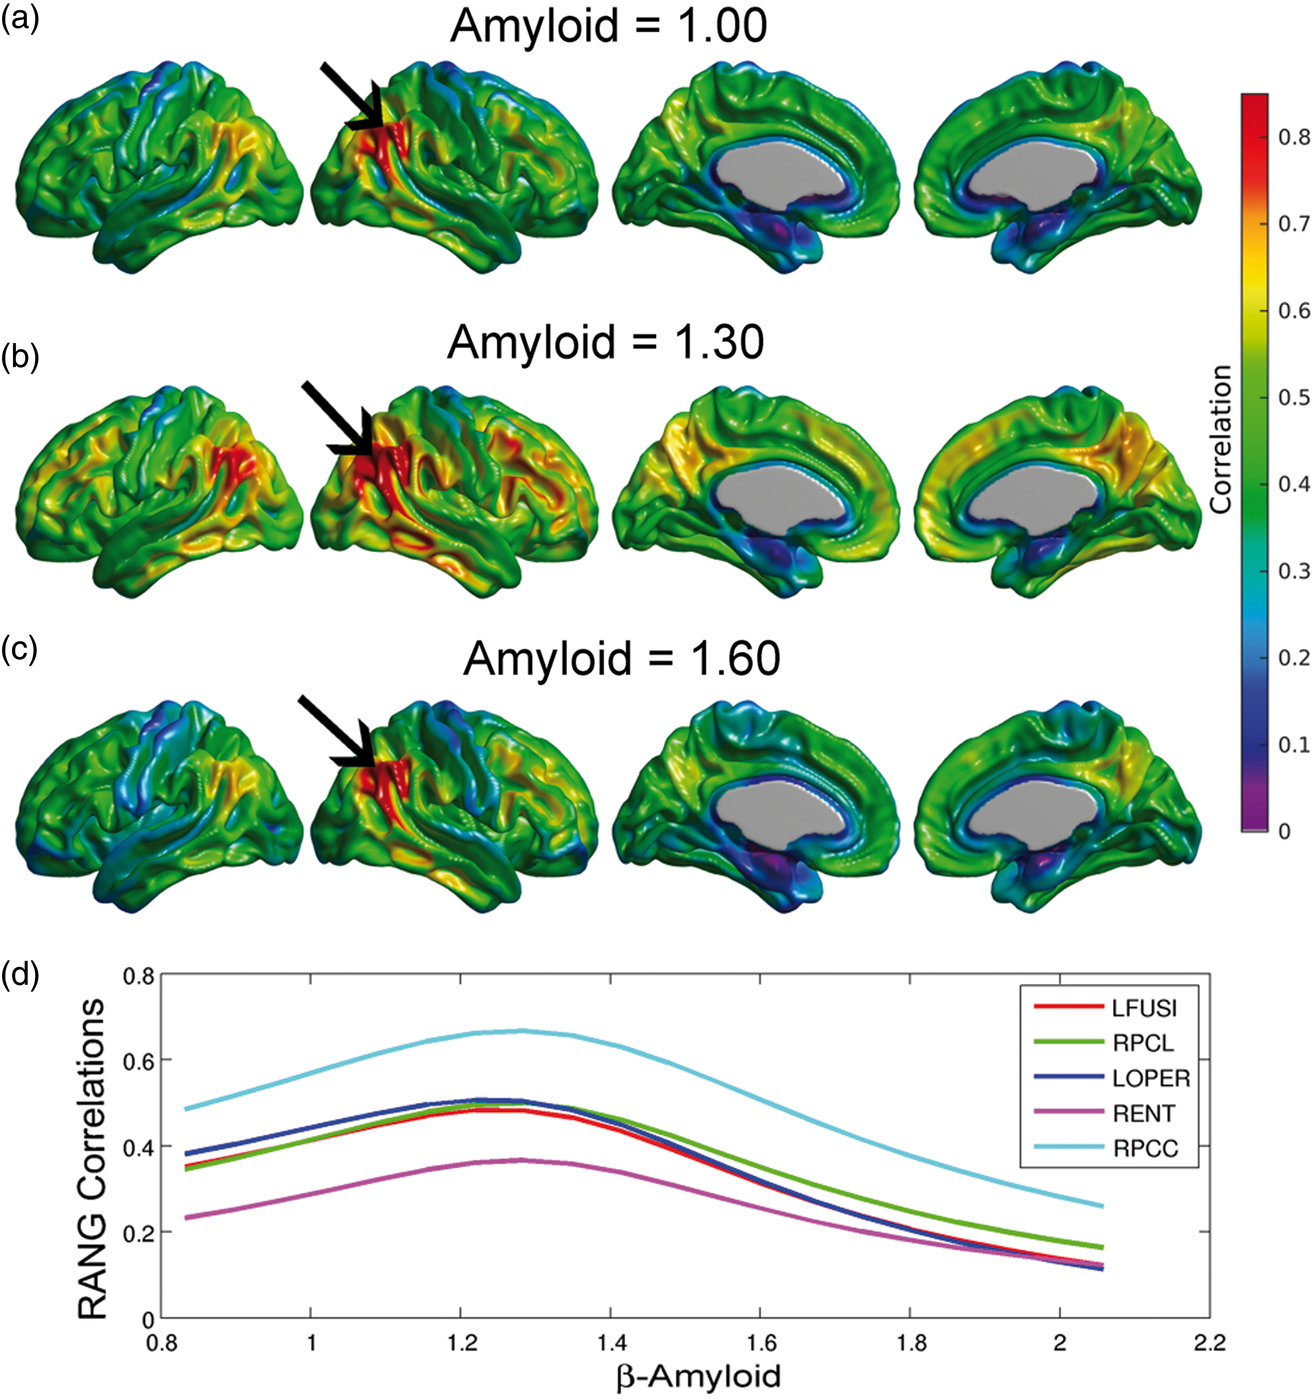
As with our glucose metabolism analysis, we re-evaluated Model (2) with the continuous approach separately for each subgroup. We observed significant modulation of metabolic slopes within the MCI group (Figure 6(b)) and in the cohort of NC/MCI subjects (Figure 6(d)). These areas are spatially similar to those areas observed in the analysis of the entire sample (Figure 3(a)).
Statistical effect of β-amyloid on right angular gyrus seed slopes for NC, MCI, and AD subpopulations, as well as in a cohort of NC and MCI subjects. A significant effect was only detected in MCI subjects and in the combined cohort of NC and MCI subjects. Results (a–d) are shown at an FDR-corrected threshold of 0.05.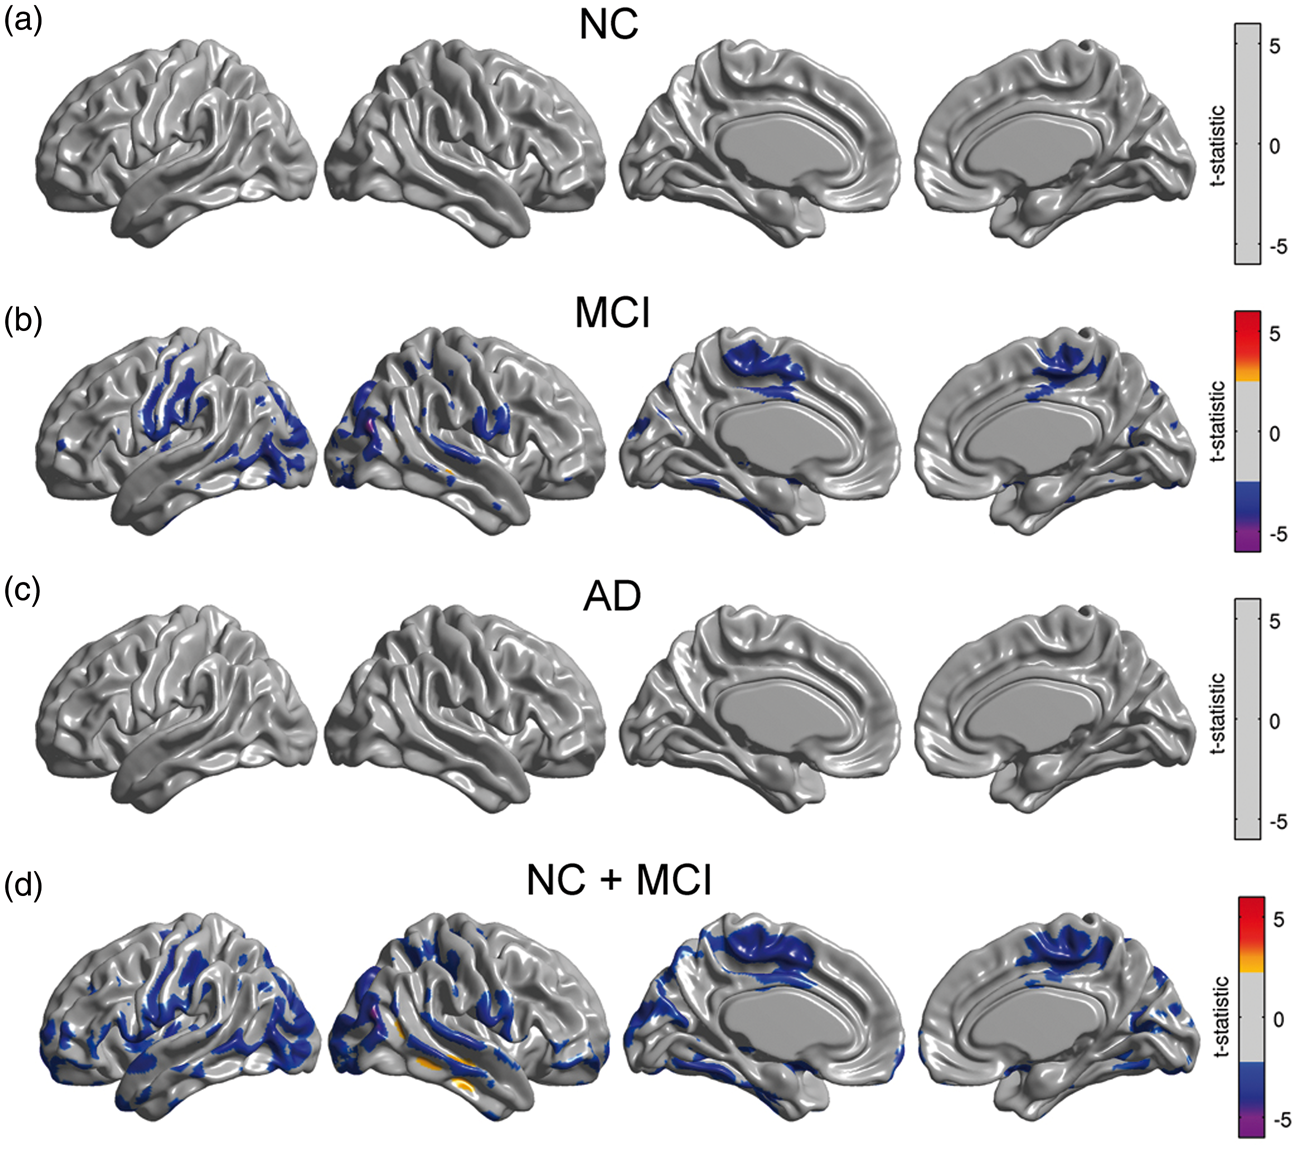
Discussion
In this study, we explored associations between glucose metabolism, β-amyloid burden, and APOE ɛ4 status in a sample of subjects across the AD spectrum. Our analysis revealed that dichotomization in correlational studies involving quantitative measurements of β-amyloid burden is sub-optimal based on both statistical theory and statistical model fitting. By treating β-amyloid as a continuous variable, our analysis revealed that glucose metabolism not only has a strong association with APOE ɛ4 carrier status, but also a significant relationship with β-amyloid burden, particularly in the angular gyrus and posterior cingulate cortex. Modulation of metabolic connectivity by β-amyloid burden revealed an intriguing spatio-temporal pattern, where an early, globally synchronized hypometabolism is followed by a regionally heterogeneous reduction of metabolism across subjects as β-amyloid burden (measured by [18F]florbetapir PET) increases.
Our determination that β-amyloid should be modeled as a continuous variable is based on several key statistical findings. Comparison of models revealed substantially better fits for the continuous models, as shown by AIC differences greater than 10 in regions related to altered metabolism and metabolic connectivity. We also found that modeling β-amyloid as a continuous variable improves the statistical power through larger effect sizes.
Given the known issues associated with the dichotomization of truly continuous variables, we re-analyzed the β-amyloid-metabolism-APOEɛ4 status relationship in NC, MCI, and AD sub-populations by treating β-amyloid as a continuous variable. This analysis revealed that, indeed, there was no statistically significant effect of β-amyloid burden on glucose metabolism for any sub-population, thereby indicating that the lack of significance in other studies7,12 was not due to the dichotomization process. Consistent with the findings of Carbonell et al. 12 and Jagust and Landau, 7 we conclude that average β-amyloid burden in a pre-defined composite ROI is not related to metabolism in NC subjects. However, we observed significant relationships between β-amyloid and glucose metabolism in the angular gyrus and posterior cingulate cortex in the combined cohort of NC/MCI subjects. Moreover, these significant regions were similar to those observed across the whole sample of NC, MCI, and AD subjects. Therefore, our results are also consistent with Lowe et al., 9 who reported that decreases in metabolism in PiB-positive, cognitively normal subjects occur in cortical regions associated with AD pathology, and are more pronounced in subjects with higher β-amyloid burden.
The different spatial patterns observed in the relationship between glucose metabolism and β-amyloid burden across the populations of NC, MCI, and AD subjects, as opposed to combined cohort of all subjects in the sample, suggest the possibility of a β-amyloid-metabolism-APOEɛ4 relationship modulated by cognitive ability. In order to evaluate this hypothesis, we included additional interaction terms in Model (1). In the two additional models, we separately added MMSE × Amyloid and ADAS-Cog × Amyloid interaction terms. The absence of statistically significant regions resulting from these models is an indication that the association between metabolism and β-amyloid does not appear to be linearly modulated by cognitive ability (Supplementary Figure 3). As such, a more plausible explanation for our findings can be based on well-documented studies suggesting that fibrillar β-amyloid load and cerebral glucose metabolism follow temporally divergent evolution paths across AD progression.6,36–38 Jack et al. 36 showed that a high percentage of cognitively normal, elderly subjects had abnormal hippocampal volume and/or altered glucose metabolism before having any evidence of β-amyloid deposition. Kadir et al. 6 found an increase in β-amyloid load in MCI patients followed by stabilization at the AD stage, while regional metabolism declined in MCI patients and worsened with subsequent cognitive decline. As reviewed by Perani, 37 several studies with FDG and amyloid PET imaging in AD patients have found a continuous decrease of glucose metabolism across the disease progression, whereas β-amyloid tracer uptake remained at a plateau. Our results suggest that the association between the divergent, temporally mismatched evolution paths of metabolism and β-amyloid deposition can only be detected across a large, heterogeneous population of subjects representing the AD continuum, rather than simply short segments (i.e. snapshots) of the evolutionary trajectories represented by individual subpopulations (NC, MCI, or AD). Further, the similarity of findings corresponding to the whole sample and the combined cohort of NC and MCI subjects suggests that β-amyloid has a cumulative effect on metabolism that cannot be detected at the earliest stages of AD pathology. Unfortunately, the origin of these divergent evolution paths of β-amyloid accumulation and metabolism is not well-understood. 37
We observed significantly reduced regional glucose metabolism in the APOE ɛ4 carrier group when controlling for β-amyloid burden. Subsequently, we repeated the analysis of the APOE ɛ4 in each subpopulation (Supplementary Figure 4). In contrast to Jagust and Landau, 7 our results of the effect of APOE ɛ4 status on metabolism in NC did not reach statistical significance. However, the analysis of the entire sample, coupled with the findings of Carbonell et al., 12 provide compelling evidence that glucose metabolism is not only associated with APOE ɛ4 status, but is also associated with β-amyloid burden.
Based on our metabolic connectivity analysis, gradual deposition of β-amyloid appears to be tightly associated with spatial “metabolic heterogeneity,” which is reflected in the decreasing metabolic slopes and correlations with increasing β-amyloid burden. In contrast, the lack of metabolic connectivity differences between APOE e4 carriers and non-carriers, despite APOE e4 carriers having decreased metabolism, indicates that APOE e4 carriers have a susceptibility to “coordinated decreases in glucose metabolism.” The former may be also consequence of divergent, variable spatio-temporal patterns of metabolism and β-amyloid deposits during the progression of AD. While such divergent patterns were observed in the entire population, they could only be replicated in the MCI subpopulation and in the combined cohort of NC/MCI subjects. This finding suggests that the disruption of metabolic correlations by deposition of β-amyloid is a process that can be detected even in populations with subtle clinical heterogeneity, such as MCI, in contrast to disruption of glucose metabolism disruptions which appear to be a more cumulative process.
Finally, our results support the Jack model 39 and the amyloid cascade hypothesis 40 by demonstrating that β-amyloid alters metabolic connectivity across the range of concentrations. Some previous studies,7,8,37 have shown results that have cast doubt on the amyloid cascade hypothesis, in which neuronal injury and metabolic changes in AD occur independently of β-amyloid deposition. Findings of independent β-amyloid deposition and metabolic changes likely reflect different underlying etiologies. In fact, individuals with low hippocampal volume and/or cerebral hypometabolism are now referred to as having suspected non-Alzheimer’s physiopathology (SNAP). 41 As such, we believe that our results support the notion that β-amyloid burden modulates glucose metabolism and provides further evidence of the validity of the Jack model. 42 However, continuous feedback interrelations among the vascular, metabolic, and functional brain systems coexist in health and disease, implying that alterations of any of these factors and/or increases in toxic β-amyloid/tau concentrations may contribute to extension of the pathologic evolution across the other systems. Taken together, our observations support the continuous integration of different pathologic mechanisms during AD progression, rather than independent effects on the neurodegenerative process.
In conclusion, our findings have important implications for understanding disease progression and the optimal window for disease-modifying therapeutic intervention. Our results suggest an initially synchronized decrease in metabolism that peaks at the point that β-amyloid burden becomes measurable by PET imaging. Interestingly, the effect of β-amyloid on metabolism is greatest in the ventral default-mode network (DMN), which has been suggested as key hub between the posterior DMN and hippocampus. 42 The continued accumulation of deposited β-amyloid leads to progressive heterogeneity in glucose metabolism across subjects that could indicate differential shifts in brain processing load amongst subjects. 42 Future work is aimed at developing a metric to measure metabolic connectivity in individual subjects that could be used as a functional biomarker in clinical trials. Finally, the early changes in metabolism and metabolic connectivity due to β-amyloid suggest that putative anti-amyloid therapies should target individuals who are on the path to high β-amyloid burden, rather than those who already have high β-amyloid burdens.
Footnotes
Funding
The author(s) disclosed receipt of the following financial support for the research, authorship, and/or publication of this article: Data collection and sharing for this project was funded by the Alzheimer’s Disease Neuroimaging Initiative (ADNI) (National Institutes of Health Grant U01 AG024904) and DOD ADNI (Department of Defense award number W81XWH-12-2-0012).
Acknowledgements
Data used in preparation of this article were obtained from the Alzheimer’s Disease Neuroimaging Initiative (ADNI) database (http://adni.loni.usc.edu). As such, the investigators within the ADNI contributed to the design and implementation of ADNI and/or provided data but did not participate in analysis or writing of this report. A complete listing of ADNI investigators can be found at: ![]()
Declaration of conflicting interests
The author(s) declared the following potential conflicts of interest with respect to the research, authorship, and/or publication of this article: FC, APZ, and DGM are employees of Biospective. APZ and BJB are shareholders of Biospective. YI-M does not have any disclosures.
Authors’ contributions
FC and BJB designed research; FC, APZ, DGM, YI-M, and BJB performed research; FC, DGM, and BJB analyzed the data; and FC, DGM, and BJB wrote the article.
References
Supplementary Material
Please find the following supplemental material available below.
For Open Access articles published under a Creative Commons License, all supplemental material carries the same license as the article it is associated with.
For non-Open Access articles published, all supplemental material carries a non-exclusive license, and permission requests for re-use of supplemental material or any part of supplemental material shall be sent directly to the copyright owner as specified in the copyright notice associated with the article.