
Abstract
Cortical spreading depression, which plays an important role in multiple neurological disorders, has been studied primarily with experimental models that use highly invasive methods. We developed a relatively non-invasive optogenetic model to induce cortical spreading depression by transcranial stimulation of channelrhodopsin-2 ion channels expressed in cortical layer 5 neurons. Light-evoked cortical spreading depression in anesthetized and freely behaving mice was studied with intracortical DC-potentials, multi-unit activity and/or non-invasive laser Doppler flowmetry, and optical intrinsic signal imaging. In anesthetized mice, cortical spreading depression induction thresholds and propagation rates were similar for invasive (DC-potential) and non-invasive (laser Doppler flowmetry) recording paradigms. Cortical spreading depression-related vascular and parenchymal optical intrinsic signal changes were similar to those evoked with KCl. In freely behaving mice, DC-potential and multi-unit activity recordings combined with laser Doppler flowmetry revealed cortical spreading depression characteristics comparable to those under anesthesia, except for a shorter cortical spreading depression duration. Cortical spreading depression resulted in a short increase followed by prolonged reduction of spontaneous active behavior. Motor function, as assessed by wire grip tests, was transiently and unilaterally suppressed following a cortical spreading depression. Optogenetic cortical spreading depression induction has significant advantages over current models in that multiple cortical spreading depression events can be elicited in a non-invasive and cell type-selective fashion.
Introduction
Cortical spreading depression (CSD) is involved in various neurological diseases such as migraine, stroke, subarachnoid hemorrhage, and traumatic brain injury.1,2 In migraine, CSD is the likely mechanism underlying the migraine aura, 3 and, in animals, was shown to activate headache mechanisms. 4 CSD is characterized as a slowly progressing cortical wave of neuronal and glial depolarization that is followed by a temporary suppression of activity.5,6 In rodents, CSD events were shown to be accompanied by complex, multiphasic changes in brain vasculature, blood flow, and parenchymal metabolic activity, which can be monitored by optically tracking the dilatation-constriction dynamics of blood vessels and reflectance changes (optical intrinsic signal; OIS) of brain tissue.7–9
Although neuronal depolarization has been postulated as a trigger for CSD in otherwise healthy brain tissue,2,3,5 even in the absence of neuronal firing,10,11 this has not been formally demonstrated, in part because current CSD induction paradigms entail invasive methods that require craniotomy combined with cortical exposure to exogenous agents (e.g. KCl) or electrical currents for stimulation. 12 While these interventions are able to depolarize neurons, they have the disadvantage that they also exert non-specific and potentially injurious effects on neurons, astrocytes, and vasculature that may contribute to CSD initiation. 2 Moreover, most CSD studies use anesthetized animals or acute brain slice preparations that dramatically alter brain activity,13,14 which may also affect CSD characteristics.
The advent of optogenetical methodologies using channelrhodopsin ion channels expressed virally or via a transgene enables specific activation of individual cell types with blue light photostimulation. 15 This allows for non-invasive in vivo modulation of brain cellular activity through the intact skull 16 with high temporal and spatial resolution. This approach also avoids stimulation artifacts 17 and tissue injury that may result from implantation, electrical stimulation, mechanical stimulation, or high concentrations of KCl.
We used transcranial photostimulation of cortical layer 5 neurons expressing channelrhodopsin-2 (ChR2) under control of the Thy1 promoter from a transgene (Thy1/ChR2-YFP),18,19 and induced CSD events in anesthetized and freely behaving mice. We assessed electrophysiological and vascular characteristics of the optogenetically (light) induced CSD events. In freely behaving mice, we also investigated the feasibility of repeated optogenetic CSD induction over multiple days and studied behavioral characteristics and motor function deficits related to CSD.
Materials and methods
Animals
Two- to six-month-old homozygous male and female transgenic mice that expressed ChR2-eYFP fusion protein in layer 5 cortical neurons were used (Supplementary Figure 1(a); strain 7612 – B6.Cg-Tg(Thy1-COP4/EYFP)18Gfng/J; Thy1/ChR2-YFP;18,19 the Jackson Laboratory, Bar Harbor, ME, USA). For some control experiments, C57BL/6J mice (Harlan, Venray, The Netherlands) of the same age were used. Mice were kept under standard housing conditions with a 12-h light/dark cycle (lights on from 6 a.m. to 6 p.m.) with free access to water and food. All photostimulation experiments were carried out during the light period between 10 a.m. and 5 p.m. The protocol for experiments in Leiden was approved by the “Leiden University Medical Centre Animal Experiments Committee” (DEC 2014-13193), conformed to recommendations of the European Communities Council Directive (2010/63/EU). The protocol for experiments in Los Angeles was approved by the “University of California Los Angeles Institutional Animal Care and Use Committee” (protocol 2005-#021-31), conformed to the National Institutes of Health “Guide for the Care and Use of Laboratory Animals.” All experiments were carried out in accordance with ARRIVE guidelines. All efforts were made to minimize suffering.
Optogenetic induction of CSD combined with monitoring of cortical electrophysiology and blood flow under anesthesia
Cortical DC-potential and blood flow recordings
For experimental methods A1 and A2 (Supplementary Figure 2(a)), animals were anesthetized with 1.5% isoflurane in air. Left femoral artery catheterization allowed for blood sampling and continuous blood pressure monitoring. Arterial blood gases (pCO2, pO2) and pH were measured at the start and end of the recordings (Supplementary Table 1). Mice were placed in a stereotaxic frame inside a shielded Faraday cage on a homoeothermic heating pad with continuous monitoring of core temperature (37.0 ± 0.5℃) and their skull bone was exposed. For method A1, we performed cerebral blood flow (CBF) recordings using two laser Doppler flowmetry (LDF) probes (403 probes and PeriFlux System 5000; Perimed Järfälla-Stockholm, Sweden), placed on the skull bone overlaying the right visual cortex (V1; 3.0 mm posterior and 2.0 mm lateral to bregma) and motor cortex (M1; 1.0 mm anterior and 2.0 mm lateral to bregma) with simultaneous intracortical DC-potential recordings from two glass electrodes that were placed at a depth of 300 µm in two small burr holes immediately lateral to the LDF probes. To detect both slow and fast changes in the DC-potential recordings, signals were filtered with a DC – 500 Hz low-pass filter, 30×amplified and digitized at 1000 Hz sampling rate (PowerLab 16/30; AD Instruments Inc., Colorado Springs, CO, USA). CBF recordings started before drilling of craniotomies to detect accidental initiation of CSD. The CSD propagation rate for DC recordings was calculated from the latency of the DC shift between the two recording sites and the distance between electrode locations. For LDF recordings, the latency of the hypoperfusion trough between the two recordings sites and the distance between LDF probe locations were used. For method A2, the skull was left intact and CSD events were monitored only by CBF recording, as described above. At the end of the experiments, the mice were euthanized by cervical dislocation.
Transcranial photostimulation and induction of CSD
For photostimulation, a 400-µm diameter fiber optic cannula was placed on the skull bone overlaying the right visual cortex (V1; 3.5 mm posterior and 2.0 mm lateral to bregma) and connected via a flexible optic fiber to a 460-nm (blue) LED light source (UHP-T-LED-460; Prizmatix, Givat-Shmuel, Israel) controlled by the PowerLab system. Output power at optic cannula tip was calibrated to 4 mW before each experiment (PM100A with S121C photodiode; Thorlabs, Newton, NJ, USA). This power level was selected based on pilot studies in which we established that 4 mW was sufficient for reliable induction of CSD without causing excessive tissue heating (Supplementary Figure 3). For assessing the threshold for light-induced CSD, single 4-mW blue (460 nm) light pulses were delivered at an increasing duration (in s: 0.25, 0.5, 0.75, 1.0, 1.5, 2, 3, 4, 5, 6, 7, 8, 9, 10, 11, 12, 13, 14, and 15) every 5 min until a CSD (defined as a spreading DC-potential shift of at least 5 mV amplitude and/or a spreading change in CBF of at least 20% relative to baseline) was observed. After 20 min, the threshold paradigm was repeated, starting from the pulse duration one step shorter than the duration that triggered the first CSD, to determine whether the threshold for a second light-induced CSD was comparable to the first.
Optogenetic induction of CSD combined with OIS imaging under anesthesia
DC- and local field potential recording combined with OIS imaging
For optical intrinsic signal (OIS) imaging, experiments (method B, Supplementary Figure 2(b)), were performed as previously described. 20 Mice were anesthetized with isoflurane (induction 2.5%; maintenance 0.75 to 1.25%; in 67% N2 / 33% O2) and placed in a stereotaxic frame on a homoeothermic heating pad with continuous monitoring of the core temperature (37.0 ± 0.5℃), and non-invasive monitoring of peripheral oxygen saturation ( ∼ 99%), heart rate, and respiratory rate (80–120 bpm) (PhysioSuite; Kent Scientific Instruments, Torrington, CT, USA). After exposing the skull bone, a thinned cortical window over the parietal cortex region was produced with a dental drill (Fine Science Tools Inc, Foster City, CA, USA) and covered with a thin layer of silicon oil for optimal transparency. A burr hole was made 0.5 mm from the temporal ridge mid-way between bregma and lambda for placement of a low-resistance (2.0 MΩ, at 500 µm depth) tungsten electrode used for local field potential (LFP) recordings. LFPs were amplified (DC to 1 kHz; 50 × total amplification; Model 3000; A-M Systems, Carlsborg, WA, USA) and digitized (Signal Express software and USB-6218 data acquisition module; National Instruments, Austin, TX, USA). Cortical surface imaging was performed with 530 nm (green) LED light (1-UP; LED Supply, Randolph, VT, USA) illumination. Cortical surface reflectance was collected with a lens (HR Plan Apo 0.5 × WD 136) through a 515LP emission filter on a Nikon SMZ 1500 stereomicroscope (Nikon Instruments, Melville, NY, USA). Images were acquired at 1–5 Hz using a high-sensitivity USB monochrome CCD (CCE-B013-U; Mightex, Pleasanton, CA, USA) with 4.65 micron square pixels and 1392 × 1040 resolution. The imaging field measured approximately 2.5 mm × 3.5 mm (∼0.5 mm from sagittal, and ∼1.4 mm from coronal and lambdoid sutures). Image stacks were analyzed offline using ImageJ and custom plug-ins (including the IntensityOverTime Monitor plug-in; http://rsb.info.nih.gov/ij/plugins/mbf/index.html and the Kymograph plug-in; http://www.embl.de/eamnet/html/body_kymograph.html).
Transcranial photostimulation and induction of CSD
For photostimulation, an 800-µm diameter fiber optic cable was coupled to a 445-nm (blue) laser (AIX-445-100T; AixiZ Service and International LLC, Houston, TX, USA) and positioned adjacent to the thinned portion of the skull using a micromanipulator. Fiber optic tip output was calibrated using a neutral density filter and adjusting laser power. To evoke CSDs, light pulses were delivered at the lowest intensity with increasing duration (5-s steps). If the light pulse intensity failed to evoke CSD after 20 s, the light intensity was increased by 2 mW and the process was repeated. All CSDs reported were evoked between 1–20 s and between 5–12 mW. Mice were euthanized by anesthetic overdose followed by decapitation.
Optogenetic induction of CSD combined with monitoring of cortical electrophysiology and blood flow in freely behaving mice
Surgery for electrode and optic fiber placements
For optogenetic CSD induction in freely behaving mice, we stereotaxically implanted seven electrodes and two optic fibers under isoflurane anesthesia (method C, Supplementary Figure 2(c)). Electrodes were implanted at the following coordinates (in mm relative to bregma): 1.5 and 3.0 posterior/ + 2.0 lateral/0.5 ventral from dura (right S1 and V1; paired 75 µm platinum (Pt)/iridium (Ir) electrodes, PT6718; Advent Research Materials, Oxford, UK); 0.5 anterior/ + 2.0 lateral/0.8 ventral from dura (right M1; paired Pt/Ir electrodes); 0.5 anterior/ − 2.0 lateral/0.8 ventral from dura (left M1; single Pt/Ir electrode); two low-impedance electrodes (Pt/Ir 75 µm, ∼ 1 mm uninsulated tip) were placed above the cerebellum and served as reference and ground electrodes. For photostimulation, a fiber optic cannula (400 µ.m; CFM14L02; Thorlabs) was placed on the skull bone over the right visual cortex (V1; 3.5 mm posterior and 2.0 mm lateral to bregma). For LDF recording, a second fiber optic cannula was placed on the skull bone immediately adjacent to the M1 electrodes. Electrodes were connected to a seven-channel pedestal (E363/0 socket contacts and MS373 pedestal; Plastics One, Roanoke, VA, USA) and to the skull together with the optic fibers using a mixture of cyanoacrylate glue (Krazy Glue; Elmer’s Products, Westerville, OH, USA) and dental cement (Simplex Rapid Powder; Kemdent, Swindon, UK). Carprofen (5 mg/kg, sc) was given for post-operative pain relief. All mice survived the surgical procedure and showed no discomfort upon recovery. In a rare case when the optic fiber connection detached from the skull (n = 1), the animal was excluded from the experiment.
Recording of DC-potential, LFP and multi-unit activity
After a seven-day recovery period, animals were placed in a shielded recording Faraday cage and connected to custom-built recording hardware through a counterbalanced, low-torque electrical commutator. Electrophysiological signals were pre-amplified 3× and fed into separate amplifiers for DC-potential (DC – 500 Hz low-pass filter, 10 × gain, relative to reference) and LFP (0.05–500 Hz band-pass filter, 1200 × gain, relative to reference). Signals were digitized (Power 1401 with Spike2 software; CED, Cambridge, UK) at sampling rates of 1000 Hz for DC-potential and 5000 Hz for LFP signals. Signals from paired intracortical Pt electrodes were also used for the detection of multi-unit activity (MUA; 500–5000 Hz band-pass filter, 36,000× amplification of the potential difference between the adjacent paired electrodes, 25,000 Hz sampling rate). Raw MUA signals were processed offline for quantification of spike rate using Spike2 software. Alongside electrophysiological recordings, locomotor activity was recorded using a custom-built passive infrared motion detection sensor, and drinking activity was recorded with a custom-built beam-break sensor in front of the drinking bottle. For CBF recording, the M1 optic cannula was connected to a laser Doppler system (PeriFlux system 5000 with stripped model 418 probe; Perimed).
Transcranial photostimulation and induction of CSD
After 24 h of baseline electrophysiological recording, the LED light source and the laser Doppler device were connected to the fiber optic cannulae using flexible optic fibers that were taped to the electrophysiology cabling for the duration of a photostimulation session. The threshold photostimulation paradigm was similar to the one used for the anesthesia experiments: single 4-mW 460-nm light pulses were applied at an increasing duration (in s: 0.01, 0.1, 0.25, 0.5, 1, 1.5, 2, 3, 4, 5, 6, 7, 8, 9, 10, 11, 12, 13, 14, and 15) with an interval of 5 min until CSD was observed. A single daily threshold experiment was performed for seven consecutive days to test repeatability and possible long-term changes in CSD susceptibility. Following CSD initiation, electrophysiological and CBF recordings were continued undisturbed for at least 60 min, after which optic fibers were disconnected until the next stimulation session. After this paradigm, two successive CSD threshold measurements were performed at 4-mW intensity 20 min apart, using the protocol also used for experiments under anesthesia with LDF recordings. Furthermore, the required duration for CSD initiation by 460-nm light pulses was determined at a range of different light intensities (2 mW, 16 mW, 40 mW) to assess the relationship between light intensity and pulse duration required for CSD initiation. Control experiments tested wavelength and genotype specificity of photostimulation for CSD induction (Supplementary Figure 3(d) and (e)). At the end of the longitudinal DC-potential/MUA recordings, brains were histologically processed to verify the location of the electrode locations. For all recordings, intracortical electrodes were confirmed to be in middle to deep cortical layers (Supplementary Figure 1(b)).
LFP spectrum and vigilance state analysis
For off-line analysis of the cortical LFP power spectrum and vigilance state in relation to CSD, LFP signals from V1 and M1 cortex were low-pass filtered at 100 Hz and down-sampled to 200 Hz (Spike2 v7; CED). Power spectra were computed using a Fast Fourier transform (FFT) routine (Hanning window, 0.25 Hz resolution) per 4-s epoch of the recording starting 20 min before CSD induction. Epochs containing artifacts were excluded from further analysis. To assess frequency band-specific effects of CSD, the average power was calculated per 1-min time bin for five defined spectral bands: delta (δ, 0.75–5 Hz), theta (θ, 5–10 Hz), alpha (α, 10–15 Hz), beta (β, 15–30 Hz), and gamma (γ, 30–45 Hz). In addition, we determined vigilance states (waking, REM sleep, non-REM sleep) by applying a semi-automatic algorithm per 4-s epoch on the basis of the scored behavioral activity and spectral composition of the V1 LFP signal. 21 In the algorithm, epochs with active behavior were classified as active waking. The first 10 epochs following cessation of active behavior were classified as passive waking. Remaining epochs were classified as sleeping and further subdivided into REM or non-REM sleep on the basis of the V1 EEG power spectrum: epochs with strong delta activity (>2 × average delta power) were classified as non-REM sleep; high theta (> average theta power) and low delta (< average delta power) activity epochs were classified as REM sleep; sleep epochs not fulfilling the above criteria were unclassified.
Behavioral analyses
Behavior of mice was recorded throughout experiments using a CCD camera (acA1300-60gmNIR, 30 frames/s image acquisition; Basler, Ahrensburg, Germany). Behavior related to the first CSD was analyzed offline using a software-based scoring system (the Observer 12.5; Noldus Information Technology, Wageningen, The Netherlands) for 60 min of recorded video starting 20 min before the CSD-inducing light pulse. Commonly observed rodent behaviors 22 that were analyzed were active (e.g. walking, grooming, eating, scratching, and being attentive to the environment) and inactive (e.g. sitting motionless, lying on the cage floor or sleeping) behaviors. After CSD, additional possible behaviors that were checked for included slow sideway scanning (“orienting” 23 ) head movements and “wet dog shakes.” 24 Start and end times of observed behavior were scored with 1-s precision allowing for summation of their duration in 1-min time bins. Total active behavior was calculated for each 1-min in bin from the summed duration of all types of behavior except inactivity.
Motor function tests
Mice were operated as described above for recording DC-potential, LFP, and MUA in freely behaving mice. In these animals, motor function was assessed using a wire grip test 25 with modifications to make the test repeatable and specific for assessing forepaw function in combination with V1 photostimulation and electrophysiological recordings (Supplementary Figure 4).
Statistical analysis
Data visualization and statistical testing were performed using GraphPad Prism (GraphPad Software, La Jolla, CA, USA) and Igor Pro v.6.2 (Wavemetrics, Lake Oswego, OR, USA). Data are presented as individual values and mean, except for CSD threshold which is expressed as individual values and median and averaged time series which are expressed as mean ± SEM (CBF, frequency band power, and total active behavior) or mean ± SD (wire grip test). Data were analyzed using paired or unpaired t-tests, Mann–Whitney U test, Wilcoxon signed rank test or repeated measures one-way ANOVA, where appropriate. For the analysis of the wire grip test results, first, grip measurements were averaged from 60 (i.e. the time point at which photostimulation was performed) to 360 s, per forepaw (left/right), per mouse (n = 6), and per condition (subthreshold/suprathreshold). Next, we fitted a linear regression to the resulting 2 × 6 × 2 = 24 averaged values. The independent variables were: mouse identifier, forepaw, condition, and the interaction between condition and forepaw. P < 0.05 was considered significant.
Results
CSD induced by optogenetic stimulation and recorded by intracortical DC-potentials in anesthetized Thy1/ChR2-YFP mice
To assess the possibility of non-invasive induction of CSD by transcranial illumination, we combined optogenetic photostimulation via skull-attached optical fibers with intracortical DC-potential and non-invasive LDF recording (method A1, Figure 1(a), left panel) in Thy1/ChR2-YFP mice kept under isoflurane anesthesia. Throughout the anesthesia, blood pressure (continuously monitored) and blood gas values were within physiological range (Supplementary Table 1). CSD was successfully induced in V1 cortex using single 4-mW 460-nm (blue) light pulse illumination as evidenced by the characteristic propagating DC-potential shift from V1 to M1 cortex (Figure 1(b)). CSD amplitude (20.5 ± 1.8 mV), duration (59.3 ± 6.3 s), and propagation rate (4.9 ± 0.5 mm/min) (n = 6; Figure 1(c)) were consistent with those induced by other methods,
26
indicating the feasibility of using optogenetics to induce CSD.
Characteristics of light-induced CSD in anesthetized Thy1/ChR2-YFP mice. (a) Left panel: method A1 (Supplementary Figure 2(a)) with simultaneous intracortical DC recordings, non-invasive LDF recordings, and non-invasive optogenetic stimulation using an optic fiber, placed on the skull bone above the visual cortex (V1). Right panel: method A2 (Supplementary Figure 2(a)) in which both CSD induction and detection were performed through the intact skull bone. (b) Representative DC-potential shift during light-induced CSD with propagation from the V1 to the M1 cortex in an anesthetized Thy1/ChR2-YFP mouse. *Indicates a sudden drop in extracellular DC-potential during a photostimulation pulse, that was only observed in the V1 DC-potential. (c) Amplitude, duration, and propagation rate of the spreading depolarization wave (see (b)) were determined from intracortical DC-potential recordings (n = 6; method A1). (d) CSD propagation rate determined from the DC recordings or CBF transient recorded from adjacent LDF probes yielded comparable values (n = 6, paired t-test). (e) CSD propagation rate determined from CBF transients were comparable for methods A1 and A2 (n = 6, unpaired t-test). (f) CSD thresholds determined by applying 4-mW 460 nm (blue) light pulses of increasing duration yielded threshold values ranging from 2 to 8 s with comparable range and median for methods A1 and A2 (n = 6, Mann–Whitney U test). (g) Threshold for the second CSD, that was initiated during the second threshold measurement starting 20 min after the first CSD, was higher than for the first CSD in all animals (n = 12, Mann–Whitney U test). (h) Propagation rate for the second CSD was lower than for the first CSD in all animals (n = 12, Wilcoxon signed rank test). (i) CBF in the visual (top traces) and motor cortex (bottom traces) showed a characteristic time course during CSD, consisting of an initial hypoperfusion followed by a transient recovery of CBF and a secondary oligemia (averaged from n = 4 animals, method A2). Left and right panels show CBF during a first and second CSD, respectively. During the second CSD, CBF showed a transient reperfusion.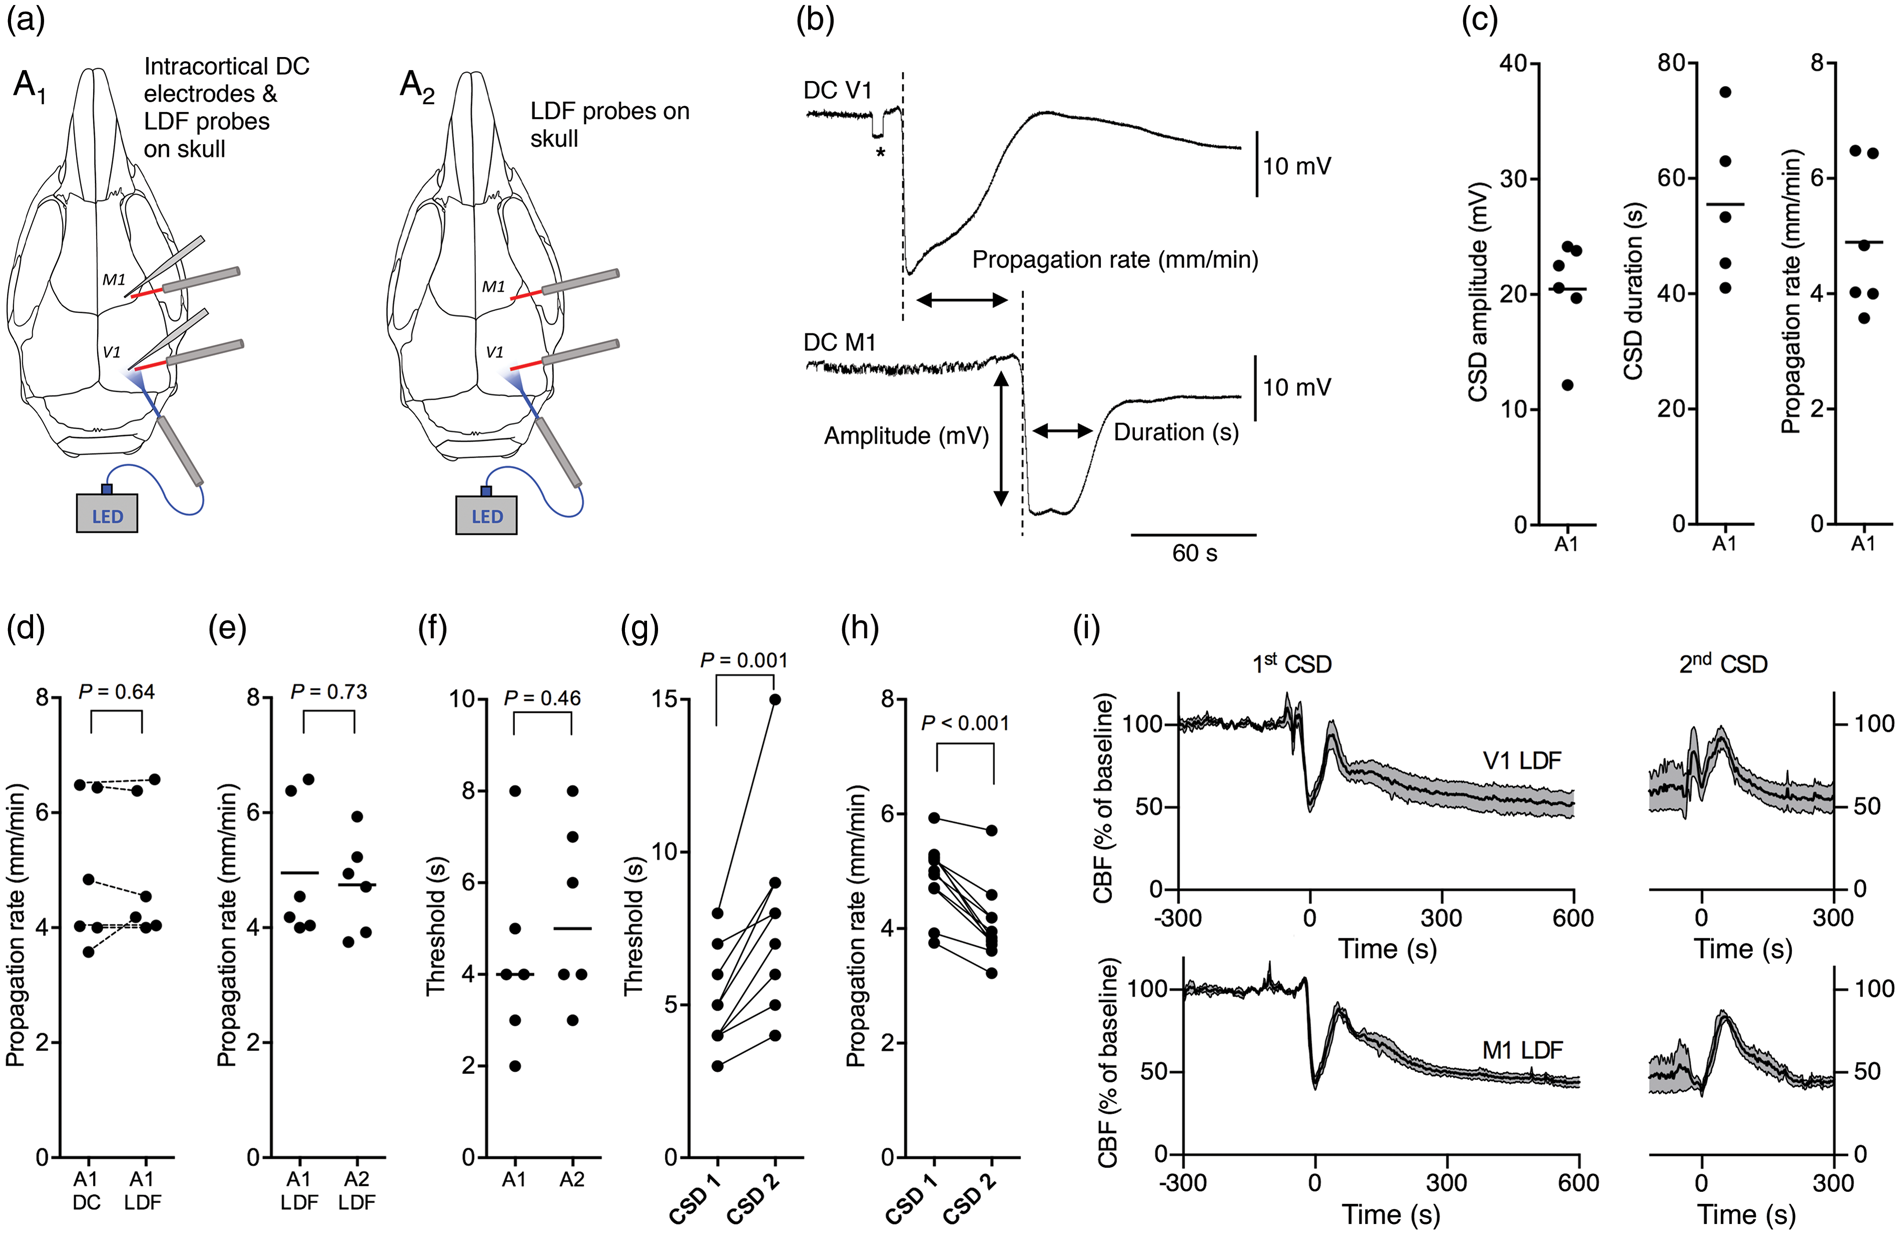
Optogenetic induction of CSD combined with non-invasive LDF recording in anesthetized Thy1/ChR2-YFP mice
To assess whether light-induced CSD can be reliably detected using non-invasive transcranial LDF, we compared DC-potential and LDF recordings in the same animal (method A1, Figure 1(a), left panel). Propagation rates measured with DC-potential (4.9 ± 0.5 mm/min) and LDF recordings (5.0 ± 0.5 mm/min) were comparable within animals (n = 6; Figure 1(d)). In a separate group of animals, light-induced CSD was solely recorded with non-invasive LDF recordings (method A2, Figure 1(a), right panel) to assess whether preparation of burr holes and/or electrode placement affected subsequent CSD characteristics. CSD propagation rates assessed by LDF alone in male mice with intact skull (method A2) were similar to those assessed by LDF combined with intracortical DC electrodes (method A1), i.e. 4.8 ± 0.3 versus 5.0 ± 0.5 mm/min, respectively (n = 6, Figure 1(e)). CSD thresholds at 4-mW light intensity were similar whether an invasive intracortical electrode was present (method A1: 2 to 8 s, or not (method A2: 3 to 8 s) (both n = 6, Figure 1(f)). Thresholds in male mice were comparable with those in females (method A2: 3 to 5 seconds; n = 6; P = 0.19, Mann–Whitney U test), so for subsequent experiments data from male and female mice were pooled. Control experiments in Thy1/ChR2-YFP mice showed that CSD was not induced by pulses of red (630 nm) light that do not activate ChR2 or by light-induced rises in cortical temperature (Supplementary Figure 3(a) to (c)).
Characteristics of CSD change when repeated after 20 min
To determine whether optogenetic CSD induction can reliably be repeated under anesthesia, using method A2, a second CSD threshold at 4-mW light intensity was determined starting 20 min after the first CSD. In all animals, a second CSD could be induced, but this consistently required a longer pulse duration than for the first CSD (n = 12; Figure 1(g)), while the propagation rate was reduced (n = 12; Figure 1(h)). Next, we assessed whether the higher threshold and lower propagation rate for the second CSD were correlated with changes in blood flow. We found that a first light-induced CSD resulted in a characteristic triphasic change in CBF (Figure 1(i)). After an initial hypoperfusion to 52 ± 5% of baseline in the V1 cortex and 43 ± 4% in the M1 cortex, CBF transiently recovered to 94 ± 9% of baseline in the V1 cortex and 88 ± 4% in the M1 cortex followed by a post-CSD oligemia of 53 ± 8% of baseline in the V1 cortex and 44 ± 3% in the M1 cortex. When a second CSD was initiated on top of the preceding CBF response, i.e. during the oligemia phase 20 to 60 min (depending on the actual threshold) after the first CSD, this caused a transient reperfusion, after which CBF returned to a comparable level of oligemia as before the second CSD.
Light-induced CSD under anesthesia displays characteristic vascular responses as determined by OIS imaging
Next we used OIS imaging and electrophysiological recordings to detect vascular and parenchymal changes during light-induced CSD in Thy1/ChR2-YFP mice (n = 3; Figure 2(a) to (c)). In two out of three animals, OIS was performed simultaneously with electrophysiological recordings to confirm that the propagated change in cortical reflectance was accompanied by a deflection in DC-potential (Figure 2(d)). Using 5-mW 470-nm (blue) light pulses, CSD was induced in under 10 s for all five CSDs. A thinned cortical window was used to track changes in vessels, but CSD could also be tracked optically through the intact skull (data not shown). The electrophysiological amplitude of CSD (14.8 ± 1.9 mV) and duration (57.0 ± 8.8 s) (Figure 2(d)) were similar to those previously reported for KCl stimulation.
26
The propagation rate was 3.4 ± 0.5 mm/min (five CSDs), using the filtered image stack to track the CSD wave front over time from individual ROIs (Figure 2(c) and (d)). Kymographs or space-time plots of large and small vessels show vessel contractions that accompany the CSD wave (Figure 2(c)). Larger arterioles or venules showed little or no constriction (e.g. see ROI 6), while smaller vessels showed larger constrictions (range: 7–53%; mean reduction of 32 ± 18%, e.g. see ROI 5).
Vascular, electrophysiological, and parenchymal characteristics of light-induced CSD in anesthetized Thy1/ChR2-YFP mice. (a) Characterization of the vascular and parenchymal changes during light-induced CSD was performed in anesthetized mice by optical intrinsic imaging in a thinned skull imaging window over the cortex (method B; Supplementary Figure 2(b)). (b) Top row: unfiltered CCD images through cortical window (thinned skull) montaged over time following CSD elicitation (stimulation site just outside imaging window, top left). Bottom row: same images high-pass filtered, relative to CSD propagation rate, to visualize CSD wave. (c) Left panel: single frame of cortical window with parenchymal and vessel regions of interest (ROI) marked. Middle panel: OIS of parenchymal ROIs normalized to peak. Time to peak response over the cortical window allows one to calculate CSD propagation rate. Right panel: kymographs or “space-time” plots of the changes in blood vessels (dark black region) following CSD. OIS wave propagation is visible in adjacent parenchymal regions (light gray) that brighten as the wave progresses. (d) Top: Representative DC-potential changes of CSDs elicited by photostimulation. Bottom: Summary statistics of CSD amplitude, duration, and velocity.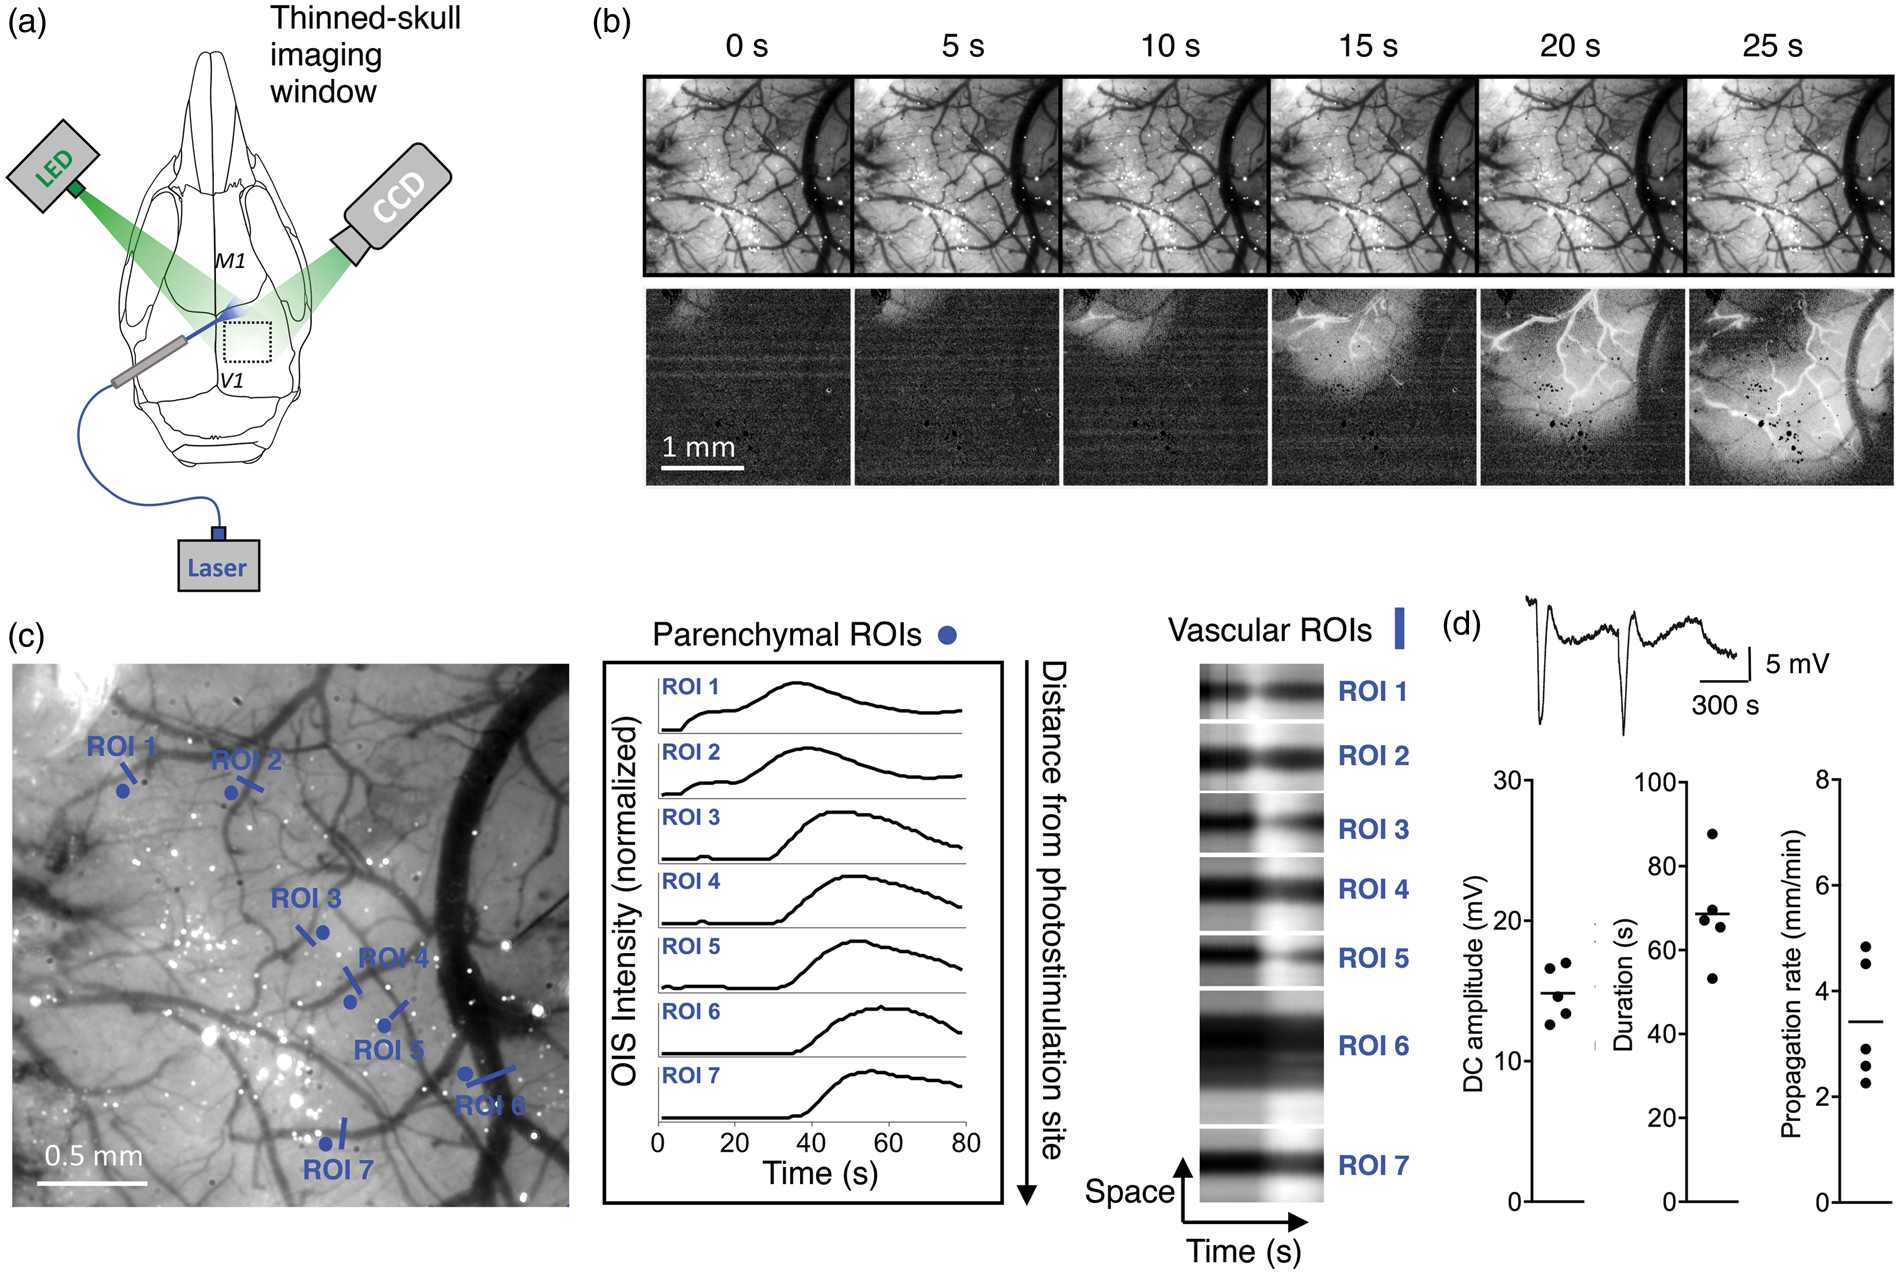
CSD can be induced by light stimulation in freely behaving Thy1/ChR2-YFP mice
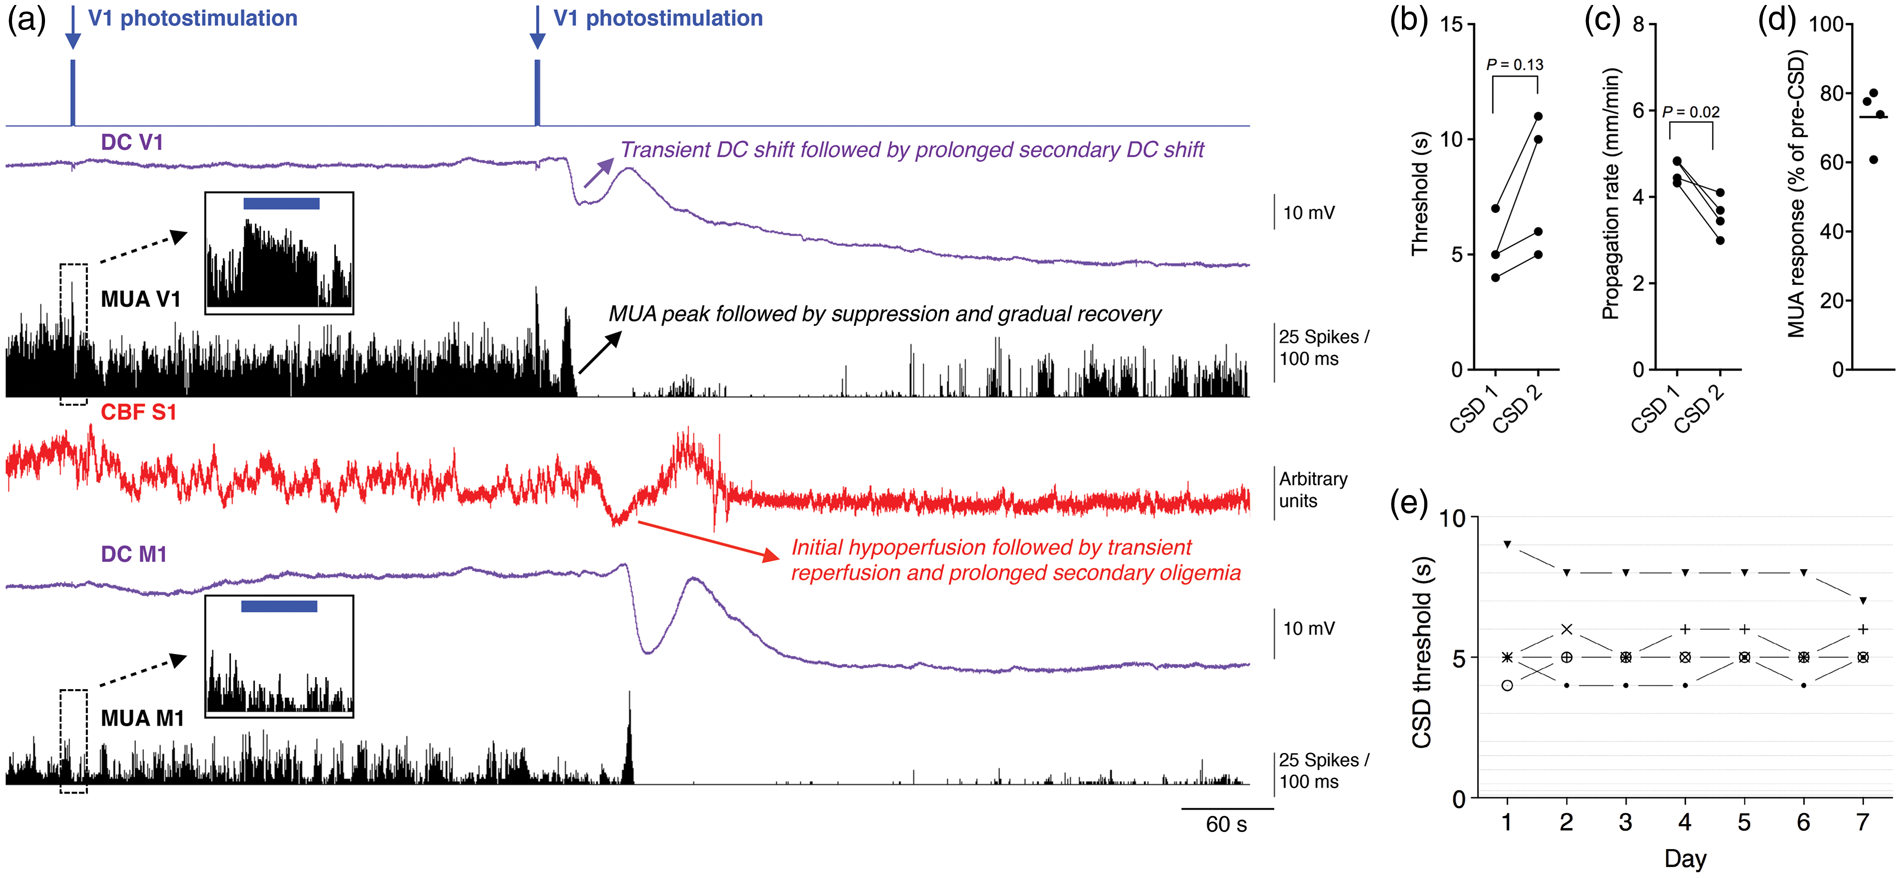
To investigate effects of anesthesia on CSD, and to explore the possibility to assess CSD effects on behavior, we induced CSD by photostimulation in freely behaving Thy1/ChR2-YFP mice. To this end, a skull-attached optic fiber above the V1 cortex was combined with intracortical electrodes at V1 and M1 locations for simultaneous detection of DC-potential and neuronal MUA changes (Figure 3(a)). A second optic fiber was attached to the skull overlaying M1 cortex to explore the possibility for non-invasive LDF detection of CSD under freely behaving conditions. Using 460-nm (blue) light pulses, CSD was successfully induced, as evidenced by the characteristic propagating wave of DC-potential deflection (Figure 3(b)). Light-induced CSD in 10 freely behaving male mice showed a CSD amplitude of 17.2 ± 1.9 mV (comparable to CSD under anesthesia; P = 0.27, t-test), a duration of 31.5 ± 3.8 s (shorter than under anesthesia; P = 0.004, t-test) and a propagation rate of 4.89 ± 0.17 mm/min (comparable to CSD under anesthesia; P = 0.99, t-test; Figure 3(c)). In six animals, we determined the CSD induction threshold and found a range of 4 to 9 s with a median of 5 s, illustrating a comparable CSD threshold as for the anesthesia experiments (P = 0.07, Mann–Whitney U test). We also assessed the relation between light pulse duration required for CSD initiation at intensities other than 4 mW and observed an apparent requirement of a minimum pulse duration of 1.5 s and minimum light intensity of 1.5 mW (n = 5, Figure 3(d)). Analysis of MUA and CBF showed that during CSD, the characteristic DC-potential shift coincided with a peak in neuronal MUA that was followed by prolonged suppression of MUA (Figure 4(a)). CBF followed a similar triphasic pattern as observed for the anesthesia experiments. We observed that the post-CSD oligemia coincided with a prolonged secondary negative DC-shift. Induced neuronal MUA during photostimulation of V1 was only detected by nearby V1 (and not M1) electrode pair (insets Figure 4(a)). Control experiments showed that a 5-s pulse of 630-nm (red) light (4 mW or higher) in a Thy1/ChR2-YFP mouse or a 30-s pulse of 460-nm (blue) light (4 mW) in a C57BL/6J mouse did not affect MUA or trigger CSD (Supplementary Figure 3(d) and (e)).
Characteristics of light-induced CSD in freely behaving Thy1/ChR2-YFP mice. (a) For CSD induction and detection in freely behaving mice, optic fibers for stimulation and LDF were placed on the skull bone above the V1 and S1 cortex and intracortical electrodes were placed in the S1 and M1 cortex, connected to a pedestal and fixed to the skull bone using dental cement (method C; Supplementary Figure 1(c)). (b) Representative DC-potential shift during CSD in a freely behaving mouse. (c) Amplitude, duration, and propagation rate of the spreading depolarization wave were determined from intracortical DC recordings (n = 10; Method C). (d) In five animals, we tested the pulse duration required for induction of CSD at multiple light intensities. For each light intensity, pulse duration was increased until CSD was observed. Threshold measurements for individual animals are connected by dotted lines. The gray area indicates combinations of pulse duration and intensity for which no CSD was observed. Relationship between light-induced neuronal MUA and CSD in freely behaving Thy1/ChR2-YFP mice. (a) Combined DC-potential and MUA recordings in the visual (V1) and motor (M1) cortex with S1 LDF during V1 460-nm (blue) light stimulation and CSD. Arrival of the CSD wave front at the intracortical electrodes is characterized by a negative deflection of DC-potential coinciding with a peak of intense neuronal firing (i.e. increased MUA) that is followed by neuronal silencing. CBF in freely behaving mice shows a similar triphasic time course as seen under anesthesia (cf. Figure 1(i)). Following the initial CSD wave, the DC-potential trace shows a prolonged secondary negative DC-shift coinciding with prolonged suppression of MUA and post-CSD oligemia. Inset: Details of MUA, DC-potential, and CBF during the subthreshold light pulse in A, illustrating that photostimulation-evoked neuronal MUA is only observed in the illuminated V1 cortical area, and not in the M1 cortex. (b) In four animals in which a second threshold measurement was performed starting 20 min after the first CSD, a comparable threshold value was found for the second compared to the first CSD (n = 4, Wilcoxon signed rank test). (c) Propagation rate for the second CSD was reduced in all animals compared with the first CSD (n = 4, paired t-test). (d) V1 MUA response during the first photostimulation pulse of the second threshold measurement, calculated as % of MUA response during the last subthreshold pulse of the first threshold measurement. (e) Stable CSD threshold during seven repetitive daily CSD threshold assessments. In five freely behaving Thy1/ChR2-YFP mice, a daily threshold measurement was performed for seven consecutive days. CSD threshold changes for consecutive days never exceeded a single step in pulse duration (steps indicated by horizontal lines) and did not show an overt trend between days one and seven.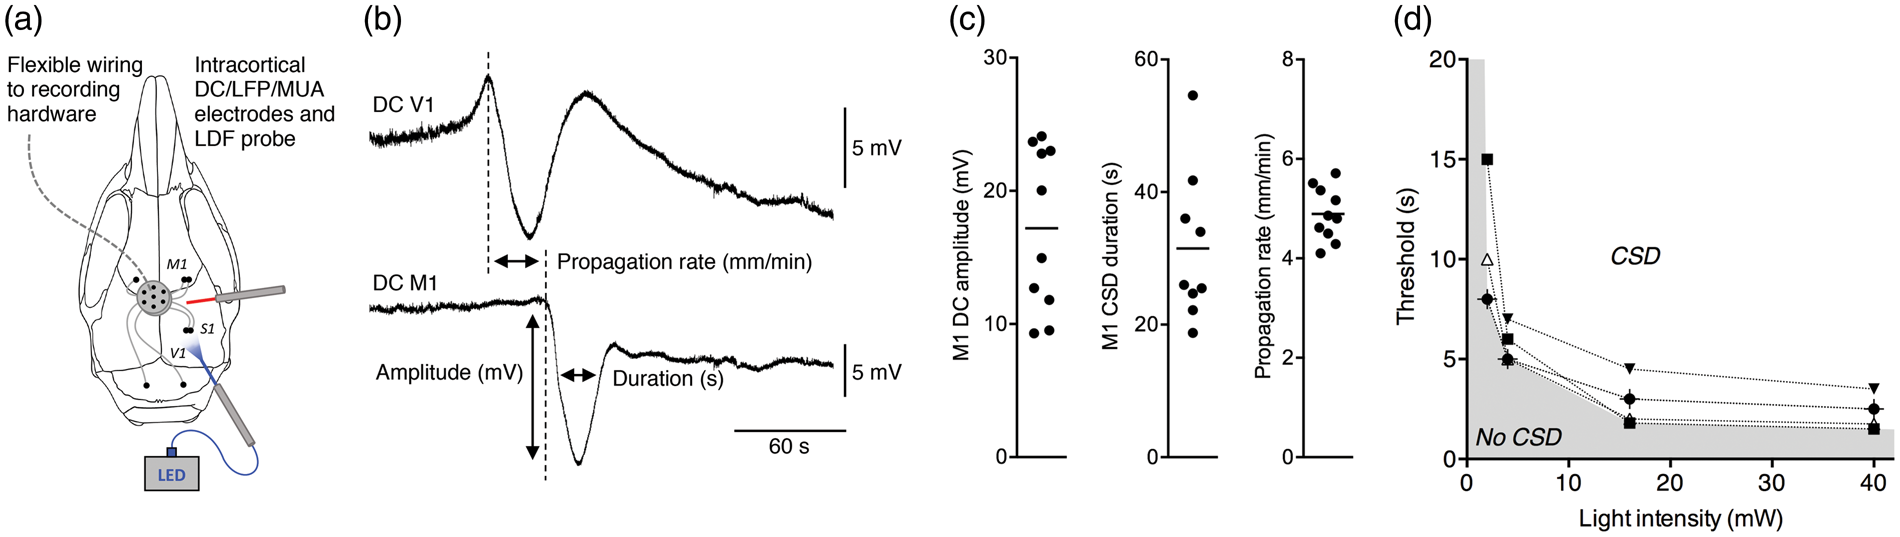
Repeated CSD during recovery phase has higher threshold and lower MUA
Threshold repeatability was assessed by performing a second CSD threshold measurement 20 min after the first CSD. The second threshold value was higher than the first for all four animals, although this difference was not significant (n = 4; Figure 4(b)). In line with the repeated threshold measurements under anesthesia, the propagation rate was reduced (n = 4; Figure 4(c)). To investigate whether the increased threshold for a second CSD within 60 min after the first CSD is caused by a reduced efficacy of photostimulation, we quantified the neuronal MUA response to photostimulation during the first and second CSD threshold measurements. We observed that levels of MUA during photostimulation pulses of the second threshold were reduced by 27% ± 9 % compared with MUA pulses of the first threshold (n = 4, P = 0.04, paired t-test; Figure 4(d)), indicating a lower cortical neuronal network response to photostimulation. Next, we asked the question whether our optogenetic approach allows for reliable repeated CSD induction over multiple days in freely behaving Thy1/ChR2-YFP mice. We repeated the 4-mW threshold protocol on seven consecutive days and observed stable CSD threshold values with only minor day-to-day variability in required light pulse duration to induce CSD (Figure 4(e)).
Effects of light-induced CSD on vigilance state and behavior
We assessed whether the animal’s vigilance state (as determined from LFP spectral composition and locomotor activity) was influenced by CSD for the first CSD (n = 8). A peak in locomotor activity was observed between 1 and 3 min following CSD induction (Figure 5(a) and (b)). When the CSD wave reached the M1 recording electrode, the LFP spectrum revealed an immediate reduction in all frequency bands that remained low for ∼40 min, except for the delta band that showed fast recovery, coinciding with an enhancement in non-REM sleep. The reduction in LFP power coincided with reduced MUA (Figure 5(a) and (b)). Video-analysis revealed that inactive behaviors (e.g. sitting quietly, lying, sleeping) dominated in the 20-min period preceding CSD (total activity 6.2 ± 2.0 s/min; Figure 5(b), bottom panel). Upon CSD induction, no overt behavioral changes were observed between 0 and 1 min, while between 1 and 3 min all animals displayed a transient peak in behavioral activity (27.2 ± 6.0 s/min) compared to the 20-min pre-CSD period. Detailed video-analysis (example shown in Figure 6(a)) revealed that the peak in active behavior started between 62 and 92 (78 ± 12) s following CSD induction with animals becoming attentive to the environment, or displaying active behaviors such as walking, crawling side- or backwards, displaying turning, or slow scanning movements of the head. These active behaviors could be interrupted by brief periods of immobility. Although observed behaviors following CSD varied, head turning or scanning were observed in five out of eight mice (data not shown). This transient increase in activity ended between 192 and 536 s following CSD induction, when active behavior reduced to a low level of total activity of 1.9 ± 0.6 s/min until the end of the observation period 40 min after CSD.
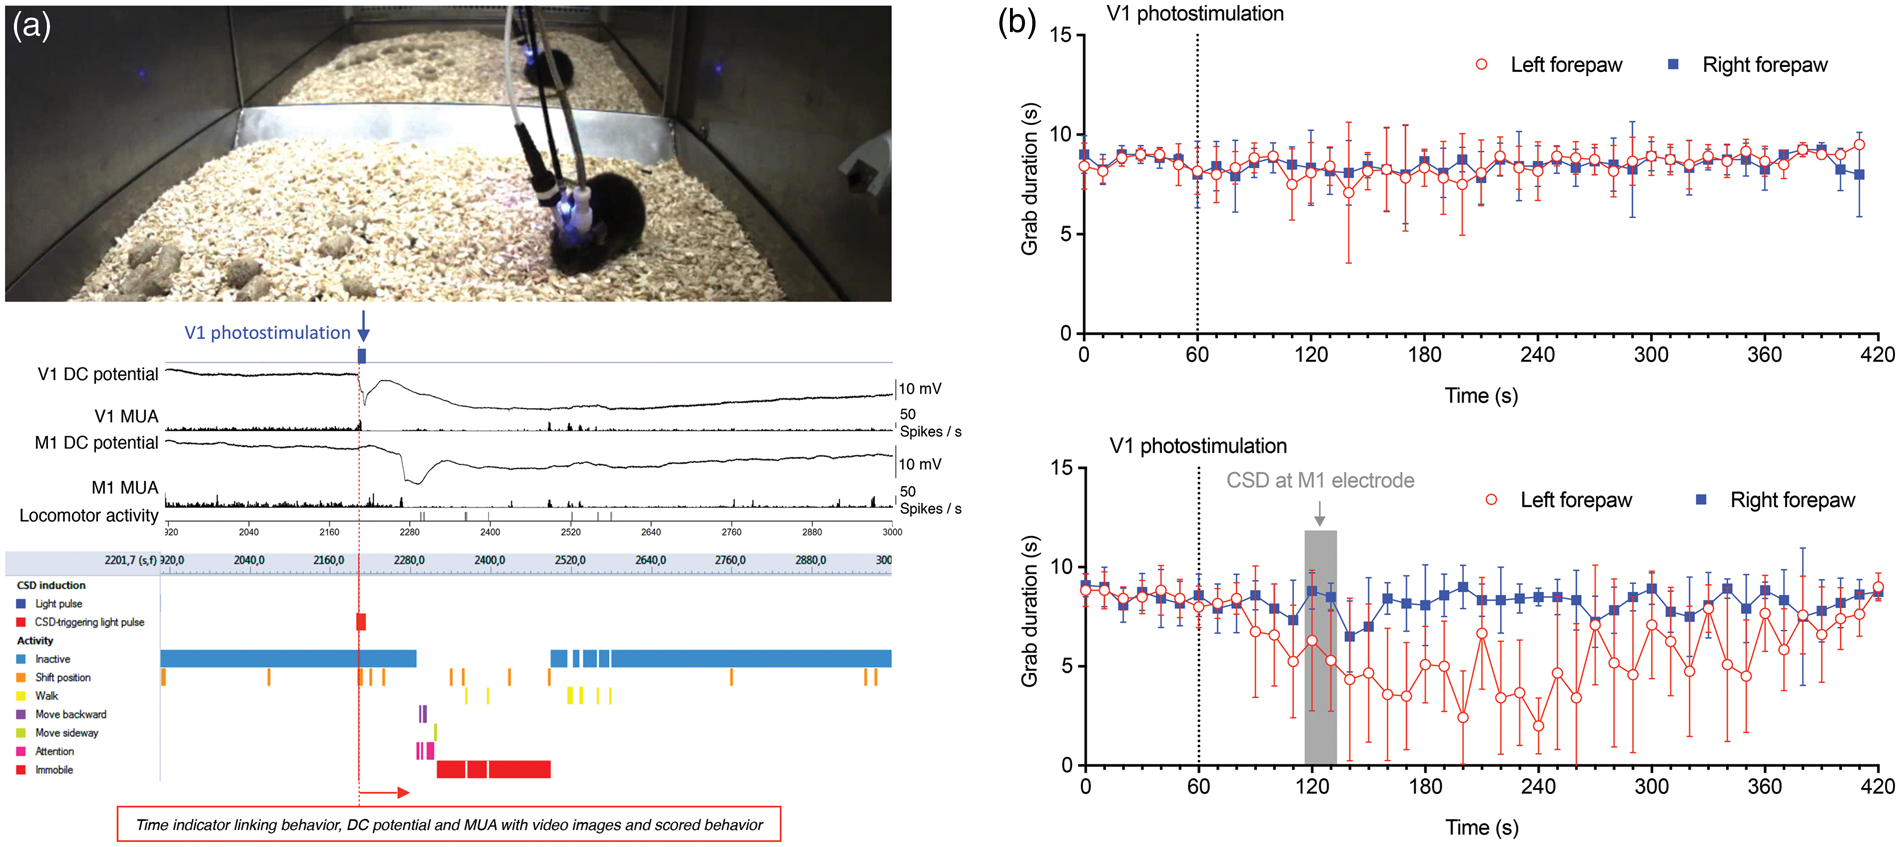
Changes in electrophysiological network activity and behavior following light-induced CSD in freely behaving Thy1/ChR2-YFP mice. (a) Typical example of changes in M1 electrophysiological network characteristics in relation to CSD. From top to bottom: stimulation light pulses (blue trace); M1 DC-potential (purple trace); time-frequency plot of M1 LFP (LFP 0–45 Hz, power in dB, scale depicted below trace); MUA (black trace); locomotor activity (black vertical lines, automatically detected with a passive infrared motion detection sensor). Note the start of locomotor activity 16 s after the CSD wave reached the M1 location and the increase in delta power during the recovery period following CSD. (b) Averaged vigilance state, power in LFP frequency bands, and the amount of active behavior plotted in 1 min time bins (n = 8 animals; analyzed from the first CSD threshold experiment). Vigilance state analysis shows high levels of non-REM sleep and low levels of REM sleep and locomotor activity during the recovery phase. Analysis of LFP power spectra during the recovery shows an initial suppression in all frequency bands, followed by a fast recovery of delta power. Horizontal lines indicate the mean power before CSD induction. Higher frequency bands recover more slowly at a similar pace as the MUA. The amount of active behavior (as quantified by video analysis) shows a peak in between 1 and 3 min after CSD initiation (n = 8; Dunnett’s multiple comparisons test after significant repeated measures one-way ANOVA), followed by a period of low behavioral activity levels. Effects of light-induced CSD on behavioral activity and cortical function. (a) Still of video (top) and matching electrophysiological V1 and M1 recordings (middle) and ethogram (bottom) showing a representative example of behavior observed before, during, and after CSD induction (see Results section for details). (b) Wire grip test showing equal grip duration for left and right forepaw before and after a subthreshold light pulse over the right V1 cortex, which does not induce CSD (top; P = 0.81, linear regression fit; see Supplementary Figure 4 for test details). Following suprathreshold photostimulation, right forepaw grip duration was not altered (bottom; P = 0.29). In contrast, grip duration of the left (contralateral to the CSD) forepaw was reduced following suprathreshold photostimulation (P < 0.001). The transient reduction is apparent in the data between 30 and 310 s after the suprathreshold photostimulation over the right V1 cortex, the start of which roughly corresponds with the CSD wave reaching the M1 electrode (gray shading indicates the time range in which the CSD wave arrived at the M1 electrode).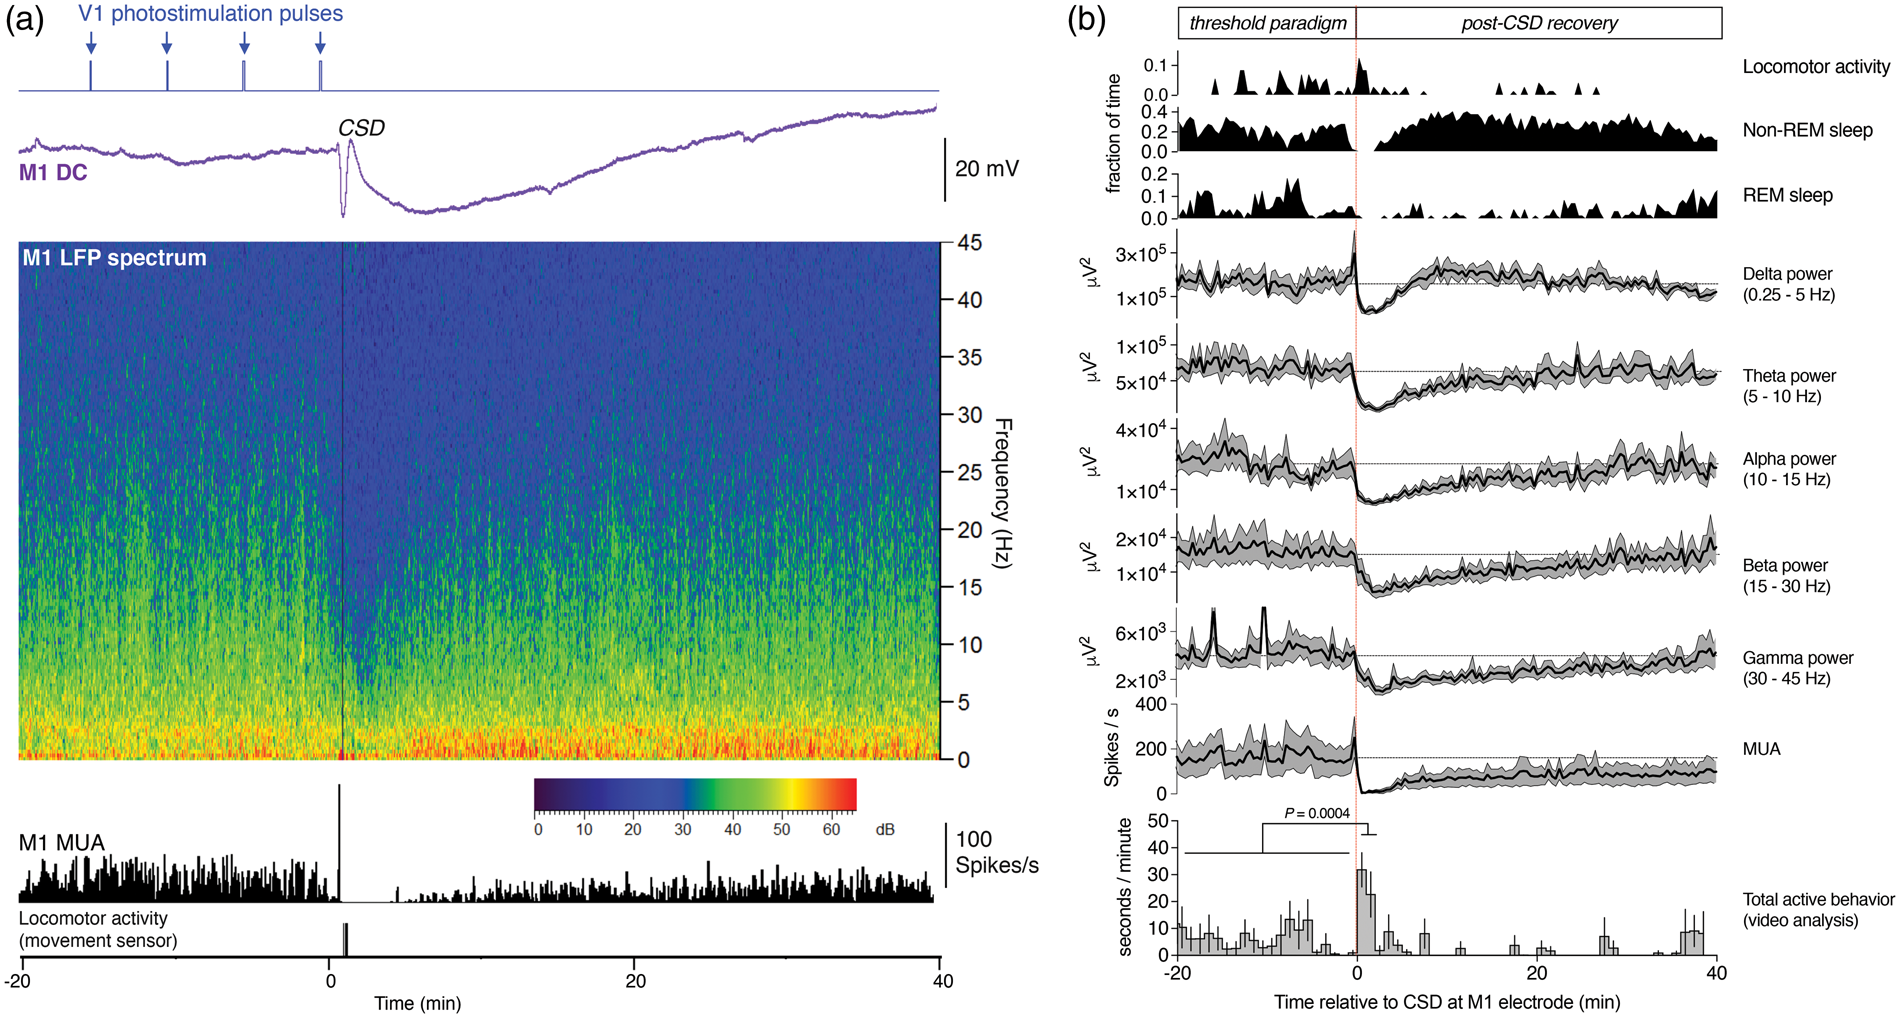
Effect of CSD induction on motor function
The start of increased behavioral activity (between 62 and 92 s) following CSD induction in V1 roughly corresponded with the time-point at which CSD was measured at the M1 electrode (between 52 and 67 s). No overt motor dysfunctions were apparent following the short period of increased activity. Separate experiments were therefore performed to assess whether a CSD wave passing the M1 cortex may disrupt motor function. To this end, a repeated forepaw wire grip test was performed (n = 6; Supplementary Figure 4) to assess the ability of a mouse to hold on to a wire with its forepaws before, during, and following optogenetic CSD induction in the right V1 cortex using a suprathreshold 460-nm light pulse. In control experiments, a subthreshold light pulse was used, which did not affect forepaw grip duration (Figure 6(b), top panel). In contrast, loss of left (contralateral to the CSD) forepaw function was evident in the time period after CSD induction, with the start roughly coinciding with the detection of the CSD wave at the M1 electrode (Figure 6(b), bottom panel). Analysis of the data revealed no difference between right and left forepaw grip duration in the subthreshold condition (P = 0.81) and no effect on right forepaw grip duration in the suprathreshold condition (P = 0.29). However, the effect of the suprathreshold condition differed greatly with respect to grip duration between the right and left forepaw (P < 0.001), indicating transient impairment of left forepaw motor function following CSD induction.
Discussion
We set out to establish a relatively non-invasive approach to elicit and record CSD in vivo using optogenetics. Using this approach, we could reliably induce CSD by photostimulation through intact skull to depolarize cortical neurons that express blue light-sensitive ChR2 channels in anesthetized and freely behaving Thy1/ChR2-YFP mice. CSD was recorded both invasively (DC-potential, LFP and MUA) and non-invasively (LDF and OIS). In control experiments, neither pulses of red (630 nm) light (that do not activate the ChR2 channels), nor light-induced rises in cortical temperature by illumination in Thy1/ChR2-YFP, nor photostimulation with blue or red light in C57BL/6J mice were able to induce CSD.
Characteristics of non-invasive light-induced CSD are similar to those with invasive induction paradigms
The main electrophysiological characteristics (i.e., amplitude, duration and propagation rate) of light-induced CSD in our optogenetic model, recorded by intracortical electrodes, are consistent with those observed for traditional, invasive induction methods, e.g. KCl-induction7,26,27 and electrical stimulation7,28 in mice and rats.7,29 Comparison of propagation rates of light-induced CSD when recorded by invasive intracortical DC-potential or non-invasive LDF recordings showed that both methods gave comparable results and the presence of burr holes for electrode placement did not affect CSD threshold or propagation rate. In addition, CBF dynamics of light-induced CSD recorded by LDF showed an initial hypoperfusion followed by a short recovery and longer-lasting post-CSD oligemia, consistent with mouse CBF dynamics seen for CSD induced with KCl or electrical stimulation. 26 Additional OIS imaging allowed us to establish that parenchymal and vessel diameter changes during light-induced CSD were also in line with previous studies using KCl or electrically induced CSD, 7 and provided spatial and temporal characteristics not obtained by our LDF measurements.
Advantage of non-invasive CSD induction over traditional invasive induction methods
Intracortical KCl injection, 7 placement of electrical stimulation electrodes, 28 or the exposure of the cortex for application of KCl-soaked cotton balls 30 have the potential to influence CSD characteristics, because these interventions combined with the need to drill a burr hole at the induction site can evoke CSD by mechanical damage to the cortex. In addition, both supra-physiological concentrations of KCl 31 and electrical stimulation 32 can cause considerable local tissue damage, and likely more so in cases when CSD is repeatedly triggered. Our data in anesthetized mice indicate that effects of invasive surgery do not appear to influence threshold and propagation rate of CSD. Invasive procedures may, however, alter effects of CSD on brain function, and behaviors that are relevant to neurological disorders.2,3 In this study, we used invasive intracortical electrodes to verify the characteristic electrophysiological features of CSD. We also showed that CSD could easily be monitored non-invasively through the intact skull with LDF or OIS approaches, showing their potential for application under awake (head-fixed) conditions.
Advantage of non-invasive CSD induction in freely behaving mice
A non-invasive CSD induction approach offers novel opportunities to investigate the effects of repetitive CSDs in freely behaving animals. Previous studies of CSD in freely behaving rodents have used either single or repetitive injections of KCl through a burr hole.33,34 The optogenetic model avoids some significant potential artifacts associated with these previous methods. We found that light-induced CSD in the optogenetic model had characteristics comparable to those observed under anesthesia, except for a shorter CSD duration, possibly due to the absence of anesthesia. Given the obvious effects of general anesthesia on brain cellular function and physiology, including reduced neuronal network activity 35 and reduced neurovascular coupling, 36 it is important to be able to examine CSD in the absence of anesthesia. A second advantage of our optogenetic paradigm is the ability to reliably induce CSD on multiple days in freely behaving animals with a consistent threshold for CSD induction for at least seven consecutive days. The model thus can be used to study the behavioral effects (like the shown transient motor dysfunction) of potentially exacerbating or therapeutic interventions over extended periods of time.
Neuronal depolarization suffices to initiate CSD
As optogenetics allows for cell-selective stimulation, our approach can be used to assess the role of individual cell types in the initiation of spreading depression. Although excessive neuronal depolarization has long been assumed to initiate CSD,3,5 previous studies on neuronal mechanisms of CSD initiation, as discussed above, may have been confounded by tissue damage. The ability to stimulate CSD in Thy1/ChR2-YFP mice, which exclusively express blue light-sensitive ChR2 cation channels 37 in deep layer cortical neurons18,19 demonstrates that light-driven depolarization of this specific neuronal population can evoke CSD. Earlier studies suggested an increase in extracellular K+ above a critical value as the key initiating event that sets off a cascade of neuronal and glial ion transients that may progress into CSD in an all-or-none manner.3,5 Extracellular K+ levels are influenced by various factors, including neuronal activity levels, vascular supply of oxygen and glucose, and astrocytic K+ buffering, each of which has been implicated in the initiation of SD.2,38–40 Although a recent study showed that neuronal activation via sensory afferents can trigger SD when the somatosensory cortex becomes hypoxic during experimental stroke, 41 our present results provide direct evidence that neuronal depolarization is sufficient for acting as the primary event initiating SD in intact, unchallenged brain tissue. Our data do not exclude the possibility that secondary activation of surrounding neurons (that do not express channelrhodopsin) or astrocytes could also be involved in CSD initiation.
CSD causes long-lasting changes in cortical electrophysiology and blood flow that influence subsequent CSD characteristics
Our light-induced CSD recordings replicated several of the after-effects of CSD that were previously reported for invasively triggered CSD, including the long-lasting post-CSD oligemia.26,39 Perhaps surprisingly, despite the abovementioned effects of anesthetic agents like isoflurane on cortical neuronal activity and CBF, we found similar values for CSD threshold, amplitude, and propagation rate for anesthetized and freely behaving mice. Notably, for both conditions the threshold for a second CSD (assessed 20 min after the first) was increased, whereas propagation rate was reduced. The changed CSD parameters seem correlated with the observed reduced network activity (evidenced by the reduced MUA during recovery period) and oligemia during post-CSD recovery.
Effects of light-induced CSD on behavior in freely behaving mice
Our non-invasive CSD induction paradigm presents a unique opportunity to investigate changes in behavior related to CSD in non-anesthetized and unrestrained mice. Between 1 and 3 min after the initiation of CSD, a transient increase in active behavior was observed, possibly reflecting transient activation of motor areas given the simultaneous detection of CSD by the M1 electrode. The behaviors during this active period alternated with one or more short periods of immobility, which may reflect freezing-like behavior described upon CSD induction in rats.24,33 This cannot be confirmed for our experiments since our video analysis did not consistently allow assessment of fixed staring. It is unclear whether the occasional observed head movements and crawling behavior may reflect painful sensation, also because “wet dog shakes” and grooming, which have been suggested to be signs of discomfort or pain, 24 were not observed. In line with the reduced behavioral activity starting 4 to 5 min after CSD induction, our vigilance state analysis showed that despite a general reduction across LFP spectral bands, the delta band showed fast recovery, perhaps even overshoot, that seems to coincide with an enhancement in non-REM sleep, which is in line with elevated delta power with increased sleep reported upon CSD in rats. 42 Optogenetically induced CSD in a defined cortical region was shown to disrupt specific behavior as assessed by wire grip tests that revealed clear transient contralateral forepaw wire grabbing impairment coinciding roughly with the CSD wave reaching the M1 cortex.
Future perspectives for optogenetically induced CSD
Our optogenetic CSD model has significant advantages as CSD events can be elicited over multiple days in a non-invasive fashion and can be used to investigate effects of CSD on cortical function, for example by combination with specific behavioral tasks. This provides opportunities for investigating effects of CSD in the context of normal as well as diseased cortical (dys)function. Future applications may lay in migraine and ischemia models, where optogenetically induced spreading depression (or depolarization) may provide clinically relevant insight in aura mechanisms and infarct evolution.1–3 In addition, our optogenetic model allows for characterization of effects of gene mutations, the influence of trigger factors, and therapeutic interventions relevant to CSD. Optogenetics have been successfully used in neuroscience studies, 15 ranging from (single-cell) neurophysiology19,43, to behavior, 44 which seems to suggest the introduction of channelrhodopsins does not have serious confounding effect on neuronal function. Finally, the possibility of optogenetics to selectively stimulate (or inhibit) other cell types 15 is expected to further our understanding of CSD mechanisms.
Footnotes
Funding
The author(s) declared the following potential conflicts of interest with respect to the research, authorship, and/or publication of this article: This work was supported by the European Union’s (EU) Seventh Framework programme “EUROHEADPAIN” (nr. 602633), EU Marie Curie IAPP Program “BRAINPATH” (nr 612360), a LUMC Fellowship, the Migraine Research Foundation (nr. 20142781), and the Dutch Organization for Scientific Research NWO (Spinoza 2009, nr. 91711319).
Acknowledgements
The authors thank Sandra van Heiningen, Nathalie Rieff, Danny van der Duin, Maaike van Putten, and Ludo Broos for help with experimental procedures, histological work, and genotyping. We also thank Dr. Erik van der Zwet for statistical support and Sander van Berloo and Bram de Visser for technical support with recording hardware.
Declaration of conflicting interests
The author(s) declared no potential conflicts of interest with respect to the research, authorship, and/or publication of this article.
Authors’ contributions
IL, TH and SB designed research, performed research, analyzed data, and wrote the paper. MS performed research, provided technical support and revised the manuscript. RAV analyzed data and revised the manuscript. MDF, JHM, GMT and AC provided financial support, helped design the research, and revised the manuscript. AMJMvdM and EAT designed research, provided financial support, analyzed data, and wrote the paper.
References
Supplementary Material
Please find the following supplemental material available below.
For Open Access articles published under a Creative Commons License, all supplemental material carries the same license as the article it is associated with.
For non-Open Access articles published, all supplemental material carries a non-exclusive license, and permission requests for re-use of supplemental material or any part of supplemental material shall be sent directly to the copyright owner as specified in the copyright notice associated with the article.