
Abstract
Cerebral blood flow, arterial pulsation, and vasomotion play important roles in the transport of waste metabolites out of the brain. Impaired vasomotion results in reduced driving force for the perivascular/glymphatic clearance of beta-amyloid. Noninvasive cerebrovascular characteristic features that potentially assess these transport mechanisms are mean blood flow (MBF) and pulsatility index (PI). In this study, 4D flow MRI was used to measure intra-cranial flow features, particularly MBF, PI, resistive index (RI) and cross-sectional area in patients with Alzheimer’s disease (AD), mild cognitive impairment and in age matched and younger cognitively healthy controls. Three-hundred fourteen subjects participated in this study. Volumetric, time-resolved phase contrast (PC) MRI data were used to quantify hemodynamic parameters from 11 vessel segments. Anatomical variants of the Circle of Willis were also cataloged. The AD population reported a statistically significant decrease in MBF and cross-sectional area, and also an increase in PI and RI compared to age matched cognitively healthy control subjects. The 4D flow MRI technique used in this study provides quantitative measurements of intracranial vessel geometry and the velocity of flow. Cerebrovascular characteristics features of vascular health such as pulsatility index can be extracted from the 4D flow MRI data.
Introduction
There is increasing evidence that cerebral arteries are often morphologically altered and dysfunctional in Alzheimer’s disease (AD).1–3 Cerebral blood flow, arterial pulsation, and vasomotion are reduced in AD patients, and thus the normal transmission of metabolites out of the brain is diminished. 4 Reduction in vascular elasticity and contractile force decrease the amplitude of the arterial pulse and slow the driving force for the perivascular clearance of interstitial fluid. This failure to dispose of soluble metabolites from the brain may have important implications for the pathogenesis of dementia.5–8 Consequently, there is interest in noninvasive methods to assess cerebrovascular hemodynamics as potential systemic indicators of AD. 9
One common approach for the probing of intracranial hemodynamic parameters is the use of Transcranial Doppler ultrasound (TCD), which has been used successfully in other hemodynamic studies. 9 However, TCD is difficult because vessel segment measurements depend on the direction of the blood flow with respect to the probe and its accuracy relies on an experienced operator and interpreter. TCD has a limited ability to detect distal branches of intracranial vessels. In some cases, sufficient penetration of the bone window cannot be achieved making examinations more difficult or even impossible. Assessment of multiple vessel segments is difficult. Therefore, TCD has significant limitations which impact reproducibility.
MRI is an appealing alternative that can provide both, vessel morphology and quantitative flow measurements. Macroscopic flow can be assessed with 2D PC MRI10,11 but comprehensive assessment of a vascular territory is time consuming because each vessel segment requires another 2D scan prescribed orthogonal to the local vessel orientation.
Because of the shortcomings of TCD and 2D PC MRI, few systematic studies have targeted the assessment of intracranial hemodynamic parameters such as flow and pulsatility across gender, age, or pathological conditions.9–11
Recent advances in MR hardware, data acquisition, and reconstruction have facilitated the use of 4D flow MRI in clinically feasible scan times. This approach enables both volumetric angiographic and quantitative assessment of blood flow velocities in a single acquisition. 12 The global brain coverage and good spatial and temporal resolution, make 4D flow MRI an excellent choice for comprehensive cranial hemodynamic assessment. The velocity flow field is captured at multiple phases of the cardiac cycle in a volumetric acquisition with three-directional velocity encoding. While 4D flow MRI has longer scan times than a single 2D PC MRI slice, for a comprehensive 2D PC MRI flow exam at least six individual scans would need to be acquired. Thus, the cumulative acquisition time for the 2D PC MRI exams exceeds the ∼7 min scan time for the 4D MRI flow exam. AD patients will likely be evaluated with MRI and PET in the near future, and adding 4D flow MRI is a small implemental cost that provides a global and local assessment of the cerebrovascular system. 4D flow MRI has the potential to save exam time compared to TCD and 2D PC MRI. 4D flow studies have shown to provide additional hemodynamic parameters such as wall shear stress, pulse wave velocity, pressure gradients, vessel area measurements, and more. 12
For 4D flow MRI all vessels are included in the imaging volume and can be probed for hemodynamic parameters after scan completion. Thereby, the total scan time is reduced and the vessel segments of interest can be identified during the analysis rather than during the scan session. Most 4D flow MRI has focused on the larger vessels because of less stringent requirements for spatial resolution. The small vessel diameters of the circle of Willis require submillimeter voxel sizes for proper flow analysis, which usually requires long scan times. One particularly well-suited approach for such high resolution flow imaging is Phase Contrast Vastly undersampled Isotropic Projection Imaging (PC VIPR),13,14 which uses the concept of radial undersampling 15 for a highly accelerated acquisition. This approach has been validated in various vascular territories, including the renal arteries, 16 thorax, 17 and cranial vasculature.18,19
Here, using 4D flow MRI, we investigated intra-cranial vascular anatomy and flow features; particularly mean blood flow rate, pulsatility index, resistive index, and cross-sectional area in three age matched groups: (1) patients with AD, (2) mild cognitive impairment (MCI) and (3) controls as well as a fourth group consisting of younger cognitively healthy controls.
Materials and methods
Subjects and clinical classification
A total of 314 participants from the Wisconsin Alzheimer’s Disease Research Center Clinical Core underwent brain imaging as part of studies on memory, aging, and risk for AD. Of these recruited individuals, 59 were older control adults (age range 63–89 y, mean = 74 y, 34 F), 37 AD patients (age range 57–91 y, mean = 73 y, 13 F), and 43 MCI patients (age range 52–87 y, mean = 73 y, 16 F). A healthy middle age group included 175 adults (age range 43–63 y, mean = 56 y, 115 F) who were cognitive healthy with a family history of late onset AD or no family history of AD. 20 As followed through time, this healthy middle age group allows assessing changes over larger time frames. All of these individuals were diagnostically characterized in the Wisconsin ADRC’s multidisciplinary consensus conferences using applicable clinical, laboratory and imaging criteria. 21 The University of Wisconsin Institutional Review Board approved all study procedures and protocols following the policies and guidance established by the campus Human Research Protection Program (HRPP). Each participant provided signed written informed consent before participation.
Cognitive assessment
The population of the present study is part of the large National Alzheimer’s Coordinating Center’s (NACC) Uniform Dataset. Data collection was performed according to NACC guidelines. Study visits included a brief history and physical exam conducted by a trained clinician (including medication review), a comprehensive neuropsychological battery consisting of tests addressing overall dementia severity, executive function, processing speed, memory and language, MRI, blood testing, as well as the option for a lumbar puncture for the collection of CSF biomarker data. No subject was excluded from this study after medication review (Supplementary Material). Following this array of tests, a consensus diagnosis was determined at a weekly conference meeting, comprising at least one physician (geriatrician or neurologist) and at least one neuropsychologist, who discuss and synthesize the myriad testing results. Subjects given a consensus diagnosis of a non-Alzheimer’s variant of dementia, such as Frontotemporal Dementia, Lewy Body Dementia, or Vascular Dementia, were excluded from the WADRC Clinical Core study.
MR imaging protocol
Part of the baseline visit for the subjects was an MRI exam. The Wisconsin ADRC clinical core scan protocol includes: perfusion arterial spin labeling (ASL auto shim), diffusion tensor imaging (DTI – 40 direction), diffusion weighted imaging (DWI), T1 and T2 weighted imaging (T1 Bravo, T2 Cube, T2 Flair), fMRI (Resting BOLD), and an optional 4D flow MRI acquisition. Determination of microscopic cerebral blood flow using ASL and how it correlates with macroscopic flow using PC VIPR will be beyond the scope of this investigation and will be a component of a feature report. Participants were scanned using a 3 T clinical MRI system (MR750, GE Healthcare, Waukesha, WI) with an 8 channel head coil (Excite HD Brain Coil, GE Healthcare, Waukesha, WI), a gradient strength of 50 mT/m, and a gradient slew rate of 200 mT/M/ms. Volumetric, time-resolved PC MRI data with three-directional velocity encoding were acquired with a 3D radially undersampled sequence (PC VIPR),13,14 a research sequence, with the following imaging parameters: velocity encoding (venc) = 80 cm/s, imaging volume = 22 × 22 × 10 cm3, acquired isotropic spatial resolution = (0.7 mm)3, repetition time TR/ echo time TE = 7.4/2.7 ms, 14,000 projection angles, scan time = (14,000)(7.4 ms)(4 velocity encoding) ∼ 7 min, readout length = 320 data points (0.75 fractional echo), flip angle α = 10°, receiver bandwidth =±83 kHz with |BW| = 166 kHz. Time-averaged magnitude and velocity data were generated with an offline reconstruction for all subjects. For 160 subjects, fiducials markers of the cardiac cycle were available and dynamic data were reconstructed with retrospective gating into 20 cardiac phases using temporal interpolation.
22
Of these 160 individuals, 30 were older control adults (age range 66–89 y, mean = 74 y, 17 F), 20 AD patients (age range 61–89 y, mean = 73 y, 6 F), 28 MCI patients (age range 52–87 y, mean = 72 y, 12 F), and 82 cognitively healthy middle age adults (age range 47–63 y, mean = 57 y, 62 F). Figure 1 shows an example of PC VIPR data as (a) coronal, (b) axial, and (c) sagittal maximum intensity projection (MIP) images of the PC angiogram, derived by combining the magnitude and the mean velocity data.
PC VIPR data shown as (a) coronal, (b) axial, (c) sagittal MIP image of the PC angiogram and corresponding view of the segmented arteries with eleven flow analysis planes placed perpendicular to the vessel path (d, e, f). (g) Carotid terminus segmented with blood flow velocity vectors and distribution on the MCA. (h) Pulsatile flow waveform through the cardiac cycle recovered from the PC VIPR data.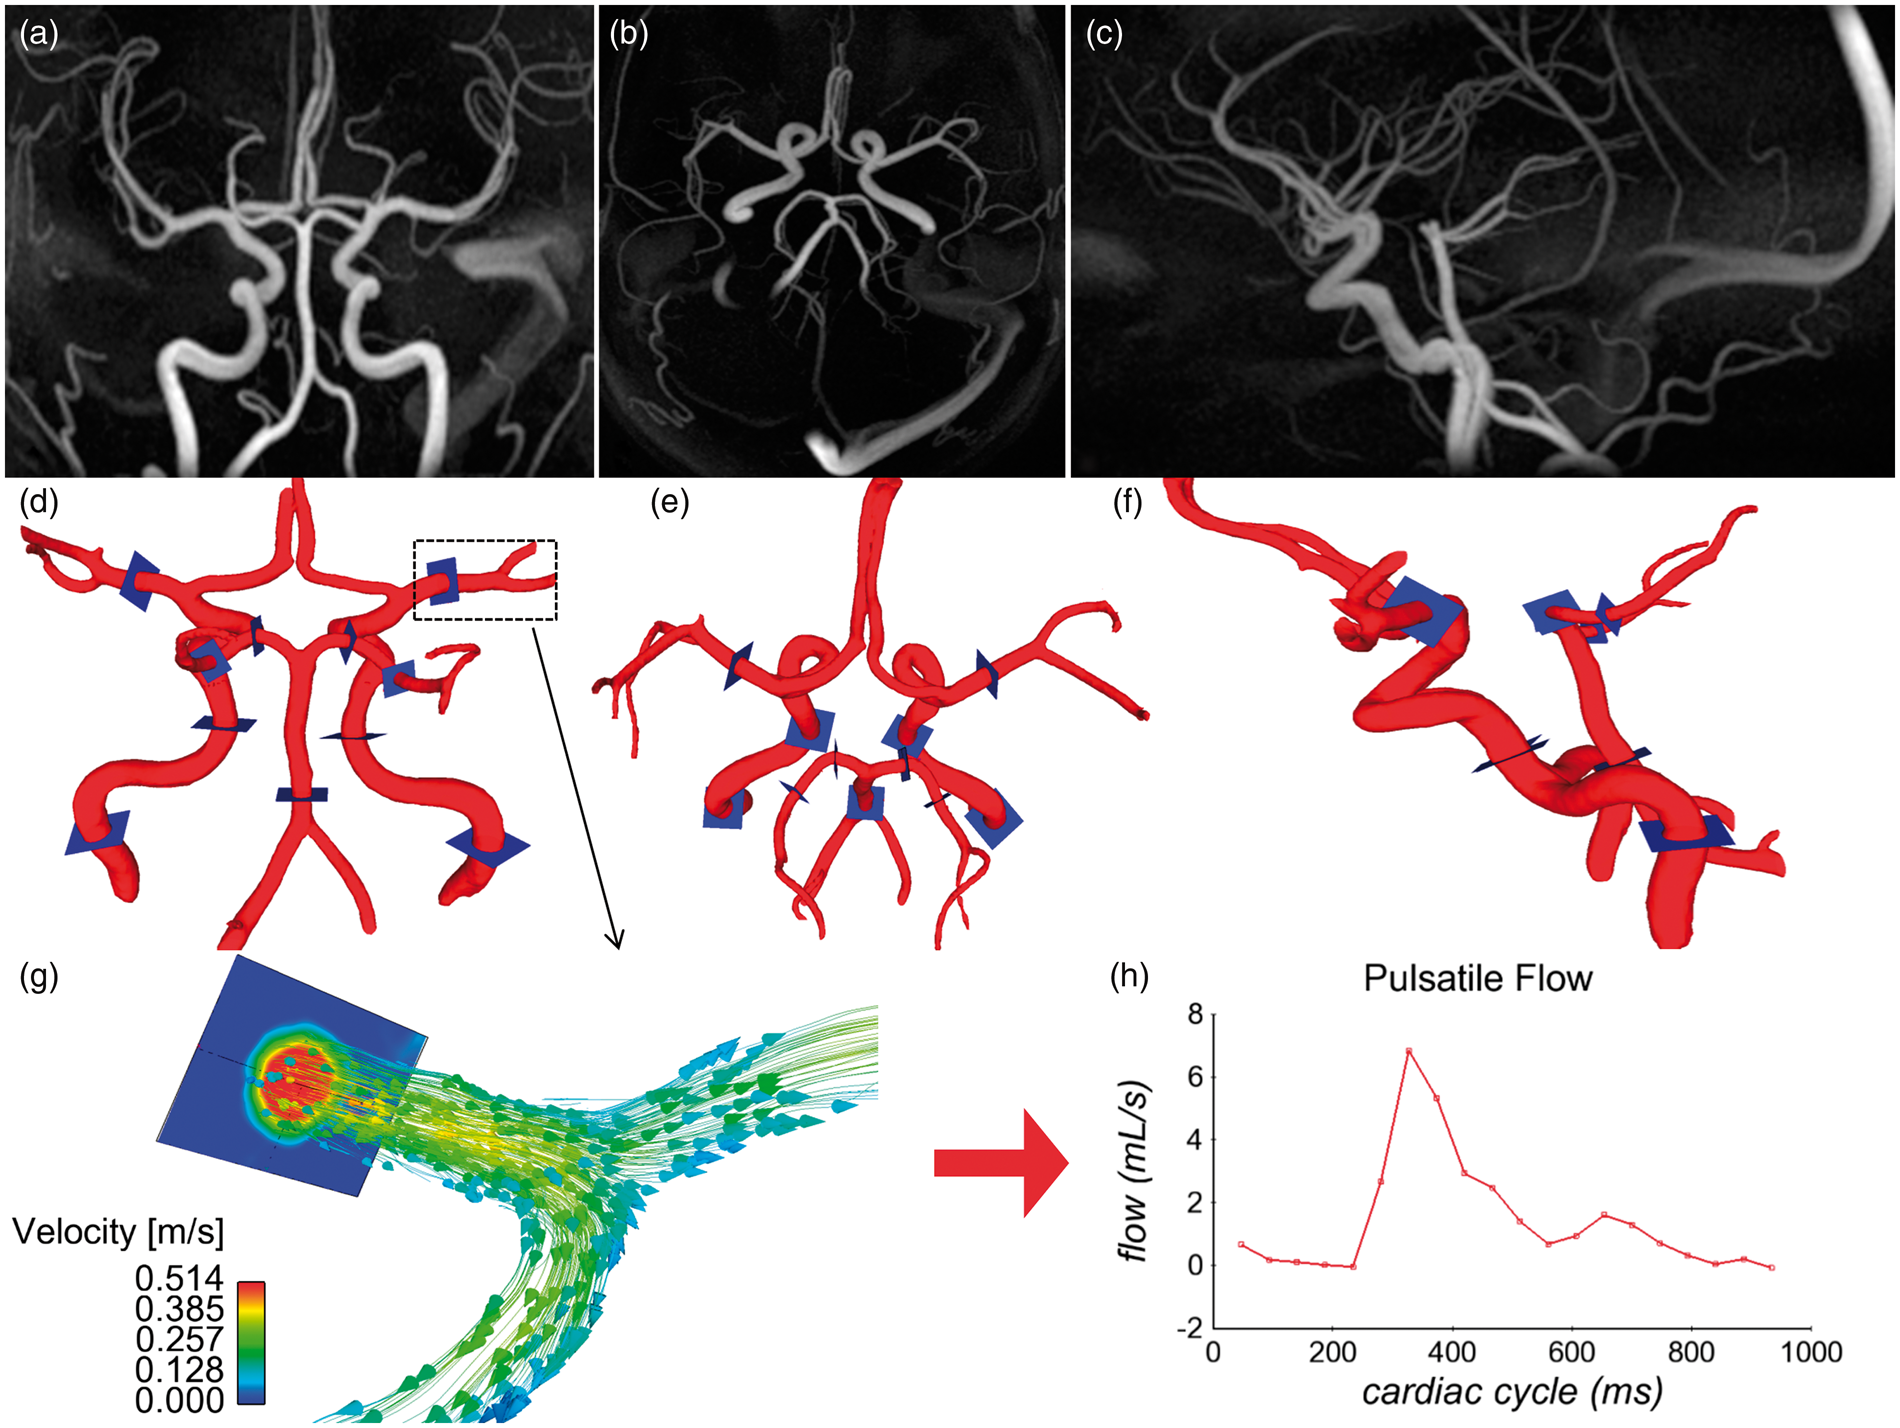
Post processing: Flow analysis
Vessel segmentation was performed in Matlab (The Mathworks, Natick, MA) on the PC angiograms, while interactive flow visualization and selection of planes for quantitative analysis were carried out in Ensight (CEI, Apex, NC). For this purpose, flow analysis planes were manually placed orthogonal to the vessel orientation in 11 vessel segments as shown in Figure 1(d) to (f): distal cervical internal carotid artery (ICA) (left and right), distal petrous ICA (left and right), 5 mm above the basilar artery origin, 5 mm from the middle cerebral artery origin (left and right), and the proximal posterior cerebral artery (PCA) P1 and P2 segments (left and right). The flow analysis planes were placed by a graduate student (LRR) under the supervision of a senior neuroradiologist (PT). Figure 1(g) shows velocity vectors in the carotid terminus including the MCA through the M1 segment. 2D cine images series with through plane velocities were generated from the 4D flow MRI data and analyzed in a customized Matlab tool 23 that automatically detected the edge of the vessel wall. Mean blood flow, pulsatility index (PI = (Qmax − Qmin)/Qmean; Q = flow), resistive index (RI = (Qmax − Qmin)/Qmax) and cross-sectional area were calculated for all vessel segments and groups. Although RI is mathematically similar to PI, it provides information regarding the microvascular bed distal to the site of measurement and provides another parameter to characterize cerebrovascular flow features. RI has proven valuable assessing long term outcomes in chronic renal pathologies. 24 Figure 1(h) shows the pulsatile flow waveform as a function of the cardiac cycle, which was needed to compute PI and RI with measures of the maximum flow Qmax, the minimum flow Qmin, and Qmean, the mean flow throughout the cardiac cycle.
Classification of variations in the Circle of Willis
Anatomical variations in the Circle of Willis are common and can influence the blood flow distribution. Therefore, exams were cataloged into four groups 10 : (1) “complete textbook” type, (2) P1 hypoplasia, (3) A1 hypoplasia and (4) other. The “textbook” type had both the pre-communicating segments of the posterior cerebral arteries (P1) and the pre-communicating segments of the anterior cerebral arteries (A1). The next classification included right or left P1 hypoplasia. Left and right P1 hypoplasia was combined into the same group of P1 hypoplasia since no significant differences between P1 hypoplasia on the right and left sides have been found.25,26 The same was done for the next classification: left and right A1 hypoplasia was combined into the A1 hypoplasia group. Other variations that included bilateral P1 hypoplasia, combinations of A1 hypoplasia and P1 hypoplasia were classified as “other” type. For proper classification, vessels were inspected in the PC VIPR angiograms as well as the magnitude images for anatomic variations to eliminate the potential influence of slow flow on the PC angiograms. The threshold of hypoplasia was set at 1.0 mm, consequently any artery with a diameter less than 1.0 mm was judged to be hypoplastic or absent. The PCA measurements were performed proximal and distal to the formation of the PCA. On instances the P1 segment was hypoplastic, then the proximal PCA measurement would be perform on the posterior communicating artery, which function as the collateral for the circulation of the PCA when there is a hypoplastic P1 segment. The distal measurement was always performed on the P2 segment. No significant differences were found between proximal and distal PCA segments. The A1 segments were not part of the hemodynamic analysis, but only inspected for morphology classification.
Statistical analysis
To reduce the number of statistical tests, we used the mean value between left and right segments for each paired artery. If an artery was not present, or could not be analyzed due to a technical problem, the contralateral artery was used (except for the basilar artery segment). For the AD population the instances that only one artery segment was available for the computation of PI and RI was on 3 occasions for the inferior ICA segment, 2 occasions for the proximal PCA segment, and 3 occasions for the distal PCA segment. For the MBF and cross-section analysis it occurred on 3 occasions for the inferior ICA segment, 3 occasions for the proximal PCA segment, and 4 occasions for the distal PCA segments. Parameter values between left and right sides can vary considerably. In some subjects differences were smaller than 1% between left and right sides, but in other subjects differences could account up to 100% for MBF, 50% for cross-sectional area, 30% for RI and 25% for PI. Although left and right side values can vary, no significant bias towards the results should be expected since the instances that only one segment was used were not many. Values for mean blood flow, PI, RI and cross-sectional areas across the vessel segments were compared between all four populations (AD, MCI, old healthy controls, and middle age controls). After averaging bilateral segments the mean value of six vessel segments were available to compare with subject populations. The four populations provide a maximum of six permutations per segment. The association between group and vessel segment was assessed using ANOVA followed by Tukey’s honestly significant difference procedure for pairwise comparison for adjusted means. The statistical analysis was conducted in Matlab (The Mathworks, Natick, MA). There are a total of 144 comparison pairs. For example, in the MBF analysis one of the MBF pairs is the comparison of mean blood flow in subjects with AD versus old control group in the MCA.
Results
Hemodynamic parameters
Results for the hemodynamic analysis are summarized for all vessel segments in Figures 2 to 6. Figure 2 shows color maps of the PI throughout the arterial tree for three subjects: AD (a, b, c), MCI (d, e, f), and age matched control (g, h, i). The PI was higher for the AD subject throughout the vascular tree when compared with the MCI and age matched control. The MCI subject also had higher PI when compared with the age matched control. Although inherent errors exist in the calculation of PI, namely spatial resolution variation due to the intrinsic averaging of MRI and the inherent noise, the same methodology is applied to each subject, and should result in group wise differences when comparing this calculation over large cohorts. Statistically significant differences were found for mean blood flow and PI (Figures 3 and 4), and for RI and cross-sectional area (Figures 5 and 6) between the groups population in the inferior ICA, superior ICA, MCA, proximal PCA, distal PCA, and basilar artery segments. The basilar artery segment showed fewer statistical significance differences than any other segment. These bar plots contain the mean values and standard deviations for all analyzed parameters. In addition, pairs that were found not to be statistically different are marked in these figures.
Pulsatility index throughout the intra cranial arterial tree shown as coronal, axial and sagittal color maps for an AD subject (a, b, c), an MCI subject (d, e, f,) and an age matched cognitively healthy control (g, h, i). Mean blood flow (mL/min) for 314 subjects including patients with AD, MCI, the normal age matched (old) control group, and a middle age control group. Left and right branches are reported together. The four populations were compared with each vessel segment using ANOVA followed by Tukey’s Honestly Significant Difference Procedure. For example: for the ICA inferior segment there are six comparisons which are outlined by the brackets. For each vessel segment, the mean flow is statistically different among all cohorts, with exception of 10 pairs. These pairs that were not found to be statistically significantly different are indicated by the symbol “°”. Pulsatility index for the 160 subjects in all four groups that had ECG information recorded. Out of the 36 pairwise comparisons all but the 12 pairs indicated by the “°” symbol showed statistical significance. Resistive index. Out of the 36 pairwise comparisons all but the 13 pairs indicated by the “°” symbol showed statistical significance. Cross-sectional area (mm2). Out of the 36 pairwise comparisons 18 pairs indicated by the “°” symbol did not showed statistical significance.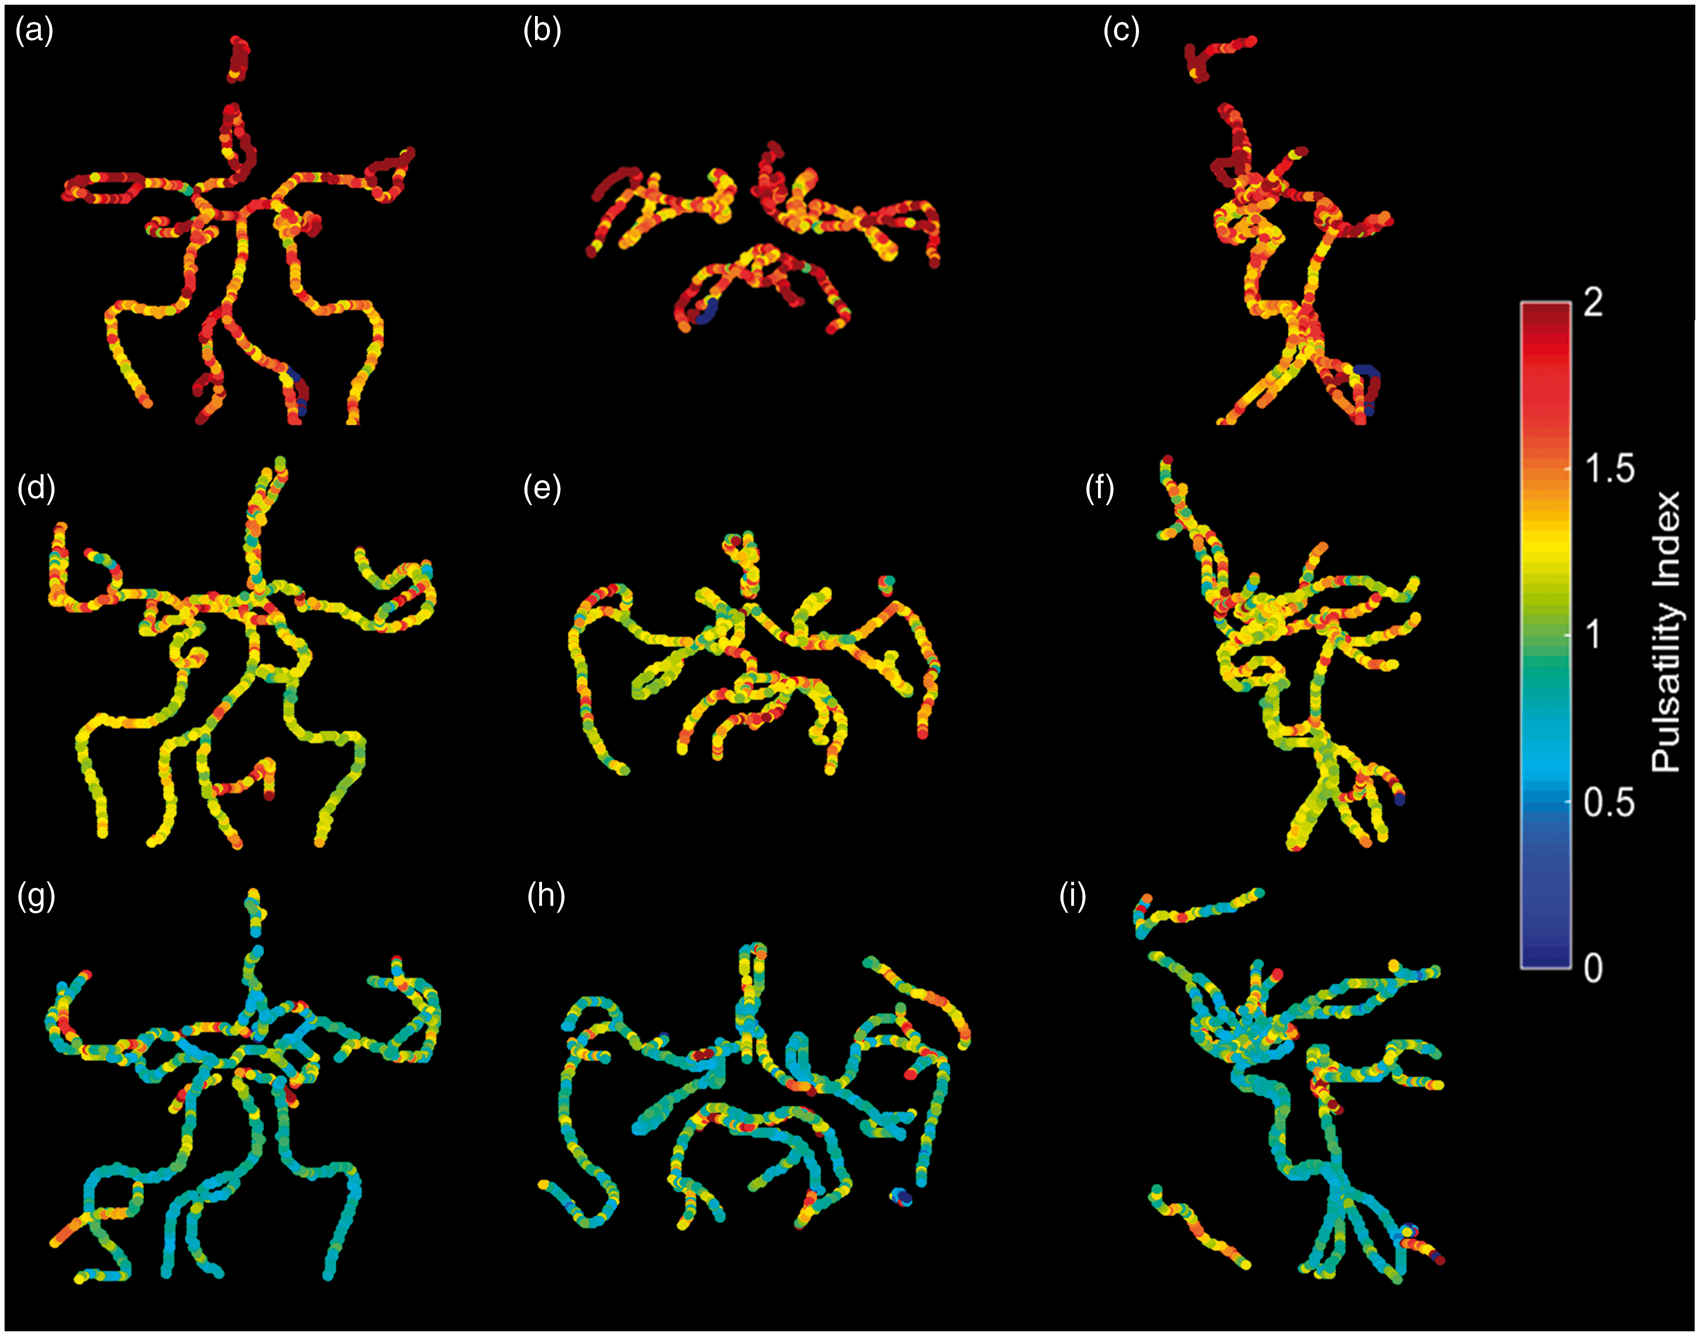
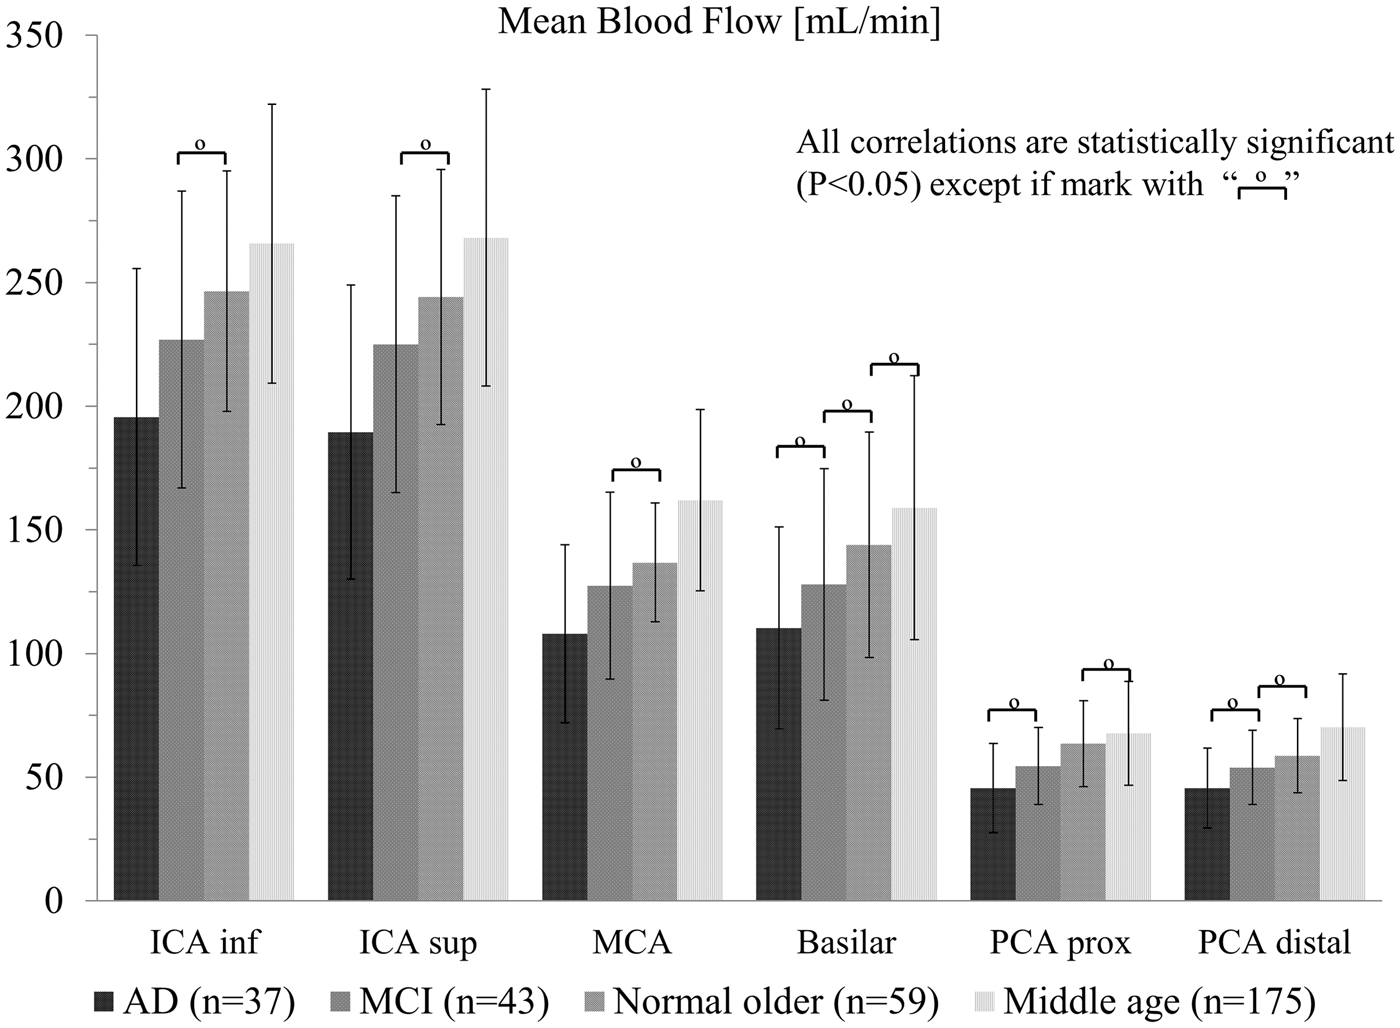
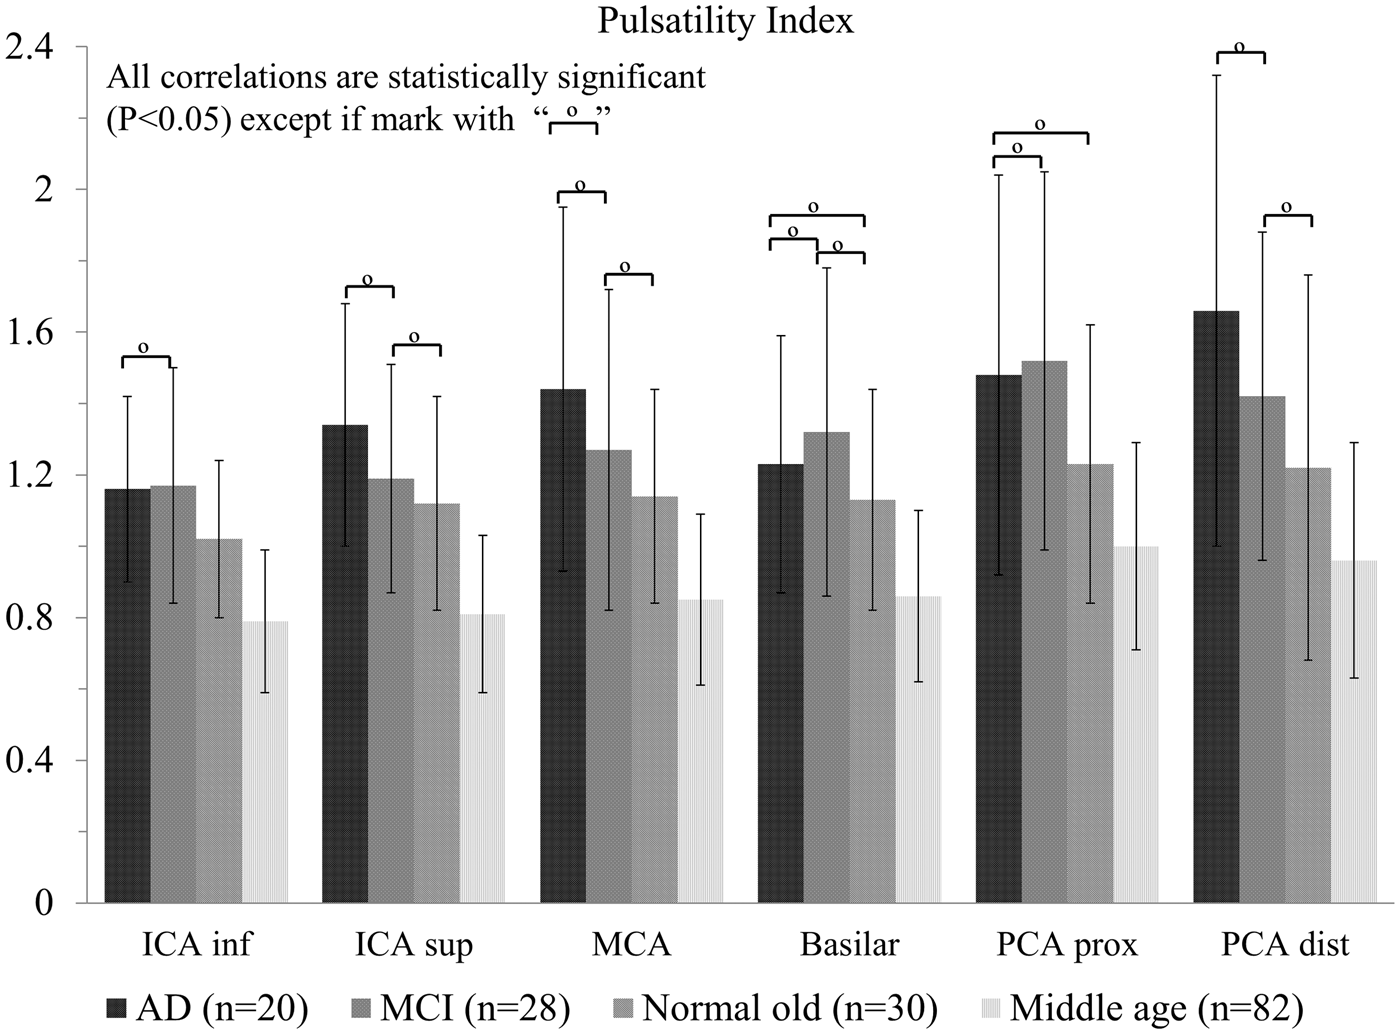
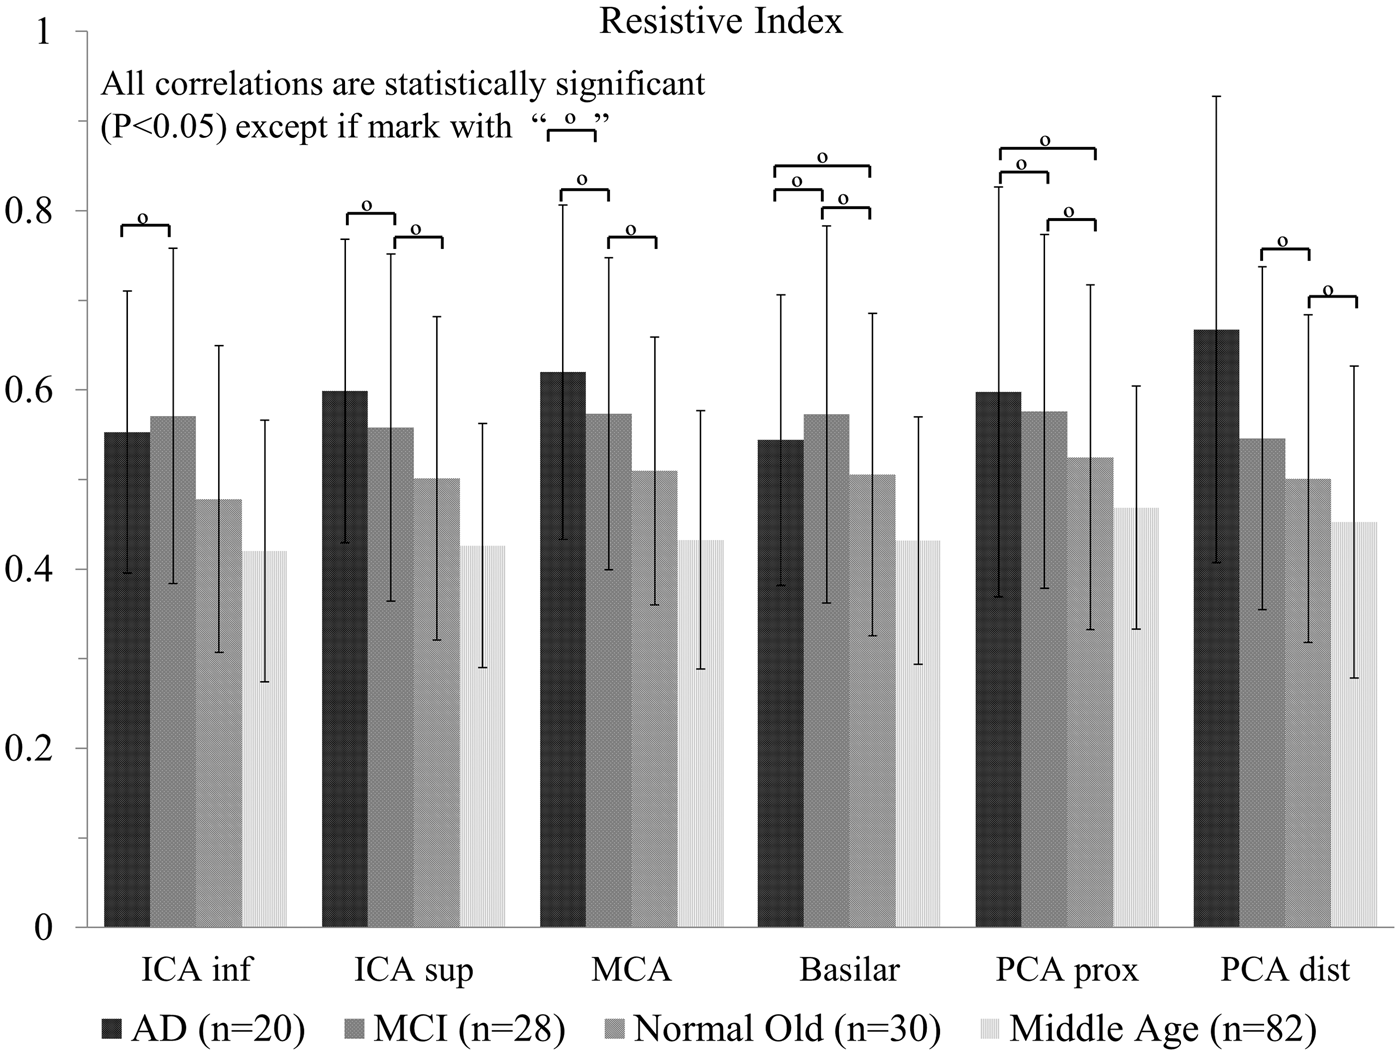
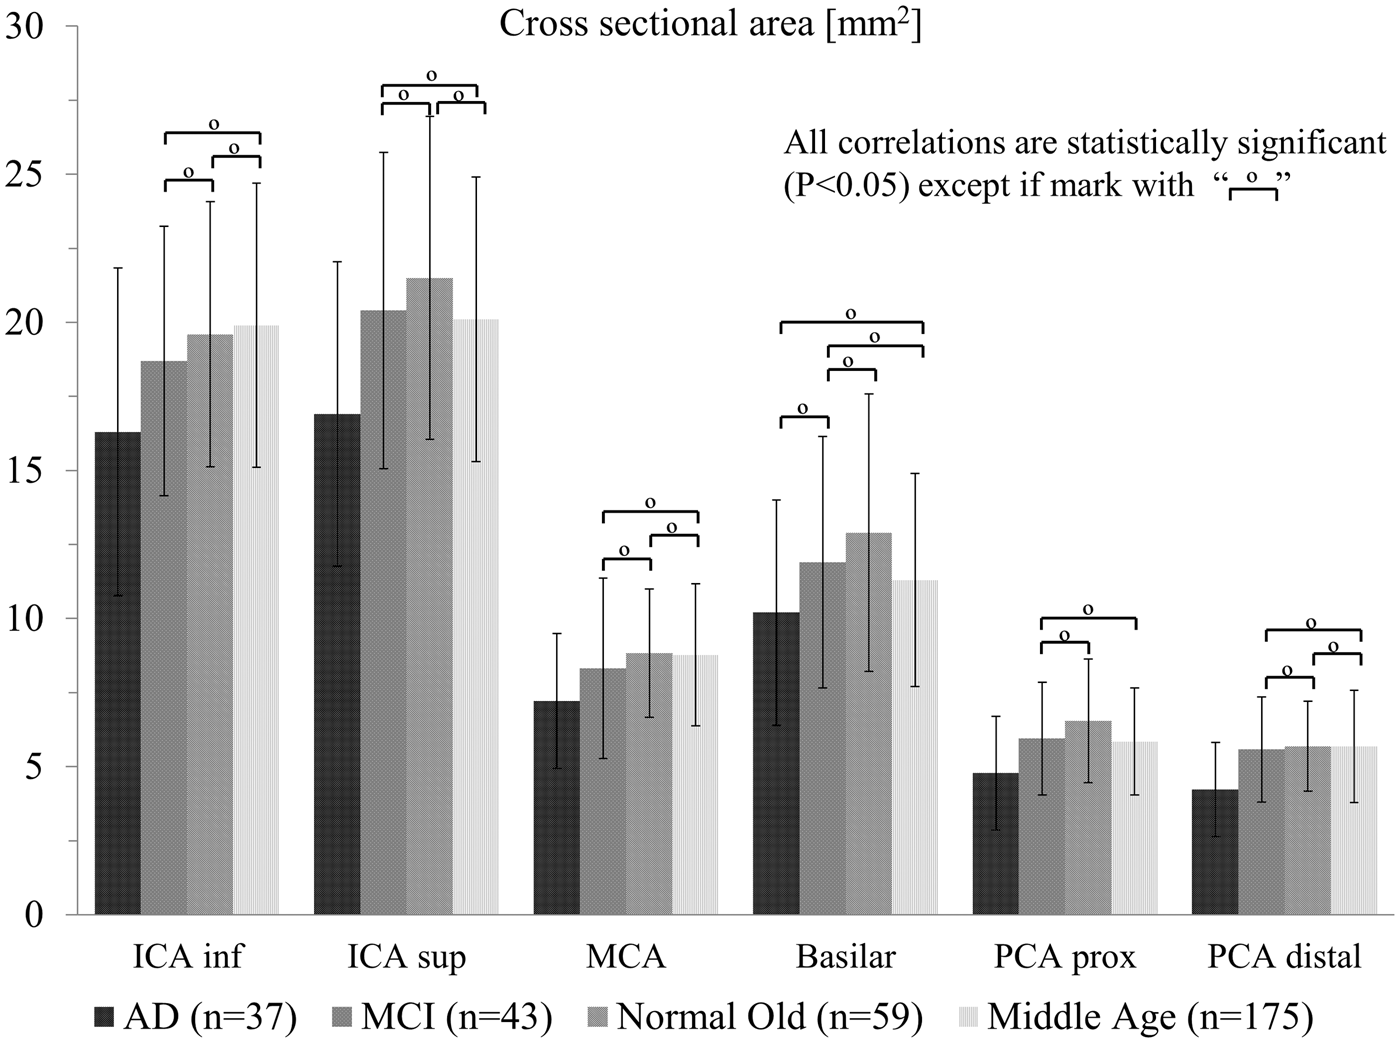
No significant difference was found for PI between the AD and MCI groups. For the RI only the distal PCA segment had a statistical significant difference between AD and MCI groups, with the RI of the AD group higher than that of the MCI group. The cross-sectional area for the AD group was smaller in all segments when compared with the normal age matched control group, with all comparisons reaching the threshold for significance. When compared with the middle-aged and MCI group, all comparisons except the basilar artery segment reached statistical significance. The AD population had the lowest mean blood flow values and smallest cross-sectional area for all vessel segments when compared with all groups.
The relationship between subject’s parameters (MBF, PI, RI, and cross section) and age ware investigated, but no significant linear relationship was found. Linear correlation between MBF and PI in the MCA was studied and no significant relationship was found. ROC curves for MBF and PI in the MCA demonstrate fair to poor accuracy to discriminate between AD and age matched controls (Supplementary Material).
Variation in the Circle of Willis
Classification of the Circle of Willis for all cohorts.
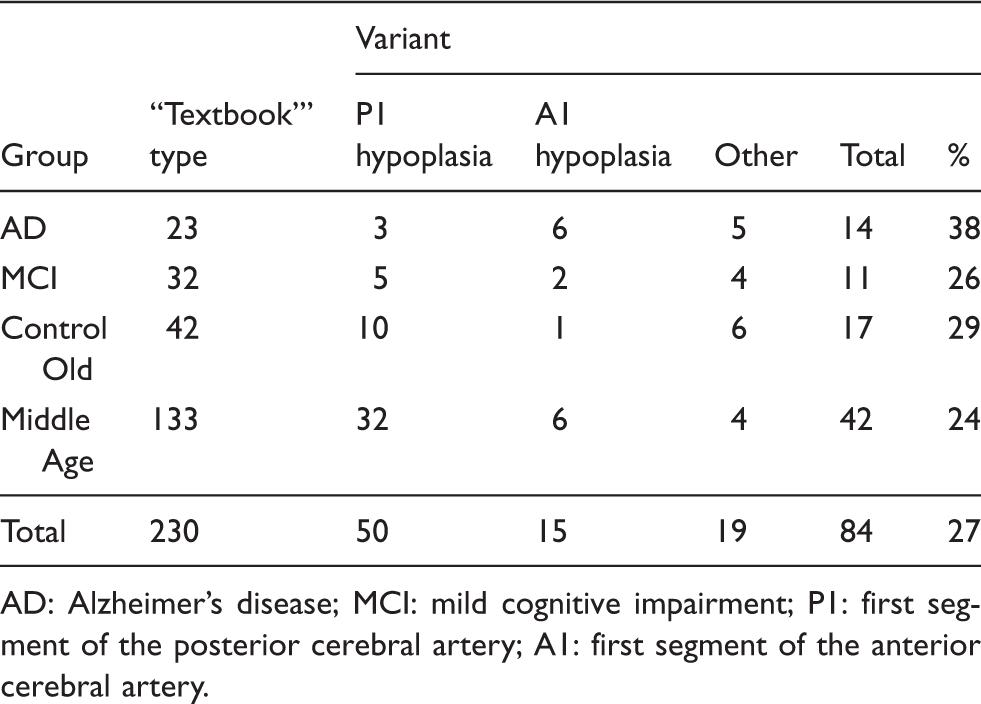
AD: Alzheimer’s disease; MCI: mild cognitive impairment; P1: first segment of the posterior cerebral artery; A1: first segment of the anterior cerebral artery.
Discussion
With increasing evidence that supports a vascular component in the pathogenesis of AD, models and mechanisms are needed that assign a primary role to the vascular component in AD development. Besides cellular enzymatic proteolysis, there are two other major clearance mechanisms that contribute to the elimination of beta-amyloid protein from the brain: transports through the blood brain barrier and perivascular drainage. 27 It has been suggested that impaired vasomotion, the rhythmic modulation of arterial diameter, may result in weakened autoregulation, hypoperfusion and reduced driving force for the perivascular/glymphatic clearance of beta-amyloid. 28 These effects in turn are hypothesized to facilitate a cycle of beta-amyloid accumulation. The perivascular and glymphatic pathways of beta-amyloid clearance are thought to be driven by the systolic pulse. The vasomotion changes in diameter are of similar amplitude and could contribute to the mechanism of beta-amyloid clearance. In this scenario the arterial pulsation mechanisms plays an important role in the removal of beta-amyloid out of the brain and these mechanism “pumping” action is diminished in AD.
The failure to dispose of soluble metabolites from the brain has important implications for the pathogenesis of dementia.5,29 Studies suggest vascular pulsation is the motive force for perivascular drainage of soluble metabolites. 30 As arteries age they become stiffer, implying a reduction in the amplitude of vascular pulsations. 31 This reduction may reduce the driving force of perivascular drainage and the consequent drainage slowing may allow beta-amyloid protein fibril formation to occur within the basement membranes of the perivascular pathways. Experiments in mouse brains 32 have also shown there is an effect of age on the perivascular drainage in different regions of the brain; this may have a role in the distribution and deposition of beta-amyloid plaques in the brain in AD. Lack of integrity of arterial walls and endothelia will decrease the vasodilatory response, and it is thought that this will reduce blood flow and volume in frontotemporal white matter and subcortical grey matter. Reduction in vascular elasticity and contractile force may diminish the amplitude of the arterial pulse and slow the driving force for the perivascular clearance of interstitial fluid and beta-amyloid protein plaques leading to its accumulation.
Four-dimensional flow MRI with radial undersampling enables blood flow measurement and vessel caliber measurements in all major cerebral arteries with a single scan. PC VIPR has been validated by comparison with more standard techniques and has shown approximately 30% lower mean velocity when compared with transcranial Doppler (TCD), consistent with other comparisons of TCD with PC MRA. 18 The differences in velocities are mostly due to temporal averaging over multiple heartbeats in the ECG gated MRI acquisitions. 4D flow MRI serves as a powerful tool for clinicians that are interested in blood flow measurements and vessel morphology. Previous studies25,33 have reported considerable variations of cerebral blood flow among subjects. Differences of flow rate are typically due to subject variability and variations in the Circle of Willis.
Arterial wall stiffening is the result of a complex combination of changes that include endothelial cell and basement membrane dysfunction, increase in collagen, decrease in elastin, calcification, and alterations in wall shear stress among others. 34 Arterial wall stiffening will eventually result in a widening of the arterial pulse pressure. Arterial pulse pressure is define as the difference between systolic and diastolic pressure, as the arterial wall stiffen and losses compliance the systolic pressure peak will increase in magnitude making the pulse pressure difference wider. A highly compliant artery has a smaller pulse pressure for a given stroke of volume in the artery than a stiffer, less compliant, artery. The process of normal aging may increase arterial stiffness and has been associated with increases in artery lumen diameter; 35 however, this has been disputed by others. 36 A wider arterial pulse pressure in regions local to bifurcations will cause more turbulent flow and altered wall shear stress. Variations in wall shear stress contribute to endothelial dysfunction and wall degeneration.37,38 In compliant arteries, increased pulsatile perfusion can impact autoregulation. Autoregulation of cerebral blood flow is the ability of the brain to maintain relatively constant blood flow despite changes in perfusion pressure. 39 A reduction of wall compliance has been reported to block important processes involved with autoregulation 40 and has been associated with impaired microvascular reactivity. 41 Higher artery stiffness has been associated with decreased cognitive function and higher carotid-femoral pulse wave velocity (a measure of arterial stiffness) with lower Mini-Mental State Examination scores and fewer words recalled on auditory verbal learning tests. 42 A higher carotid-femoral pulse wave velocity has also been associated with a reduced blood flow in the frontal and parietal white matter of the brain, regions predisposed to microvascular damage in individuals with abnormal aortic stiffness. 43
In pathologically confirmed AD subjects, it has been shown44,45 that there is a greater amount of atherosclerotic stenosis of the cerebral arteries than in age-matched controls. In the AD population, the intracranial arteries demonstrated a significant reduction in cross-sectional area, which can be due to atherosclerotic plaque and calcifications contributing to stiffening of the arterial walls. These alterations progressively diminish the arterial compliance and compromise brain blood flow. In addition, these pathophysiological changes are probably complicated by precapillary arteriolosclerosis caused by the process of aging. Superimposed on these pathological features, the deposition of amyloid along the cerebral microvasculature that occurs in AD may further contribute to increase PI and decrease MBF in AD. Vessel rigidity due to arteriosclerosis, atherosclerosis and amyloid deposition will ultimately translate into the inability to dissipate the systolic pressure created by the heart. Intra-cranial PI is also an indicator of increased distal resistance to blood flow within the microvasculature which is often related to small vessel disease. 46 Results from studies that have used TCD to determine the effect of AD on blood flow to the brain47–52 are in agreement with our findings that the PI and MBF values for AD and age-match control subjects are statistically different, with higher PI and lower MBF in the AD group. More recent studies are in agreement with our MBF values when looking at older healthy adults using PC MRI techniques. 11 A possible cerebrovascular characteristic feature to detect early vascular dysfunction in subjects at risk of AD is cerebrovascular reactivity. Cerebrovascular reactivity is the response of brain vessels to changing arterial tension of carbon dioxide. There is evidence that cerebrovascular reactivity to carbon dioxide is impaired in AD. 53 Carbon dioxide elevation causes vasodilation and an increase in cerebral blood flow, while carbon dioxide reduction results in a cerebral blood flow decrease. The significantly reduced cross-sectional area values found for the AD population could be an indication of chronic hyper contractility in brain vessels in AD.
Statistically significant differences were found for MBF, PI, RI, and cross-sectional area between AD and MCI patients and normal control groups in most vessel segments. The mean blood flow was the lowest for the AD and MCI populations, which suggest a relationship between blood flow to the brain and the subjects’ pathology. The PI and RI were higher for the AD and MCI subjects, when compared with the controls. These results are similar to those reported in a study based on intracranial ultrasound and are thought to be a consequence of increased arterial rigidity and decreased arterial compliance combined with age-associated cardiovascular output declines. 9 Future outlook will be to compare perfusion and regional tissue flow with macroscopic supply to study their relationships.
The AD population showed a higher incidence of anatomical variants in the COW. 38% of the AD population had a variant anatomy of COW versus a 29% of old control subjects. 27% of all the subjects had a variant type anatomy of the COW, which is a higher percentage than those reported in studies of a younger, cognitively healthy population. 10 A more recent study reports a variant type anatomy of the COW in 49 % of a healthy population consisting of young and old subjects. 11 Is important to note the fetal type PCA (a P2 segment arising from the ICA) was classified as a COW variation in that study, and this additional category may account for their higher percentage of COW variation in their study. The observed morphology variants are common and were not significantly different between populations. The hemodynamics findings for the AD and MCI subjects are statistically significant and found in most vessel segments. The MCI population reported fewer percentages of variants than the age matched controls, but still reported significant hemodynamic differences. Morphology differences in the circulation seem unlikely to explain the decrease of MBF and increase of PI in the AD and MCI populations and the overall hemodynamic findings.
There are some limitations to our study. Only 160 subjects had pulsatile flow waveforms available, therefore the computation of PI and RI was limited to these subjects. Ideally, the subjects also would have been more evenly distributed across the four groups. Small vessels with slow flow could have possibly suffered from signal dropout in the PC angiograms and therefore be wrongly classify as hypoplastic. However, magnitude images were also reviewed when a hypoplastic vessel was encountered to reduce this limitation.
In summary, this study demonstrates the feasibility of hemodynamic analysis over a large vascular territory in the context of AD with 4D flow MRI within a 7 min acquisition. With the large volume coverage and high temporal and spatial resolution demonstrated here, 4D flow MRI enables angiographic and quantitative assessment, and therefore can provide cerebrovascular characteristic features of health that can contribute to identifying patients who may benefit from interventions to improve circulatory system functions.
Footnotes
Funding
The author(s) disclosed receipt of the following financial support for the research, authorship, and/or publication of this article: We gratefully acknowledge funding by the NIH (NIA grant P50-AG033514, NIHLBI R01HL072260 and NIGMS R25GM083252) as well as GE Healthcare for their assistance and support. The content is solely the responsibility of the authors and does not necessarily represent the official views of the NIH.
Declaration of conflicting interests
The author(s) declared the following potential conflicts of interest with respect to the research, authorship, and/or publication of this article: The authors receive research support from GE Healthcare in the form of software.
Author’s contributions
Leonardo A Rivera-Rivera – Study design, 4D flow data reconstruction and post processing; statistical analysis, inspection of PC angiograms and magnitude images, editing of the manuscript and figures. Patrick Turski – Clinical neuroradiologist, clinical input and selection of the regions of interest for flow analysis, components of study design, image quality review and assessment of PC angiograms and magnitude images, editing of the manuscript and figures. Kevin M Johnson – Optimization of 4D flow MRI sequence designs and image reconstruction. Carlson Hoffman – Data post processing analysis, editing of the manuscript. Sara E Berman – Assisted with methods section writing, specifically the subjects and clinical classification and cognitive assessment sections; editing of the manuscript Phillip Kilgas – Data post processing analysis. Howard A Rowley – Imaging protocols, design of non-flow imaging analysis, oversight of imaging acquisition, image quality insurance, maintaining of the imaging archives and assessment of brain morphology for co-morbid diseases. Cynthia M Carlsson – Clinical supervising physician for medical data collection Sterling C Johnson- Clinical neuropsychologist, study design, editing of the manuscript. Oliver Wieben – 4D flow MRI sequence designs, study designs, imaging protocol, editing of the manuscript.
References
Supplementary Material
Please find the following supplemental material available below.
For Open Access articles published under a Creative Commons License, all supplemental material carries the same license as the article it is associated with.
For non-Open Access articles published, all supplemental material carries a non-exclusive license, and permission requests for re-use of supplemental material or any part of supplemental material shall be sent directly to the copyright owner as specified in the copyright notice associated with the article.