
Abstract
Objective:
Ibogaine is a hallucinogenic drug that may be used to treat opioid use disorder (OUD). The relationships between pharmacokinetics (PKs) of ibogaine and its metabolites and their clinical effects on side effects and opioid withdrawal severity are unknown. We aimed to study these relationships in patients with OUD undergoing detoxification supported by ibogaine.
Methods:
The study was performed in 14 subjects with OUD. They received a single dose of 10mg/kg ibogaine hydrochloride. Plasma PKs of ibogaine, noribogaine, and noribogaine glucuronide were obtained during 24 h. Cytochrome P450 isoenzyme 2D6 (CYP2D6) genotyping was performed. The PKs were analyzed by means of nonlinear mixed effects modeling and related with corrected QT interval (QTc) prolongation, cerebellar ataxia, and opioid withdrawal severity.
Results:
The PK of ibogaine were highly variable and significantly correlated to CYP2D6 genotype (p < 0.001). The basic clearance of ibogaine (at a CYP2D6 activity score (AS) of 0) was 0.82 L/h. This increased with 30.7 L/h for every point of AS. The relation between ibogaine plasma concentrations and QTc was best described by a sigmoid Emax model. Spearman correlations were significant (p < 0.03) for ibogaine but not noribogaine with QTc (p = 0.109) and cerebellar effects (p = 0.668); neither correlated with the severity of opioid withdrawal symptoms.
Conclusions:
The clearance of ibogaine is strongly related to CYPD2D6 genotype. Ibogaine cardiac side effects (QTc time) and cerebellar effects are most likely more driven by ibogaine rather than noribogaine. Future studies should aim at exploring lower doses and/or applying individualized dosing based on CYP2D6 genotype.
Introduction
Ibogaine is one of the active alkaloid compounds found in the rootbark of the plant Tabernanthe iboga, a perennial shrub found in West Africa. It is considered an oneirophrenic and is used in treatment of various types of addiction, including opioid use disorder (OUD) in various settings from private clinics to home treatment (Rodríguez-Cano et al., 2023; Schenberg et al., 2014, Kim et al., 2023). It is most often used in the form of iboga, a mixture of alkaloids extracted from the rootbark of the plant (Mash et al., 2001). Ibogaine has shown some promise in mitigating opioid withdrawal and decreasing opioid craving and relapse after detoxification in non-controlled studies (Brown and Alper, 2017; Malcolm et al., 2018; Mash et al., 2018; Noller et al., 2017). Dosing regimens in these studies vary greatly and currently no dose-effect studies of ibogaine exist.
Beyond the potential therapeutic effects of ibogaine, there are major concerns regarding its safety, especially because of cardiac side effects (Knuijver et al., 2021; Koenig and Hilber, 2015; Koenig et al., 2013, 2014; Litjens and Brunt, 2016; Paling et al., 2012; Thurner et al., 2014; Vlaanderen et al., 2014). Ibogaine and its active metabolite noribogaine are both known to prolong the corrected QT interval (QTc) interval, which is a risk factor for torsades des pointes, a life-threatening dysrhythmia (Knuijver et al., 2021; Koenig and Hilber, 2015; Koenig et al., 2014; Thurner et al., 2014). Data regarding ibogaine effects on QTc duration is currently limited to clinical observations of QTc prolongation after ibogaine ingestion without testing an exposure-response relationship(Grogan et al., 2019; Knuijver et al., 2021; Koenig and Hilber, 2015). Furthermore, animal studies have shown that ibogaine causes ataxia, and at very high doses is neurotoxic to cerebellar Purkinje cells (Belgers et al., 2016; Molinari et al., 1996; O’Hearn and Molliver, 1993). In vivo ibogaine has been shown to produce a reversible clinical cerebellar ataxia(Knuijver et al., 2021; Mash et al., 2018). It is not known whether the cerebellar effects are due to ibogaine itself or its metabolites.
Ibogaine is metabolized into noribogaine by the cytochrome P450 isoenzyme 2D6 (CYP2D6). Noribogaine is then glucuronidated to noribogaineglucuronide (NIG) (Obach et al., 1998). The activity of CYPD2D6 is known to vary between individuals, in particular due to genetic polymorphisms (Marez et al., 1997). The impact of CYP2D6 genotype on the pharmacokinetics (PKs) of ibogaine and its metabolites has not yet been fully elucidated. This knowledge is, however, pivotal to help create safe dosing regimens in future trials for the development of ibogaine as a treatment for addiction.
This pharmacokinetic-pharmacodynamic (PKPD) study aimed to (1) investigate the effects of genetic variation in the CYP2D6 on ibogaine PKs, including effects on its main metabolites, and (2) explore the relationships between plasma levels of ibogaine and its main metabolites and the pharmacodynamic (PD) effects on opioid withdrawal severity, QTc prolongation, and ataxia.
Methods
Study design
We conducted an open-label study in patients with OUD in agonist treatment with methadone or buprenorphine to investigate the exposure-response relationship of ibogaine and its main metabolites. The study was conducted according to the World Medical Association Declaration of Helsinki and approved by the medical ethical committee “Commissie Mensgebonden Onderzoek” in Nijmegen (The Netherlands) under reference number 2014/081. All participants provided written informed consent. The EudraCT number of this study was 2014-000354-11 (EudraCT, 2014). Part of this study was to assess the safety profile of ibogaine in patients with OUD, which we previously reported. The details of the clinical study are described in detail elsewhere. For additional details on some of the procedures and outcomes used, for example, on withdrawal severity, we refer to this article. (Knuijver et al., 2021)
Participants
The study was performed in 14 subjects with OUD. Exclusion criteria were a history of clinically significant cardiac disease (including ventricular fibrillation, long QT syndrome, history of syncope, QTc > 450 ms for men and >470 ms for women), serum potassium >5.0 mmol/l or <3.5 mmol/l, severe liver or renal dysfunction (estimated glomerular filtration rate < 30 ml/min/1.73 m2), or pregnancy. Participants were not allowed to use QTc prolonging or CYP2D6-affecting medication, except for methadone prior to inclusion (https://crediblemeds.org/; Flockhart et al., 2014). Patients with a history of major depressive or psychotic symptoms were also excluded.
Measurements
Age, sex and opioid maintenance treatment, as well as the dose of morphine used in the 24 h prior to ibogaine administration were noted. Ibogaine and its metabolites noribogaine and NIG were quantified in plasma with a validated ultra-performance liquid chromatography-tandem mass spectrometry) method. This method was validated within a linear concentration range of 0.1–50 ng/mL for ibogaine and 0.1–250 ng/mL for noribogaine and NIG. CYPD2D6 polymorphisms were tested for by TaqMan® analysis (Marez et al., 1997). The determined genotype was used to calculate the CYP2D6 activity score (AS hereafter), according to Gaedigk et al. (2008) for further PK analysis. Automatic twelve lead ECG measurements were performed to assess QTc prolongation using a Philips Healthcare, multichannel TC50. QTc was calculated using Fridericia’s formula (RR/QT1/3) to correct for the RR interval. In order to obtain a reliable estimation of the QT interval, the average of the QT durations in leads V5 and II was calculated, based on measures by two independent researchers by hand (Knuijver et al., 2021; Postema and Wilde, 2014). Their findings were verified by an independent cardiologist (Knuijver et al., 2021; Postema and Wilde, 2014). Cerebellar ataxia was assessed using the Scale for the Assessment and Rating of Ataxia (SARA), a structured clinical assessment of motor- and coordination skills related to the cerebellum, by a trained physician (Schmitz-Hübsch et al., 2006; Weyer et al., 2007; Yabe et al., 2008). The SARA has eight items with a maximum score of 40: gait (8), stance (6), sitting (4), speech (6), finger-chase test (4), nose-finger test (4), fast alternating movements (4), and a heel-to-shin test (4). The heel-to-shin test was performed while standing. Higher scores indicate worse performance (Schmitz-Hübsch et al., 2006, 2010; Weyer et al., 2007; Yabe et al., 2008). The SARA has been found reliable and consistent in scoring ataxia in several diseases(Schmitz-Hübsch et al., 2006, 2010; Weyer et al., 2007; Yabe et al., 2008).
Withdrawal symptoms were measured using the Objective and Subjective Opioid Withdrawal Scales (OOWS and SOWS) (Handelsman et al., 1987). The OOWS is a reliable, standardized, and well-validated clinical observation tool that scores the presence of 12 opioid withdrawal symptoms over the last 10 min. The score represents the severity of withdrawal: 0–5 = none; 5–12 = mild; 13–24 = moderate; 25–36 = moderately severe; more than 36 = severe withdrawal. The SOWS lets subjects score 16 symptoms on a five-point scale, which then also gives a measure of the severity of opioid withdrawal: 1–10 = mild; 11–20 = moderate; 21–30 = severe.
Study procedure
Subjects were admitted for 8 days during which they were detoxified from all other substances except tobacco. During these 8 days they were converted by titration to oral morphine in order to eliminate any QTc prolonging effects of methadone and to make the onset of withdrawal predictable. The last morphine administration was on the 9th day at 4:00 AM. Subjects then received ibogaine hydrochloride (denoted as ibogaine hereafter) 10 mg/kg orally, administered in a yoghurt mixture at 8:30 AM. For safety reasons, we chose a dosage in the lower range of doses administered in previous studies(Alper et al., 2000; Brown and Alper, 2018; Malcolm et al., 2018; Mash et al., 2001, 2008; Noller et al., 2017; Schenberg et al., 2014; Sheppard, 1994).
GMP-grade ibogaine for human use (brand name Remogen) was obtained from Phytostan Enterprises (Montreal, Canada) (inc. MefLEP, 2014). Purity was assessed by the manufacturer using a validated liquid chromatography assay with ultraviolet detection and confirmed by our pharmaceutical laboratory. Before ibogaine administration, subjects were administered 20mg of metoclopramide, to prevent nausea and vomiting and secure full ingestion. Patients were monitored for the next 24 h. Blood samples were obtained at 30 min before administration and then at 1, 2, 3, 4, 5, 6, 7, 8, 9, 10, 11, 12, and 24 h after ingestion. An electrocardiogram was obtained every half hour for the first twelve hours. If prolongation of the QTc interval (>450 ms for men; >470 ms for women) continued after 24 h, ECG measurements were continued every hour; otherwise, an ECG measurement was performed every 4 h afterwards. After 24 h, a cardiologist assessed if cardiac monitoring should be continued. If during the first 24 h QTc exceeded 500 ms, participants received a magnesium bolus infusion of 10 mmol, followed by another 10 mmol of magnesium over the next 10 h, for myocardial stabilization. If withdrawal was too severe, opioid substitution therapy (OST) was resumed on request of the subject, with methadone only allowed after 24 h and with a QTc < 450 ms and OST was slowly titrated according to local treatment protocols.
The SARA, the OOWS, and SOWS were assessed at two, six, ten, and twenty-four hours after administration of ibogaine. They were not performed in the event a subject requested to return to OST, as the protocol allowed for subjects to return to OST unconditionally. Subjects were kept for observation for 5 days after ibogaine administration.
Statistical analyses
Population PK analysis
The population PKPD analysis was performed by means of nonlinear mixed effects modeling using the software package NONMEM 7.4 (Icon, Dublin, Ireland). A sequential approach was employed. First, an integral population PK model for ibogaine, noribogaine, and NIG was developed. The CYP2D6 AS was investigated as a covariate for the clearance parameter describing the formation of noribogaine. Using the developed PK model, we derived the empirical Bayes estimates for ibogaine, noribogaine, and NIG plasma concentrations at the time of measurement of ECG, SARA, and OOWS/SOWS. Furthermore, the empirical Bayes individual estimates for time of maximum concentration (Tmax), maximum concentration (Cmax), and area under the concentration versus time curve (AUC) of ibogaine, noribogaine, and NIG were derived from the developed PK model.
PKPD analysis
To visually investigate the exposure-response relationship between the ibogaine and metabolite concentrations, individual hysteresis plots were inspected (Louizos et al., 2014). The correlations of the PKs with the PDs were investigated using Spearman’s rank correlation coefficient. When a significant correlation was found, the interplay between PKs of ibogaine (metabolites) and QTc prolongation was analyzed by means of nonlinear mixed effects modeling. Details on the PKPD modeling can be found in the Supplemental Material.
Results
Subject characteristics are shown in Table 1. The observed PKs of ibogaine and its metabolites are presented in Figure 1. The genotyping results for each individual in the study can be found in Table S1 of the Supplemental Material, where the found CYP2D6 alleles, AS, and metabolizer status are presented per individual.
Study population characteristics.
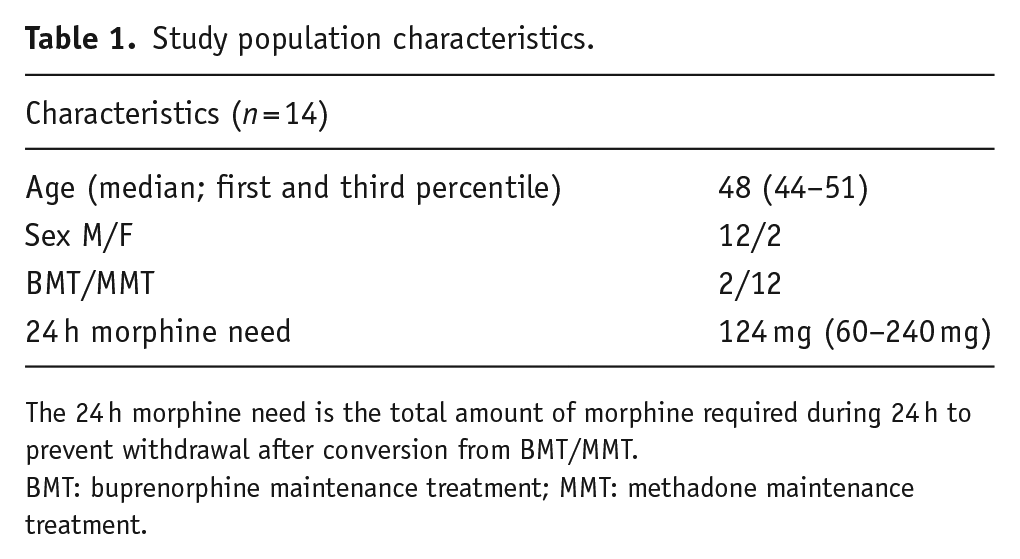
The 24 h morphine need is the total amount of morphine required during 24 h to prevent withdrawal after conversion from BMT/MMT.
BMT: buprenorphine maintenance treatment; MMT: methadone maintenance treatment.
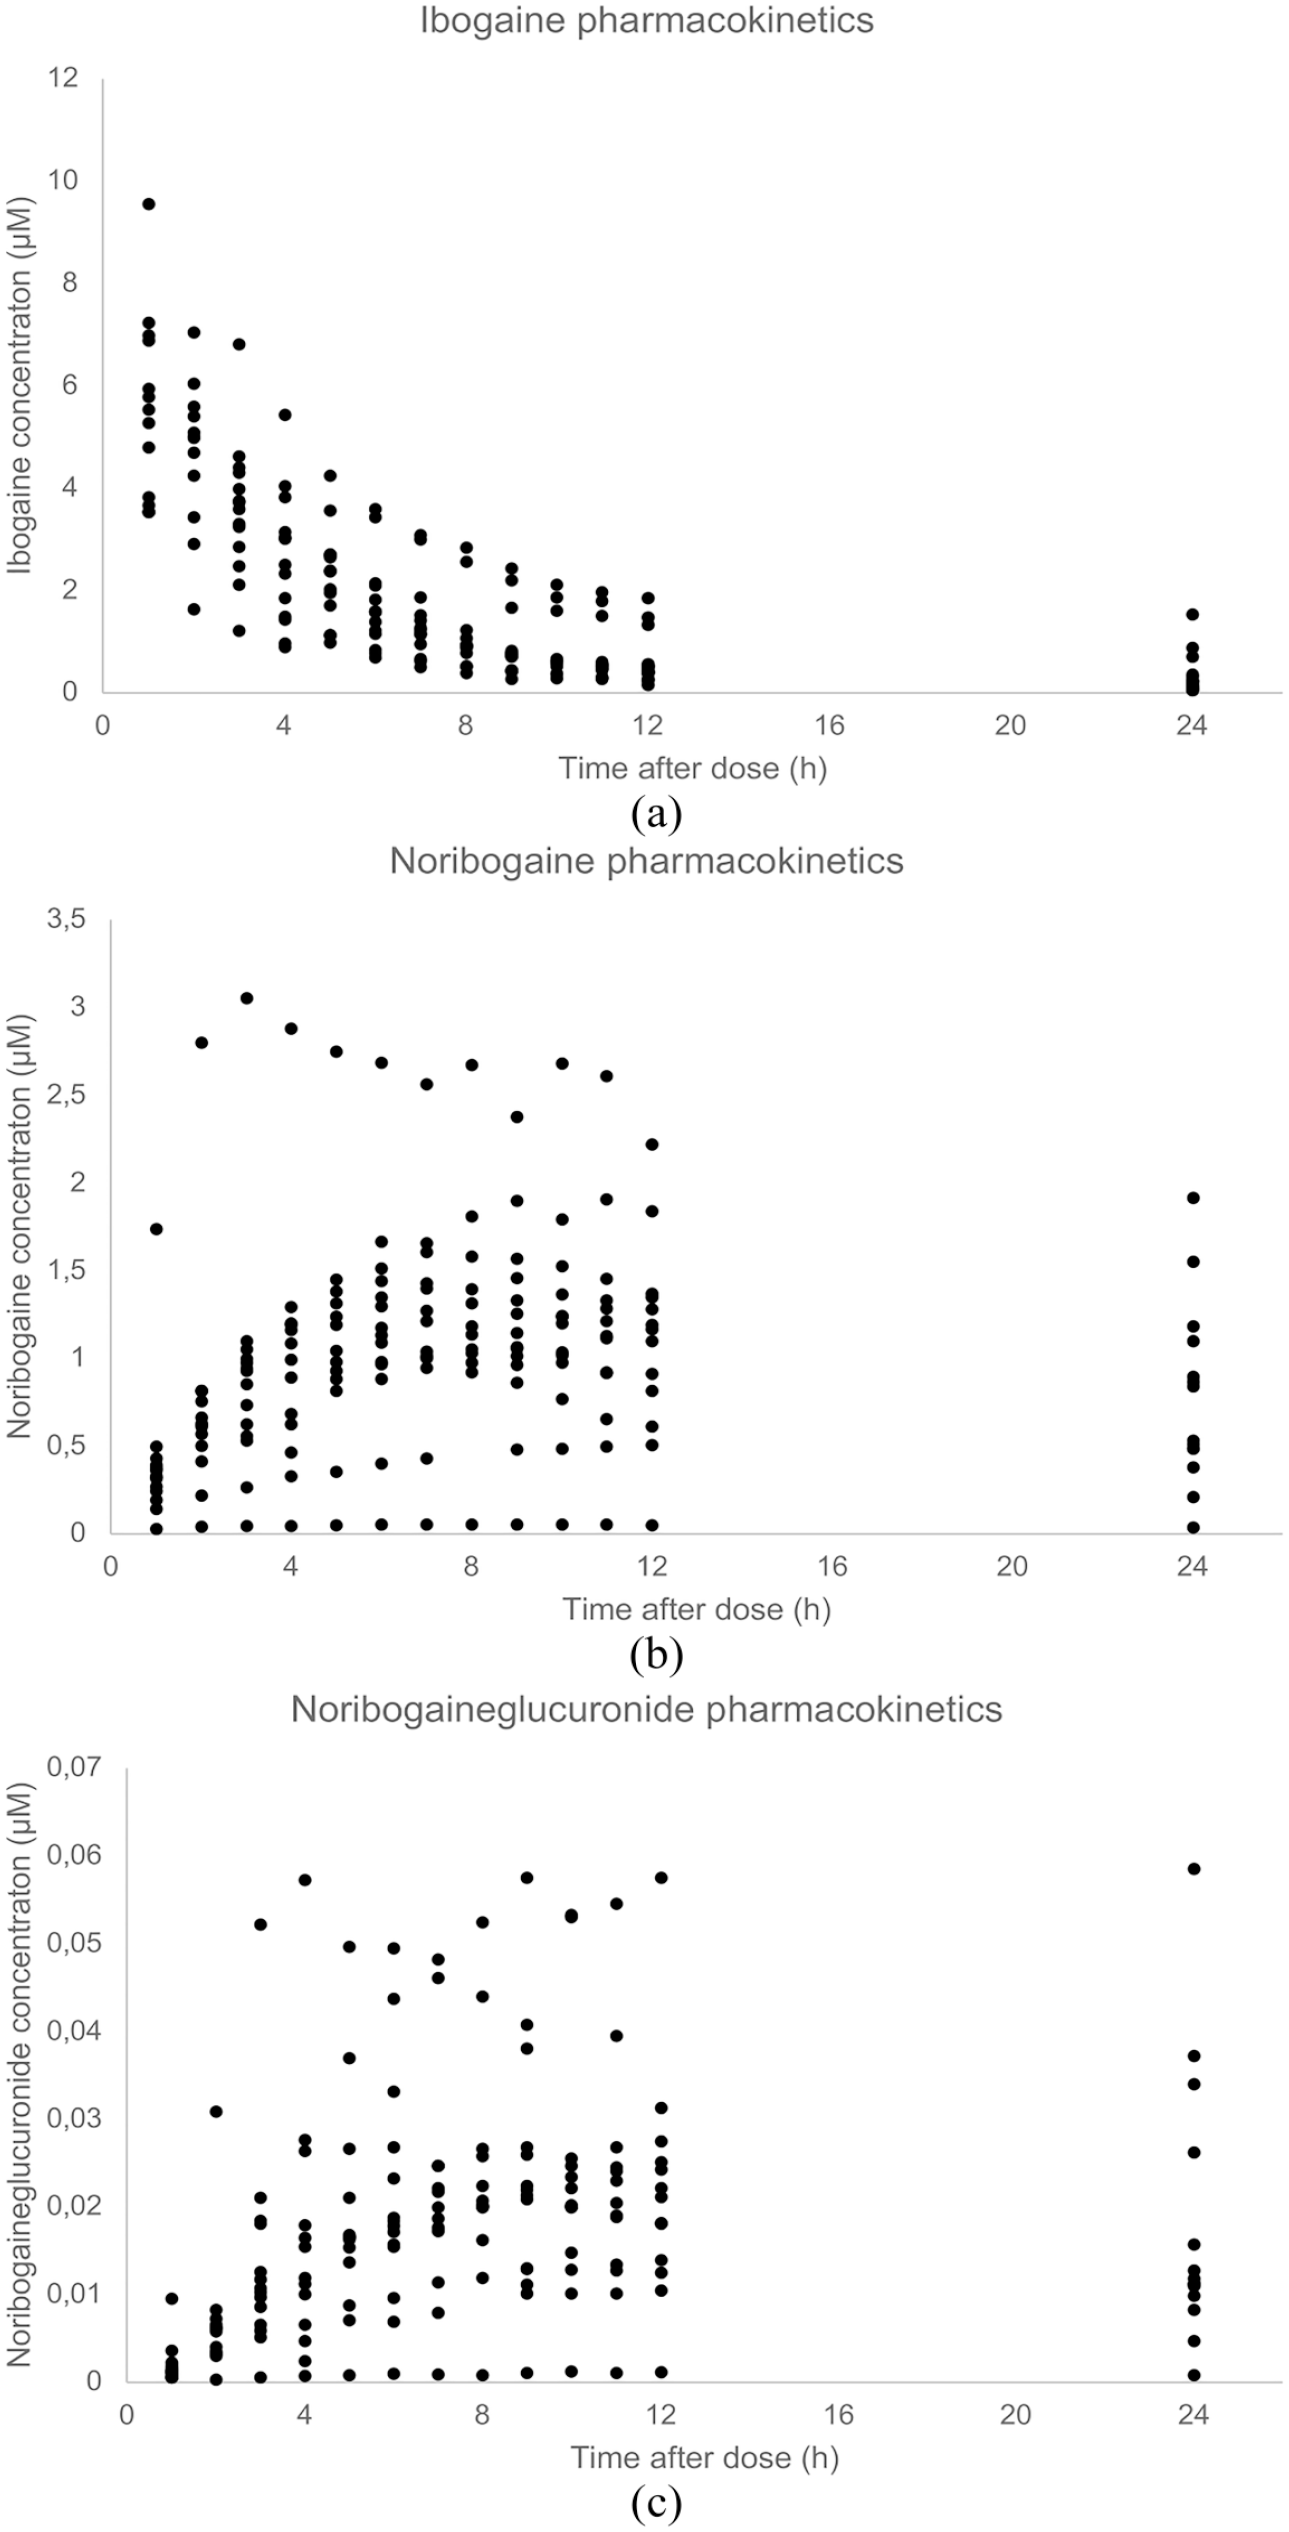
(a) Observed ibogaine PKs. (b) Observed noribogaine PKs. (c) Observed NIG PKs.
Population PK modeling
Empirical Bayes Estimates for the Cmax, Tmax, and AUC extrapolated to infinity of ibogaine, noribogaine and NIG are shown in Table 2. As expected, the clearance of ibogaine to noribogaine was significantly (p < 0.0001) associated with the CYP2D6 AS, shown in Figure 2. The basic clearance (at an AS of 0) of ibogaine was estimated to be 0.82 L/h, but this increased to 30.7 L/h for every point of AS (Figure 2 and Supplemental Material). Sex was not identified as a covariate for the PKs of ibogaine and its metabolites.
PK parameters.
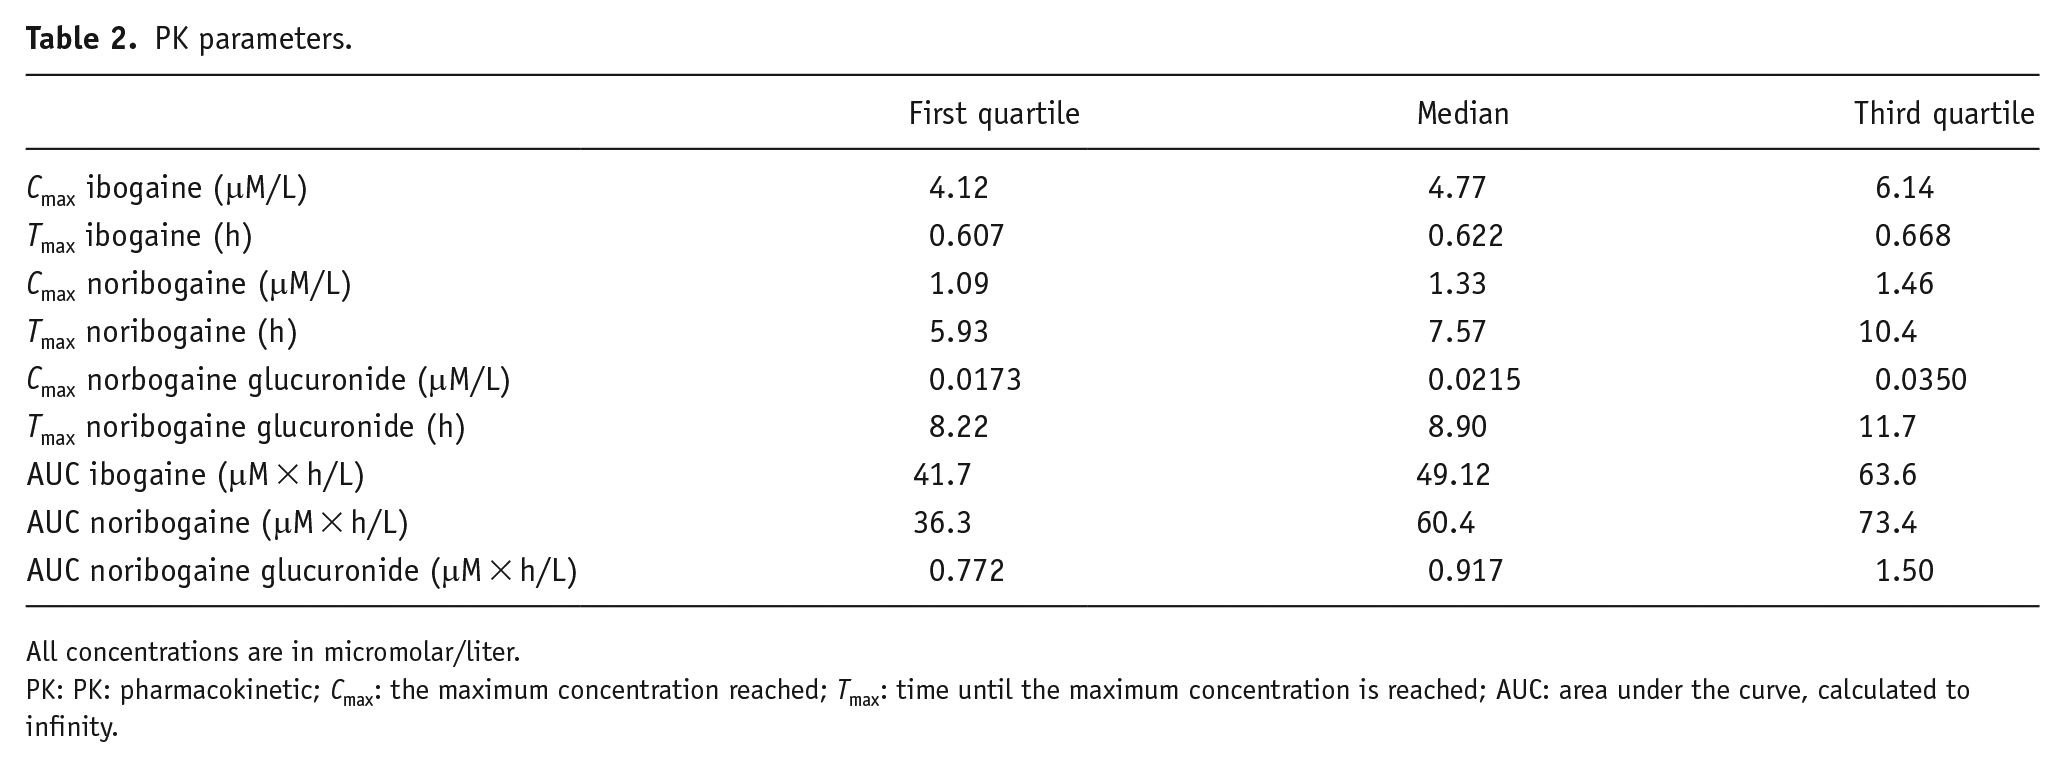
All concentrations are in micromolar/liter.
PK: PK: pharmacokinetic; Cmax: the maximum concentration reached; Tmax: time until the maximum concentration is reached; AUC: area under the curve, calculated to infinity.
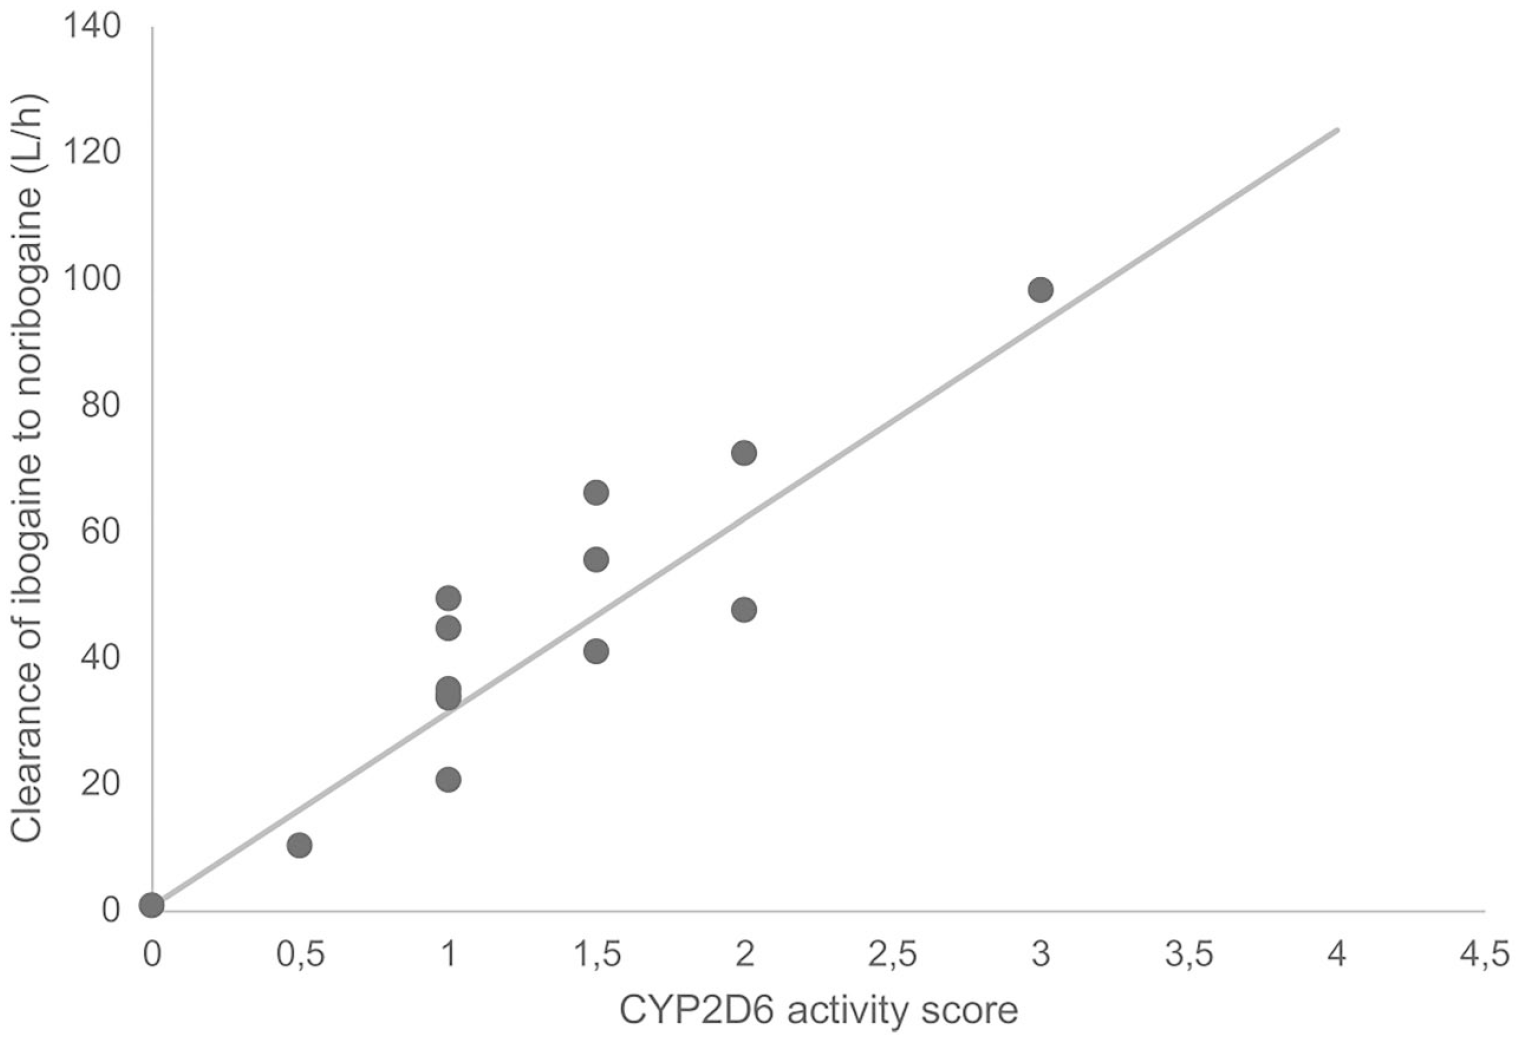
CYP2D6 AS and ibogaine conversion to noribogaine. The dots represent the empirical Bayes estimates for clearance of ibogaine to noribogaine. The line represents the estimated relationship between CYP2D6 activity score and conversion of ibogaine to noribogaine.
PKPD analysis
A total of 386 QTc measurements were performed. A modest, yet significant, Spearman rank correlation of 0.109 (p < 0.05) between ibogaine and QTc was found (Supplemental Table S4). No hysteresis was observed for ibogaine; however, noribogaine and NIG showed a clockwise hysteresis curve (plots available in the Supplemental Material; Figures S6–S8).
In the PKPD model describing the relationship between plasma concentrations of ibogaine and QTc prolongation, it was found that a sigmoid Emax model best explained the relationship between QTc time and ibogaine concentrations. This means that the QTc prolongation reaches a plateau. The maximum QTc prolongation was estimated to be 67.9 ms, with a relative standard of estimate (RSE) of 10.9%. The ibogaine concentration where the half-maximum QTc prolongation was observed (EC50) was estimated to be 0.195 µM (RSE 64.1%). No effect of sex was found on this relationship between plasma concentrations and QTc prolongation. Notably, the majority of ibogaine concentrations were above this EC50, explaining why QTc prolongation quickly reached a plateau after administration. An in-depth description of the PKPD analysis can be found in the Supplemental Material.
Upon visual inspection of the SARA scores against plasma levels of ibogaine, noribogaine and NIG, we did not observe clear evidence of hysteresis. These SARA measurements showed a strong Spearman correlation of 0.67 (p < 0.01, two-tailed; Figure 3) with ibogaine concentrations but not with its metabolites. All correlations are shown in Supplemental Table S4.
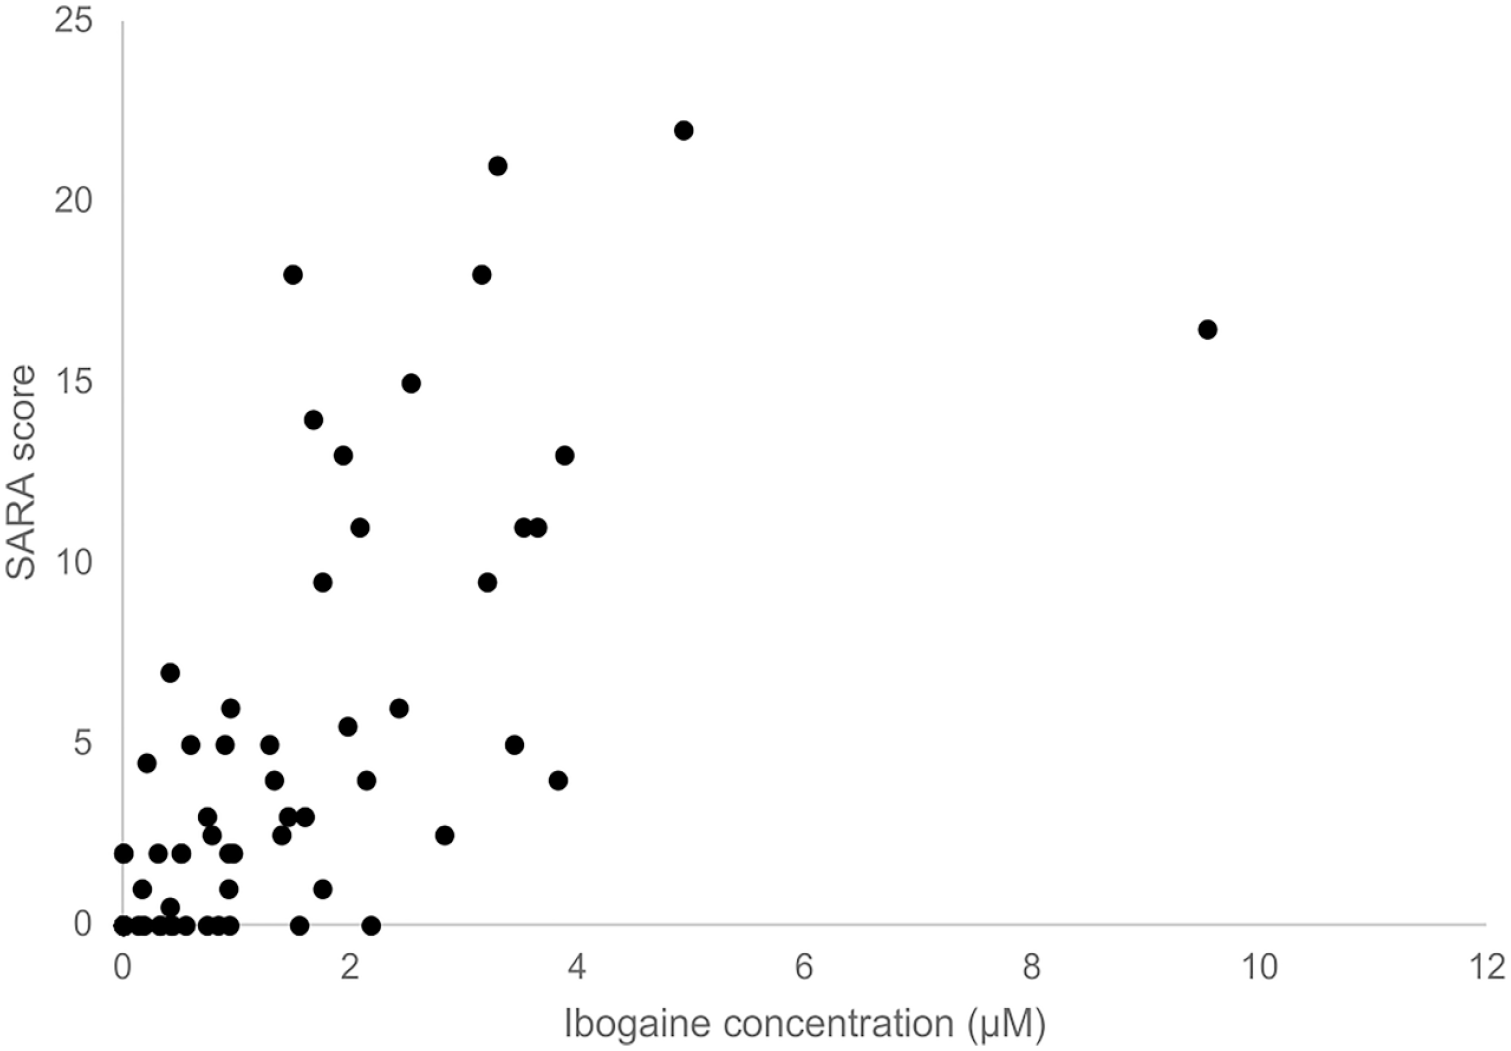
SARA score versus ibogaine concentration. The correlation between ibogaine concentration and SARA score using Spearman’s rank correlation was significant (Spearman’s ρ = 0.668, p < 0.01).
A total of 54 SOWS and OOWS measurements were performed. No significant correlations were seen between plasma levels and both OOWS and SOWS (Supplemental Table S4). Again, no clear hysteresis was observed.
Discussion
In this study, we set out to investigate the PKs of ibogaine, noribogaine, and NIG and quantify the effect of CYP2D6 status on these PKs after a single dose of 10 mg/kg ibogaine hydrochloride in OUD patients. Furthermore, we investigated the relationship between plasma levels of ibogaine and its metabolites with QTc prolongation, ataxia and withdrawal symptoms. We found that CYP2D6 genotype is a major determinant of ibogaine metabolism, with more than a 10-fold difference in clearance across the CYP2D6 ASs from 0 to 3. This indicates that CYP2D6-based dosing should be performed to assure equal exposure when dosing ibogaine. The Cmaxs of ibogaine and noribogaine were in agreement with previous studies (Glue et al., 2015; Maciulaitis et al., 2008; Mash et al., 2000, 2001) and more than ten-fold higher than the EC50. Consequently, to relevantly reduce the risk of QTc-prolongation, a more than ten-fold reduction in dose is required. As it stands, it is unknown whether such a low dose has any clinically meaningful effects.
QTc showed an anticlockwise hysteresis when plotted against ibogaine plasma concentrations, whereas noribogaine showed clockwise hysteresis. This implies that QTc prolongation occurs before noribogaine exposure increases. Furthermore, QTc correlated with ibogaine concentrations but not with noribogaine or NIG concentrations. We, therefore, postulate that QTc prolongation is mainly driven by ibogaine rather than its metabolites. This is in line with a previous clinical study of noribogaine, which exhibited a concentration-dependent QTc prolongation of 10–50 ms in the studied dose (Glue et al., 2016). However, the plasma noribogaine concentrations in this study were 10- to 100-fold higher than in our study, indicating that the low noribogaine concentrations in our study only marginally impact QTc. As shown by others (Alper et al., 2012; Ona et al., 2022), it should be noted that the low noribogaine concentrations in our population may still have contributed to QTc prolongation. However, as both the parent and metabolites are simultaneously present in the systemic circulation after administration of ibogaine, we could not distinguish the separate effects of both compounds on QTc prolongation. The suggested lower potential of noribogaine to cause cardiotoxicity may point to further clinical development of noribogaine for the same indication, As proposed by Glue et al. (2016).
“It should be noted that tobacco smoking is likely to slightly prolong the QTc time (Özdemir and Sökmen, 2020). Considering the high incidence of tobacco smoking in OUD patients (Clemmey et al., 1997), it may be postulated that in patients who do not smoke, the QTc prolonging effects might be a little bit less pronounced. Smoking was allowed during the study. We did not observe an increase in cigarette consumption prior to or during ibogaine treatment, nor was a major increased QTc time at baseline observed. This makes a major confounding effect of nicotine use on the observed QTc prolongation after ibogaine ingestion unlikely. Our study investigated the effects of ibogaine in a real-world population where tobacco use is frequent, and we showed that ibogaine should be administered with caution in this population.
Ataxia was better correlated with ibogaine PKs than with noribogaine, suggesting ibogaine to be mainly responsible for the observed ataxia. This is in line with previous studies in rats, where it was observed that noribogaine does not induce ataxia in contrast to ibogaine (Baumann et al., 2001). As morphine administration was ceased before treatment, withdrawal in the form of tremors may have had some effect on the ataxia measurement. However, only mild withdrawal was observed during ibogaine treatment.
We did not observe a correlation between the PKs of ibogaine or its metabolites and opioid withdrawal. Based on our dosing regimen, withdrawal is to be expected within 4–6 h after cessation of morphine use. We administered ibogaine 4 h after the last morphine and during the first 24 h withdrawal did not occur for most subjects. We, therefore, conclude that ibogaine is at least in part capable of mitigating withdrawal during the first 24 h and probably beyond. It may be postulated that in our study a plateau effect was reached and that a lower systemic exposure may have the potential to also prevent withdrawal symptoms. As it stands, the lowest effective exposure in relation to withdrawal is not yet known. This knowledge may facilitate the development of safer ibogaine dosing.
Our results should be seen in light of several considerations. It may be debated that the sample size of our study was relatively small, yet in line with most clinical studies with ibogaine (Köck et al., 2022). The sample size should be seen in context of the learning phase of our PKPD study. Although, from a statistical point of view, a larger sample size is always desirable, we were able to identify PKPD relationships in our study. If findings from our study are to be confirmed, our results may serve to design a trial and select an appropriate sample size.
Furthermore, reliably measuring the QTc interval is notoriously difficult. A 1 mm measuring error results in 40 ms of over- or underestimation of the QT interval. Current gold-standard research includes a full day of QTc measurement before administration to provide an individual baseline QTc correction, which we did not apply. A limited number of SARA, OOWS, and SOWS measurements were available, potentially reducing the likelihood of identifying hysteresis. This might have affected the ability to show the role of different compounds in our observations. Especially when it comes to mitigation of withdrawal symptoms, a different set-up with more frequent and longer measurement of OOWS/SOWS and measurement of morphine plasma levels might have produced a better understanding of the dose-effect relationship.
Some PKPD interactions with other drugs may have taken place in our study, which might have influenced our results. In theory, through competitive inhibition, metoclopramide might act as a CYP2D6 inhibitor. There is some in vitro evidence that metoclopramide is a reversible and competitive inhibitor, but not inactivator, of this metabolic enzyme (Livezey et al., 2014), yet CYP2D6 inactivation was not observed in relevant concentrations. Concentrations at which only limited reversible CYP2D6 inhibition occurred were far above systemic concentrations that reached clinically relevant doses of metoclopramide of approximately 0.1–0.5 μM (Bernardo-Escudero et al., 2011). The fact that a clear relationship was present between CYP2D6 AS and ibogaine PKs shows that at least CYP2D6 was not completely inhibited.
Both metoclopramide and methadone are listed in the Arizona QT-drugs list as QT-prolonging agents and may have influenced the duration of the QT (https://crediblemeds.org/). The effect of metoclopramide on QT is not well known, as data suggest an effect on the QT variance and an increase in the length of the QT interval with increasing RR intervals.(Ellidokuz and Kaya, 2003) Higher plasma metoclopramide levels at the start versus end may confound the hysteresis plots and correlation. We do not consider methadone a relevant factor for QTc prolongation, given the elimination half-life of methadone, the fact that baseline QTc was within normal range and the clear prolongation of QTc after ibogaine ingestion.
The PKs of ibogaine are strongly related to CYPD2D6 genotype, expressed as an AS. Consequently, as plasma concentrations of ibogaine correlate with QTc time, reduced CYP2D6 activity increases exposure to ibogaine and induces more pronounced (with a maximum effect) and prolonged QTc prolongation. Cerebellar effects are most probably a result of ibogaine and not of noribogaine. Notably, no relationship between PKs and withdrawal severity was found. This might indicate that the studied dose was in the upper plateau of the PKPD effect curve. Significantly lower doses, preferably individualized using CYP2D6 genotyping, are required to increase cardiac safety, and clinical effects of such doses should be studied to understand the clinical potential of ibogaine to prevent withdrawal symptoms, craving and relapse in patients with OUD.
Supplemental Material
sj-docx-1-jop-10.1177_02698811241237873 – Supplemental material for The pharmacokinetics and pharmacodynamics of ibogaine in opioid use disorder patients
Supplemental material, sj-docx-1-jop-10.1177_02698811241237873 for The pharmacokinetics and pharmacodynamics of ibogaine in opioid use disorder patients by Thomas Knuijver, Rob ter Heine, Arnt F. A. Schellekens, Paniz Heydari, Luc Lucas, Sjoerd Westra, Maarten Belgers, Toon van Oosteren, Robbert Jan Verkes and Cornelis Kramers in Journal of Psychopharmacology
Footnotes
Acknowledgements
For aid in conducting our research, we would like to thank Sanders Dekkers, Jan Leijtens, Saskia Delis, Georghe Pop and Anne Loes In der Maur, NISPA and the nursing staff of IrisZorg and Radboudumc.
Declaration of conflicting interests
The author(s) declared no potential conflicts of interest with respect to the research, authorship, and/or publication of this article.
Funding
The author(s) disclosed receipt of the following financial support for the research, authorship, and/or publication of this article: This study was partially funded by Stichting Het Hoogeland, a non-profit organization supporting addiction research and IrisZorg addiction care. Part of the laboratory ibogaine research was funded by Di-AcetylM BV (Amsterdam, the Netherlands).
Supplemental material
Supplemental material for this article is available online.
References
Supplementary Material
Please find the following supplemental material available below.
For Open Access articles published under a Creative Commons License, all supplemental material carries the same license as the article it is associated with.
For non-Open Access articles published, all supplemental material carries a non-exclusive license, and permission requests for re-use of supplemental material or any part of supplemental material shall be sent directly to the copyright owner as specified in the copyright notice associated with the article.