
Abstract
Background:
The surprise question is widely used to identify patients nearing the last phase of life. Potential differences in accuracy between timeframe, patient subgroups and type of healthcare professionals answering the surprise question have been suggested. Recent studies might give new insights.
Aim:
To determine the accuracy of the surprise question in predicting death, differentiating by timeframe, patient subgroup and by type of healthcare professional.
Design:
Systematic review and meta-analysis.
Data sources:
Electronic databases PubMed, Embase, Cochrane Library, Scopus, Web of Science and CINAHL were searched from inception till 22nd January 2021. Studies were eligible if they used the surprise question prospectively and assessed mortality. Sensitivity, specificity, negative predictive value, positive predictive value and c-statistic were calculated.
Results:
Fifty-nine studies met the inclusion criteria, including 88.268 assessments. The meta-analysis resulted in an estimated sensitivity of 71.4% (95% CI [66.3–76.4]) and specificity of 74.0% (95% CI [69.3–78.6]). The negative predictive value varied from 98.0% (95% CI [97.7–98.3]) to 88.6% (95% CI [87.1–90.0]) with a mortality rate of 5% and 25% respectively. The positive predictive value varied from 12.6% (95% CI [11.0–14.2]) with a mortality rate of 5% to 47.8% (95% CI [44.2–51.3]) with a mortality rate of 25%. Seven studies provided detailed information on different healthcare professionals answering the surprise question.
Conclusion:
We found overall reasonable test characteristics for the surprise question. Additionally, this study showed notable differences in performance within patient subgroups. However, we did not find an indication of notable differences between timeframe and healthcare professionals.
The surprise question (‘Would I be surprised if this patient were to die in the next 12 months?’) is widely used to identify patients nearing the last phase of life. Earlier meta-analyses showed a sensitivity of 67.0% and a specificity of 80.2% and a pooled accuracy of 74.8%.
The surprise question seems to perform better in cancer patients compared to other patient subgroups.
It is suggested that doctors appear to be more accurate than nurses in recognising people in the last year of life.
This study is based on 88.268 surprise question assessments and shows that the surprise question has an estimated sensitivity of 71.4% (95% CI [66.3–76.4]) and specificity of 74.0% (95% CI [69.3–78.6]). The negative predictive value of the surprise question remains high with varying mortality rates.
Analysis of timeframe subgroups showed similar sensitivity for 6- and 12-month timeframe: 74.5% (95% CI [67.6–81.4]) and 73.4% (95% CI [68.2–78.6]) respectively. Specificity was lower for a 6-month timeframe 64.3% (95% CI [56.8–71.8]) compared to a 12-month timeframe 72.9% (95% CI [67.6–78.1]).
A sensitivity of 83.8% (95% CI [75.6–92.0]) was observed for patients with cancer and 82.5% (95% CI [60.1–100.0]) for patients with pulmonary disease, whereas the sensitivity for the emergency department was 49.1 (95% CI [35.7–62.5]). Specificity showed less variation with values between 67.3% (95% CI [53.2–81.3]) for cancer patients and 80.0% (95% CI [60.0–99.9]) for primary care patients.
Seven studies provided detailed information on different healthcare professionals answering the surprise question. Based on these studies we did not find an indication of notable differences between the accuracy of healthcare professionals answering the surprise question.
The surprise question has a reasonable accuracy and is therefore an appropriate screening tool to identify patients that could benefit from advance care planning.
The surprise question should not solely be seen as an indicator of prognostication of death but rather as an opportunity for renewed attention for quality of care and shared decision making by timely initiating advance care planning.
Introduction
Palliative care aims to improve quality of life and end of life care of patients with life-threatening illnesses and to support their families. Improving end of life care is challenging due to the unpredictable course of chronic diseases. In order to benefit from palliative care, the definition of palliative care by the World Health Organisation emphasises timely identification of patients. 1 The surprise question was proposed by Lynn et al. 2 as a screening method to identify patients who might benefit from palliative care. It requires the healthcare professional to answer the question: ‘Would I be surprised if this patient were to die in the next 12 months?’ 2 (or a different timeframe other than 12 months).
Two earlier meta-analyses have been performed to study the accuracy of the surprise question.3,4 Results from Downar et al. 3 showed a sensitivity of 67.0% and specificity of 80.2%. White et al. 4 showed a pooled accuracy of 74.8%. Both meta-analyses included studies with different timeframes, patient subgroups and healthcare professionals. Downar et al. included studies with a 6, 12 and 18 months timeframe but did not differentiate between timeframes in their results. White et al. included studies with timeframes of 7 days, 30 days, 6 months, 6–12 months and 12 months and stated that an increase in timeframe did not impact the diagnostic accuracy. Both meta-analyses concluded that the surprise question performs better in cancer patients compared to other subgroups. White et al. suggested that doctors appear to be more accurate than nurses in recognising people in their last year of life. 4 However, the accuracy of the surprise question by type of healthcare professional is based on one study and more research is needed.
Many studies on the surprise question have been published in recent years, potentially giving new insights, not only into the overall accuracy of the surprise question, but also into potential differences between timeframes, patient subgroups and healthcare professionals answering the surprise question. Therefore, the aim of this systematic review and meta-analysis is to determine the accuracy of the surprise question in predicting death, investigating potential differences by timeframe, patient subgroup and type of healthcare professional answering the surprise question by answering the following questions: 1. How accurate is the surprise question in identifying patients in the last year of life? 2. Are there differences in accuracy of the surprise question between various timeframes? 3. Are there differences between patient subgroups to identify patients in the last year of life when using the surprise question? 4. Are there differences between healthcare professionals in identifying patients in the last year of life when using the surprise question?
Methods
Study design
This study entails a systematic review and meta-analysis of articles studying the accuracy of the surprise question. This study followed the reporting guideline of the Preferred Reporting Items for Systematic Reviews and Meta-analyses (PRISMA).5,6
Data sources and search strategy
A systematic search was performed in six databases from inception till January 22nd 2021: PubMed, Embase, Cochrane Library, Scopus, Web of Science and Cumulative Index to Nursing and Allied Health Literature (CINAHL). The search terms ‘surprise question’, ‘Gold Standards Framework’ and ‘NECPAL’ were combined using the Boolean operator OR. The latter two are more elaborate tools to predict the need for end of life care that also use the surprise question7,8 and were added after an initial pilot search. No filters or limits were applied in the search. Details of the search strategy can be found in Appendix 1. Cross-referencing of included studies was performed.
Eligibility criteria
Inclusion criteria
Studies were included if they met the following criteria:
Prospective studies of any design, including non-peer reviewed publications.
Using the surprise question as a prognostic indicator.
Death as outcome.
Exclusion criteria
Studies were excluded if they met the following criteria:
Text was not in English.
Design was retrospective.
Reversed surprise question (‘Would I be surprised if this patient were still alive in 12 months?’) was used.
The results were not obtainable from the text or after contact with the corresponding authors.
Timeframe of surprise question and follow-up did not match (e.g. a surprise question timeframe of 6 months and follow-up ‘this admission’).
Study selection
Two reviewers (EvL and LI) independently screened all studies by title and abstract to identify potentially relevant studies. Subsequently full texts of the remaining studies were assessed by the same two reviewers. Screening of the studies was performed using Rayyan. 9 Disagreements were resolved by discussion until consensus was reached. In case of doubt a third reviewer was consulted (JvD). In case of non-peer reviewed publications, databases were searched for full text versions and requested by contacting the corresponding author. In case of incomplete data or if interpretation of data was unclear, the corresponding author of (potentially) relevant studies was contacted to obtain additional data or information.
Quality of studies assessment
The Quality in Prognosis Studies (QUIPS) tool 10 was used for risk of bias assessment. Studies were considered of high quality if (1) the size of the eligible population and baseline characteristics were available (2) loss to follow-up was less than mortality rate and reasons for loss to follow-up were described (3) the setting and person asking the surprise question was described (4) outcome measurement was described and (5) if the risk of confounding was considered low. Studies were considered to have high confounding if decisions on limiting treatment, potentially leading to death, took place in the study setting (e.g. at the Intensive Care or dialysis unit) or when an intervention (consultation of palliative care team or advance care planning conversation) was planned based on surprise question outcome. Articles were critically appraised by two reviewers (EvL and LI). Disagreements were discussed until consensus was reached. Quality assessment did not affect the inclusion of studies.
Data extraction and statistical analysis
Two reviewers (EvL and LI) independently extracted the following data: study population, type of healthcare professional answering the surprise question, study setting, total subjects, total surprise question assessments, surprise question timeframe, mean age, gender and mortality. A ‘no’ answer to the surprise question will be referred to as a positive answer to the surprise question, whereas a ‘yes’ answer will be referred to as negative answer to the surprise question. In studies where multiple healthcare professionals answered the surprise question, the study’s definition was used to determine whether the answer was positive (this could require consensus in case of a multidisciplinary team or require at least one healthcare professional answering ‘no’). If multiple healthcare professionals answered the surprise question and the study provided data separately, the physician’s response was used for the meta-analysis when possible. In studies where a third option for answering the surprise question besides ‘yes’ and ‘no’ was possible (e.g. ‘unsure’) data extraction was performed conform the study’s definition of a positive surprise question answer (e.g. ‘unsure’ was regarded as ‘No, I would not be surprised’).
Studies were divided in subgroups based on timeframe and patient group (cancer, cardiac disease, emergency department, kidney disease, primary care and pulmonary disease). The patient groups consisting of too few studies for analysis were combined as various. If a study cohort could potentially be classified into two groups (e.g. cardiac and emergency department), the cohort was classified into the underlying organ specific disease (e.g. cardiac disease). A ‘6 to 12’ month timeframe was considered equivalent to a ‘12-month’ timeframe. In case a study contained a derivation and a validation cohort, these were counted as separate cohorts. When a study investigated two different timeframes of the surprise question, both timeframes were included in the analysis.
The accuracy of the surprise question was analysed by constructing 2 × 2 tables of the surprise question response and mortality for each study. A true positive was considered as ‘No, I would not be surprised’ and deceased within the predetermined timeframe and a true negative was considered as ‘Yes, I would be surprised’ and alive. Sensitivity, specificity, negative predictive value (NPV), positive predictive value (PPV) and confidence intervals (CI’s) were calculated for each study. CI’s were calculated with Wilson’s method. 11 We considered for sensitivity a correct outcome corresponding to a positive surprise question answer (‘No, I would not be surprised’) patients that died during the specified timeframe, and for specificity a correct outcome corresponding to patients with a negative surprise question answer (‘Yes, I would be surprised’) that did not die during the specified timeframe. NPV represents the percentage of patients surviving when the healthcare professionals predicted survival and PPV represents the percentage of patients dying when healthcare professionals predicted death within the specified timeframe. A bivariate random effects logistic regression model was used to pool sensitivity and specificity. 12 This model analyses the combination of sensitivity and specificity, estimates heterogeneity of sensitivity and specificity between studies and the correlation between these measures. Results from the analyses are presented as pooled sensitivity and specificity. PPV and NPV depend on prevalence of disease or mortality rate. Hence, pooled sensitivity and specificity were used to estimate pooled PPV and NPV with 95% CI for various mortality rates: 5%, 10% and 25%. From the results from this analysis, the summary c-statistic (area under the summary receiver operating characteristic curve) was estimated with formulas described by Walter. 13 The corresponding standard error (SE) was estimated with the Delta method. 14 The heterogeneity measure (τ 2 ), differences between studies beyond the uncertainty captured by confidence intervals, was used to estimate the I2 statistic. 15
In a second step, we assessed the impact of timeframe, patient group and peer reviewed versus non-peer reviewed studies by including these characteristics in the model. Reporting the results from the analysis with timeframe was limited to 6 and 12 months, as these were considered most relevant. We performed a likelihood ratio test to assess the influence of non-peer reviewed publications. For each subgroup we estimated pooled sensitivity, specificity, NPV, PPV and the c-statistic with CI’s. For the subgroups cardiac, emergency department and pulmonary disease, the analysis showed convergence difficulties, as the correlation between sensitivity and specificity over studies was estimated close to zero. For these analyses, we removed the correlation to obtain reliable results. Statistical analysis was performed with SAS version 9.4. 16 Forest plots were made using Microsoft Excel version 2016. 17
According to Dutch law, ethics approval was not required for this study.
Results
Study selection
The systematic search identified 1365 studies, of which 745 were duplicates. Cross-referencing resulted in the inclusion of three extra studies.18 –20 Of the remaining 623 studies, 500 articles were excluded based on title/abstract screening. Full texts were assessed of 123 studies. Based on full text, 64 articles were excluded. In total 59 studies were included in the meta-analysis.18,21 –78 The flowchart of the included studies can be found in Figure 1. Four studies consisted of multiple cohorts: three studies consisted of a derivation and a validation cohort22,38,52 and one study consisted of two different patient subgroups. 70 In total 63 cohorts were included in our analysis. Four studies used two variants of the surprise question with varying timeframes.31,44,64,74
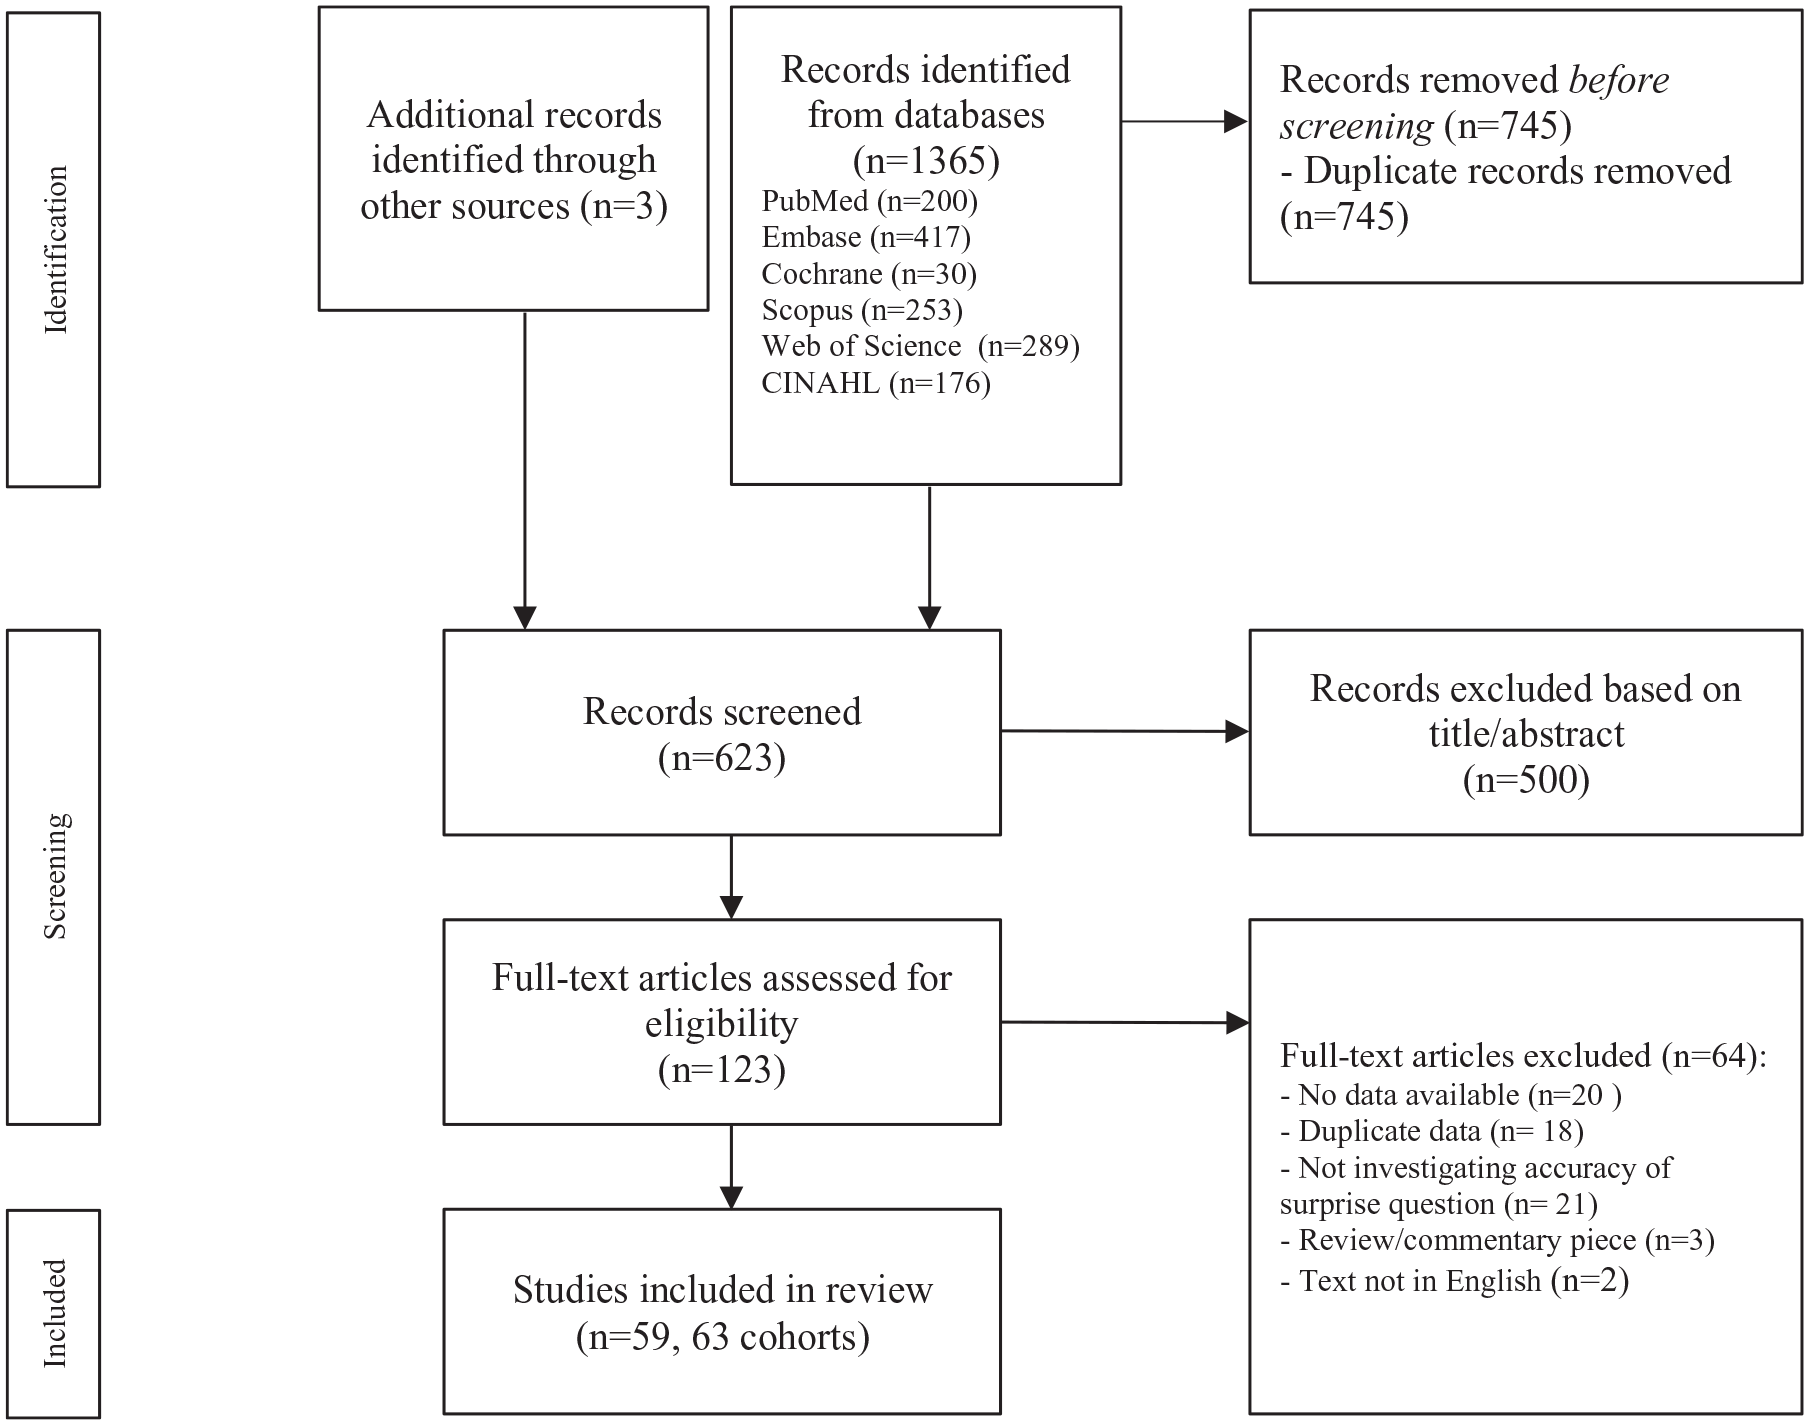
PRISMA flow diagram of screening process. 6
Corresponding authors of 35 potentially relevant studies were contacted in order to obtain full text or additional data in order to construct the 2 × 2 table. 18 studies were included after the authors provided additional data.22,23,36,38,39,42,43,46,47,52,53,55,59–61,70,72,75 Of the remaining 17 articles, two studies were excluded since they did not use the surprise question to predict death.79,80 Eight studies were excluded since the author was not able to not provide extra data.81–88 Seven studies were excluded since the corresponding author did not respond after various attempts.89–95 For eight other potential relevant studies (all non-peer reviewed), no contact details were available nor could these be obtained after extensive searching.96–103
Study characteristics
Characteristics of included studies can be found in Appendix 2. Studies were heterogeneous in timeframe, population, setting and healthcare professional answering the surprise question (e.g. nurse v medical specialist). Most studies originated in the United States (20 studies), United Kingdom (9 studies) and The Netherlands (six studies). Forty-five studies took place in the hospital. Of these, 12 studies were performed at haemodialysis units and eight in outpatient clinics. Of the remaining 14 studies, eight took place in general practice/primary care, three in hospice care settings, one in a nursing home and one in a neurorehabilitation centre. One study took place at multiple settings (three primary care centres, one general hospital, one intermediate care centre and four nursing homes). 37 Most studies investigated a 12-month timeframe of the surprise question (48 cohorts). Other timeframes were 3 days, 67 1 week, 31 1 month,31,36,43,51,56,74 3 months, 44 6 months22,38,42,46,47,53,64 and 24 months. 57 Four studies used two variants of the surprise question with varying timeframes.31,44,64,74 In general, patients included were adults (>18 years), except for one study performed in children. 44 Eighteen studies included patients with kidney disease, 12 patients with cancer, seven with cardiac disease, seven included a diverse group of patients in general practice/primary care, six studies included patients with pulmonary disease and five studies included patients from the emergency department. In seven studies the surprise question was answered by various healthcare professionals.26,45,50,57,60,71,75 In two studies answering the surprise question was based on consensus of a multidisciplinary team.30,44 Mortality rate of all studies was on average 11.85% and varied between studies from 0.99% (primary care) 76 to 78.78% (advanced cancer patients at the emergency department). 63
In total five of the included studies added a third option for answering the surprise question besides ‘yes’ and ‘no’, including ‘don’t know this patient well enough’, 26 ‘don’t know’, 66 ‘unsure’, 48 ‘uncertain’ 49 and ‘defer’. 71 In total these answers represent 61 of 88.268 surprise question assessments, varying from 6% 48 to 9% 71 per study. In two studies this percentage could not be retrieved.26,49
Quality assessment: Risk of bias
A detailed overview of the risk of bias assessment is presented in Appendix 3. Three studies had a high risk of bias (two non-peer reviewed), 13 studies (eight non-peer reviewed) had a moderate risk of bias and 43 studies (six non-peer reviewed) had a low risk of bias. Most methodological issues were in study population (domain 1: eight high and 30 intermediate risk of bias) and study confounding (domain 5: two high and 17 intermediate risk of bias). A risk of selection bias was in many studies caused by not specifying the eligible population. An intermediate or high-risk assessment in study confounding was in most studies due to the setting and patient population (e.g. haemodialysis patients) or caused by planning an intervention based on the outcome of the surprise question.
Meta-analysis
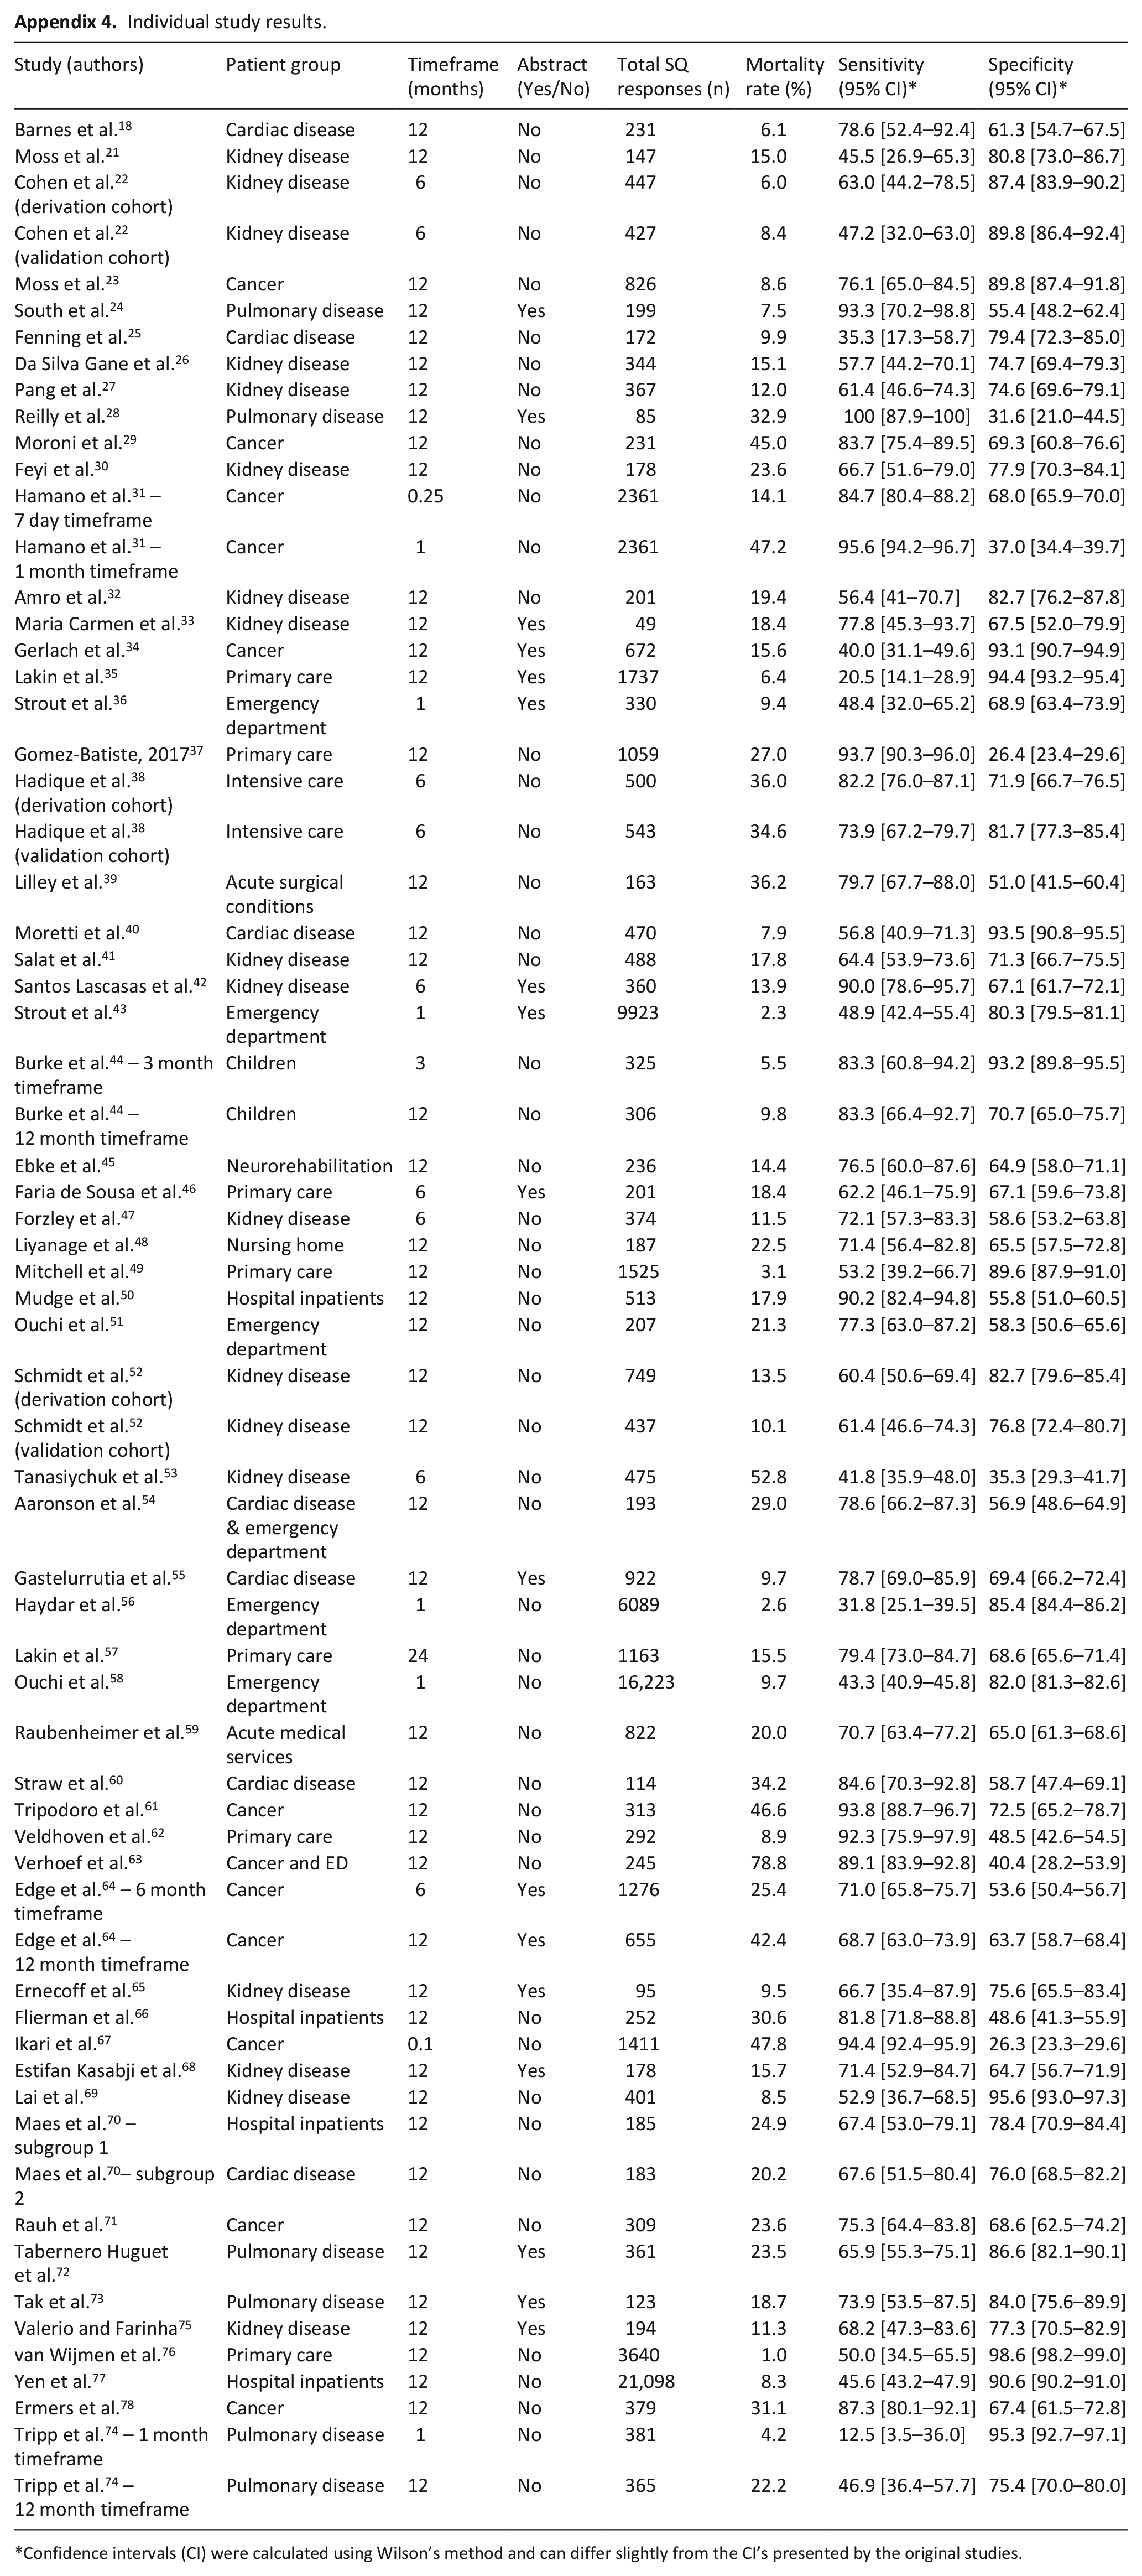
In total 88.268 assessments were included from 59 different studies and 63 different cohorts. Sensitivity between individual studies varied from 12.5% 74 to 100%, 28 specificity varied from 26.3% 67 to 98.6%, 76 NPV from 35.1% 53 to 100% 28 and PPV from 5.4%43,56 to 84.7%. 63 Individual study results and forest plots of the sensitivity and specificity can be found in Appendices 4–6. A likelihood ratio test showed that inclusion of non-peer reviewed publications did not significantly change the results (p value 0.84). Non-peer reviewed publications were therefore retained in all analyses.
The meta-analysis resulted in an estimated sensitivity of 71.4% (95% CI [66.3–76.4]), an estimated specificity of 74.0% (95% CI [69.3–78.6]) (Table 1, Figures 2 and 3). The estimated NPV varied from 98.0% (95% CI [97.7–98.3]) to 88.6% (95% CI [87.1–90.0]) with a mortality rate of 5% and 25% respectively (Table 1, Figures 4 and 5). The estimated PPV varied from 12.6% (95% CI [11.0–14.2]) with a mortality rate of 5%–47.8% (95% CI [44.2–51.3]) with a mortality rate of 25%. The c-statistic value was 0.79 (95% CI [0.77–0.81]) in the overall analysis. Heterogeneity (I2) in the overall analysis was 98.2% and 98.4% for sensitivity and specificity respectively.
Diagnostic accuracy of the surprise question.
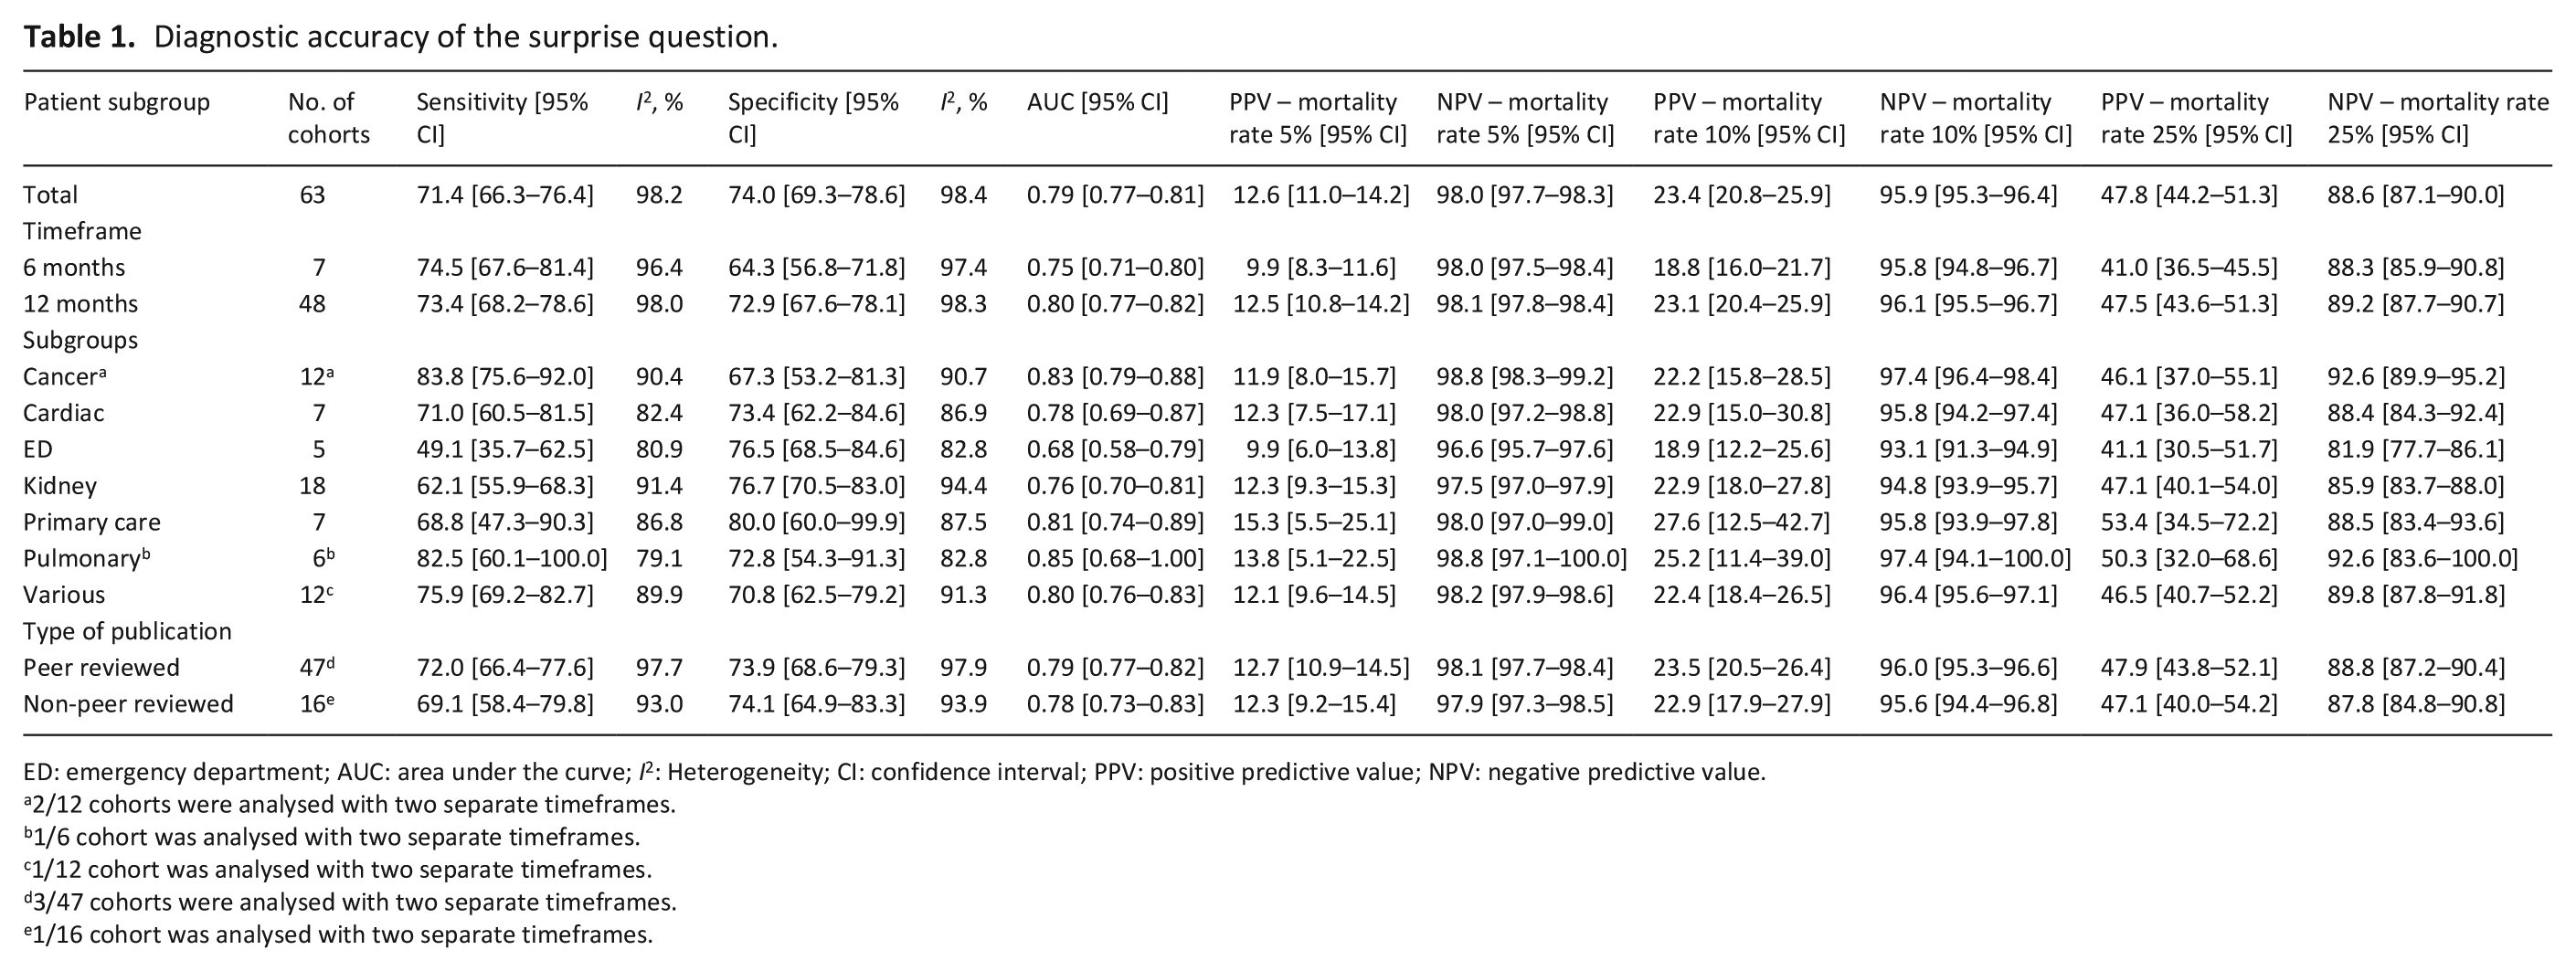
ED: emergency department; AUC: area under the curve; I2: Heterogeneity; CI: confidence interval; PPV: positive predictive value; NPV: negative predictive value.
2/12 cohorts were analysed with two separate timeframes.
1/6 cohort was analysed with two separate timeframes.
1/12 cohort was analysed with two separate timeframes.
3/47 cohorts were analysed with two separate timeframes.
1/16 cohort was analysed with two separate timeframes.
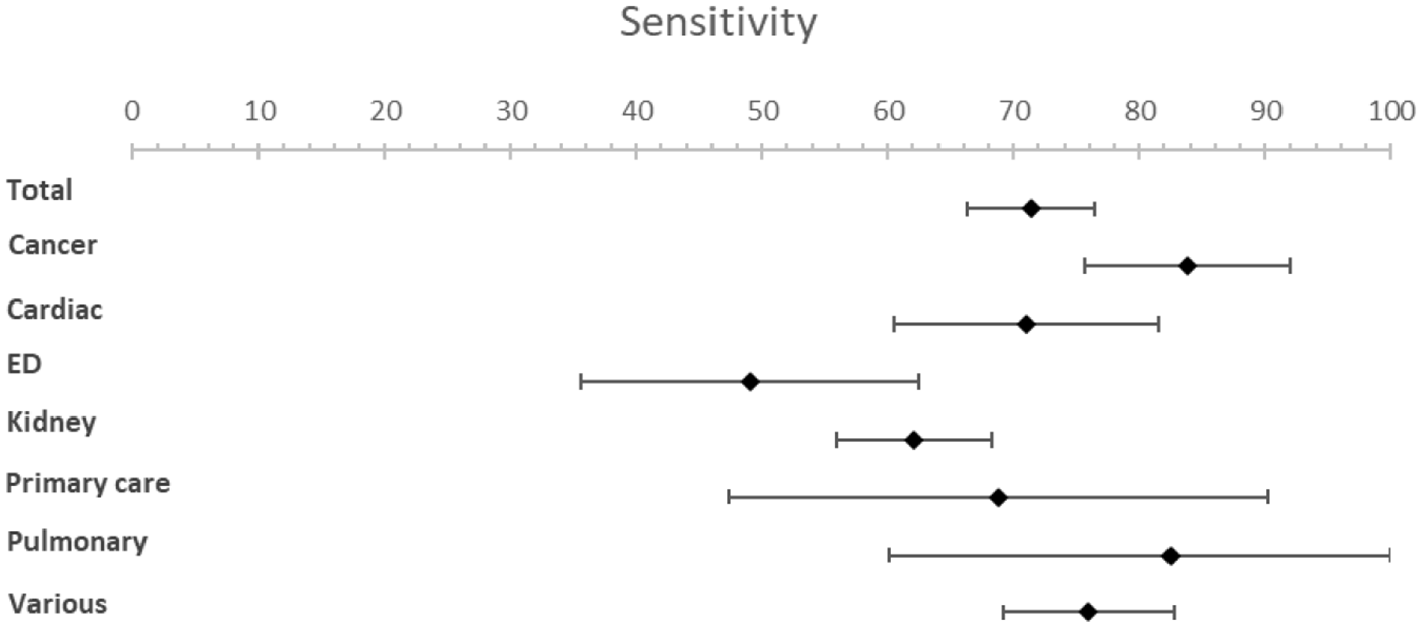
Forest plots for sensitivity.
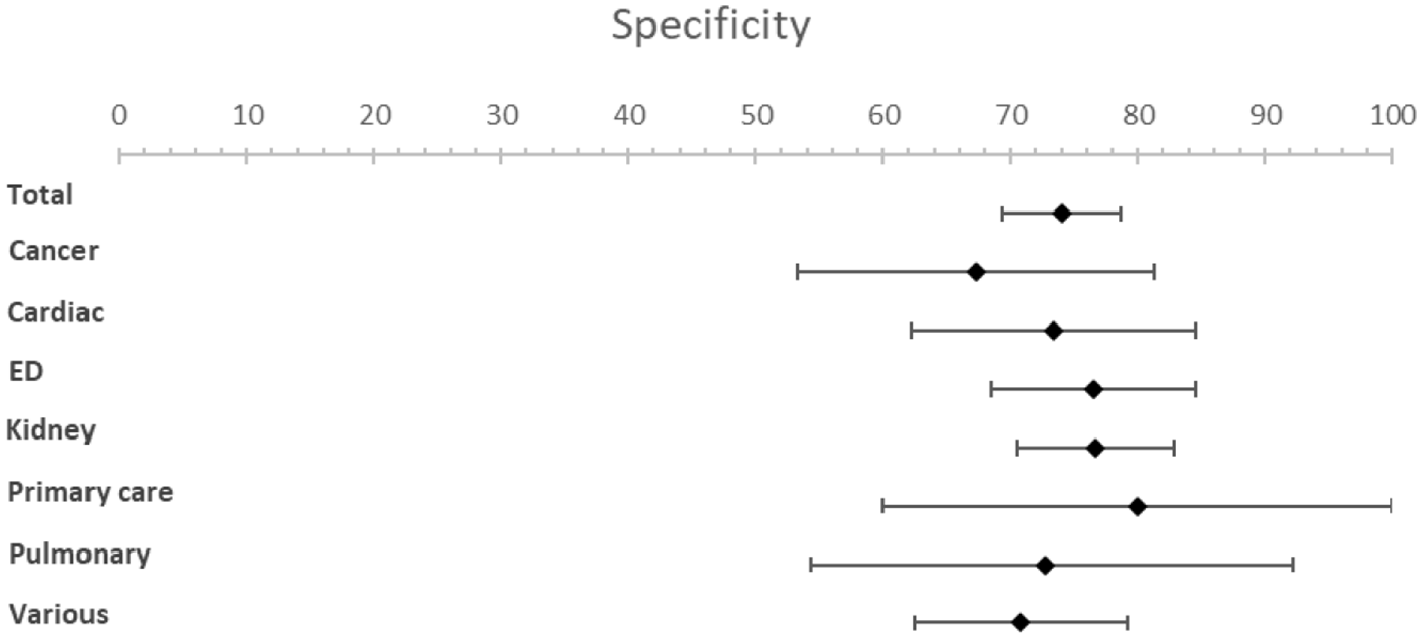
Forest plots for specificity.
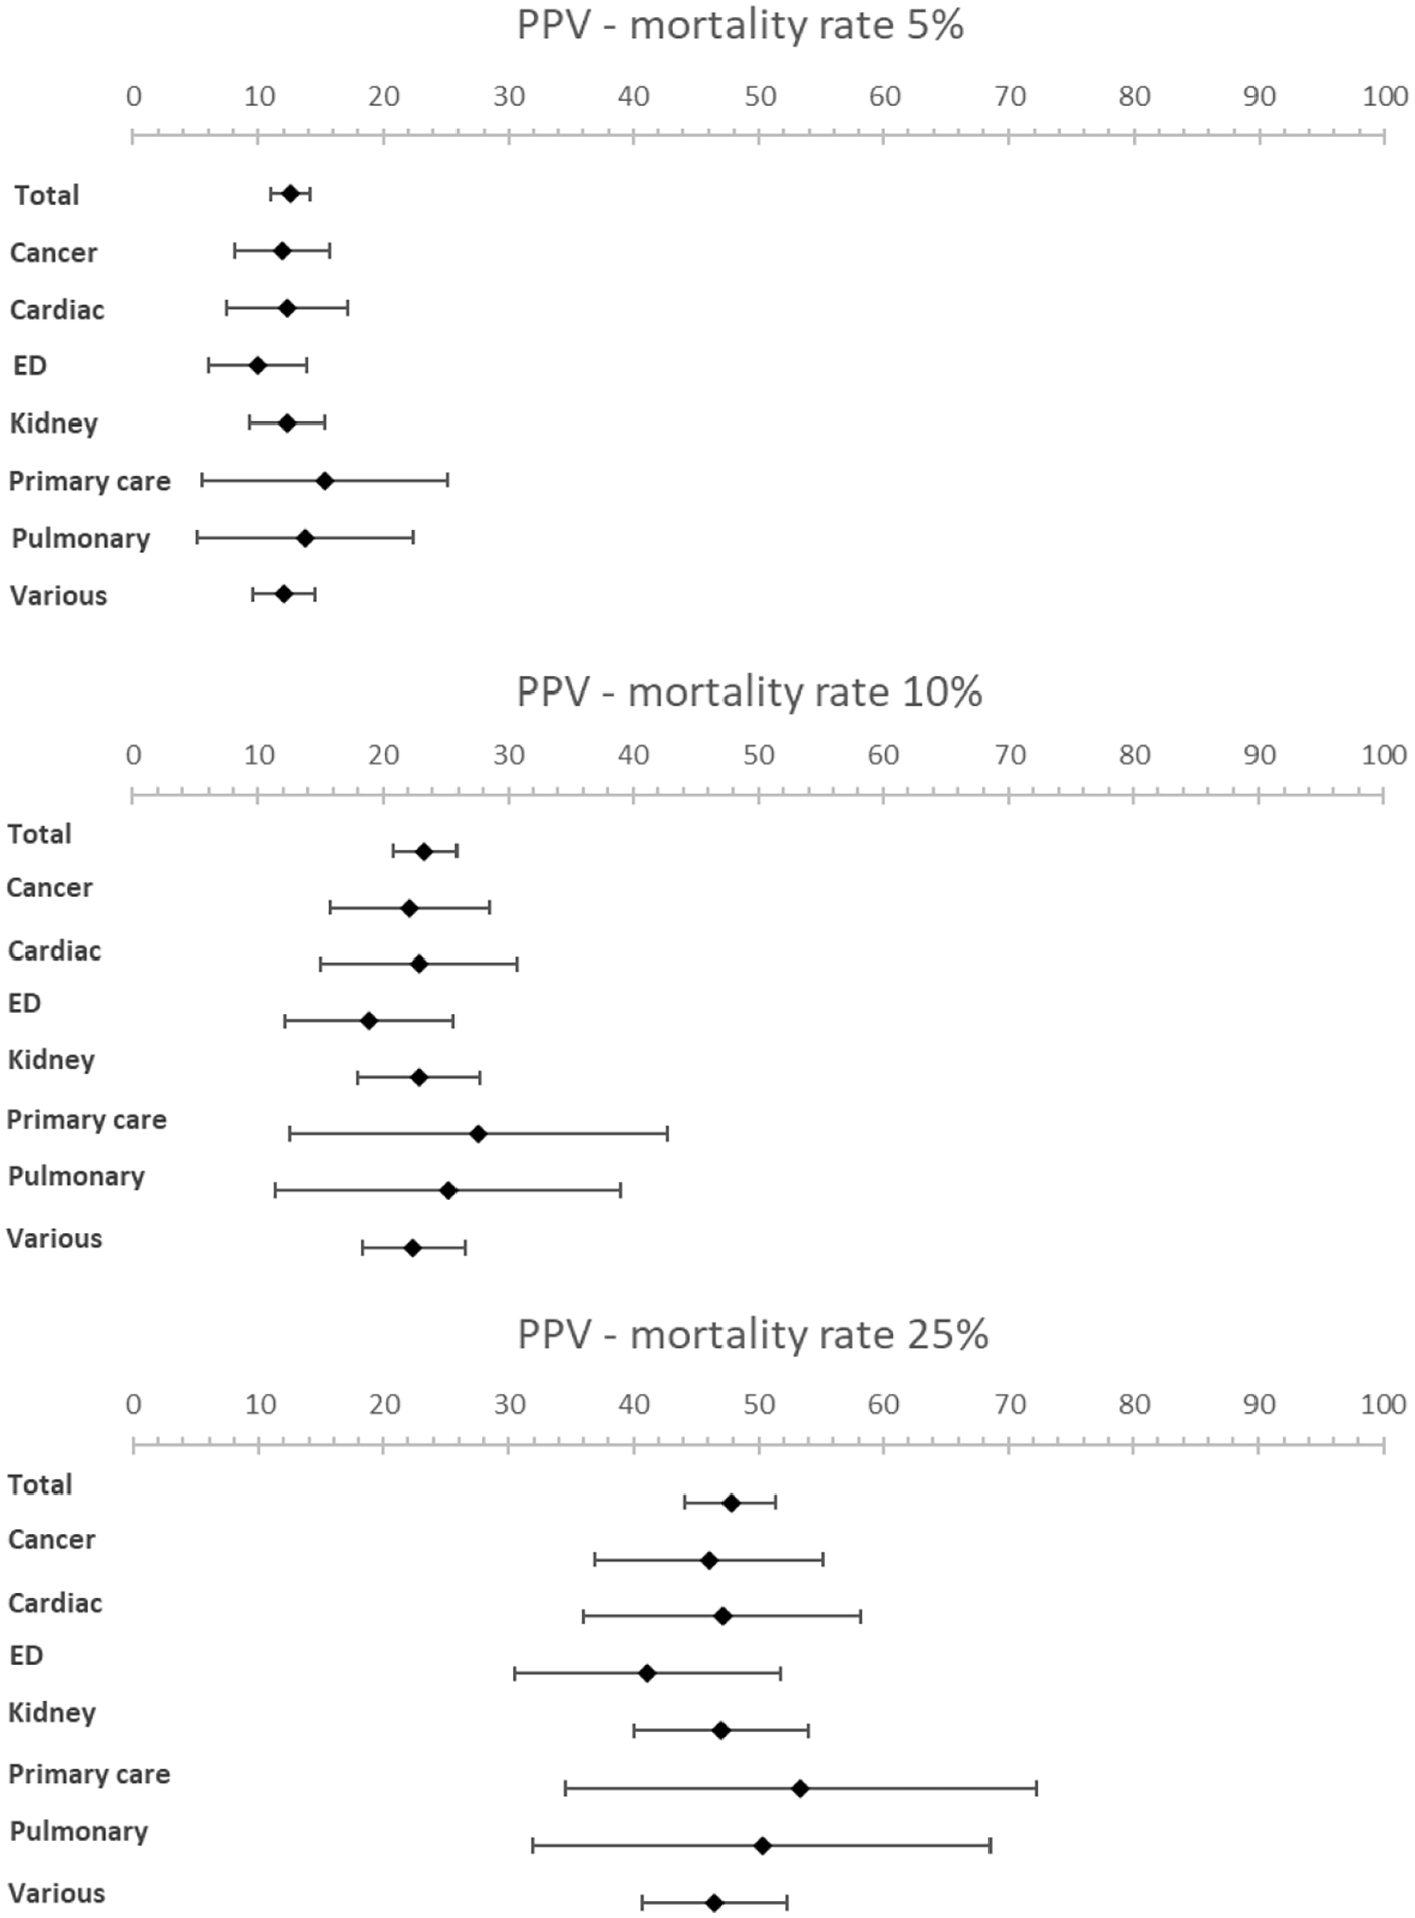
Forest plots showing PPV for various mortality rates (5%, 10% and 25%).
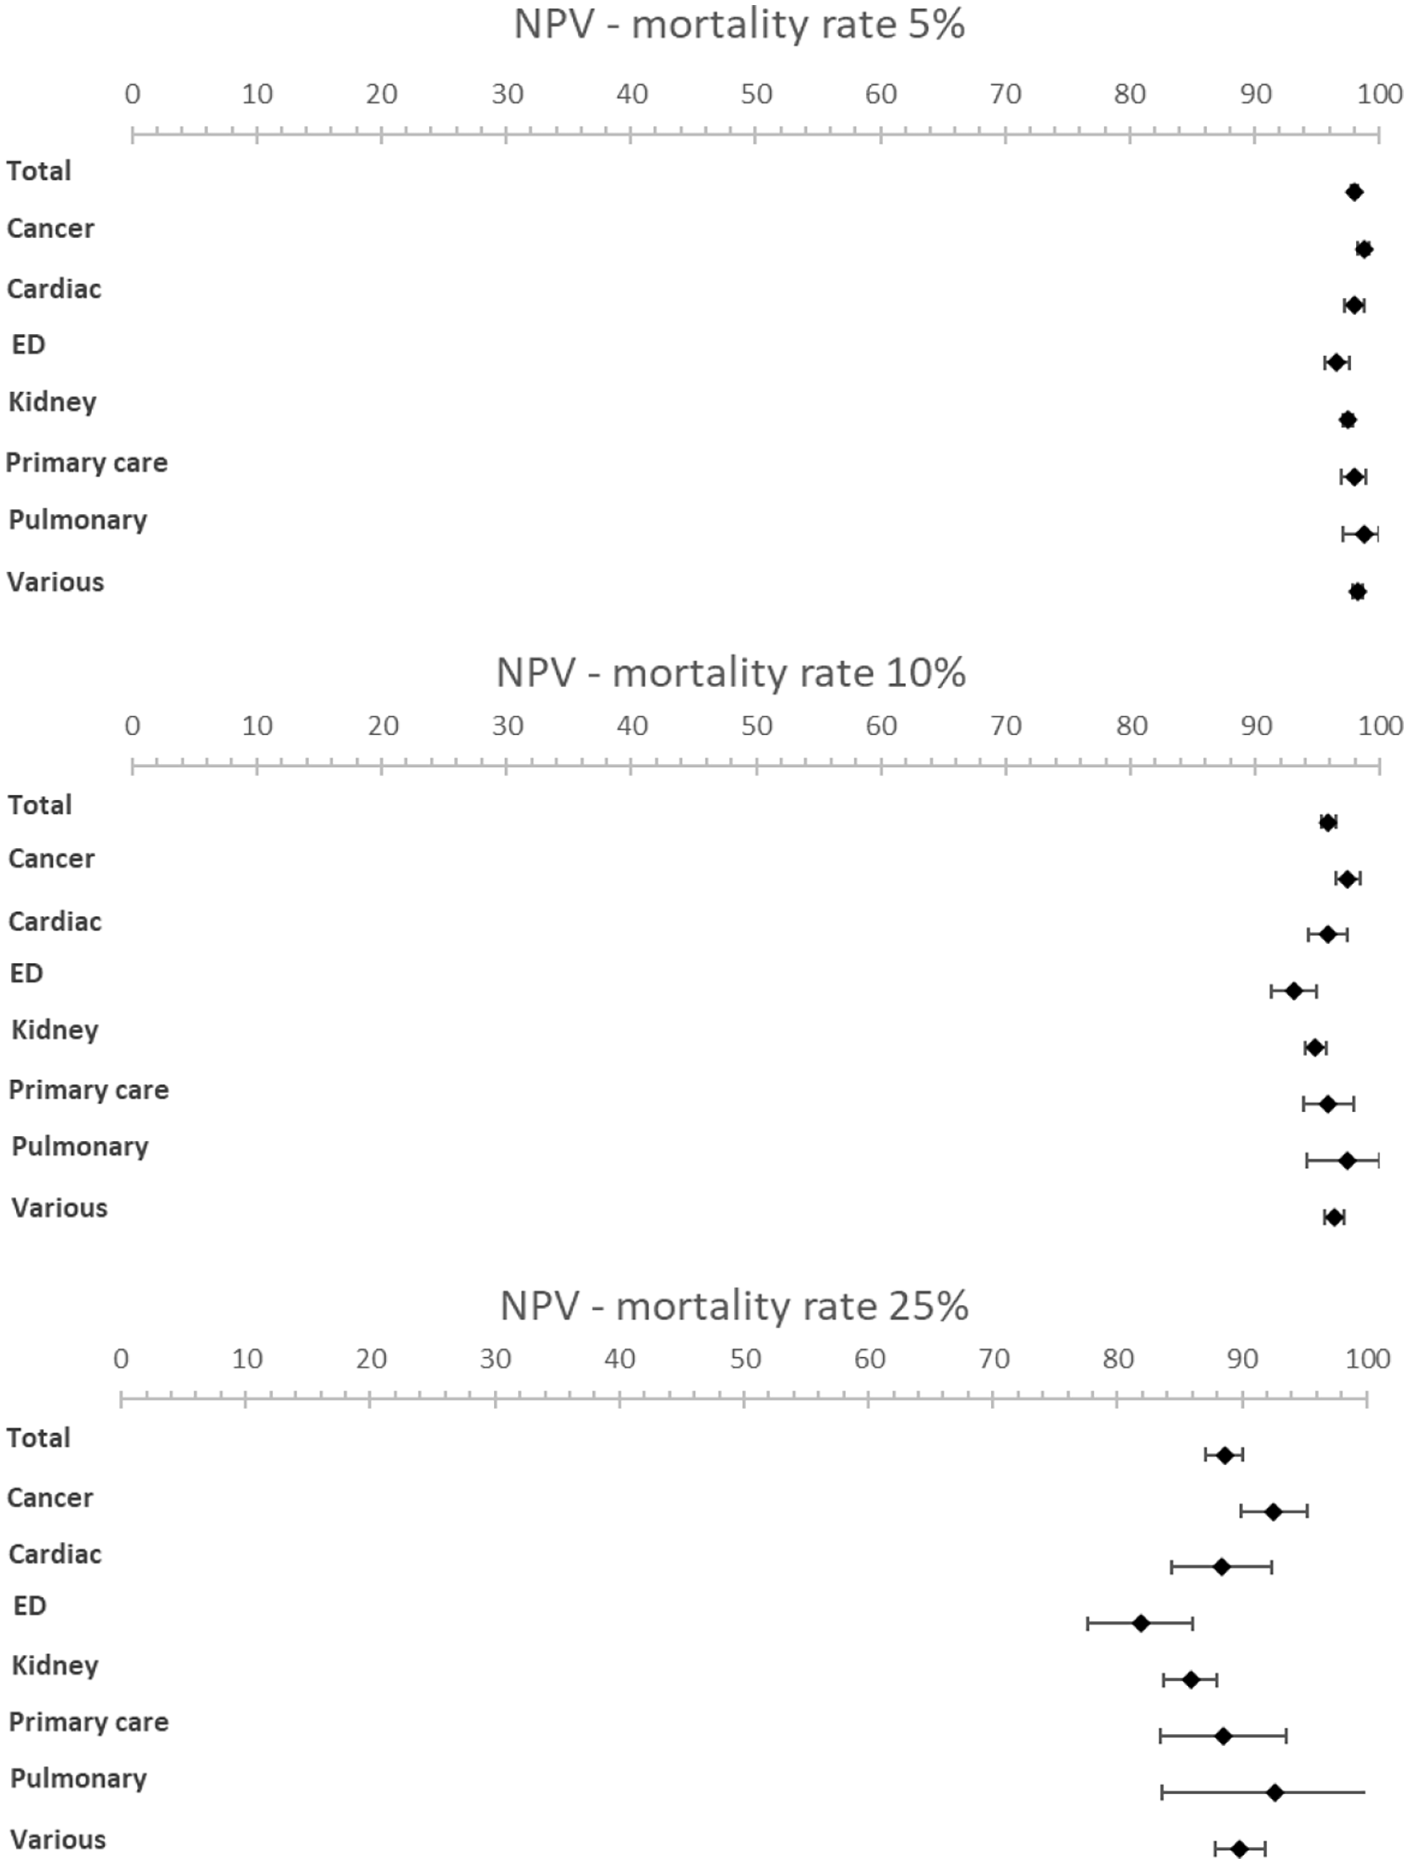
Forest plots showing NPV for various mortality rates (5%, 10% and 25%).
Results from the subgroup analysis including timeframe subgroups (6- and 12-months), patient subgroups and peer reviewed versus non-peer reviewed subgroups can be found in Table 1 and Figures 2 to 5. Analysis of timeframe subgroups showed similar sensitivity for 6- and 12-month timeframe: 74.5% (95% CI [67.6–81.4]) and 73.4% (95% CI [68.2–78.6]) respectively. Specificity was lower for a 6-month timeframe 64.3% (95% CI [56.8–71.8]) compared to a 12-month timeframe 72.9% (95% CI [67.6–78.1]).
Subgroup analysis of patient subgroups showed a lower sensitivity for the surprise question at the emergency department (49.1%; 95% CI [35.7–62.5]) compared to higher sensitivities for cancer patients (83.8%; 95% CI [75.6–92.0]) and patients with pulmonary disease (82.5%; 95% CI [60.1–100]). Specificity varied from 67.3% (95% CI [53.2−81.3]) in cancer patients to 80.0% (95% CI [60.0–99.9]) in primary care patients. NPV was the lowest in the emergency department with a NPV of 96.6% (95% CI [95.8–97.6]) and the highest in pulmonary patients with a NPV of 98.8% (95% CI [97.1–100.0]) at a mortality rate of 5%. NPV varied from 81.9% (95% CI [77.7–86.1]) in patients at the emergency department to 92.6% (95% CI [83.6–100]) in patients with pulmonary disease and 92.6% (95% CI [89.9–95.2]) in patients with cancer at a mortality rate of 25%.
In seven studies multiple healthcare professionals answered the surprise question. Due to the heterogeneity of the results (different patient subgroups, different healthcare professionals answering the surprise question with different seniority and different intensity in care provision to the patient) we could not perform a meta-analysis on this subgroup. An overview of the accuracy of the surprise question by different healthcare professionals can be found in Table 2. The study by Da Silva Gane et al. 26 investigated the variability between nephrologists and nurses of different levels of seniority (referred to as ‘bands’). They conclude that nephrologists perform better compared to nurses based on a higher sensitivity and similar specificity. The study of Lakin et al. 57 also show that primary care physicians have a higher sensitivity compared to nurse care coordinators. On the contrary, the results of Valerio and Farinha 75 show that nurses have a higher sensitivity and lower specificity compared to nephrologists and the results of Straw et al. 60 show that heart failure nurses have a higher sensitivity compared to cardiologists, trainee-grade doctors and non-specialist nurses. Similar performances between healthcare professionals are seen in the study by Mudge et al. 50 when comparing doctors and senior nurses and by Rauh et al. 71 when comparing doctors, nurses and advanced practice providers. Ebke et al. 45 compare the accuracy of answering the surprise question by neurorehabilitation physicians and palliative care physicians, with palliative care physicians having a higher sensitivity and lower specificity. In five other studies multiple healthcare professionals answered the surprise question, however, no separate data was reported.40,52,55,68,74
Accuracy of the surprise question by type of healthcare professional.
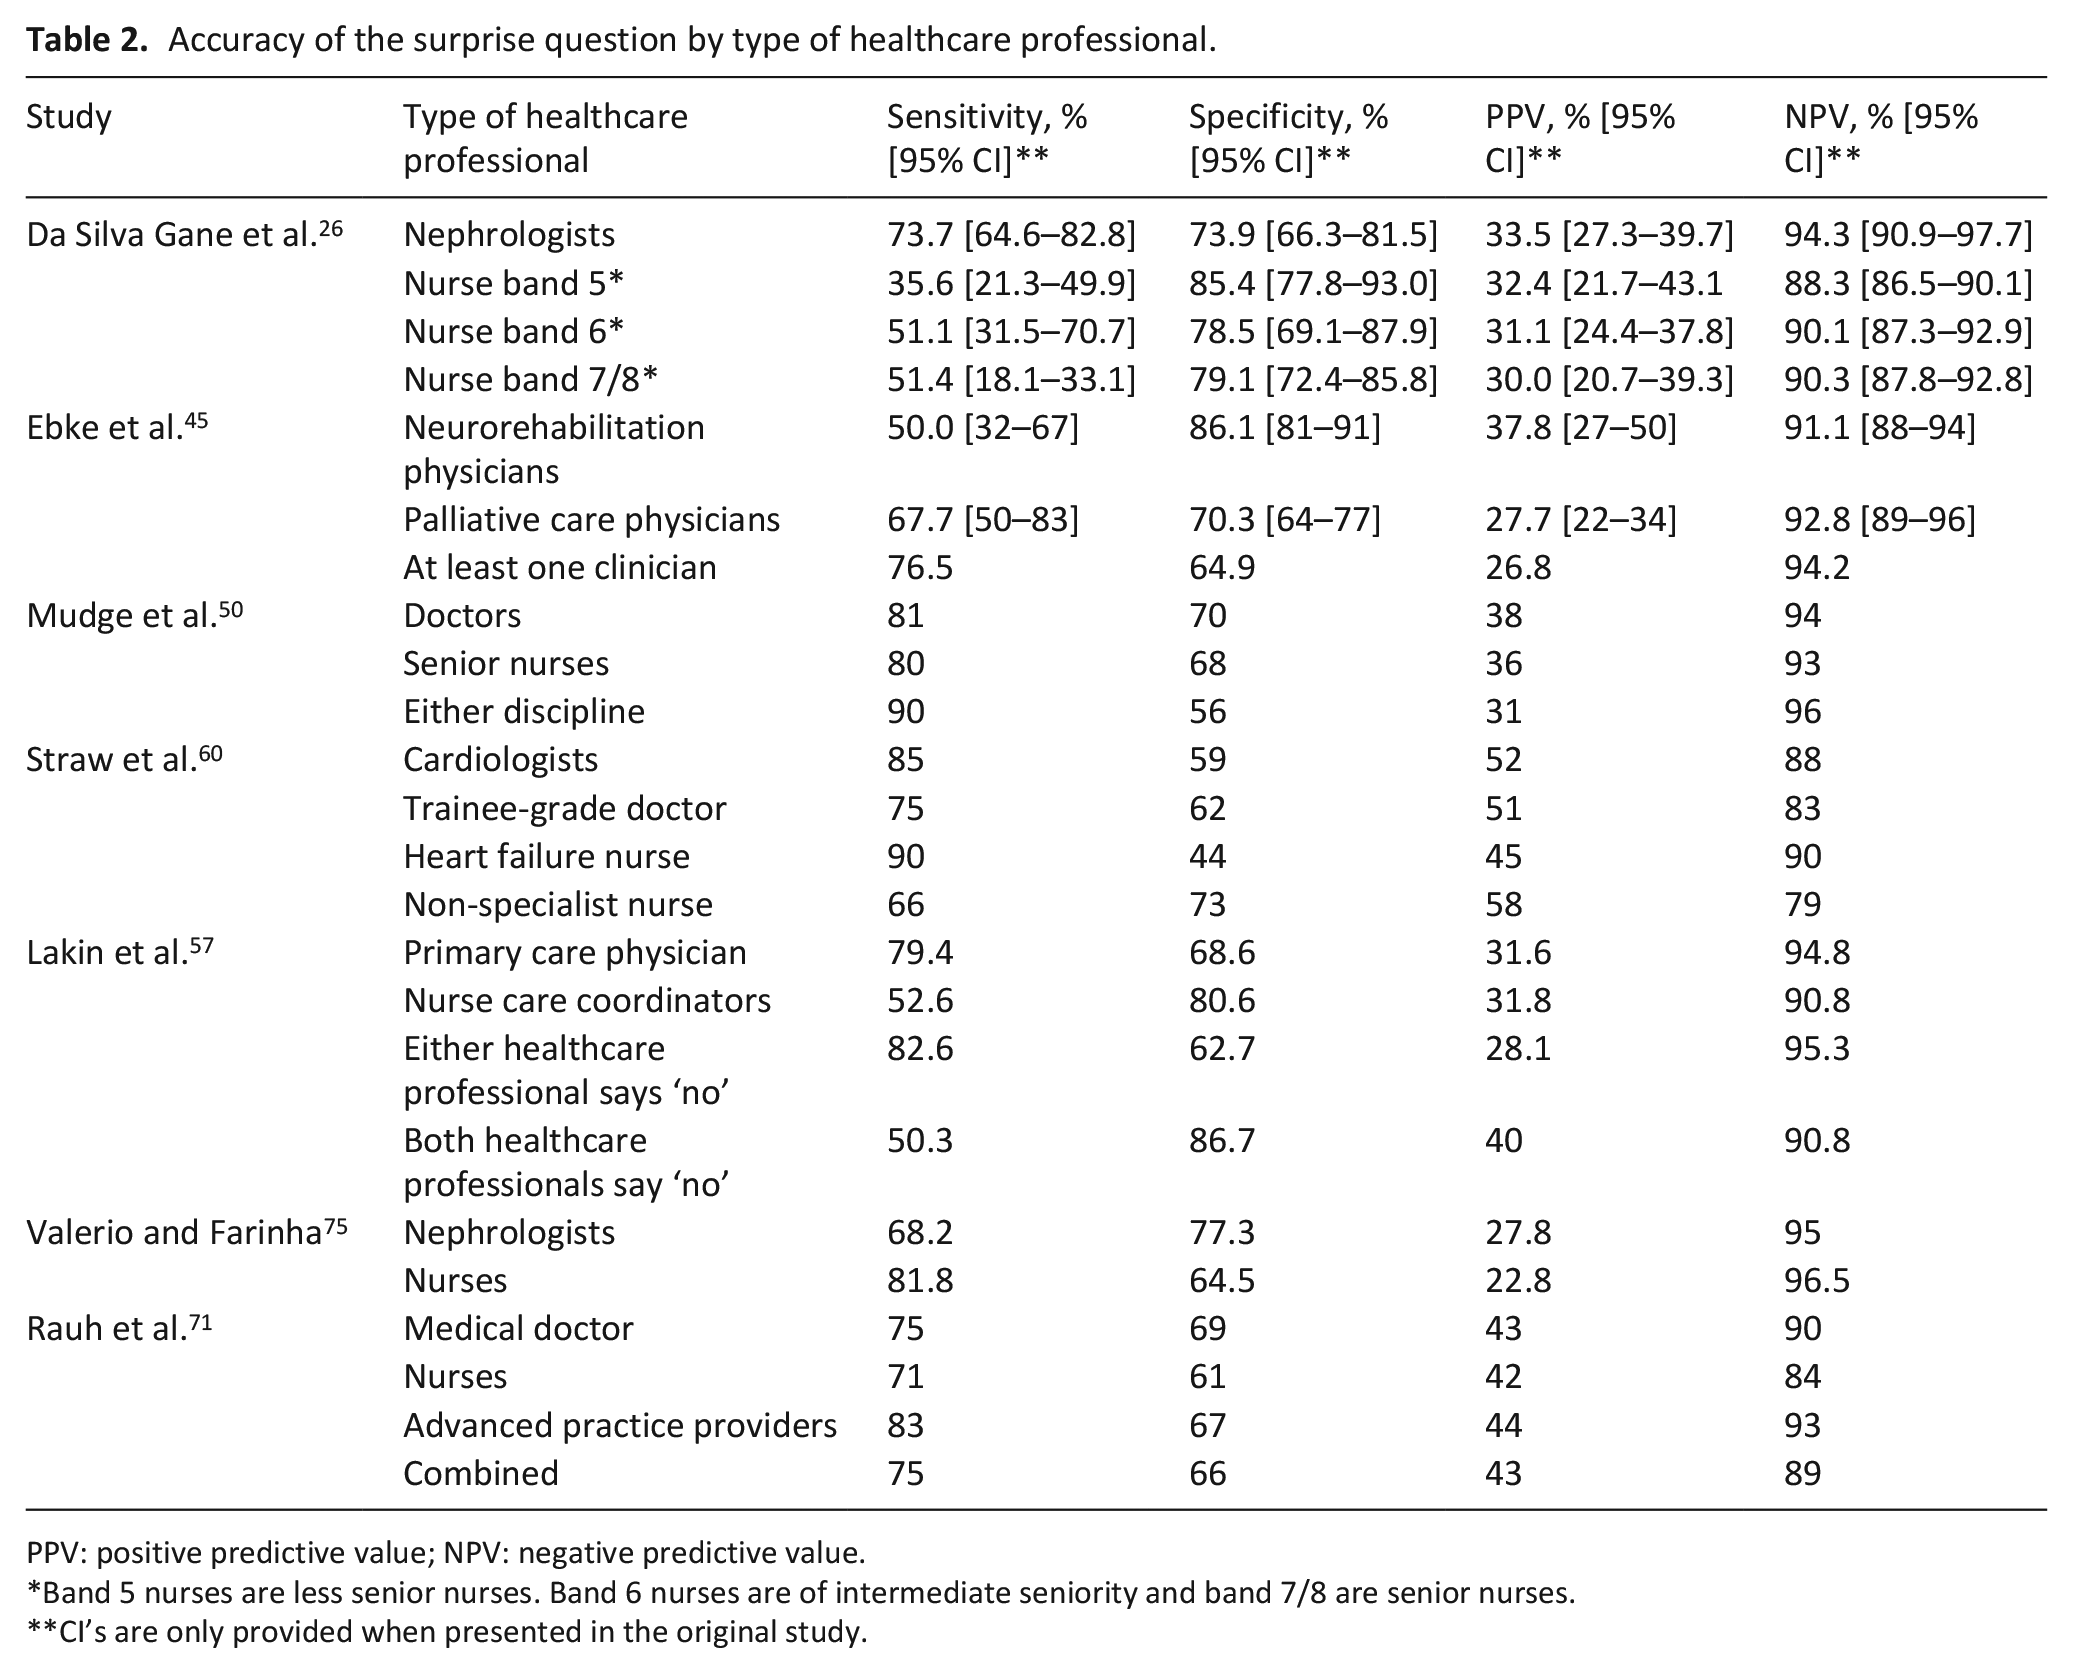
PPV: positive predictive value; NPV: negative predictive value.
Band 5 nurses are less senior nurses. Band 6 nurses are of intermediate seniority and band 7/8 are senior nurses.
CI’s are only provided when presented in the original study.
Discussion
Main findings
This meta-analysis evaluated the accuracy of the surprise question in predicting death, differentiating by timeframe, patient subgroup and by type of healthcare professional answering the surprise question. In total, 59 studies encompassing 63 cohorts were identified including 88.268 surprise question assessments. The pooled sensitivity was 71.4% (95% CI [66.3–76.4]) and the pooled specificity 74.0% (95% CI [69.3–78.6]). The c-statistic value was 0.79 (95% CI [0.77–0.81]) in the overall analysis. Analysis of timeframe subgroups showed similar sensitivity for 6- and 12-month timeframe (74.5% (95% CI [67.6–81.4]) and 73.4% (95% CI [68.2–78.6]) respectively) and lower specificity for 6-month timeframe compared to a 12-month timeframe (64.3% (95% CI [56.8–71.8]) and 72.9% (95% CI [67.6–78.1]) respectively). Pooled estimates showed variation between patient groups. A sensitivity of 83.8% (95% CI [75.6–92.0]) was observed for patients with cancer and 82.5% (95% CI [60.1–100]) for patients with pulmonary disease, whereas the sensitivity for the emergency department was 49.1 (95% CI [35.7–62.5]). Specificity showed less variation with values between 67.3% (95% CI [53.2 and 81.3]) for cancer patients and 80.0% (95% CI [60.0–99.9]) for primary care patients. The estimated NPV varied from 98.0% (95% CI [97.7–98.3]) to 88.6% (95% CI [87.1–90.0]) with a mortality rate of 5% and 25% respectively. The estimated PPV varied from 12.6% (95% CI [11.0 to 14.2]) with a mortality rate of 5% to 47.8% (95% CI [44.2–51.3]) with a mortality rate of 25%. The NPV remains high with increasing mortality rate in all subgroups. Seven studies provided detailed information on different healthcare professionals answering the surprise question. Based on these studies we did not find clear evidence for a difference between the accuracy of healthcare professionals answering the surprise question.
Strengths and limitations
This study has a number of strengths. First of all, each part of the review process was independently undertaken by two reviewers. Furthermore, a high number of studies have been included. This can be explained by (1) the increased attention for palliative care and the surprise question, resulting in a high amount of recently published studies (2) the effort made to obtain additional data by contacting authors and (3) including non-peer reviewed studies: 16 of the 59 included studies were non-peer reviewed studies, mostly conference abstracts. We also included the non-peer reviewed studies in an effort to avoid publication bias of favourable outcomes. 104 A limitation of including non-peer reviewed studies is that they did not provide sufficient information for a comprehensive quality assessment, which could have led to a relatively negative quality assessment. Furthermore, we observed a high degree of heterogeneity, with an overall I2 of 98.2% and 98.4% for sensitivity and specificity respectively. The analysis with subgroups (i.e. timeframe, patient subgroups and type of publication) still showed a high degree of heterogeneity. This can be explained by the enormous diversity in included studies, reflecting the different real-life circumstances in which the surprise question is used, and its versatile nature. Furthermore, the accuracy of the surprise question may be overestimated due to a possible self-fulling prophecy: a positive answer to the surprise question (‘No, I would not be surprised’) could lead to, consciously or subconsciously, discussing goals of care, thereby potentially influencing outcome. Finally, c-statistics were estimated with an easy to apply formula, which may result in a slight over-estimation. 13
Comparison to other literature
As described earlier, two meta-analyses were performed on the accuracy of the surprise question by Downar et al. 3 and White et al. 4 Despite this, the subjectiveness and accuracy of using the surprise question are still debated.105,106 The previous meta-analyses included 17 and 22 cohorts, with 11.621 and 25.718 surprise question assessments respectively, compared to 63 cohorts and 88.268 SQ assessments in this study. Moreover, Downar et al. did not include ‘Gold Standards Framework’ in the search, therefore missing studies that did not mention the surprise question in title or abstract. Furthermore, both meta-analyses report a substantial risk of bias in their included studies. Indeed, in our assessment, most pre-2017 studies have an increased risk of bias whereas more recent studies seem to be of better methodological quality. Hence, our results may be more reliable due to the increase of surprise question assessments included and improved methodological quality of included studies.
This study shows similar results in overall accuracy in predicting death compared to the previous meta-analyses. Downar et al. reported a sensitivity of 67.0% and a specificity of 80.2% compared to 71.4% and 74.0% respectively in our study. The c-statistic (area under the curve) of Downar et al. 3 was 0.81 [0.78–0.84] compared to 0.79 [0.77–0.81] in our meta-analysis. De Bock et al. 107 studied the accuracy of the Supportive and Palliative Care Indicators Tool (SPICT) in a geriatric population and report a higher sensitivity of 84.1% and a lower specificity of 57.9% compared to our results of the surprise question.
White et al. stated that an increase in timeframe did not impact the diagnostic accuracy. Our study showed similar sensitivity for 6- and 12-month timeframe. However we found a lower specificity for 6-month timeframe compared to a 12-month timeframe. Our study confirms the previous conclusions that the surprise question performs better in cancer patients compared to other subgroups. We did not find clear evidence for a difference between the accuracy of healthcare professionals answering the surprise question, in contrast to an earlier suggestion by White et al. 4 that doctors seem to be more accurate than nurses in recognising people in the last year of life.
Implications for practice
A systematic review by Cardona-Morrell et al. 108 indicated that on average 33%–38% of patients nearing their end of life receive non-beneficial treatments in the last 6 months of their life. Advance care planning can have a positive effect on end of life care, decrease life-sustaining treatment, increase use of hospice and palliative care, prevent hospital admissions and improve goal-concordant care. 109 Timely identification of patients who could potentially benefit from advance care planning is important. 110 The importance of advance care planning increases when nearing the end of life. Hence, prognostication of mortality can be used as a proxy for initiating advance care planning. The surprise question is an easy to use tool 2 and does not require large amounts of clinical data compared to other available screening tools. 111 These characteristics and the reasonable accuracy in predicting death with fairly high NPV with various mortality rates make the surprise question an appropriate screening tool for initiating advance care planning. Additionally, patients with a positive answer to the surprise question (‘No, I would not be surprised’) are likely to be vulnerable and may therefore benefit from advance care planning regardless of whether they die exactly within the specified timeframe. Furthermore, initiating advance care planning ‘too early’ does not seem to cause damage. 109 The results of this systematic review and meta-analysis encourage the use of the surprise question as screening tool by various healthcare professionals, not exclusively by doctors. We think the surprise question should not solely be seen as an indicator of prognostication of death but rather as an opportunity for renewed attention for quality of care and shared decision making by timely initiating advance care planning.
Conclusion
We found overall reasonable test characteristics for the surprise question. Additionally, this study showed notable differences in performance within patient subgroups. However, we did not find an indication of notable differences between timeframe and healthcare professionals. We submit that the surprise question is an appropriate tool for initiating advance care planning.
Footnotes
Appendix
Individual study results.
| Study (authors) | Patient group | Timeframe (months) | Abstract (Yes/No) | Total SQ responses (n) | Mortality rate (%) | Sensitivity (95% CI)* | Specificity (95% CI)* |
|---|---|---|---|---|---|---|---|
| Barnes et al. 18 | Cardiac disease | 12 | No | 231 | 6.1 | 78.6 [52.4–92.4] | 61.3 [54.7–67.5] |
| Moss et al. 21 | Kidney disease | 12 | No | 147 | 15.0 | 45.5 [26.9–65.3] | 80.8 [73.0–86.7] |
| Cohen et al. 22 (derivation cohort) | Kidney disease | 6 | No | 447 | 6.0 | 63.0 [44.2–78.5] | 87.4 [83.9–90.2] |
| Cohen et al. 22 (validation cohort) | Kidney disease | 6 | No | 427 | 8.4 | 47.2 [32.0–63.0] | 89.8 [86.4–92.4] |
| Moss et al. 23 | Cancer | 12 | No | 826 | 8.6 | 76.1 [65.0–84.5] | 89.8 [87.4–91.8] |
| South et al. 24 | Pulmonary disease | 12 | Yes | 199 | 7.5 | 93.3 [70.2–98.8] | 55.4 [48.2–62.4] |
| Fenning et al. 25 | Cardiac disease | 12 | No | 172 | 9.9 | 35.3 [17.3–58.7] | 79.4 [72.3–85.0] |
| Da Silva Gane et al. 26 | Kidney disease | 12 | No | 344 | 15.1 | 57.7 [44.2–70.1] | 74.7 [69.4–79.3] |
| Pang et al. 27 | Kidney disease | 12 | No | 367 | 12.0 | 61.4 [46.6–74.3] | 74.6 [69.6–79.1] |
| Reilly et al. 28 | Pulmonary disease | 12 | Yes | 85 | 32.9 | 100 [87.9–100] | 31.6 [21.0–44.5] |
| Moroni et al. 29 | Cancer | 12 | No | 231 | 45.0 | 83.7 [75.4–89.5] | 69.3 [60.8–76.6] |
| Feyi et al. 30 | Kidney disease | 12 | No | 178 | 23.6 | 66.7 [51.6–79.0] | 77.9 [70.3–84.1] |
| Hamano et al. 31 – 7 day timeframe | Cancer | 0.25 | No | 2361 | 14.1 | 84.7 [80.4–88.2] | 68.0 [65.9–70.0] |
| Hamano et al. 31 – 1 month timeframe | Cancer | 1 | No | 2361 | 47.2 | 95.6 [94.2–96.7] | 37.0 [34.4–39.7] |
| Amro et al. 32 | Kidney disease | 12 | No | 201 | 19.4 | 56.4 [41–70.7] | 82.7 [76.2–87.8] |
| Maria Carmen et al. 33 | Kidney disease | 12 | Yes | 49 | 18.4 | 77.8 [45.3–93.7] | 67.5 [52.0–79.9] |
| Gerlach et al. 34 | Cancer | 12 | Yes | 672 | 15.6 | 40.0 [31.1–49.6] | 93.1 [90.7–94.9] |
| Lakin et al. 35 | Primary care | 12 | Yes | 1737 | 6.4 | 20.5 [14.1–28.9] | 94.4 [93.2–95.4] |
| Strout et al. 36 | Emergency department | 1 | Yes | 330 | 9.4 | 48.4 [32.0–65.2] | 68.9 [63.4–73.9] |
| Gomez-Batiste, 2017 37 | Primary care | 12 | No | 1059 | 27.0 | 93.7 [90.3–96.0] | 26.4 [23.4–29.6] |
| Hadique et al. 38 (derivation cohort) | Intensive care | 6 | No | 500 | 36.0 | 82.2 [76.0–87.1] | 71.9 [66.7–76.5] |
| Hadique et al. 38 (validation cohort) | Intensive care | 6 | No | 543 | 34.6 | 73.9 [67.2–79.7] | 81.7 [77.3–85.4] |
| Lilley et al. 39 | Acute surgical conditions | 12 | No | 163 | 36.2 | 79.7 [67.7–88.0] | 51.0 [41.5–60.4] |
| Moretti et al. 40 | Cardiac disease | 12 | No | 470 | 7.9 | 56.8 [40.9–71.3] | 93.5 [90.8–95.5] |
| Salat et al. 41 | Kidney disease | 12 | No | 488 | 17.8 | 64.4 [53.9–73.6] | 71.3 [66.7–75.5] |
| Santos Lascasas et al. 42 | Kidney disease | 6 | Yes | 360 | 13.9 | 90.0 [78.6–95.7] | 67.1 [61.7–72.1] |
| Strout et al. 43 | Emergency department | 1 | Yes | 9923 | 2.3 | 48.9 [42.4–55.4] | 80.3 [79.5–81.1] |
| Burke et al. 44 – 3 month timeframe | Children | 3 | No | 325 | 5.5 | 83.3 [60.8–94.2] | 93.2 [89.8–95.5] |
| Burke et al. 44 – 12 month timeframe | Children | 12 | No | 306 | 9.8 | 83.3 [66.4–92.7] | 70.7 [65.0–75.7] |
| Ebke et al. 45 | Neurorehabilitation | 12 | No | 236 | 14.4 | 76.5 [60.0–87.6] | 64.9 [58.0–71.1] |
| Faria de Sousa et al. 46 | Primary care | 6 | Yes | 201 | 18.4 | 62.2 [46.1–75.9] | 67.1 [59.6–73.8] |
| Forzley et al. 47 | Kidney disease | 6 | No | 374 | 11.5 | 72.1 [57.3–83.3] | 58.6 [53.2–63.8] |
| Liyanage et al. 48 | Nursing home | 12 | No | 187 | 22.5 | 71.4 [56.4–82.8] | 65.5 [57.5–72.8] |
| Mitchell et al. 49 | Primary care | 12 | No | 1525 | 3.1 | 53.2 [39.2–66.7] | 89.6 [87.9–91.0] |
| Mudge et al. 50 | Hospital inpatients | 12 | No | 513 | 17.9 | 90.2 [82.4–94.8] | 55.8 [51.0–60.5] |
| Ouchi et al. 51 | Emergency department | 12 | No | 207 | 21.3 | 77.3 [63.0–87.2] | 58.3 [50.6–65.6] |
| Schmidt et al. 52 (derivation cohort) | Kidney disease | 12 | No | 749 | 13.5 | 60.4 [50.6–69.4] | 82.7 [79.6–85.4] |
| Schmidt et al. 52 (validation cohort) | Kidney disease | 12 | No | 437 | 10.1 | 61.4 [46.6–74.3] | 76.8 [72.4–80.7] |
| Tanasiychuk et al. 53 | Kidney disease | 6 | No | 475 | 52.8 | 41.8 [35.9–48.0] | 35.3 [29.3–41.7] |
| Aaronson et al. 54 | Cardiac disease & emergency department | 12 | No | 193 | 29.0 | 78.6 [66.2–87.3] | 56.9 [48.6–64.9] |
| Gastelurrutia et al. 55 | Cardiac disease | 12 | Yes | 922 | 9.7 | 78.7 [69.0–85.9] | 69.4 [66.2–72.4] |
| Haydar et al. 56 | Emergency department | 1 | No | 6089 | 2.6 | 31.8 [25.1–39.5] | 85.4 [84.4–86.2] |
| Lakin et al. 57 | Primary care | 24 | No | 1163 | 15.5 | 79.4 [73.0–84.7] | 68.6 [65.6–71.4] |
| Ouchi et al. 58 | Emergency department | 1 | No | 16,223 | 9.7 | 43.3 [40.9–45.8] | 82.0 [81.3–82.6] |
| Raubenheimer et al. 59 | Acute medical services | 12 | No | 822 | 20.0 | 70.7 [63.4–77.2] | 65.0 [61.3–68.6] |
| Straw et al. 60 | Cardiac disease | 12 | No | 114 | 34.2 | 84.6 [70.3–92.8] | 58.7 [47.4–69.1] |
| Tripodoro et al. 61 | Cancer | 12 | No | 313 | 46.6 | 93.8 [88.7–96.7] | 72.5 [65.2–78.7] |
| Veldhoven et al. 62 | Primary care | 12 | No | 292 | 8.9 | 92.3 [75.9–97.9] | 48.5 [42.6–54.5] |
| Verhoef et al. 63 | Cancer and ED | 12 | No | 245 | 78.8 | 89.1 [83.9–92.8] | 40.4 [28.2–53.9] |
| Edge et al. 64 – 6 month timeframe | Cancer | 6 | Yes | 1276 | 25.4 | 71.0 [65.8–75.7] | 53.6 [50.4–56.7] |
| Edge et al. 64 – 12 month timeframe | Cancer | 12 | Yes | 655 | 42.4 | 68.7 [63.0–73.9] | 63.7 [58.7–68.4] |
| Ernecoff et al. 65 | Kidney disease | 12 | Yes | 95 | 9.5 | 66.7 [35.4–87.9] | 75.6 [65.5–83.4] |
| Flierman et al. 66 | Hospital inpatients | 12 | No | 252 | 30.6 | 81.8 [71.8–88.8] | 48.6 [41.3–55.9] |
| Ikari et al. 67 | Cancer | 0.1 | No | 1411 | 47.8 | 94.4 [92.4–95.9] | 26.3 [23.3–29.6] |
| Estifan Kasabji et al. 68 | Kidney disease | 12 | Yes | 178 | 15.7 | 71.4 [52.9–84.7] | 64.7 [56.7–71.9] |
| Lai et al. 69 | Kidney disease | 12 | No | 401 | 8.5 | 52.9 [36.7–68.5] | 95.6 [93.0–97.3] |
| Maes et al. 70 – subgroup 1 | Hospital inpatients | 12 | No | 185 | 24.9 | 67.4 [53.0–79.1] | 78.4 [70.9–84.4] |
| Maes et al. 70 – subgroup 2 | Cardiac disease | 12 | No | 183 | 20.2 | 67.6 [51.5–80.4] | 76.0 [68.5–82.2] |
| Rauh et al. 71 | Cancer | 12 | No | 309 | 23.6 | 75.3 [64.4–83.8] | 68.6 [62.5–74.2] |
| Tabernero Huguet et al. 72 | Pulmonary disease | 12 | Yes | 361 | 23.5 | 65.9 [55.3–75.1] | 86.6 [82.1–90.1] |
| Tak et al. 73 | Pulmonary disease | 12 | Yes | 123 | 18.7 | 73.9 [53.5–87.5] | 84.0 [75.6–89.9] |
| Valerio and Farinha 75 | Kidney disease | 12 | Yes | 194 | 11.3 | 68.2 [47.3–83.6] | 77.3 [70.5–82.9] |
| van Wijmen et al. 76 | Primary care | 12 | No | 3640 | 1.0 | 50.0 [34.5–65.5] | 98.6 [98.2–99.0] |
| Yen et al. 77 | Hospital inpatients | 12 | No | 21,098 | 8.3 | 45.6 [43.2–47.9] | 90.6 [90.2–91.0] |
| Ermers et al. 78 | Cancer | 12 | No | 379 | 31.1 | 87.3 [80.1–92.1] | 67.4 [61.5–72.8] |
| Tripp et al. 74 – 1 month timeframe | Pulmonary disease | 1 | No | 381 | 4.2 | 12.5 [3.5–36.0] | 95.3 [92.7–97.1] |
| Tripp et al. 74 – 12 month timeframe | Pulmonary disease | 12 | No | 365 | 22.2 | 46.9 [36.4–57.7] | 75.4 [70.0–80.0] |
Confidence intervals (CI) were calculated using Wilson’s method and can differ slightly from the CI’s presented by the original studies.
Acknowledgements
We would like to thank all of the corresponding authors of the studies listed in this meta-analysis for providing us with additional data and/or information.
Authorship
EvL, LI and JvD conceived and designed the study. EvL and LI collected the data, critically appraised the articles and drafted the manuscript. NZ performed the statistical analyses. All authors critically revised the manuscript and approved the final version to be published.
Declaration of conflicting interests
The author(s) declared no potential conflicts of interest with respect to the research, authorship, and/or publication of this article.
Funding
The author(s) received no financial support for the research, authorship, and/or publication of this article.