
Abstract
Background:
Surveys suggest that most people prefer to die at home. Trends in causes of mortality and age composition could limit the feasibility of home deaths.
Aim:
To examine the effect of changes in decedents’ age, gender and cause of death on the pattern of place of death using data on all deaths in Norway for the period 1987–2011.
Design:
Population-based observation study comparing raw, predicted, as well as standardised shares of place of death isolating the effect of demographic and epidemiological changes. The analysis was bolstered with joinpoint regression to detect shifts in trends in standardised shares.
Setting/participants:
All deaths (1,091,303) in Norway 1987–2011 by age, gender and cause of death. Place of death at home, hospital, nursing home and other.
Results:
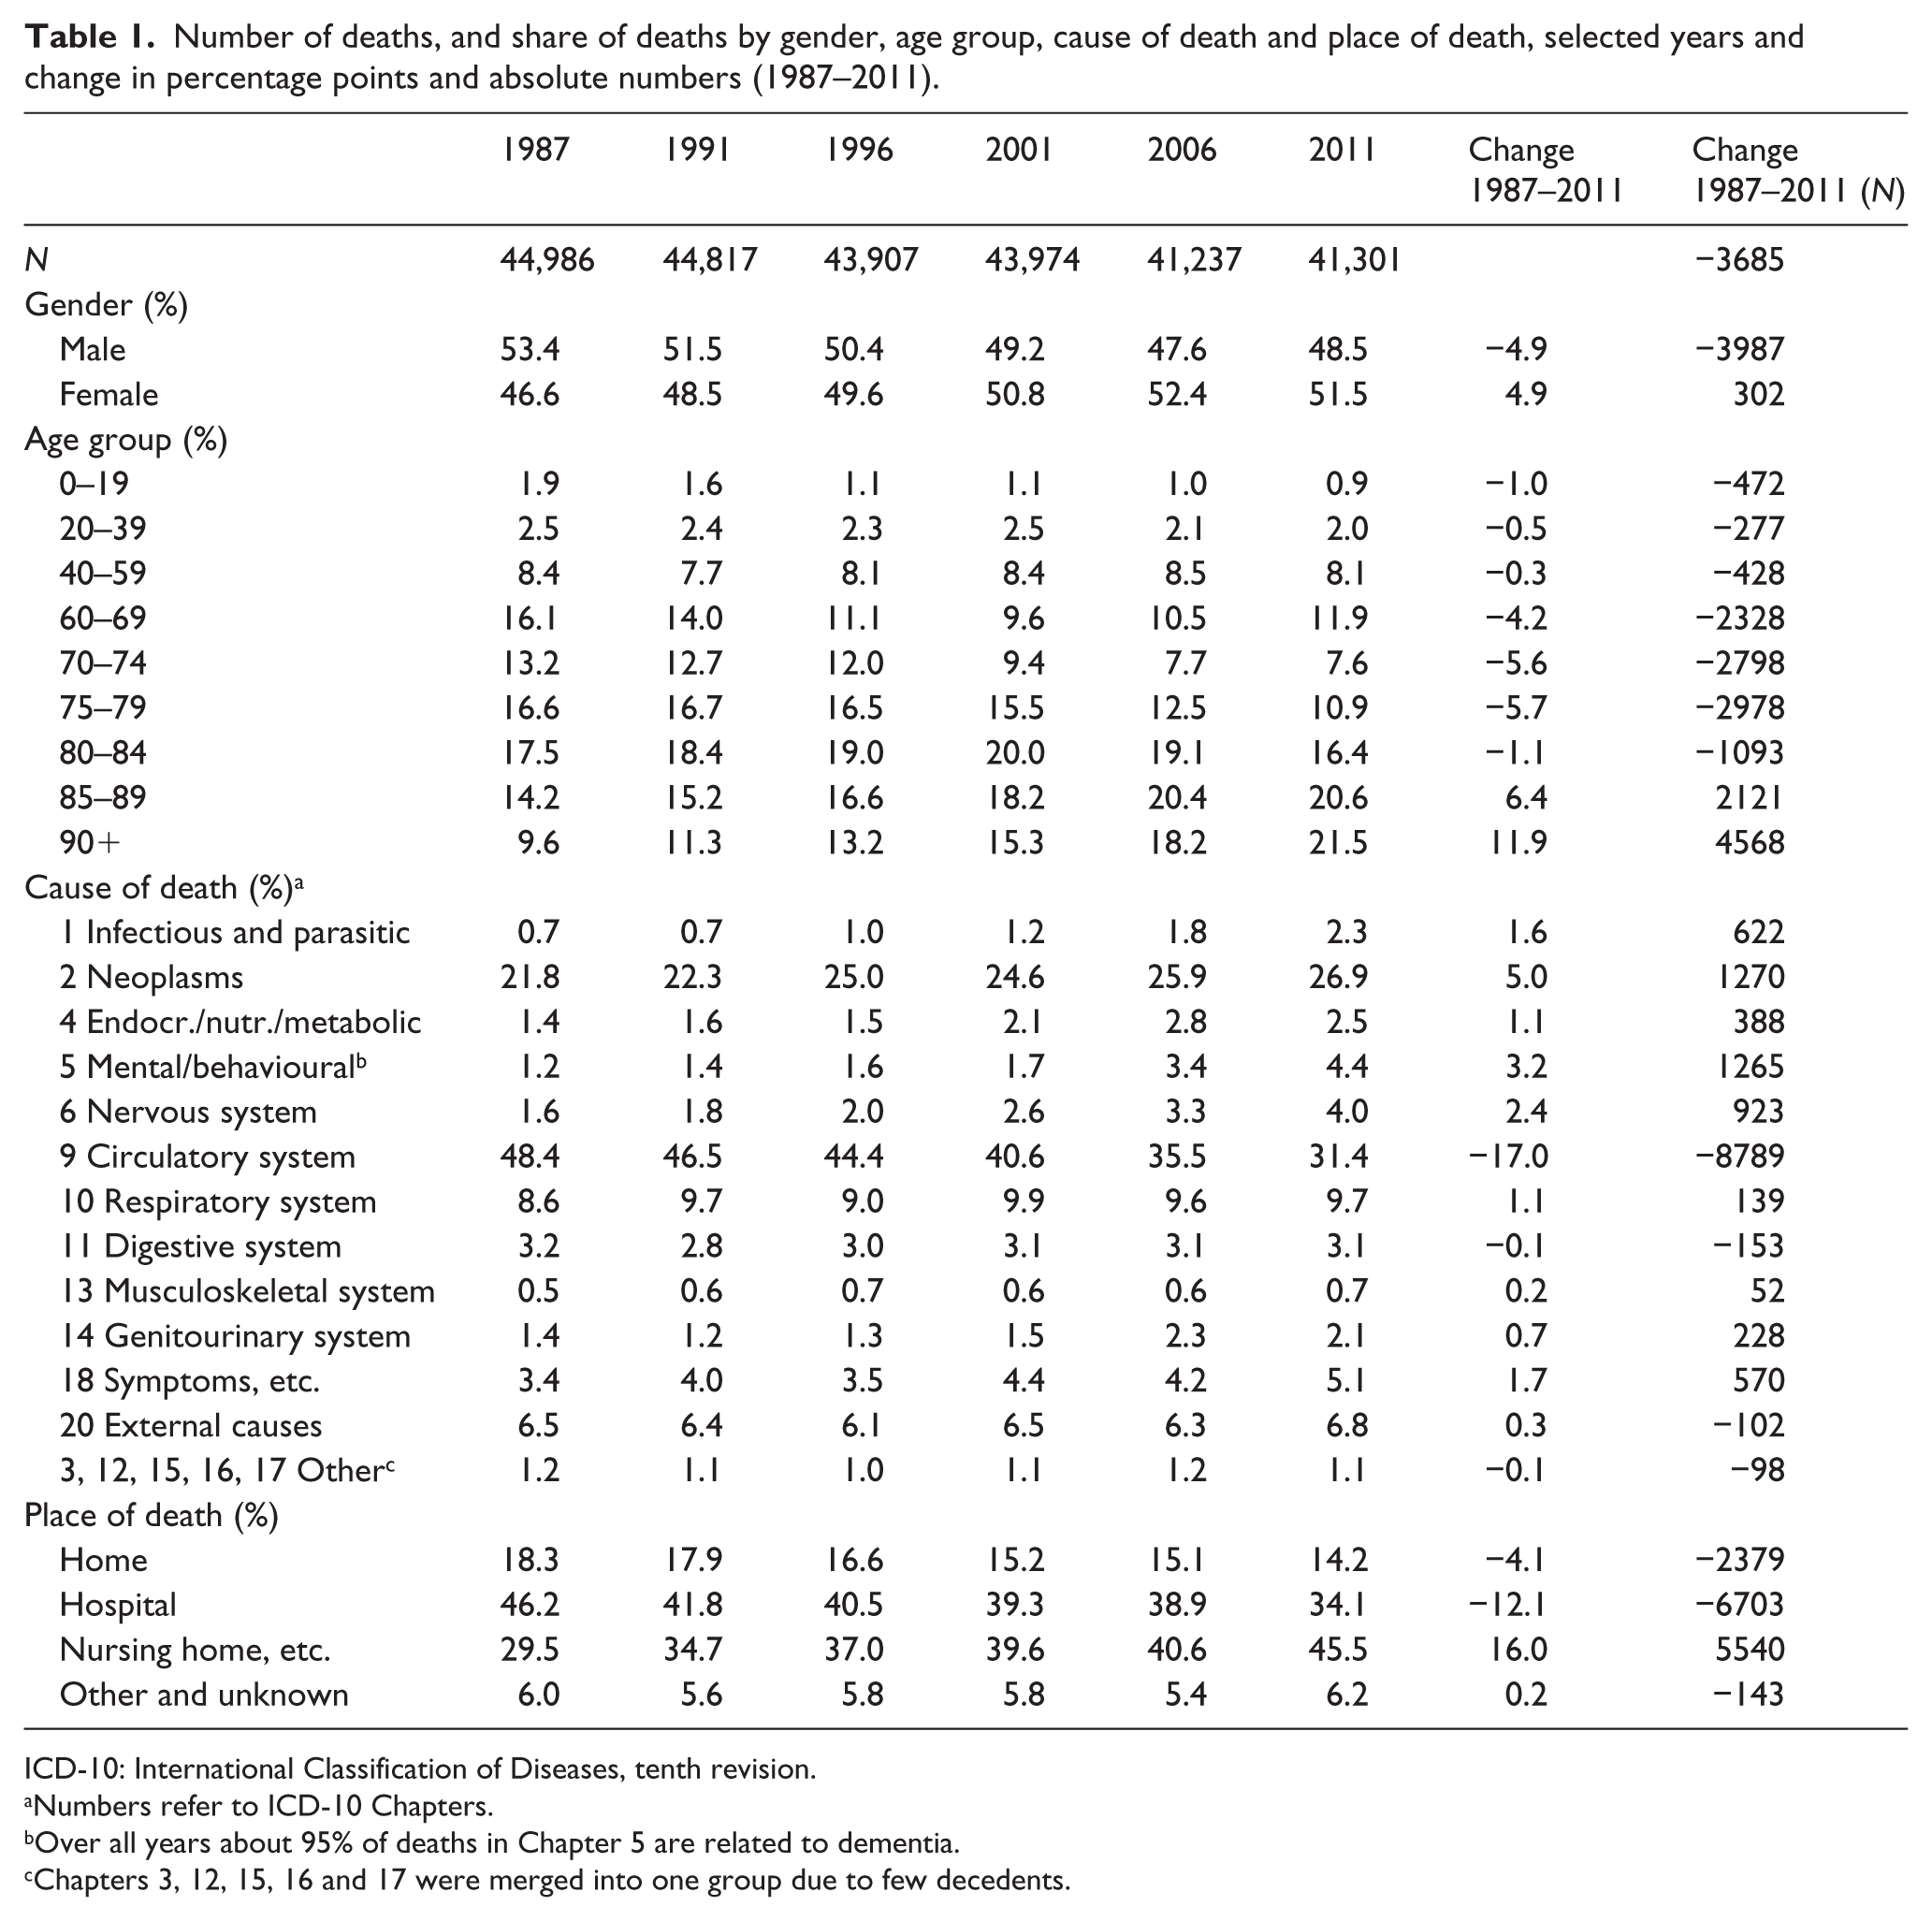
Fewer people died in hospitals (34.1% vs 46.2%) or at home (14.2% vs 18.3%), and more in nursing homes (45.5% vs 29.5%) in 2011 than in 1987. Much of the trend can be explained by demographic and epidemiological changes. Ageing of the population and the epidemiological shift represented by the declining share of deaths from circulatory diseases (31.4% vs 48.4%) compared to the increase in deaths from neoplasms (26.9% vs 21.8%) and mental/behavioural diseases (4.4% vs 1.2%) are the strongest drivers in the shift in place of death. Joinpoint regression shows important differences between categories.
Conclusion:
Demographic and epidemiological changes go a long way in explaining shifts in place of death. The analyses reveal substantial differences in trends between different decedent groups.
Keywords
There has been an increased focus on preferences for dying at home.
There is a worldwide ageing of population and in particular an increase in the number of the oldest old.
Home death is less likely and death in residential care settings is more likely with increasing age.
Highlighting the importance of demographic and epidemiological changes on place of death trends.
Population ageing and changing pattern of causes of death due to the huge reduction of deaths from circulatory diseases predict more than half of the 16 percentage point increase in the share of nursing home deaths during the 25-year study period.
Running counter to the international trend of home death, the observed trend for Norway is also driven by a shift towards nursing home as place of death for middle-aged and younger elderly and cancer deaths.
The continued ageing of population and huge expected rise in the prevalence of dementia worldwide pose a challenge to future end-of-life care.
The focus in improving end-of-life care should not be restricted to meeting the preferences of home deaths, but also on the quality of end-of-life care in residential care settings.
Introduction
Most Western countries have seen a change in the availability of institutional care during the 20th century, initially causing a decrease in home deaths, and an increase in hospital deaths. 1 The apex was reached in the late 20th and early 21st centuries,1–3 followed by an increasing trend of home deaths in, for instance, the United States, Canada and England.4–6 The shift in trend in these countries, and for some continental Western-European countries,7–9 also saw an increased proportion of deaths in other institutional settings. Despite the common wish of dying at home among the general population and those with terminal illness,4,10 generally more than half of all deaths occur in hospitals. 11
Where people die reflects the organisation of end-of-life (EOL) care and major demographic and epidemiological trends. Norway is a case where a large proportion of deaths have shifted from hospitals into nursing homes and other institutions. Our main focus was to find out how the numbers and composition of decedents had changed in Norway during the 1987–2011 period. The age and gender of decedents, what we term demographic factors, and what we here refer to as epidemiological factors – the main cause of death – is analysed in order to see how much of the overall change in pattern of place of death (PoD) they explain, and whether trends in PoD differ between these groups.
Methods
We obtained data on decedents’ year and PoD, age at death, gender, and main underlying cause of death from the Norwegian Cause of Death Registry covering all 1,091,303 deaths in Norway 1987–2011.
PoD was grouped into four categories: (1) hospital, (2) other health and care institution (hereafter referred to as ‘nursing home’), (3) home and (4) other setting and unknown. ‘Hospital’ includes all deaths in hospitals except those occurring in psychiatric departments. ‘Nursing homes’ includes all residential institutional deaths not included in the hospital category. Deaths in psychiatric institutions are also included here – constituting only 0.1% of the category in 2011 – since these were before 2002 inseparable from deaths in psychiatric nursing homes. Information on PoD was missing for less than 2.5% in any year.
Nine age groups recording age at death were constructed (0–19, 20–39, 40–59, 60–69, 70–74, 75–79, 80–84, 85–89, 90+ years). For underlying cause of death International Classification of Diseases, ninth revision (ICD-9) (1987–1995) was replaced with ICD-10 from 1996 onwards resulting in two fundamentally different coding structures without one-to-one conversion. Since translation is robust using main chapters of the ICD-10, cause of death was converted from ICD-9 following the ICD-10 chapters, using the European short-list for causes of death 12 taking into account the shift in main chapter grouping of acute intoxications. Combining gender, age groups and cause of death groups, a maximum of 234 groups can be constructed. Since some combinations were not present in the data, the number varied between 223 and 230 in the study period.
Our analysis had two main objectives. First, we wanted to distil the effects of changes in demography and epidemiology on PoD and compare these predicted trends with the observed trends. Second, and quite the opposite, we wanted to see how the trends in PoD would have looked like absent demographic and epidemiological changes and compare these with the observed trends.
The first objective was arrived at by predicting trends based on changes in demography and epidemiology only while holding PoD likelihood for each decedent group constant. Using the PoD rates for 1987 for each decedent category (combination of age, gender and cause of death) as vantage point, we applied these to the decedent categories for the consecutive years. Hence, these predictions – shown in Figure 1 – assume that the pattern of PoD was time-invariant for each decedent category. The closer the predicted trend in PoD is to the observed trend, the more changes are driven by changes in epidemiology and demographics (see also Supplementary Information (SI)).
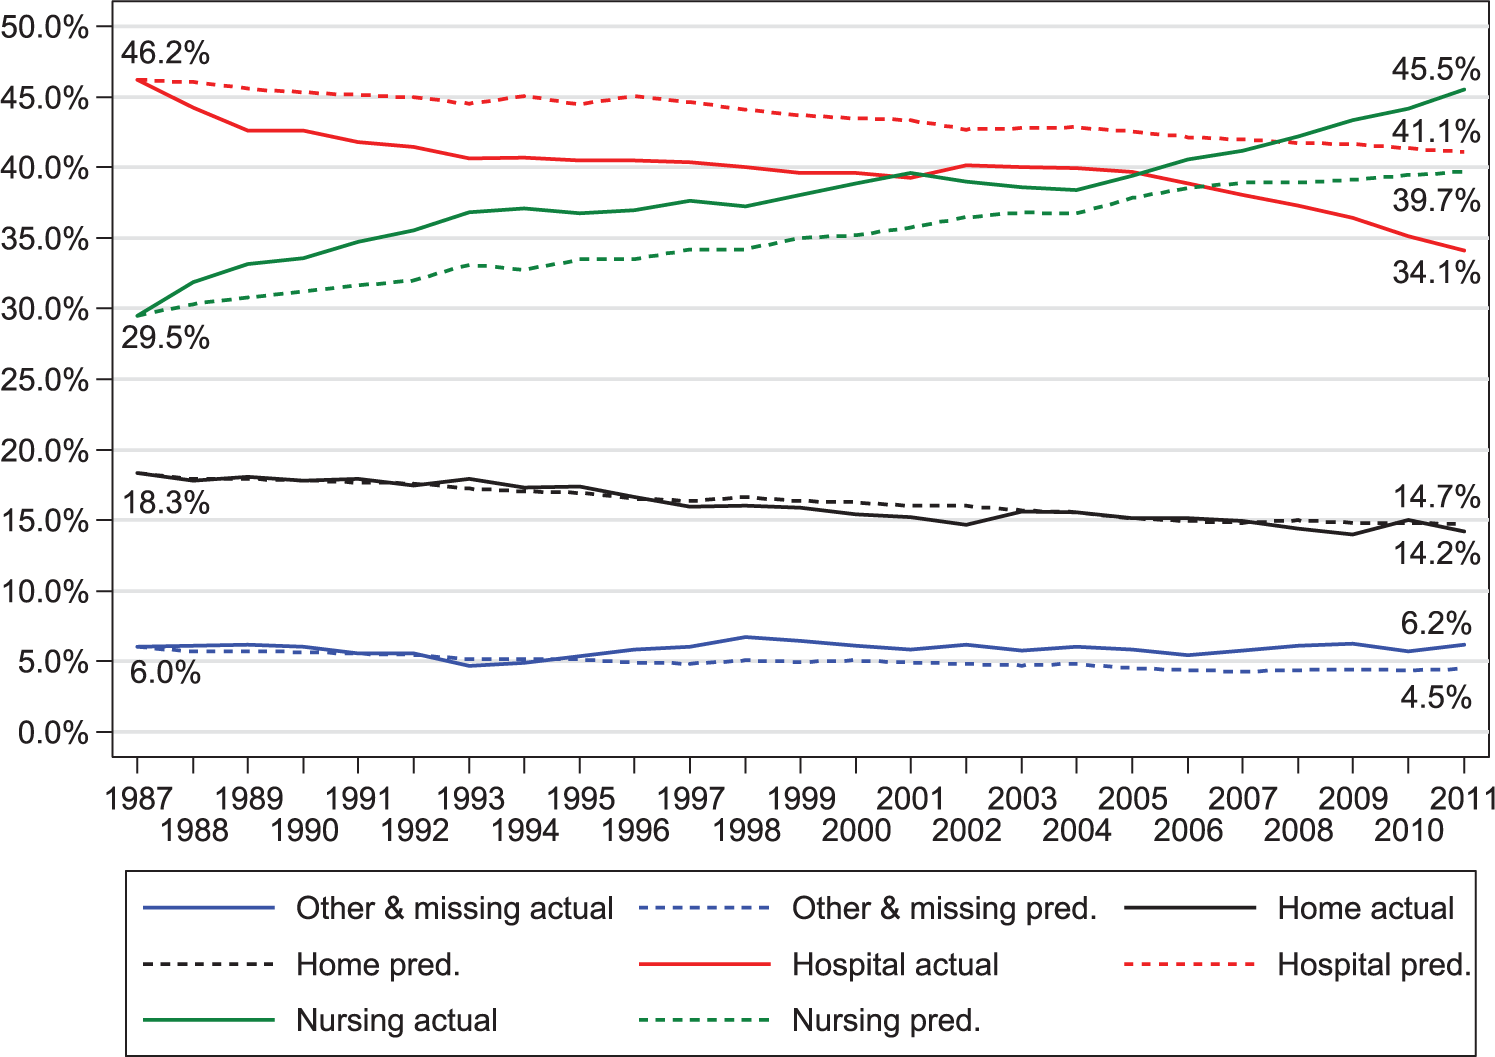
Actual and predicted place of death in percentages, 1987–2011.
By contrast, our second aim was to remove the effect of changing composition of decedents (morbidity, mortality and demographics) in order to detect changes due to policy (intended or not) and other non-deterministic causes. Hence, in the trend analyses (using joinpoint regression in Tables 2 and 3 and displaying trends in Figures 2 and 3), the number of deaths for each type of PoD was standardised using direct standardisation. Using 1987 as the base, we kept the distribution of total deaths by decedent category constant in the period and applied the actual proportions of PoD within each decedent group in each year to calculate standardised PoD proportions (see also SI). Trends in PoD by age and cause of death, respectively, are illustrated in Figures 2 and 3 and contrasted to actual proportions. The closer the observed and standardised proportions, the more the trends are influenced by changing patterns of PoD within decedent groups. Conversely, larger differences reflect more influence from changes in decedent age–gender–cause of death composition on PoD. The standardised trends are also analysed using joinpoint regression, 13 testing whether a multi-segmented time line significantly (p = 0.05) better fits data than one straight trend line (see also SI), allowing us to test whether apparent shifts in trends in PoD represent statistically significant shifts. The analysis was performed using the Joinpoint Regression Program, Version 4.2.0.2. 14
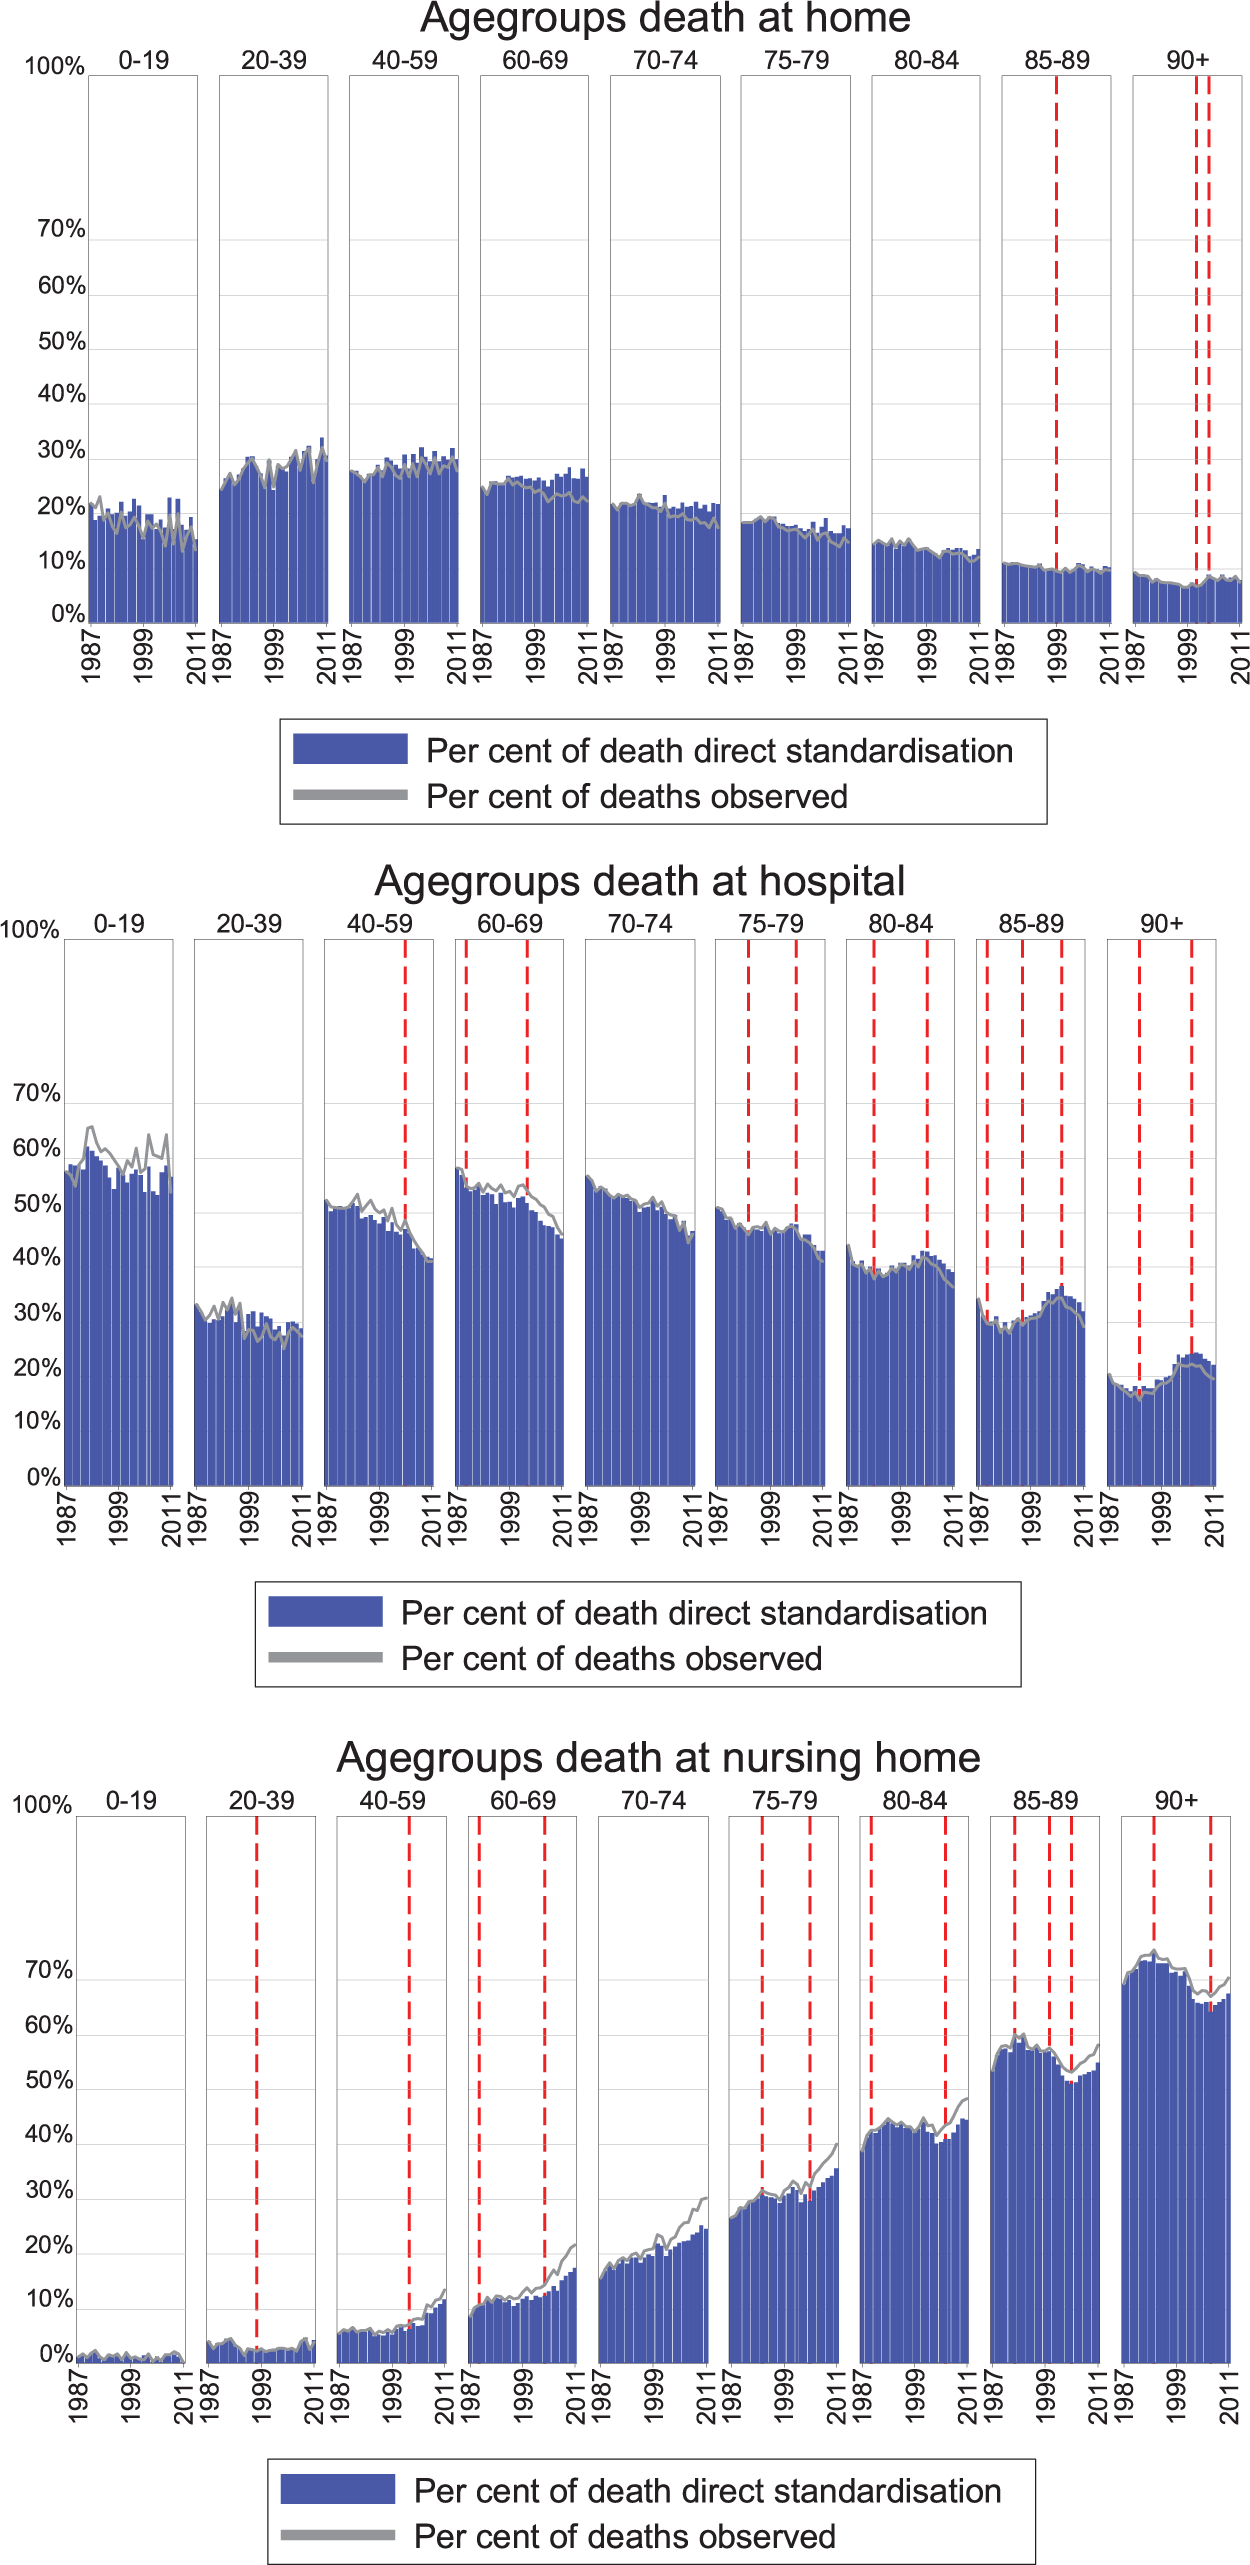
Place of death, per cent by age group, actual and standardised rates, 1987–2011.
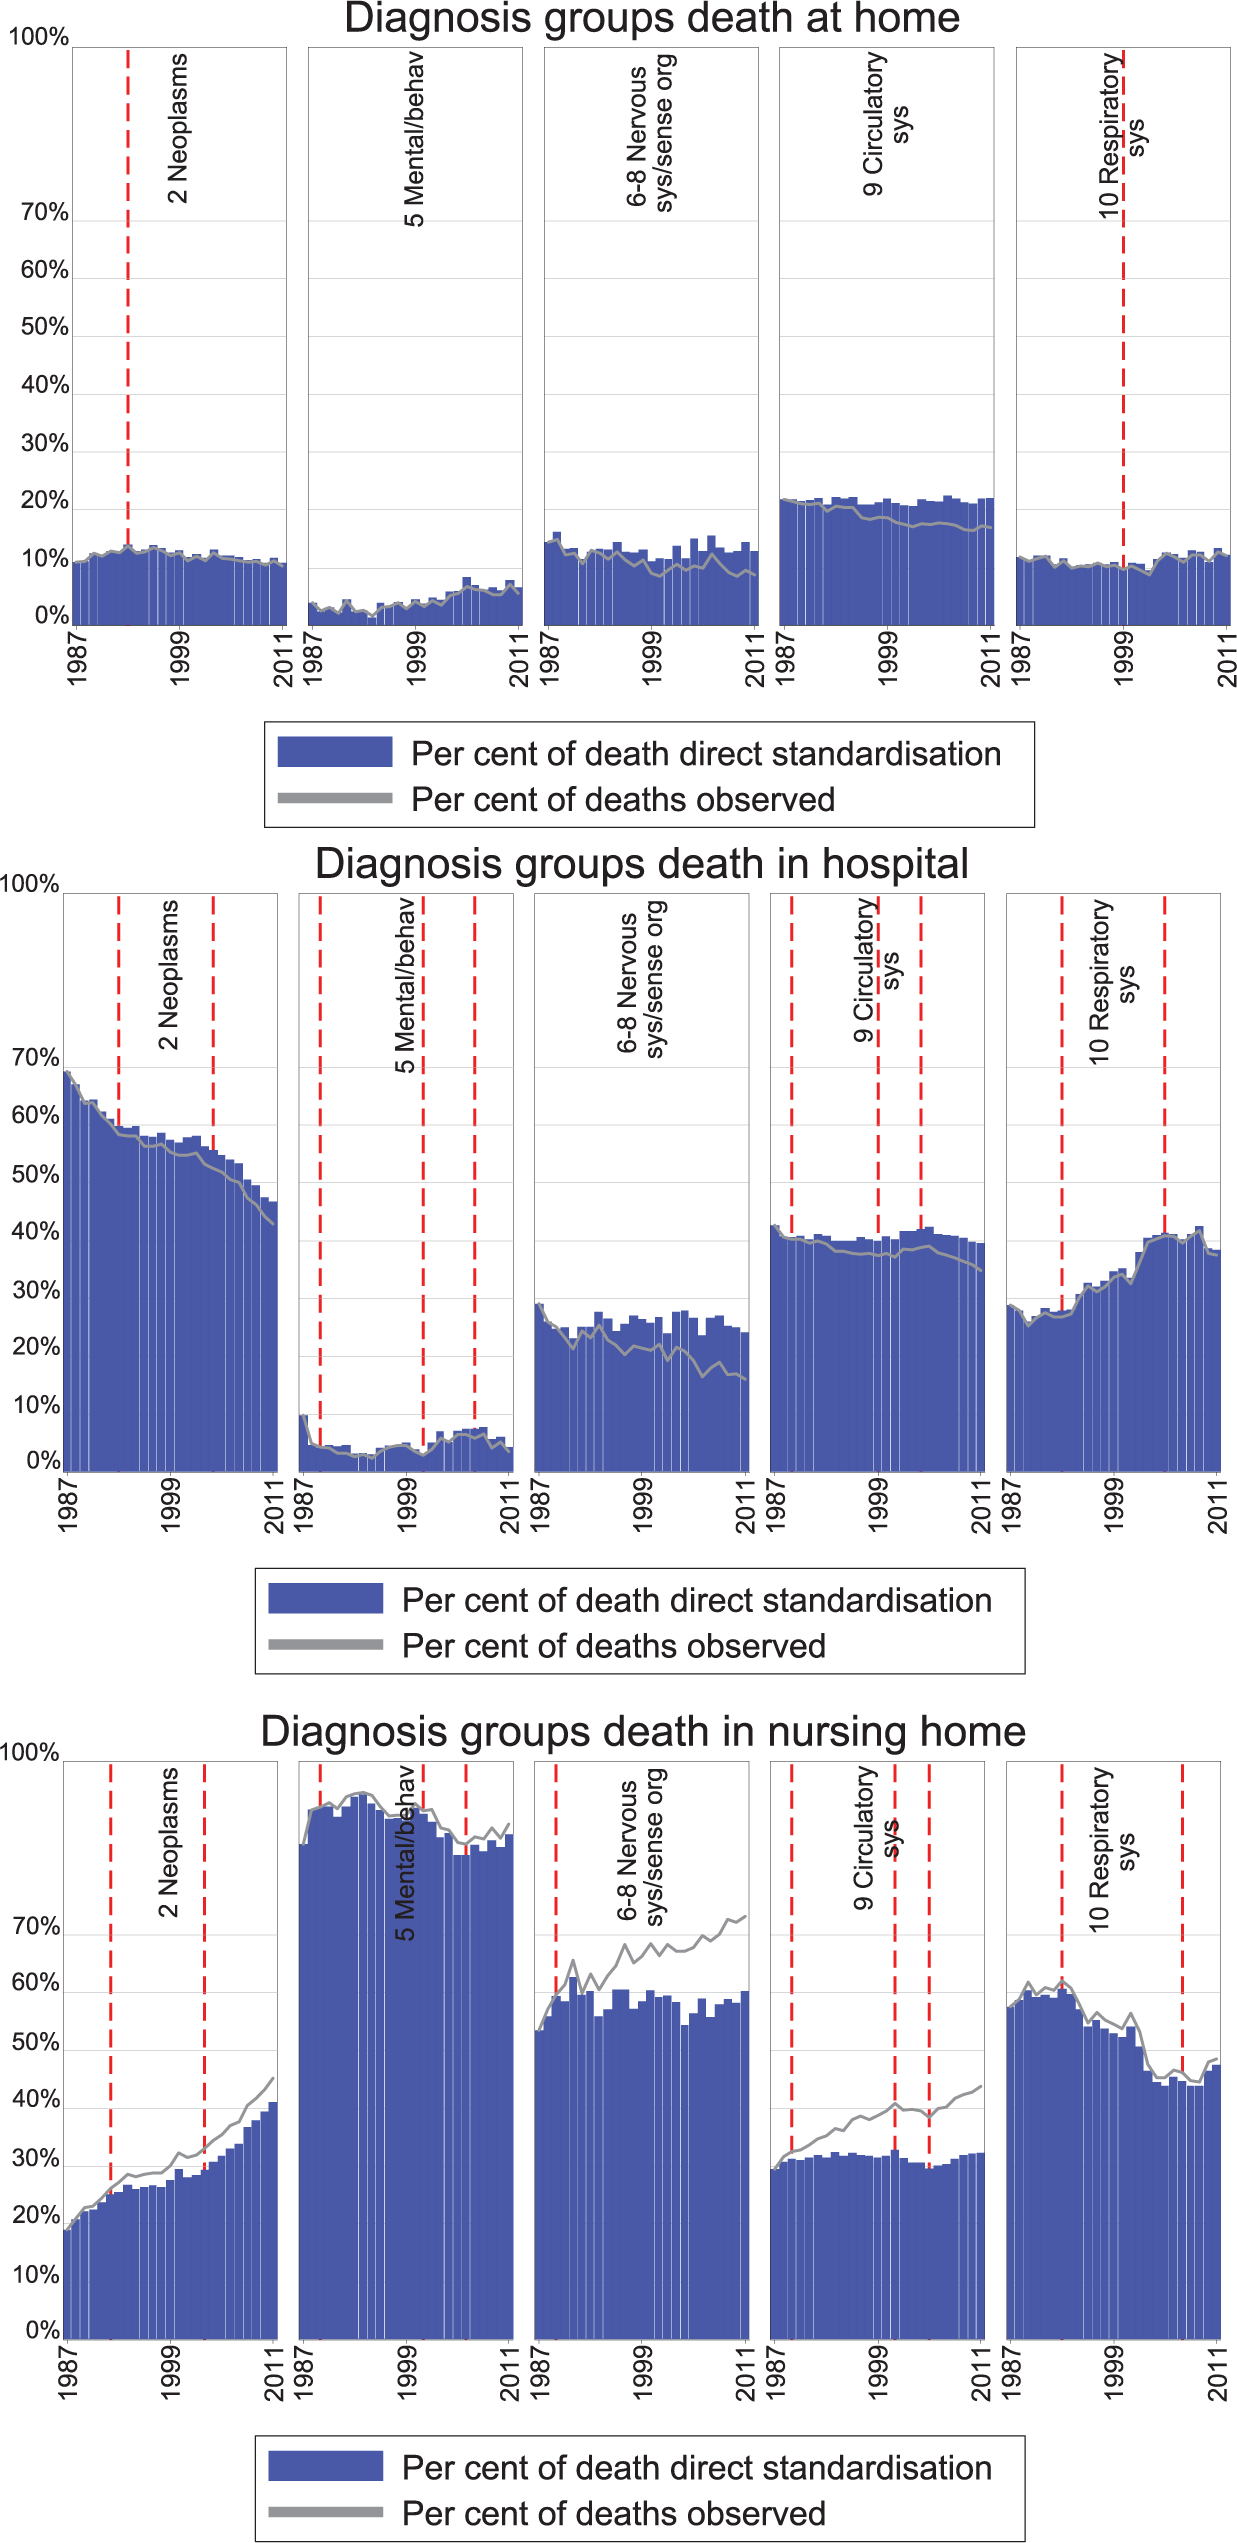
Place of death, per cent by selected death causes, actual and standardised rates, 1987–2011.
Results
Overall
The total number of deaths in Norway decreased from about 45,000 in 1987 to 41,301 in 2011 and the composition of decedents changed substantially (Table 1). Figure 1 shows the predicted trends in PoD only accounting for demographic and epidemiological changes (dotted lines) compared with observed trends in PoD (solid lines), demonstrating that the reduction in home deaths can almost completely be predicted by the change in the composition of decedents. Likewise, a substantial part of the reduction in hospital deaths (5.1 of the 12.1 percentage point reduction from 1987 to 2011) and the increasing fraction dying in nursing homes (10.3 of the 16 percentage points increase) can be predicted by changing composition of age, gender and cause of death.
Number of deaths, and share of deaths by gender, age group, cause of death and place of death, selected years and change in percentage points and absolute numbers (1987–2011).
ICD-10: International Classification of Diseases, tenth revision.
Numbers refer to ICD-10 Chapters.
Over all years about 95% of deaths in Chapter 5 are related to dementia.
Chapters 3, 12, 15, 16 and 17 were merged into one group due to few decedents.
Table 2 displays how much the estimated proportion (measured in percentage points) in PoD changes annually for each PoD and whether this is significantly different from zero. These slopes are based on a joinpoint regression analysis of directly standardised proportions in PoD. Overall, there is little evidence of a trend in the standardised rate of home deaths, as the slope is a mere −0.01% per year and indistinguishable from zero. Hospital deaths have an initially strong decrease in −1.43 percentage points annually, followed by a decade (1989–1999) of weak decrease, and an increase around the turn of the century, followed by a downward trend again from the mid-2000s. The pattern is comparable for men and women, except for that the temporary upward trend starts earlier for women (1998 vs 2001). The trends of proportion of deaths occurring in nursing homes are roughly the converse of hospital deaths, that is, increasing at the beginning and end of the period.
Joinpoint regression of trends in the share of deaths by gender and age groups (standardised), 1987–2011.
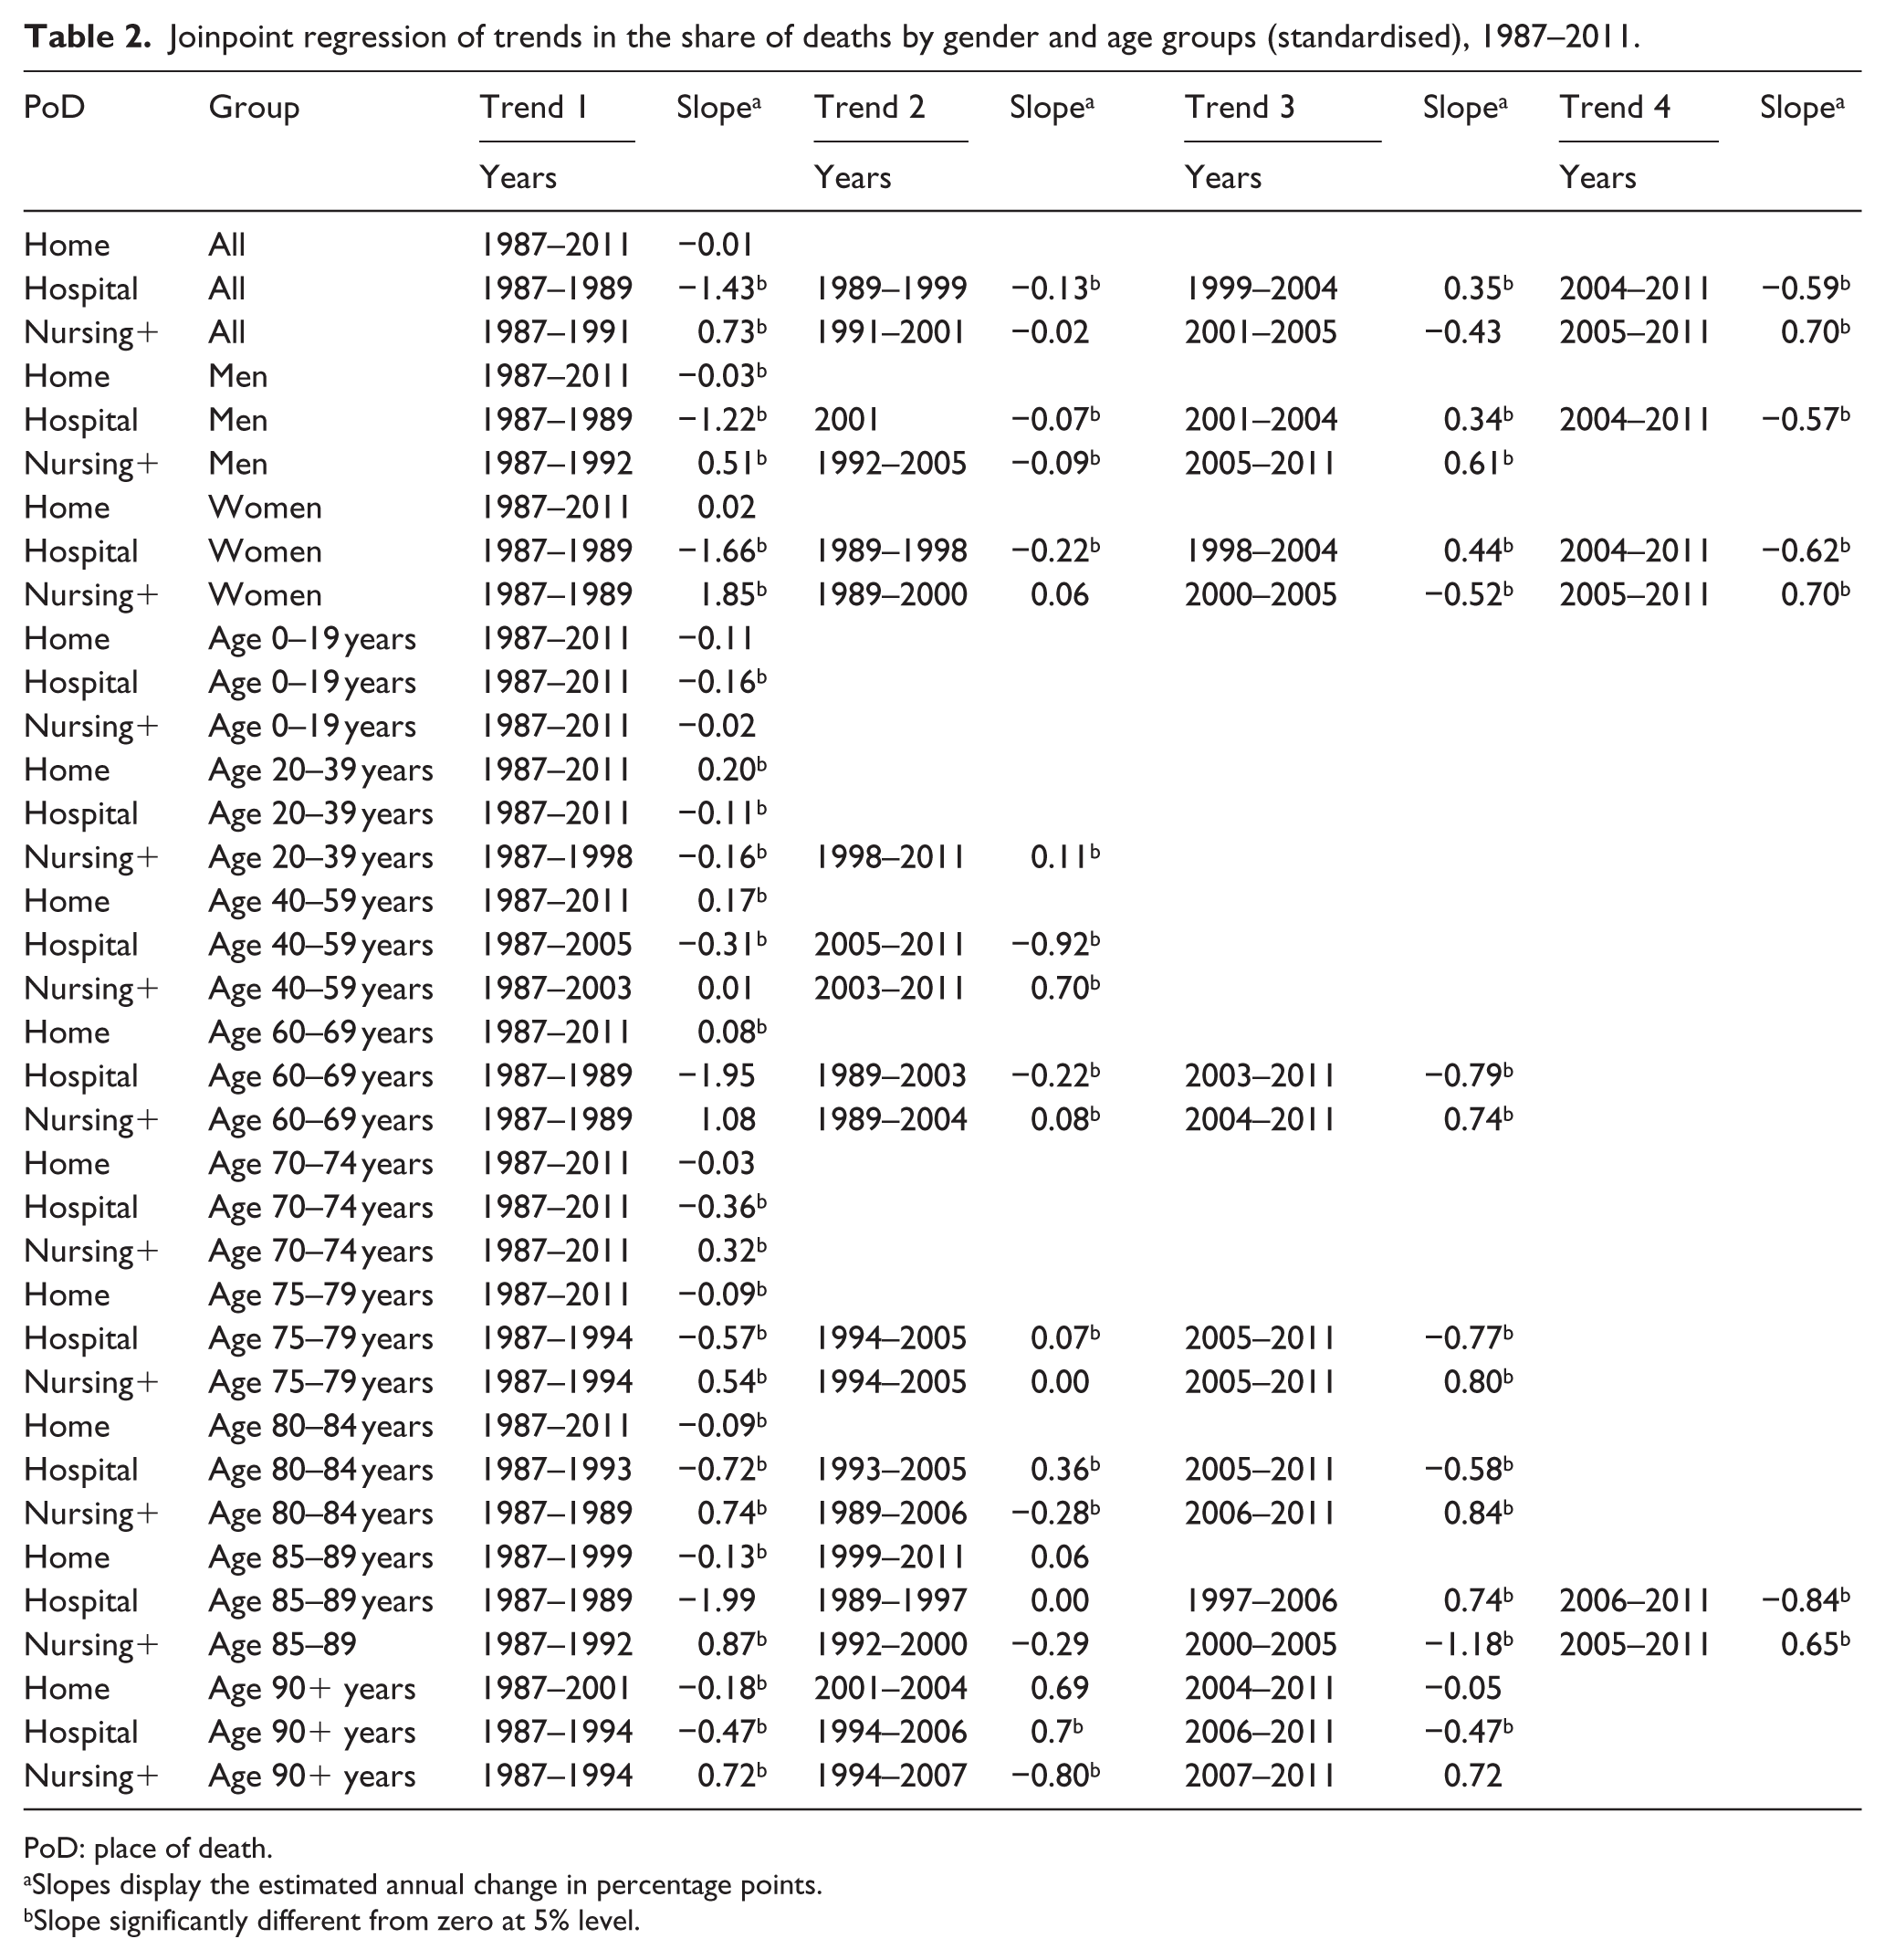
PoD: place of death.
Slopes display the estimated annual change in percentage points.
Slope significantly different from zero at 5% level.
Age
The proportion of home deaths is highest, and has a positive standardised trend, in the age groups between 20 and 69 years (Figure 2 and Table 2). The older age groups (above 75 years) die less at home, and decreasingly so over time. For the two oldest age groups (85+ years), the decrease holds only for the earliest years (before 1999/2001).
The proportion of hospital deaths is low for ages between 20 and 39 years, is higher for those up until 80 years and then decreases with higher ages. The peak of hospital deaths is reached in younger ages for women compared to men (not shown). For age groups below 75 years, a downward trend for hospital deaths is found for the entire period. Figure 2 shows that the temporarily overall upward trend in hospital deaths for the early 2000s largely reflects the trend among the elderly (75+ years).
The proportion of deaths in nursing homes increases with age. Trends in deaths in nursing homes among the younger age groups are less distinct compared to hospital deaths, but increases for all age groups between 20 and 69 years in the last part of the period. For those 80+ years, trends for nursing home deaths are largely the converse of the trends in hospital deaths: positive trends at the start of the period replaced by negative trends in the middle period and positive trends in the last 5–7 years.
For most age groups, the actual development of PoD is relatively close to the development in the standardised pattern of PoD, reflecting changing patterns of PoD within age groups. The difference increased towards the end of the period for some groups, which indicates a more pronounced change in composition of cause of death and gender within the age group.
Cause
Diseases of the circulatory system accounted for nearly half of all deaths in 1987, but just above 30% in 2011 (Table 1 and Figure 3). Deaths increased for most other groups, particularly neoplasms (+1270); mental and behavioural diseases (+1265), (mainly dementia) and diseases of the nervous system (+923) (mainly Alzheimer). We focus on these four decedent causes in addition to respiratory diseases, which constitutes the third largest decedent category.
Figure 3 and Table 3 show that the largest decrease in the standardised proportion of hospital deaths, and the largest increase in the proportion of nursing home deaths, was found for cancer, however, with a somewhat weaker trend in the middle period. A positive trend for home deaths for cancer in the first few years shifted to a weak negative trend for the remainder of the period.
Joinpoint regression of trends in the of share deaths by main cause of death (standardised), 1987–2011.
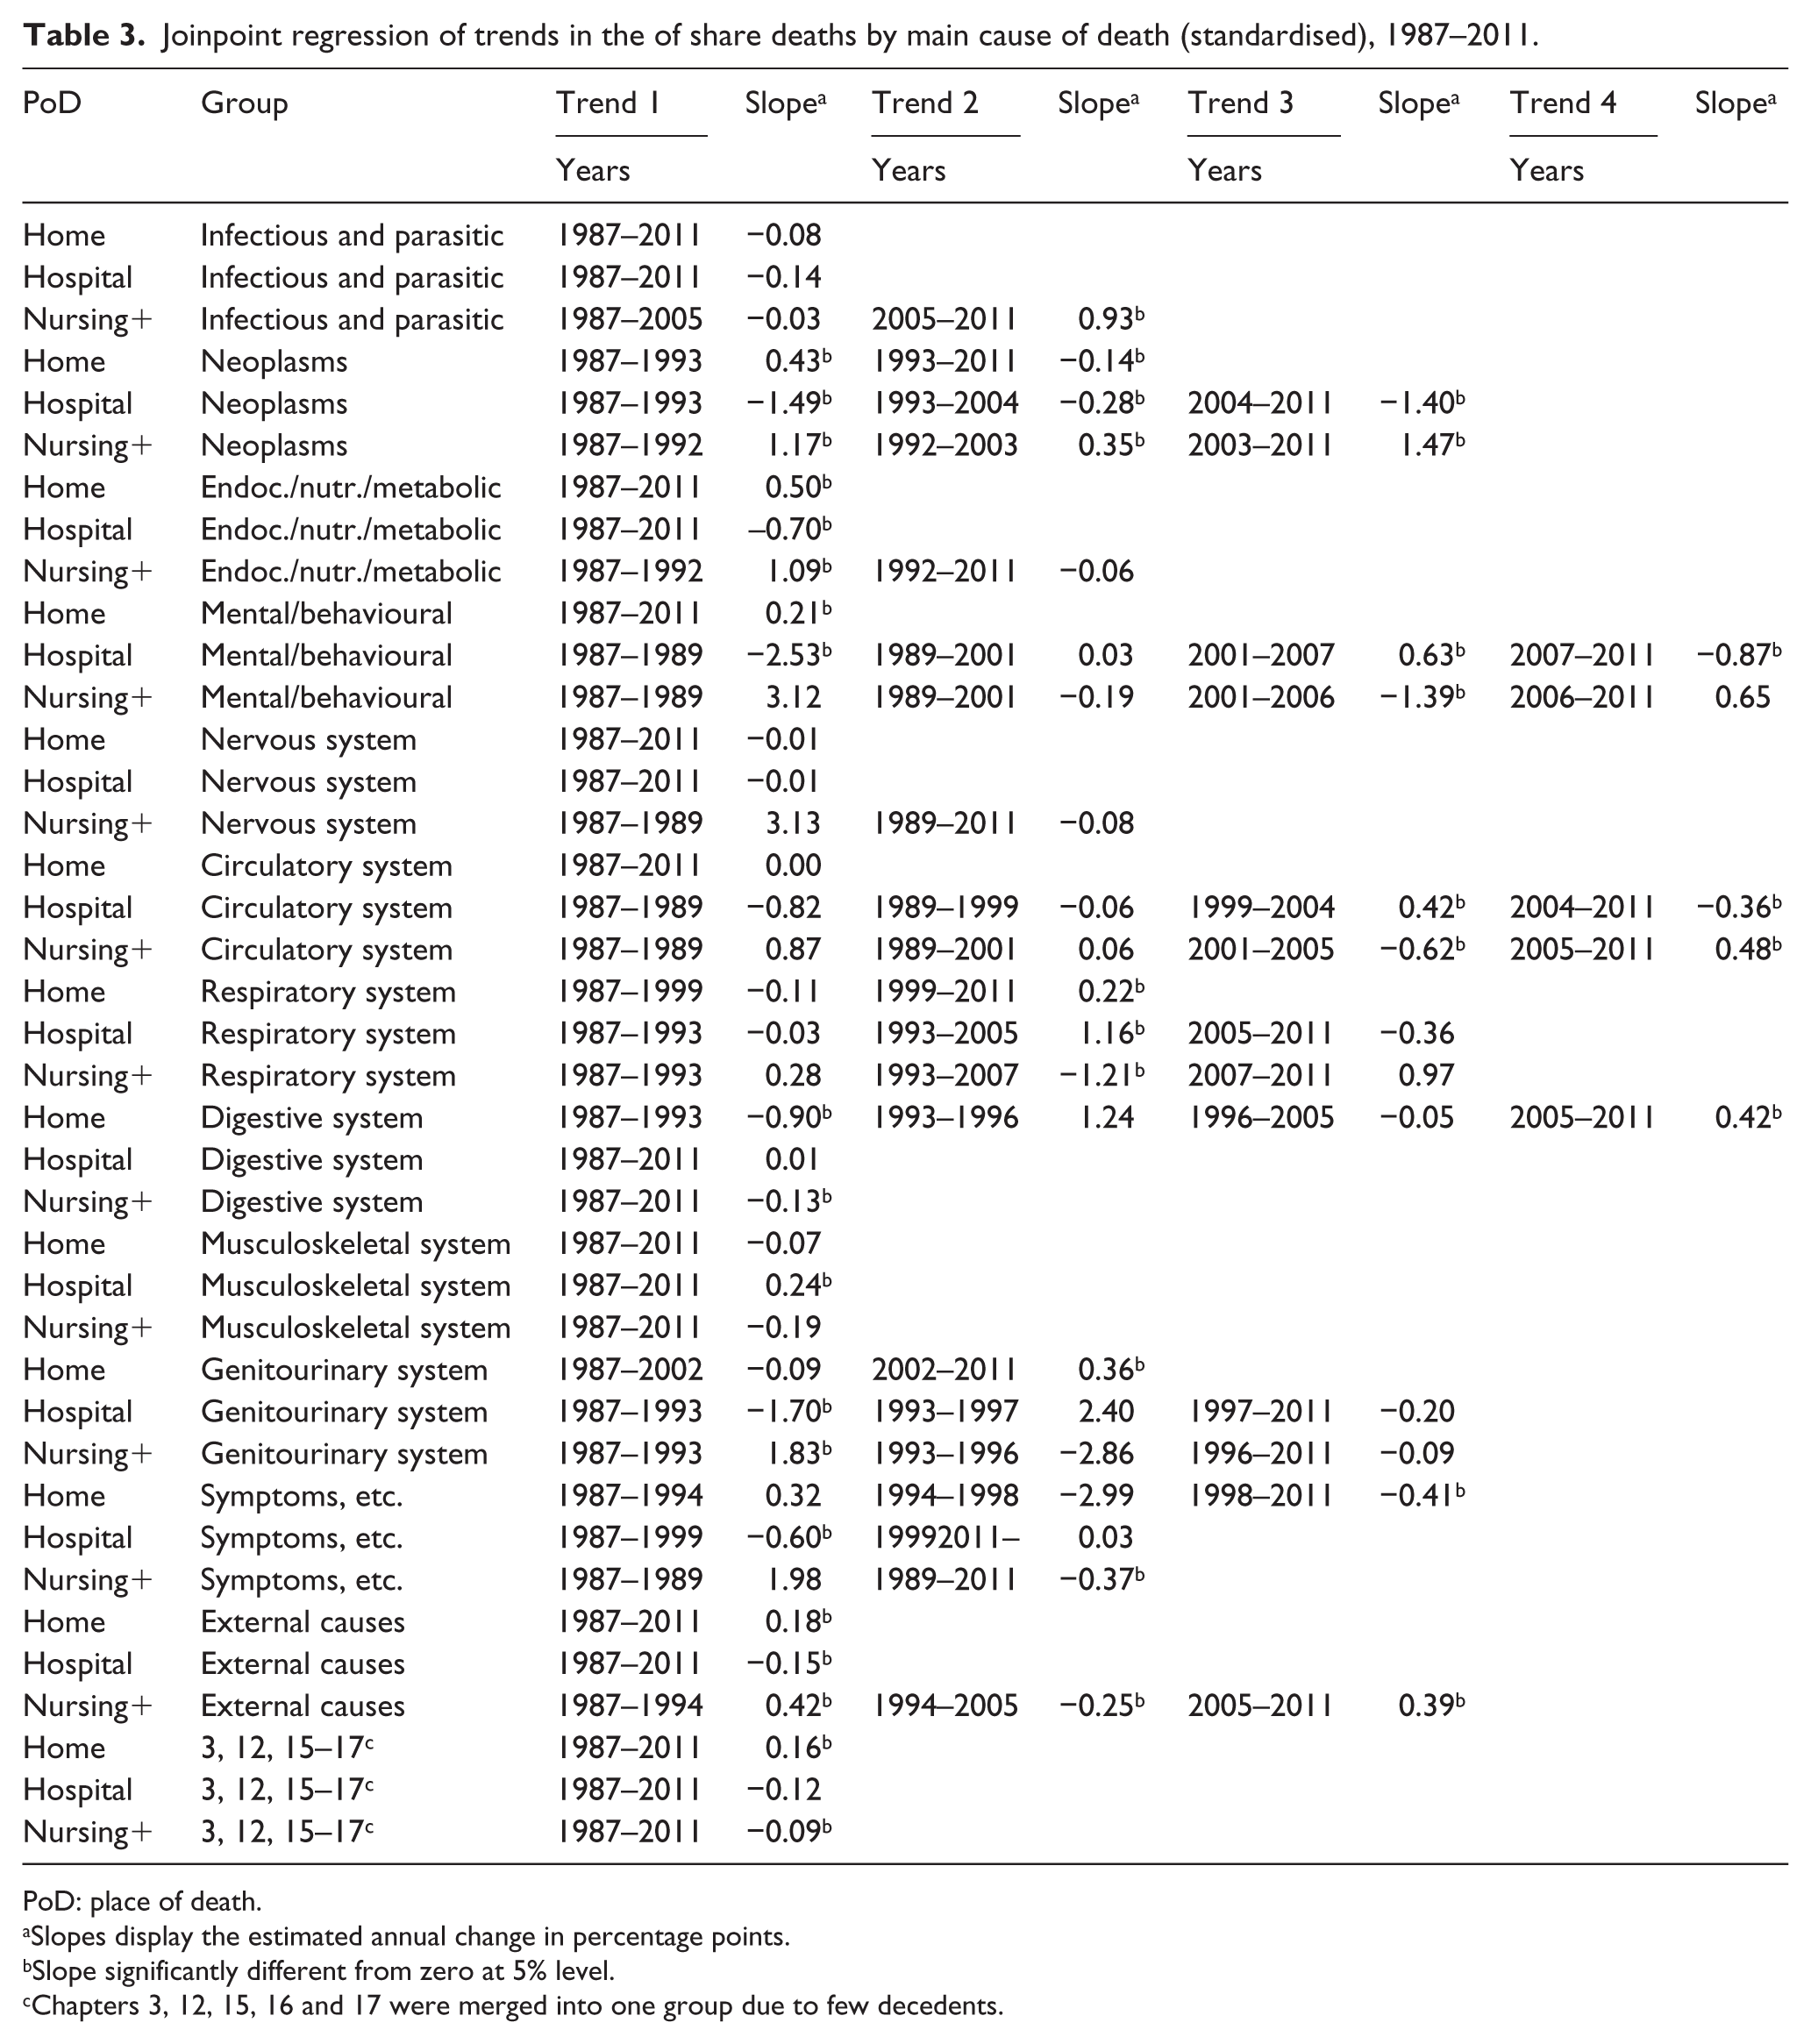
PoD: place of death.
Slopes display the estimated annual change in percentage points.
Slope significantly different from zero at 5% level.
Chapters 3, 12, 15, 16 and 17 were merged into one group due to few decedents.
Persons dying of dementia have the highest propensity to die in nursing homes. Shifting trends were identified for nursing home and hospital deaths, and a weak positive trend was found for home deaths. The other main group capturing geriatric cause of death – diseases of the nervous system – displayed little trends in standardised patterns of PoD.
For the biggest decedent category – diseases of the circulatory system – some minor and shifting trends were identified; however, overall the standardised proportion of PoD was quite stable. For diseases of the respiratory system, a substantial increasing trend for hospital and a negative trend for nursing home deaths were found from the mid-1990s to the mid-2000s.
The difference between standardised and actual PoD proportions is small for cancer and minimal for dementia, and respiratory diseases, implying that the trends are not caused by changes in the demographic composition of decedents, but due to other changes. There was a substantial shift in the observed PoD from home and hospital to nursing home deaths for diseases of the circulatory system and diseases of the nervous system not found for the standardised proportion, indicating a change in the demographic composition of decedents.
Discussion
During the 25-year study-period PoD changed markedly in Norway, from 46.2% of deaths taking place in hospitals in 1987 to 45.5% in nursing homes in 2011. This could be related to changes in the number and composition of decedents as well as policy-driven and other changes in EOL care. During the study period, the mortality rate decreased by more than 20%, 15 and the cause of and age at death changed considerably contributing to a substantial shift in the composition of decedents. Deaths from diseases of the circulatory system dropped with 40%. The 60% fall in age-standardised death rate for diseases of the circulatory system from 1987 to 2011 was within the range of 40%–70% in West-European countries. 16 Moreover, the composition effect (age and gender) was particularly pronounced for circulatory diseases. Increased survival among middle-aged and young elderly, leads to people dying from diseases of the circulatory system living longer, being more often female, and consequently having a higher likelihood of dying in nursing homes.8,11,17–20 Moreover, increased longevity ‘shifts’ deaths from circulatory diseases into increasingly cancer and diseases like dementia and Alzheimer. The proportion of nursing home deaths increases with age, is highest for women and is high for age-related diseases such as dementia and Alzheimer’s. Changes in these non-policy factors contributed to the shift in PoD observed in Norway.
The shift in PoD from hospital to nursing homes also partly reflects changing patterns of PoD within decedent groups. The joinpoint analysis revealed that the trend towards nursing home deaths was particularly clear for middle-aged and younger elderly (40–75/80 years) and for cancer deaths. This reflects a policy change in the use of nursing homes replacing hospitals as setting for EOL care for cancer patients and some other patient groups. Palliative units in hospitals and mobile palliative teams, providing support and guidance to municipal services (home based and nursing home care), has been introduced. Likewise, palliative facilities have been established in nursing homes in some municipalities; supporting networks involving a majority of municipalities have been established; and cancer coordinators are present in about half of the municipalities. 21 Patients are frequently transferred from hospital to municipal services for EOL care. However, most nursing home deaths take place in non-palliative beds. The municipalities also vary in their capacity to support home deaths. 21
For some groups, for example, respiratory diseases and deaths among old people, a counter-trend was found for the middle period (mid-1990s to mid-2000s). This probably reflects several push and pull factors at work during the study period. This was a period with substantial changes and major reforms in the healthcare services in Norway, with a shift in municipal long-term care (LTC) towards more home-based services and a major reduction in places in institutional old-age homes, 22 causing fewer old people to live in residential care, thus reducing the likelihood of dying there. Simultaneously, several reforms took place in the hospital sector. While introducing partly activity-based financing in 1997 boosted hospital admissions, their average length has declined.
Norway in comparison
A shift in PoD from hospitals to nursing homes has been observed for most other countries,5,7–9,19,23–25 but not all. 26 Like in Norway, this is likely to partly be a result of population ageing.
Norway ranks high in the proportion of nursing home deaths,11,27 but has a quite low and declining proportion of home deaths. This runs counter to observed trends for, for example, United States 5 and to the recent development in England and Wales (2004–2010), 4 but is in accordance with a recent study from South-West Scotland. 25 The decline in home deaths could be predicted by the change in age–gender and cause of death composition of decedents. However, subgroups of decedents display different and even opposing trends.
A previous study comparing six European countries, found Norway to differ from the others, by having a lower rate of home deaths for cancer than other diseases. 28 This study shows that while there was a positive trend for home deaths for cancer in Norway until 1993, this was reversed for the remaining period. However, these trends were moderate and the proportions of home deaths for cancer have been low during the entire period. A study of trends in PoD for cancer in England found a downward trend for age- and gender-adjusted deaths at home until 2003 when the trend shifted upwards. 29 This coincided with a programme aimed at promoting good practice EOL care enabling more people to die at a place of their choice, usually at home or in hospice. The policy for palliative care in Norway as formulated in Official Norwegian Reports in the late 1990s30,31 has been to integrate and strengthen the care in existing care systems, with an emphasis on care provided close to home. The need for strengthening the capacity and quality of EOL care in nursing homes has therefore been emphasised. 32
Country differences in PoD can partly be explained by healthcare resources. 33 Cohen et al. 34 found that the availability of LTC beds to be more important for differences in PoD among six European countries than availability of hospital beds. Damiani et al. 35 analysed patterns of LTC in 29 European countries, and grouped Norway, Sweden, Iceland, the Netherlands and Belgium as countries with a strong alignment between old-age-related expenditure and elderly needs as well as a high level of formal LTC. These are countries with high proportions of deaths in LTC settings.11,18 Country differences in the pattern of PoD, and general elderly care, are likely to reflect cultural differences in the role of family versus formal care. Preferences for formal care are particularly strong in the Nordic countries and the Netherlands. 36
Ageing is likely to affect PoD in other countries
The world population is ageing. In developed countries, the number of oldest old will continue to grow rapidly. The proportion of people 80+ years in Europe is expected to increase from 3% in 2000, to 5.2% in 2025 and to 10% in 2050. 37 The likelihood of nursing home death is especially high for people with dementia.38,39 The prevalence of dementia worldwide is expected to nearly double every 20 years from about 35 million in 2010 to 115 million in 2050.40,41
Strengths and limitations
We believe we are the first to study the dynamics of four alternative PoDs for Norway. By separating the effect of demographic and epidemiological changes on decedent composition from the shift of PoD within decedent groups, we arrive at the driving forces behind the trend in PoD during the 25-year period 1987–2011 in Norway.
Three limitations are pertinent. First, PoD does not necessarily reflect place of terminal care: a person may have been cared for at home or in nursing home before being transferred to another institution in the final phase of life. However, the proportion of nursing home deaths increased more than what could be predicted by changing decedent composition, reflecting a more important role of nursing homes in EOL care. Second, we do not account for multiple causes of death which make home deaths less likely. 25 Finally, the changes in ICD-coding systems could influence trends, but this is more of a problem in converting between earlier versions of the ICD. 42 Moreover, no breaks in the joinpoint regression are found in 1996, the year of conversion.
Conclusion
The analysis of the Norwegian data indicates that more than half of the increase in the proportion of nursing home deaths could be predicted by changes in decedent composition over the 25-year period.
Although the overall trend has been a shift from hospital to nursing home deaths, our analysis shows shifting standardised trends in PoD during the 25-year study period as well as diverging trends for different age and causes of death groups. Cancer deaths is a large and growing decedent group, where the trend towards nursing home death was apparent throughout the study period, most likely reflecting a deliberate EOL policy, but also increased pressure on municipal services from decreasing length of stay in hospitals.
Footnotes
Acknowledgements
We thank the Norwegian Cause of Death Registry at the Norwegian Institute of Public Health for providing us with the data on death causes and place of death, and two anonymous reviewers and colleagues at SINTEF department of Health Research for valuable comments.
Declaration of conflicting interests
The author(s) declared no potential conflicts of interest with respect to the research, authorship and/or publication of this article.
Ethical approval
Ethical approval was obtained from the Regional Committee for Medical and Health Research Ethics for central Norway, approval number 2012/852. Informed consent was not possible.
Funding
The author(s) disclosed receipt of the following financial support for the research, authorship and/or publication of this article: This work was supported by the Research Council of Norway (project ‘Utilization of health care services at the end of life’ grant number 214298).