
Abstract
Objective
We aimed to develop and standardise a practical systematic screening tool for visual perception impairments after a stroke to replace current subjective methods.
Design
A mixed methods study including a cross-sectional study and a case series.
Setting
In the community and on stroke rehabilitation units.
Participants
Older volunteers without a neurological history contributed to normative data. Patients with ocular conditions or a stroke took part in our case series.
Instrument
The Oxford Visual Perception Screen.
Main measures
For each task of the Oxford Visual Perception Screen, we determined 5th centile cut-off scores. We further explored effects of age, visual acuity and gender on visual perception through generalised linear models.
Results
Oxford Visual Perception Screen is a 15-min paper-and-pen assessment comprising 10 tasks including picture naming, star counting and reading. Normative data of 107 participants demonstrated persistent high performance with most cut-offs near ceiling. Apart from the Figure Copy (Z = 6.57, p < 0.001) and Global Shape Perception task (Z = 3.32, p < 0.001) we found no evidence for an effect of visual acuity on OxVPS. An effect of age was only observed in the Face Recognition (Z = 3.61, p < 0.001) and Reading task (Z = −3.50, p < 0.001). No effects of gender were observed. A series of eight cases illustrates the interpretation of OxVPS.
Conclusion
We present the Oxford Visual Perception Screen, a standardised visual perception screening tool alongside normative data and illustrative cases. The Oxford Visual Perception Screen can potentially change screening for visual perception impairments in clinical practice and is available at https://oxvps.webspace.durham.ac.uk/.
Introduction
Visual perception is the dynamic process of perceiving the environment through sensory inputs and translating the sensory input into meaningful concepts. 1 Although visual perceptual problems are highly common, 2 assessment of visual perception problems after stroke is challenging. Existing visual perception test batteries take at least 45 min to complete3,4 making them unsuitable for systematically screening all stroke survivors in time- and resource-poor acute settings, 5 and who themselves often present with fatigue 6 and impaired sustained attention. 7 In addition, current instruments require considerable training in administration and interpretation,3,8 making them less accessible to healthcare professionals. Therefore, healthcare professionals typically rely on patients' self-reports and observations.9,10 Because the sensitivity of any screening tool is significantly lowered when patients are unable to report their symptoms, many impairments may currently be missed. 11
The Oxford Visual Perception Screen was developed to meet the need for a quick, easy to administer, standardised assessment that is suitable for stroke survivors. To support content and face validity, the selection of which visual perceptual impairments to screen for was guided by expert consensus based on a Delphi study 12 and further informed by a recent survey with healthcare professionals. 9 The selection of tasks to be included was guided by psychometric properties and by health professionals’ opinions (to maximise adoption) and practicality of tasks. The format and layout of the Oxford Visual Perception Screen was inspired by the successful Oxford Cognitive Screen, 13 which also maximises the accessibility of the tasks for stroke survivors by being inclusive for those with unilateral weakness affecting their hand, communication difficulties, visual neglect, and fatigue.
Iterative drafts of the Oxford Visual Perception Screen were reviewed by internationally recognised experts in neuropsychology research, health professionals, healthy volunteers, and stroke survivors. Over 30 iterations of improvements resulted in the current version of the Oxford Visual Perception Screen, designed to be a practical and acceptable screening tool. The Oxford Visual Perception Screen is available to download on https://oxvps.webspace.durham.ac.uk/.
Here we report a normative study to establish cut-off scores for normal performance on OxVPS and illustrate the interpretation of OxVPS through a case series.
Methods
Participants were included in the normative study if they were neurologically healthy, adult and English-speaking. Exclusion criteria for all participants were psychiatric conditions affecting their daily life and a history of neurological conditions with potential long-lasting effects. People who reported mild depression or anxiety controlled by medication, who experienced a transient ischaemic attack or headaches were not excluded.
For our case series, we included stroke survivors who had demonstrated visual perceptual difficulties in the Rivermead Perceptual Assessment Battery. 14 In addition, we included participants without a stroke but with self-reported ocular conditions. Exclusion criteria were the same as above.
Participants were recruited through social media (Facebook and Twitter), our research group's participant pool of healthy older volunteers, care homes, through social groups for people of an older age, and at stroke rehabilitation units.
All participants provided written informed consent. All procedures were reviewed by the Psychology Ethics Committee at Durham University or the Health Research Authority Derby Research Ethics Committee and were given a favourable opinion (reference numbers PSYCH-2022-01-19T13_53_52 and 23/EM/0086).
Following Crawford's recommendations, we established that a normative sample of 100 participants would enable us to calculate the 5th percentile with a 95% confidence interval ranging from the 2nd to 8th percentile. 15
Data were collected between May 2023 and January 2024 by student research assistants in the participant's location of choice such as their home, their room in a care home, in a stroke rehabilitation unit, community halls, or at a research lab at Durham University. All locations were in County Durham, Surrey, and North Yorkshire, countries in England in the United Kingdom of Great Britain and Northern Ireland.
The Oxford Visual Perception Screen is a 15-min screening tool in paper format which briefly assesses visual perception including object recognition, face recognition, reading, eye-hand coordination (visuo-constructive skills) as well as visuospatial neglect, and more. Across ten disparate tasks, patients are asked to recognise objects, faces, read a short paragraph, select targets, and draw a geometrical figure. Except for the drawing, cancellation, and reading task, all tasks are multiple choice (overcoming expressive communication issues), images are presented vertically (avoiding confounds due to visual neglect), and patients can respond with pointing gestures with their unaffected hand (in case of any upper-limb weakness). The test results indicate which visual perceptual problems are likely present in a patient. A total score indicates the extent of the visual perceptual problems.
An overview of the ten tasks of the Oxford Visual Perception Screen and impairments is given in Table 1. Further details are available in the Oxford Visual Perception Screen manual. 16 The Oxford Visual Perception Screen is freely available to download for non-commercial use at https://oxvps.webspace.durham.ac.uk/.
Description of tasks of the Oxford Visual Perception Screen (version 2.1).
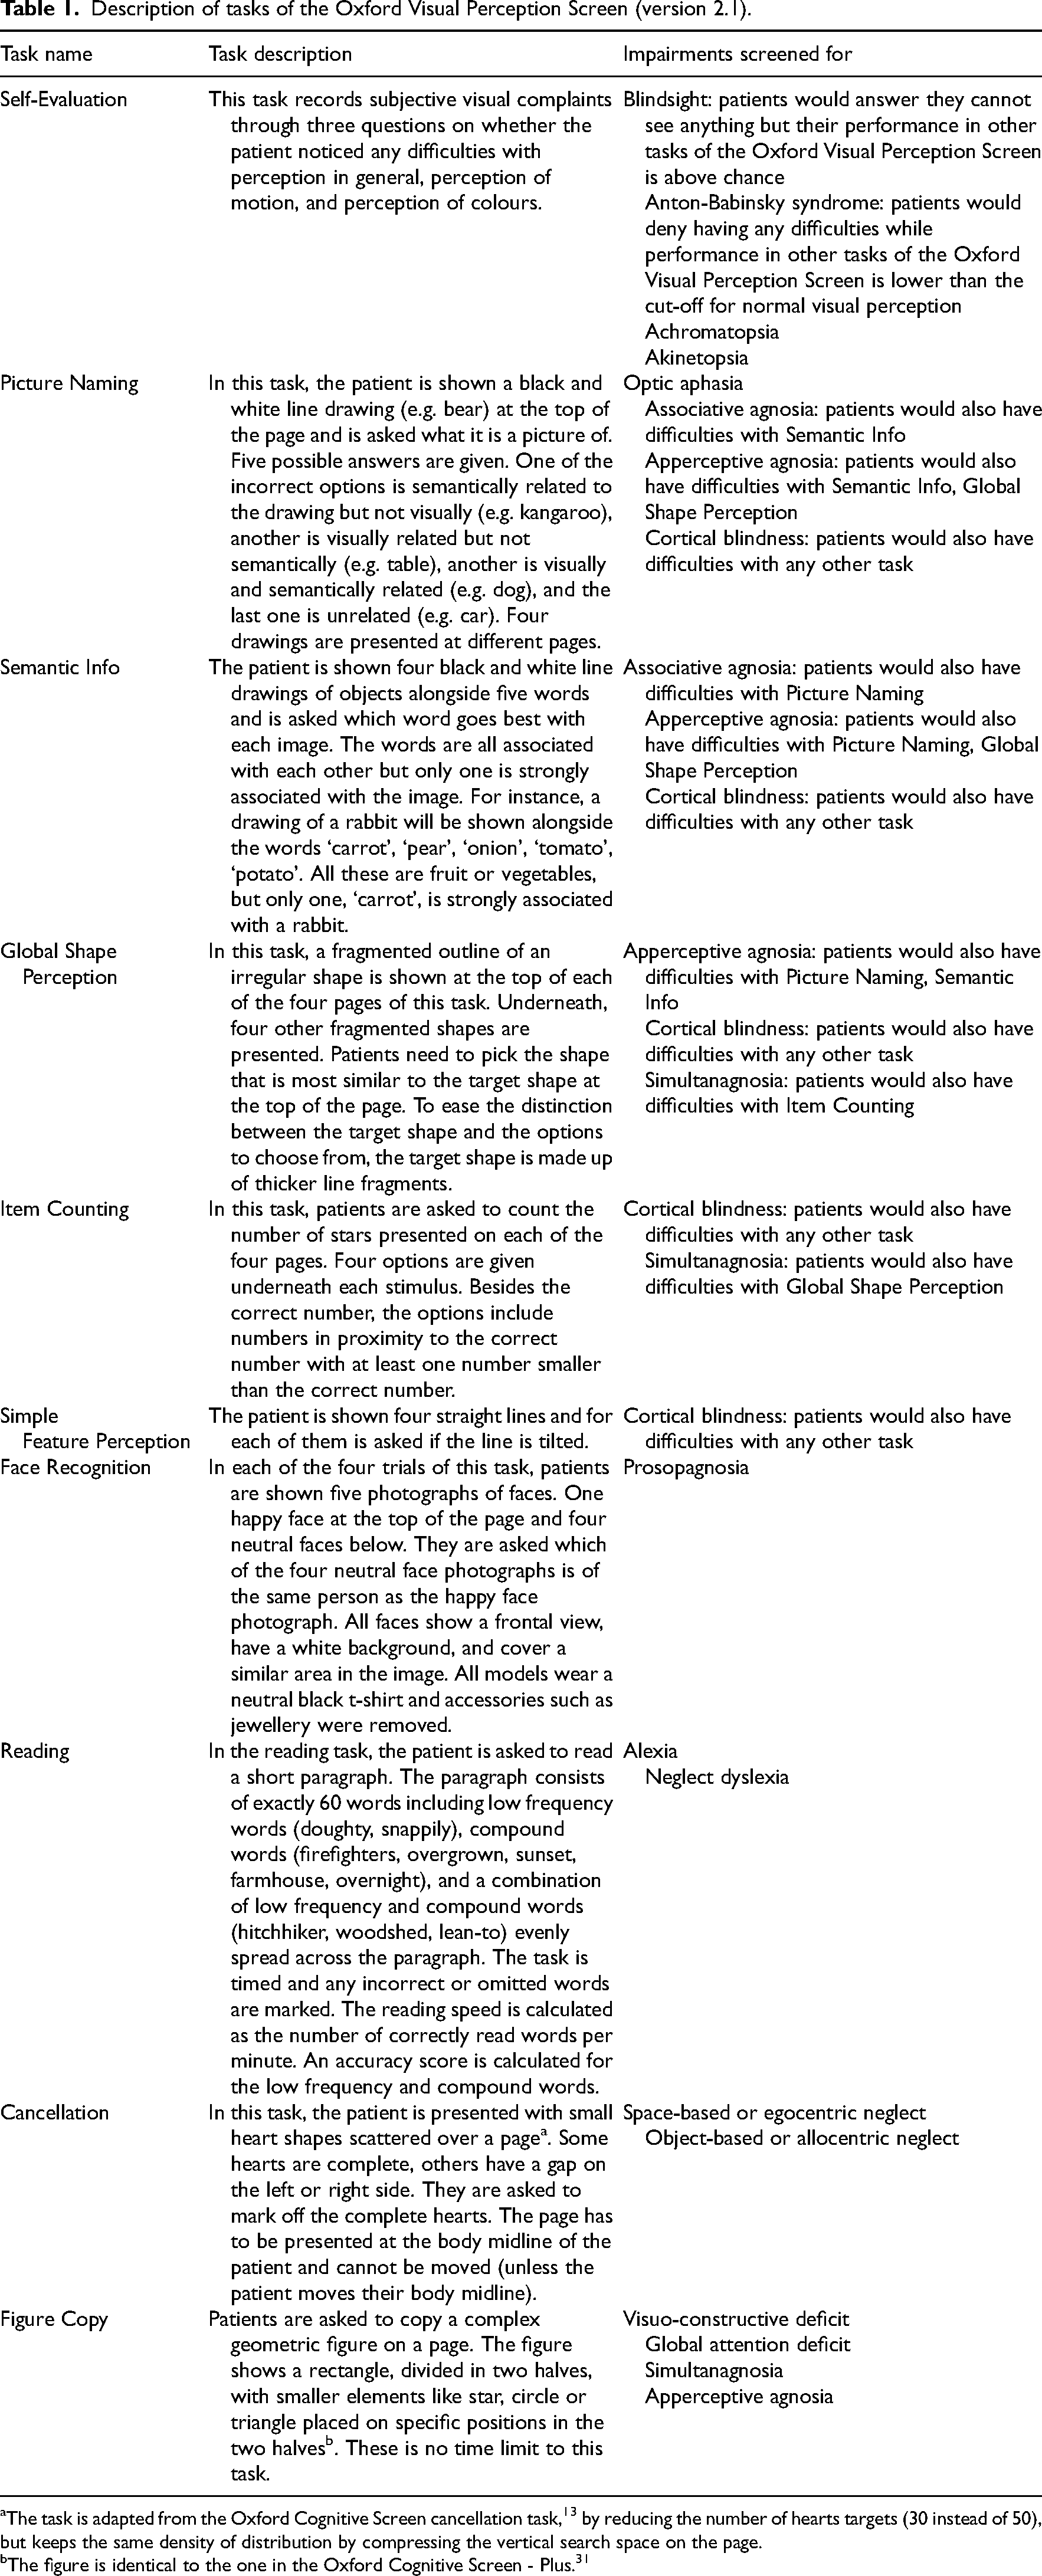
The task is adapted from the Oxford Cognitive Screen cancellation task, 13 by reducing the number of hearts targets (30 instead of 50), but keeps the same density of distribution by compressing the vertical search space on the page.
The figure is identical to the one in the Oxford Cognitive Screen - Plus. 31
Participants were instructed to wear their habitual correction for a viewing distance of 30–40 cm. We used version 2.1 of the Oxford Visual Perception Screen. Participants could take as much time as needed for each task. They were encouraged to guess on multiple choice questions and were allowed to correct their answers. For each task of the Oxford Visual Perception Screen, a score was calculated as described in the manual.
Acuity was assessed with the LogMar Double Sided Near Vision Card/EDTRS chart a standardised assessment for near visual acuity. 17 Acuity was defined as the print size for which at least 50% of the letters can be read correctly. 18
Demographic information and medical information to check exclusion criteria and to describe the sample was requested through a short health questionnaire.
Descriptive statistics on demographic variables were calculated to characterise the sample. The performance on each task of the Oxford Visual Perception Screen was summarised by the median, interquartile range, 5th, and 10th centile. Sensitivity analyses were performed to investigate the effects of age, gender, and visual acuity on scores through Generalised Linear Models. For tasks with a negatively skewed distribution of scores (i.e. all scores but reading speed and asymmetry scores), the observed scores were transformed by subtracting them from the perfect score on the task and modelled with a Poisson link function in a Generalised Linear Model. Scores on other tasks were modelled with an Identity link function. A Bonferroni correction for multiple comparisons was used and the significance level was adjusted to 0.0015 to reflect a family-wise error rate of 0.05. Missing data were not replaced.
Results
All 108 normative group participants completed the Oxford Visual Perception Screen and a near visual acuity test; one participant was excluded because of a neurological condition. Data of all remaining 107 participants was included and analysed. The median duration of a session was 20 min with an interquartile range from 16 to 27 min. The distribution of ages in our normative sample is similar to the distribution of ages in stroke patients 19 as can be viewed in Figure 1. Further details of all 107 participants are reported in Table 2.
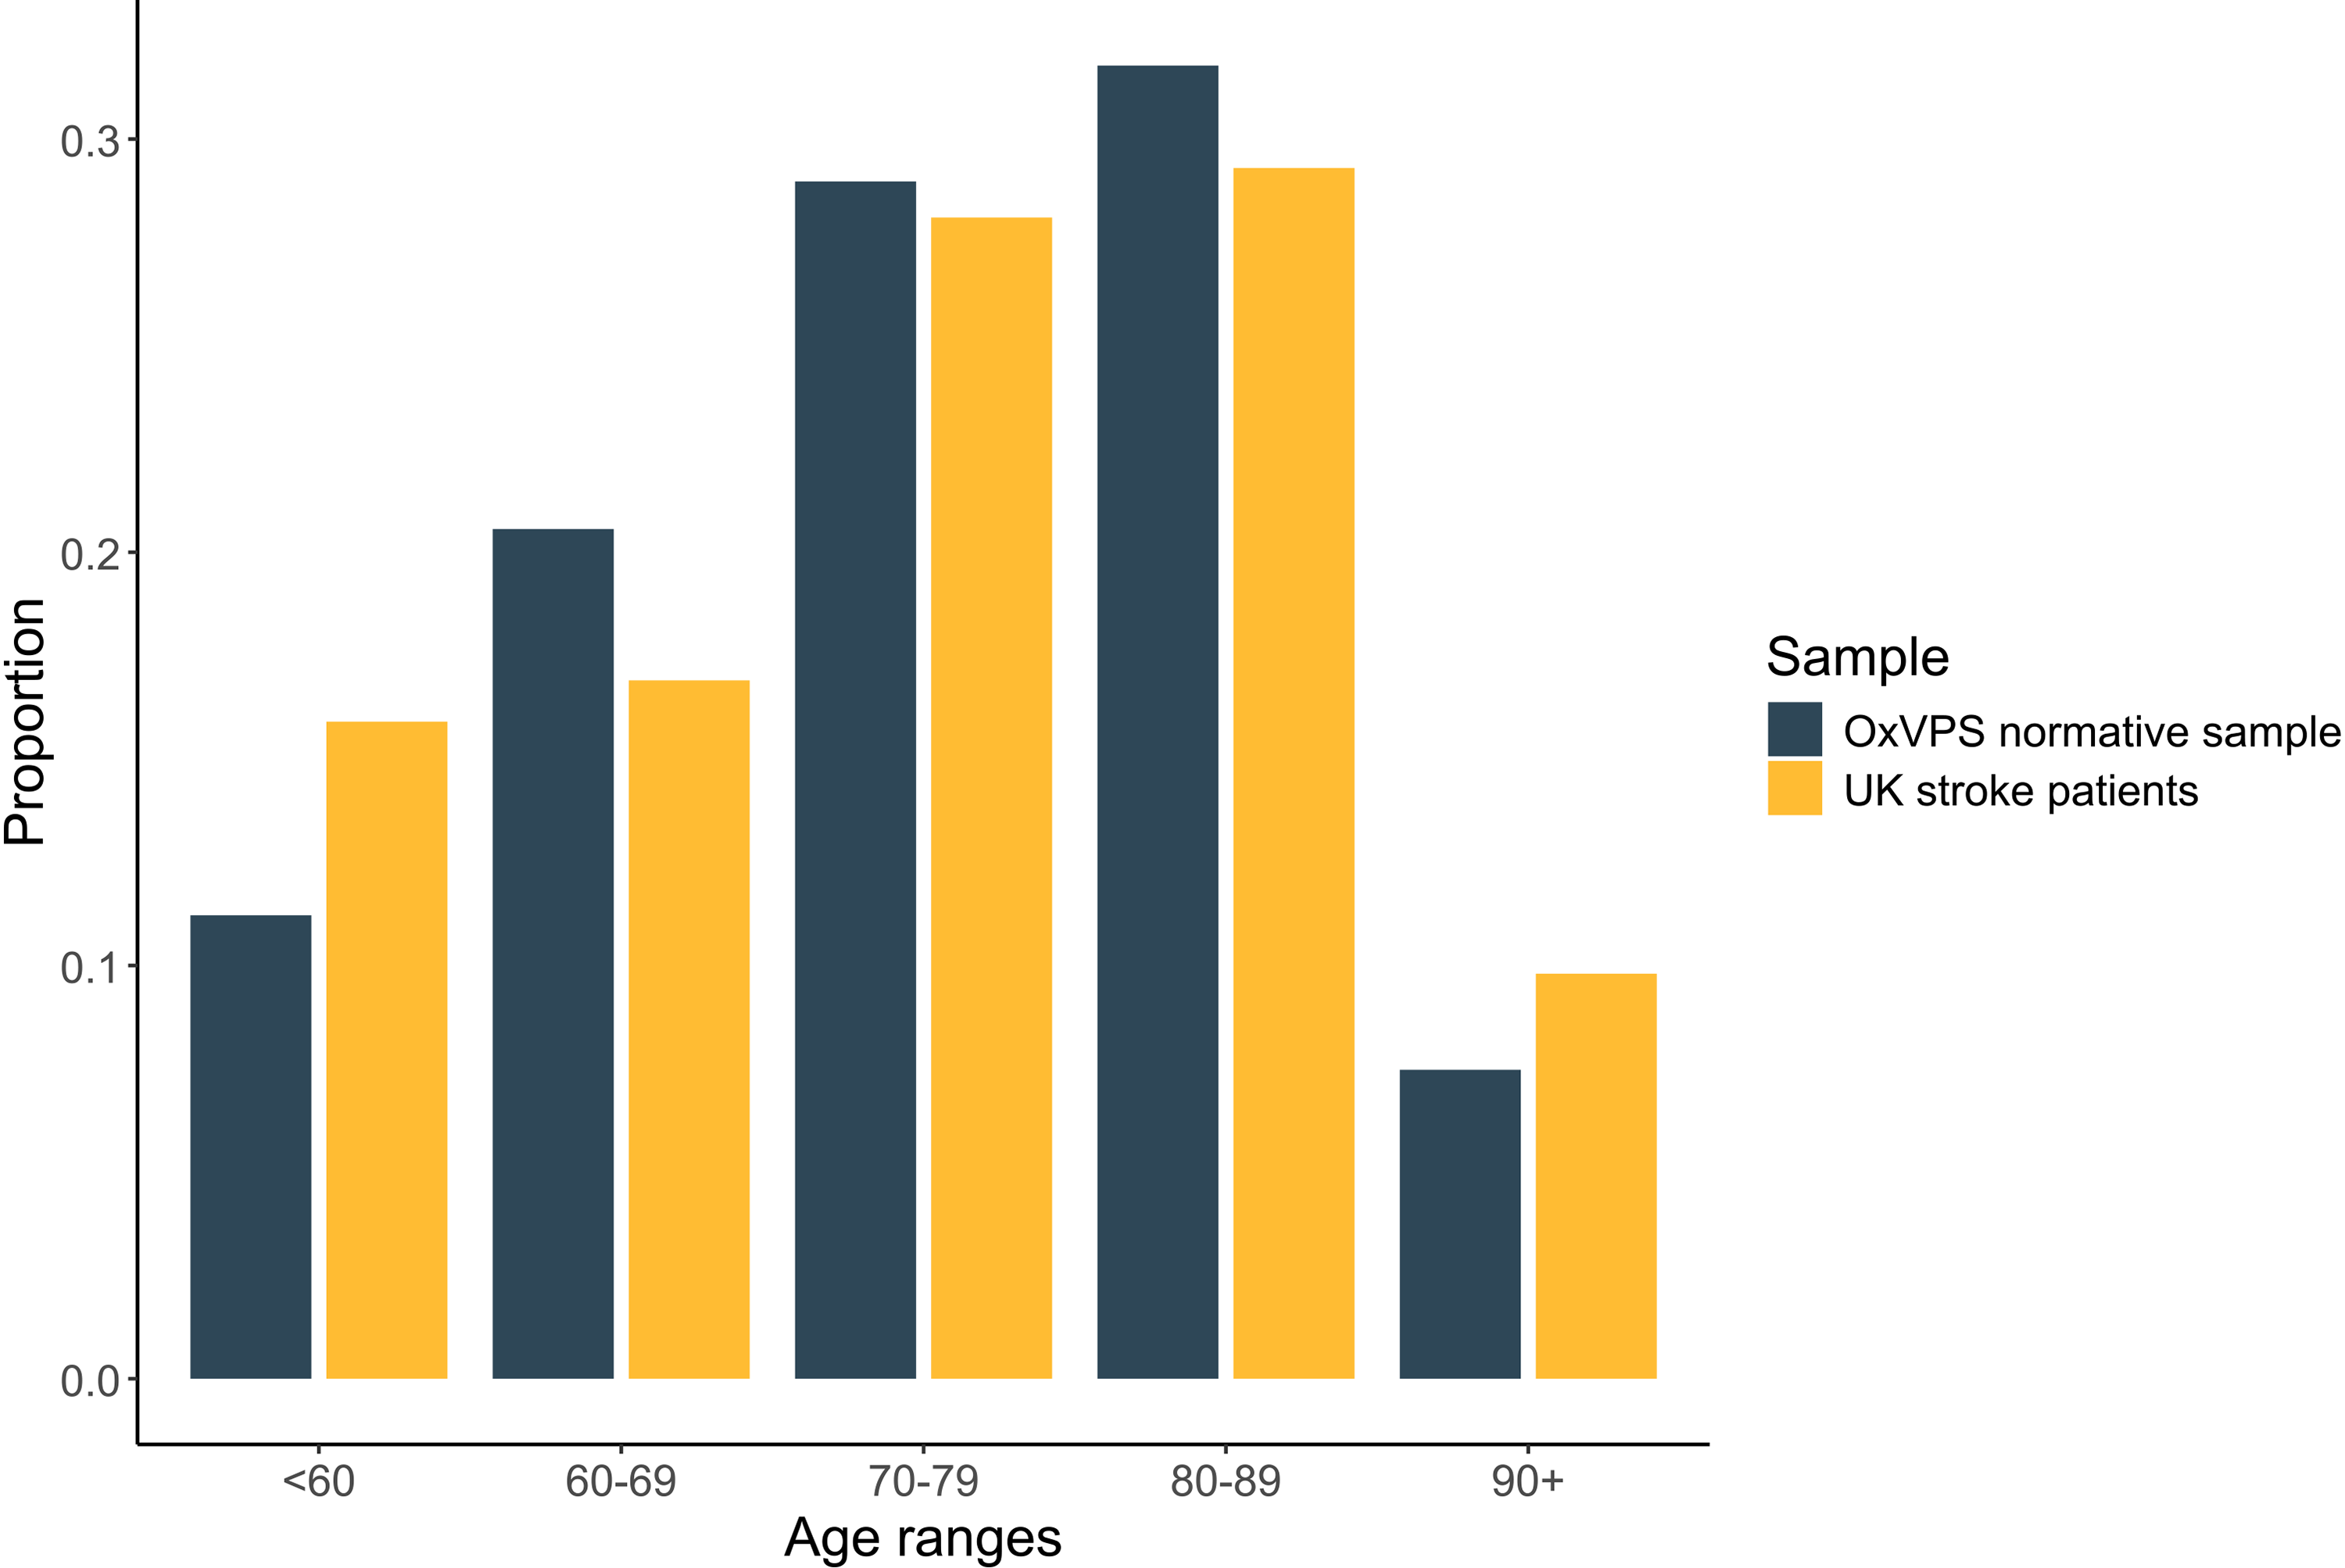
Distribution of age of the participants in our normative sample (in dark, N = 107) compared to the distribution of age of stroke patients admitted to hospital in England, Wales and Northern Ireland between April 2022 and March 2023 (in light, N = 91,162; source: 19 ).
Demographic details of participants in our normative sample.
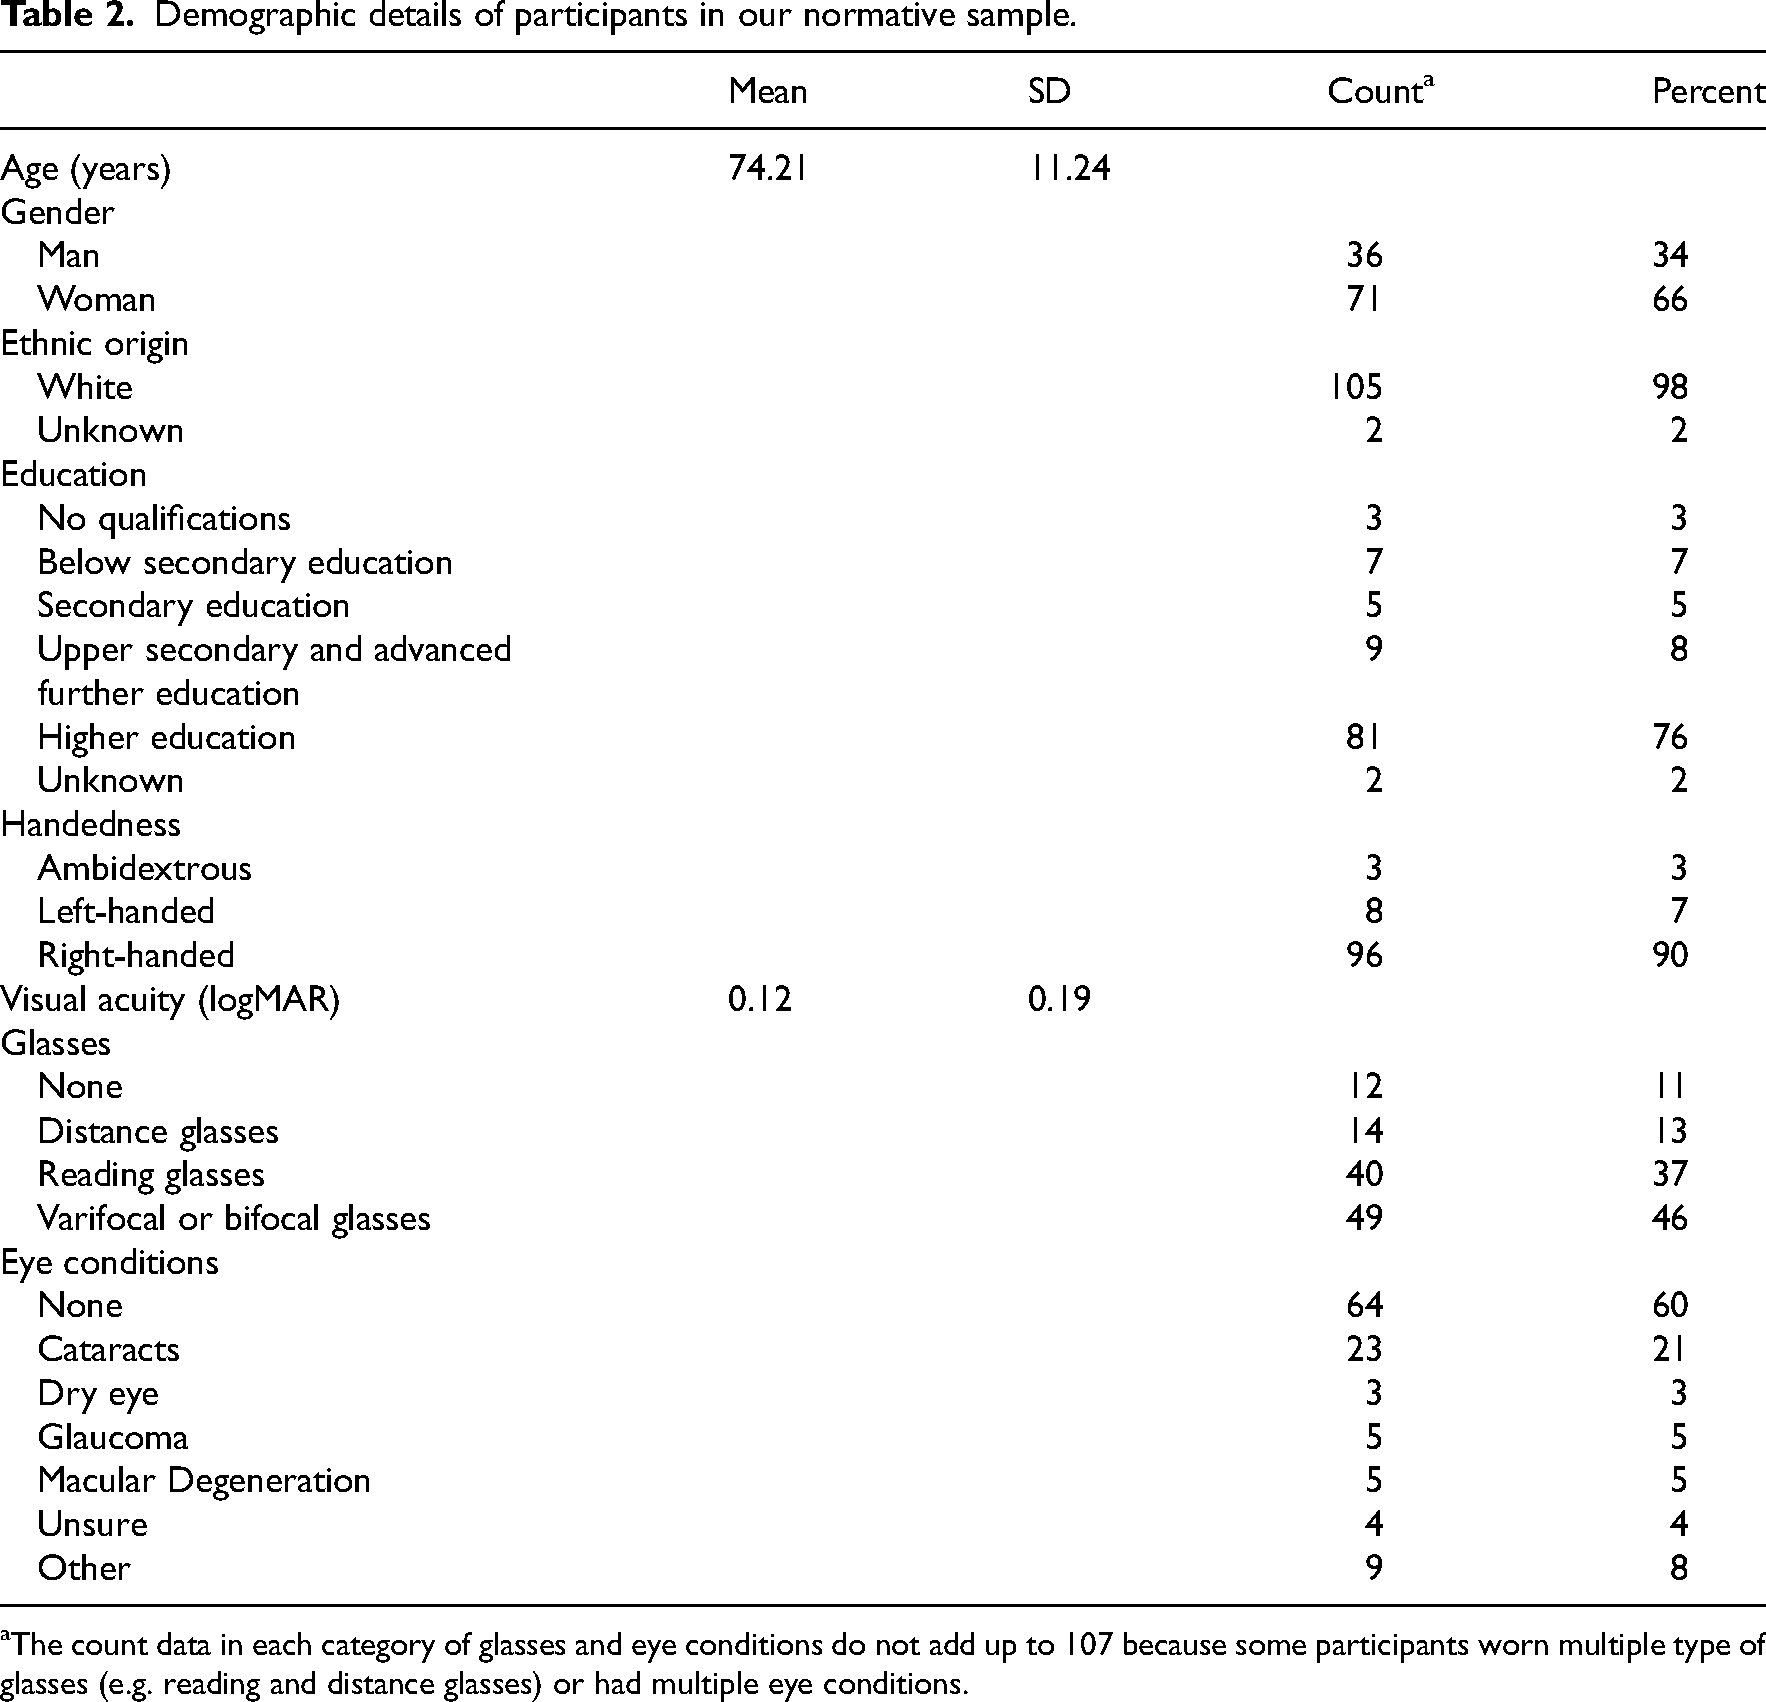
The count data in each category of glasses and eye conditions do not add up to 107 because some participants worn multiple type of glasses (e.g. reading and distance glasses) or had multiple eye conditions.
The distributions of the scores for each task of the Oxford Visual Perception Screen were highly skewed (see Figure 2). In Table 3, we report the median, interquartile range and the 5th and 10th centile scores for each task. Two participants who had a visual acuity of only 0.8 logMAR were not able to complete the reading task, but completed all other tasks. For most tasks, the 5th centile score can be used as cut-off score when screening for visual perception impairments and can be taken as indicative for impairment (see last column in Table 3). The exceptions are the Self-evaluation task and the Strategy score of the Figure Copy task which are evaluated qualitatively.
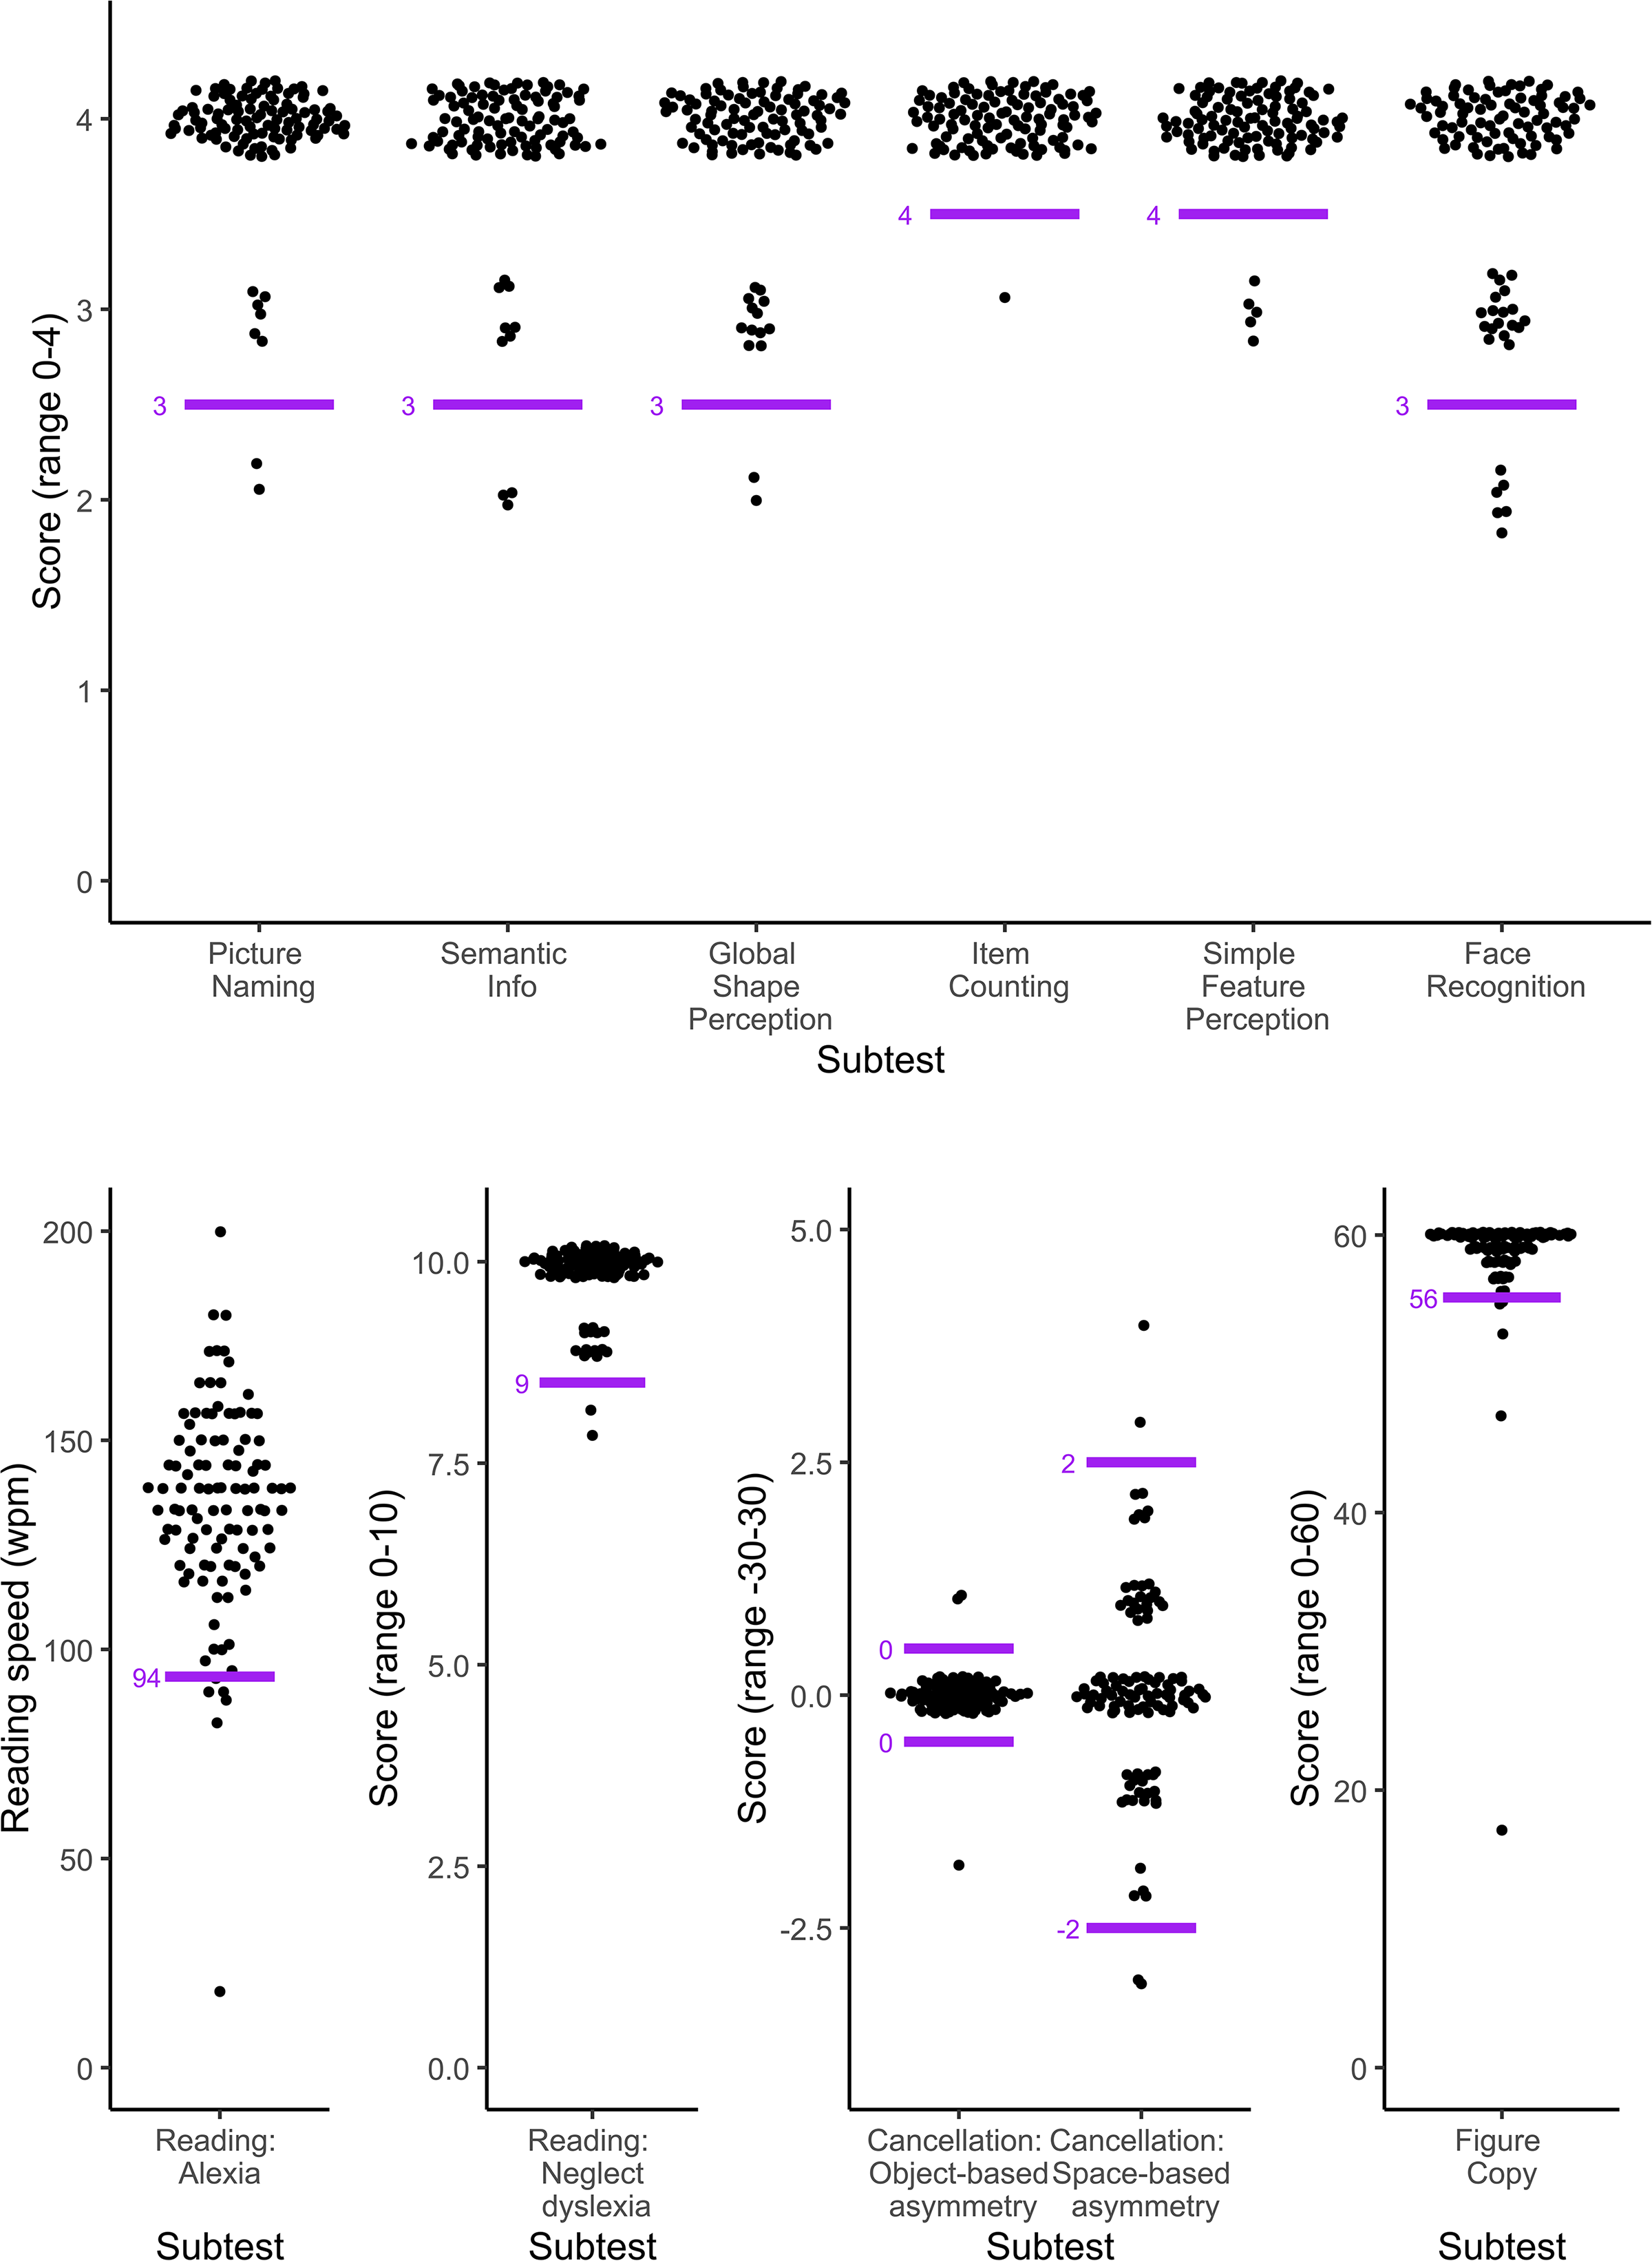
Distribution of scores for each task of the Oxford Visual Perception Screen (version 2.1). The top graph shows the scores of all tasks with a range of scores between 0 and 4. The bottom row of graphs shows the Reading speed in the Reading task in words per minute (no minimum or maximum), the number of correctly read complex words in the Reading task (maximum 10), the Object- and Space-based asymmetry scores (minimum possible score of −30 and maximum of 30) and the score on the Figure Copy task (maximum 60). A small amount of vertical jitter was added to the scores to show overlapping data points and better reflect the distribution of the scores. For instance, the dots around the number 4 in the Picture Naming task all represent participants with a score of exactly 4 out of 4 on the task. The horizontal spread of the dots is proportionate to the number of data points at that value. The short horizontal lines indicate the cut-off scores for each task of the Oxford Visual Perception Screen (version 2.1). For clarity, these lines were placed on the division line between ‘impaired’ and ‘unimpaired’ scores rather than at the location of the cut-off value. For instance, the cut-off value for the Picture Naming task is 3, but the short horizontal line is places slightly lower to show that a score of 3 is still within the normal range, while a score of 2 is only observed in less than 5% of our normative sample and therefore indicative for an impairment.
Descriptive statistics for each task of the Oxford Visual Perception Screen (version 2.1).
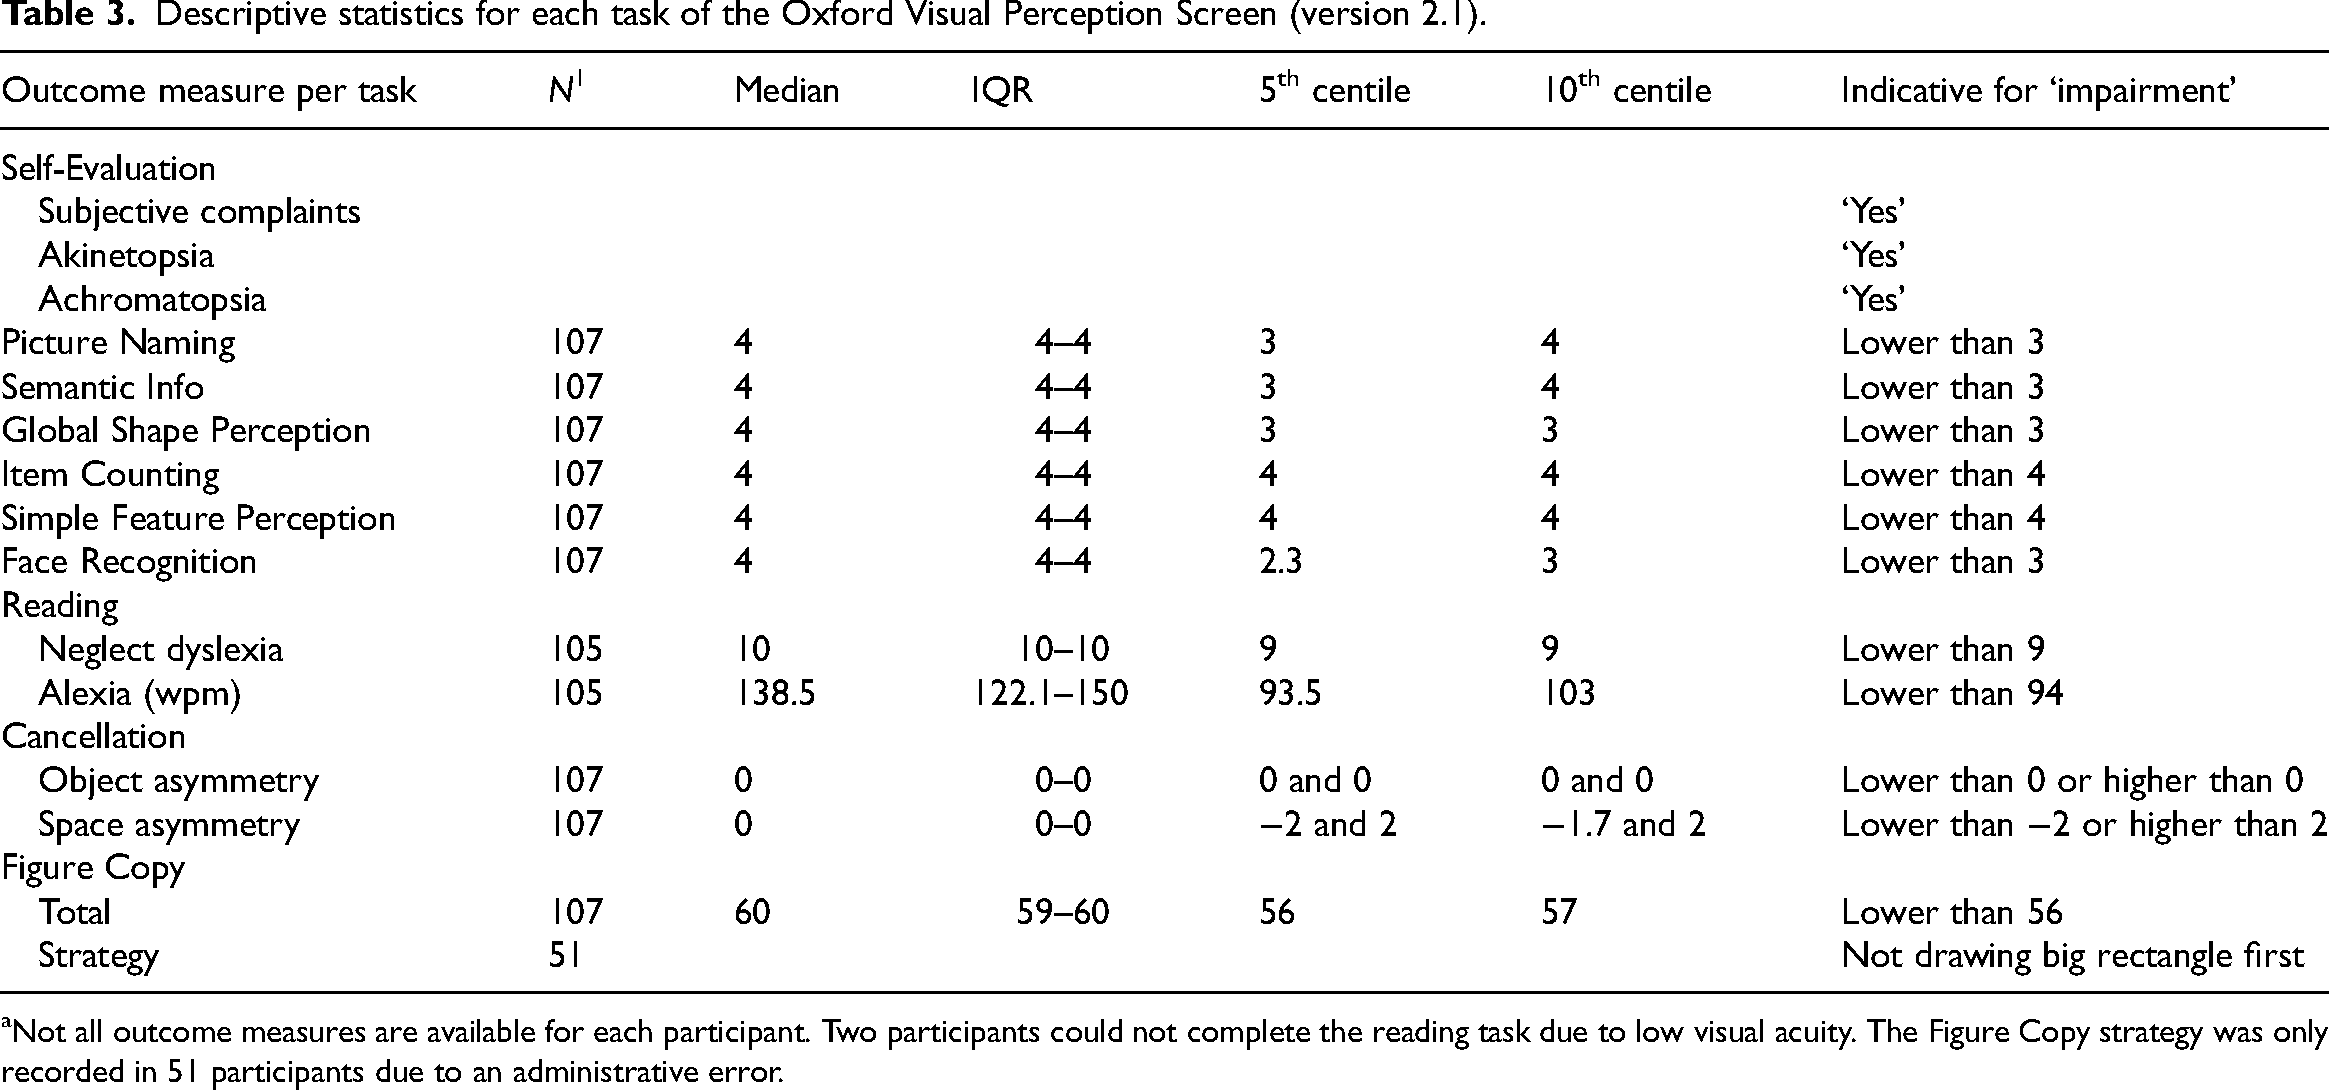
Not all outcome measures are available for each participant. Two participants could not complete the reading task due to low visual acuity. The Figure Copy strategy was only recorded in 51 participants due to an administrative error.
The estimated coefficients of each Generalised Linear Model, Z statistics and p-values are reported in Table 4.
Effect of age, gender and visual acuity on the Oxford Visual Perception Screen (version 2.1) performance.
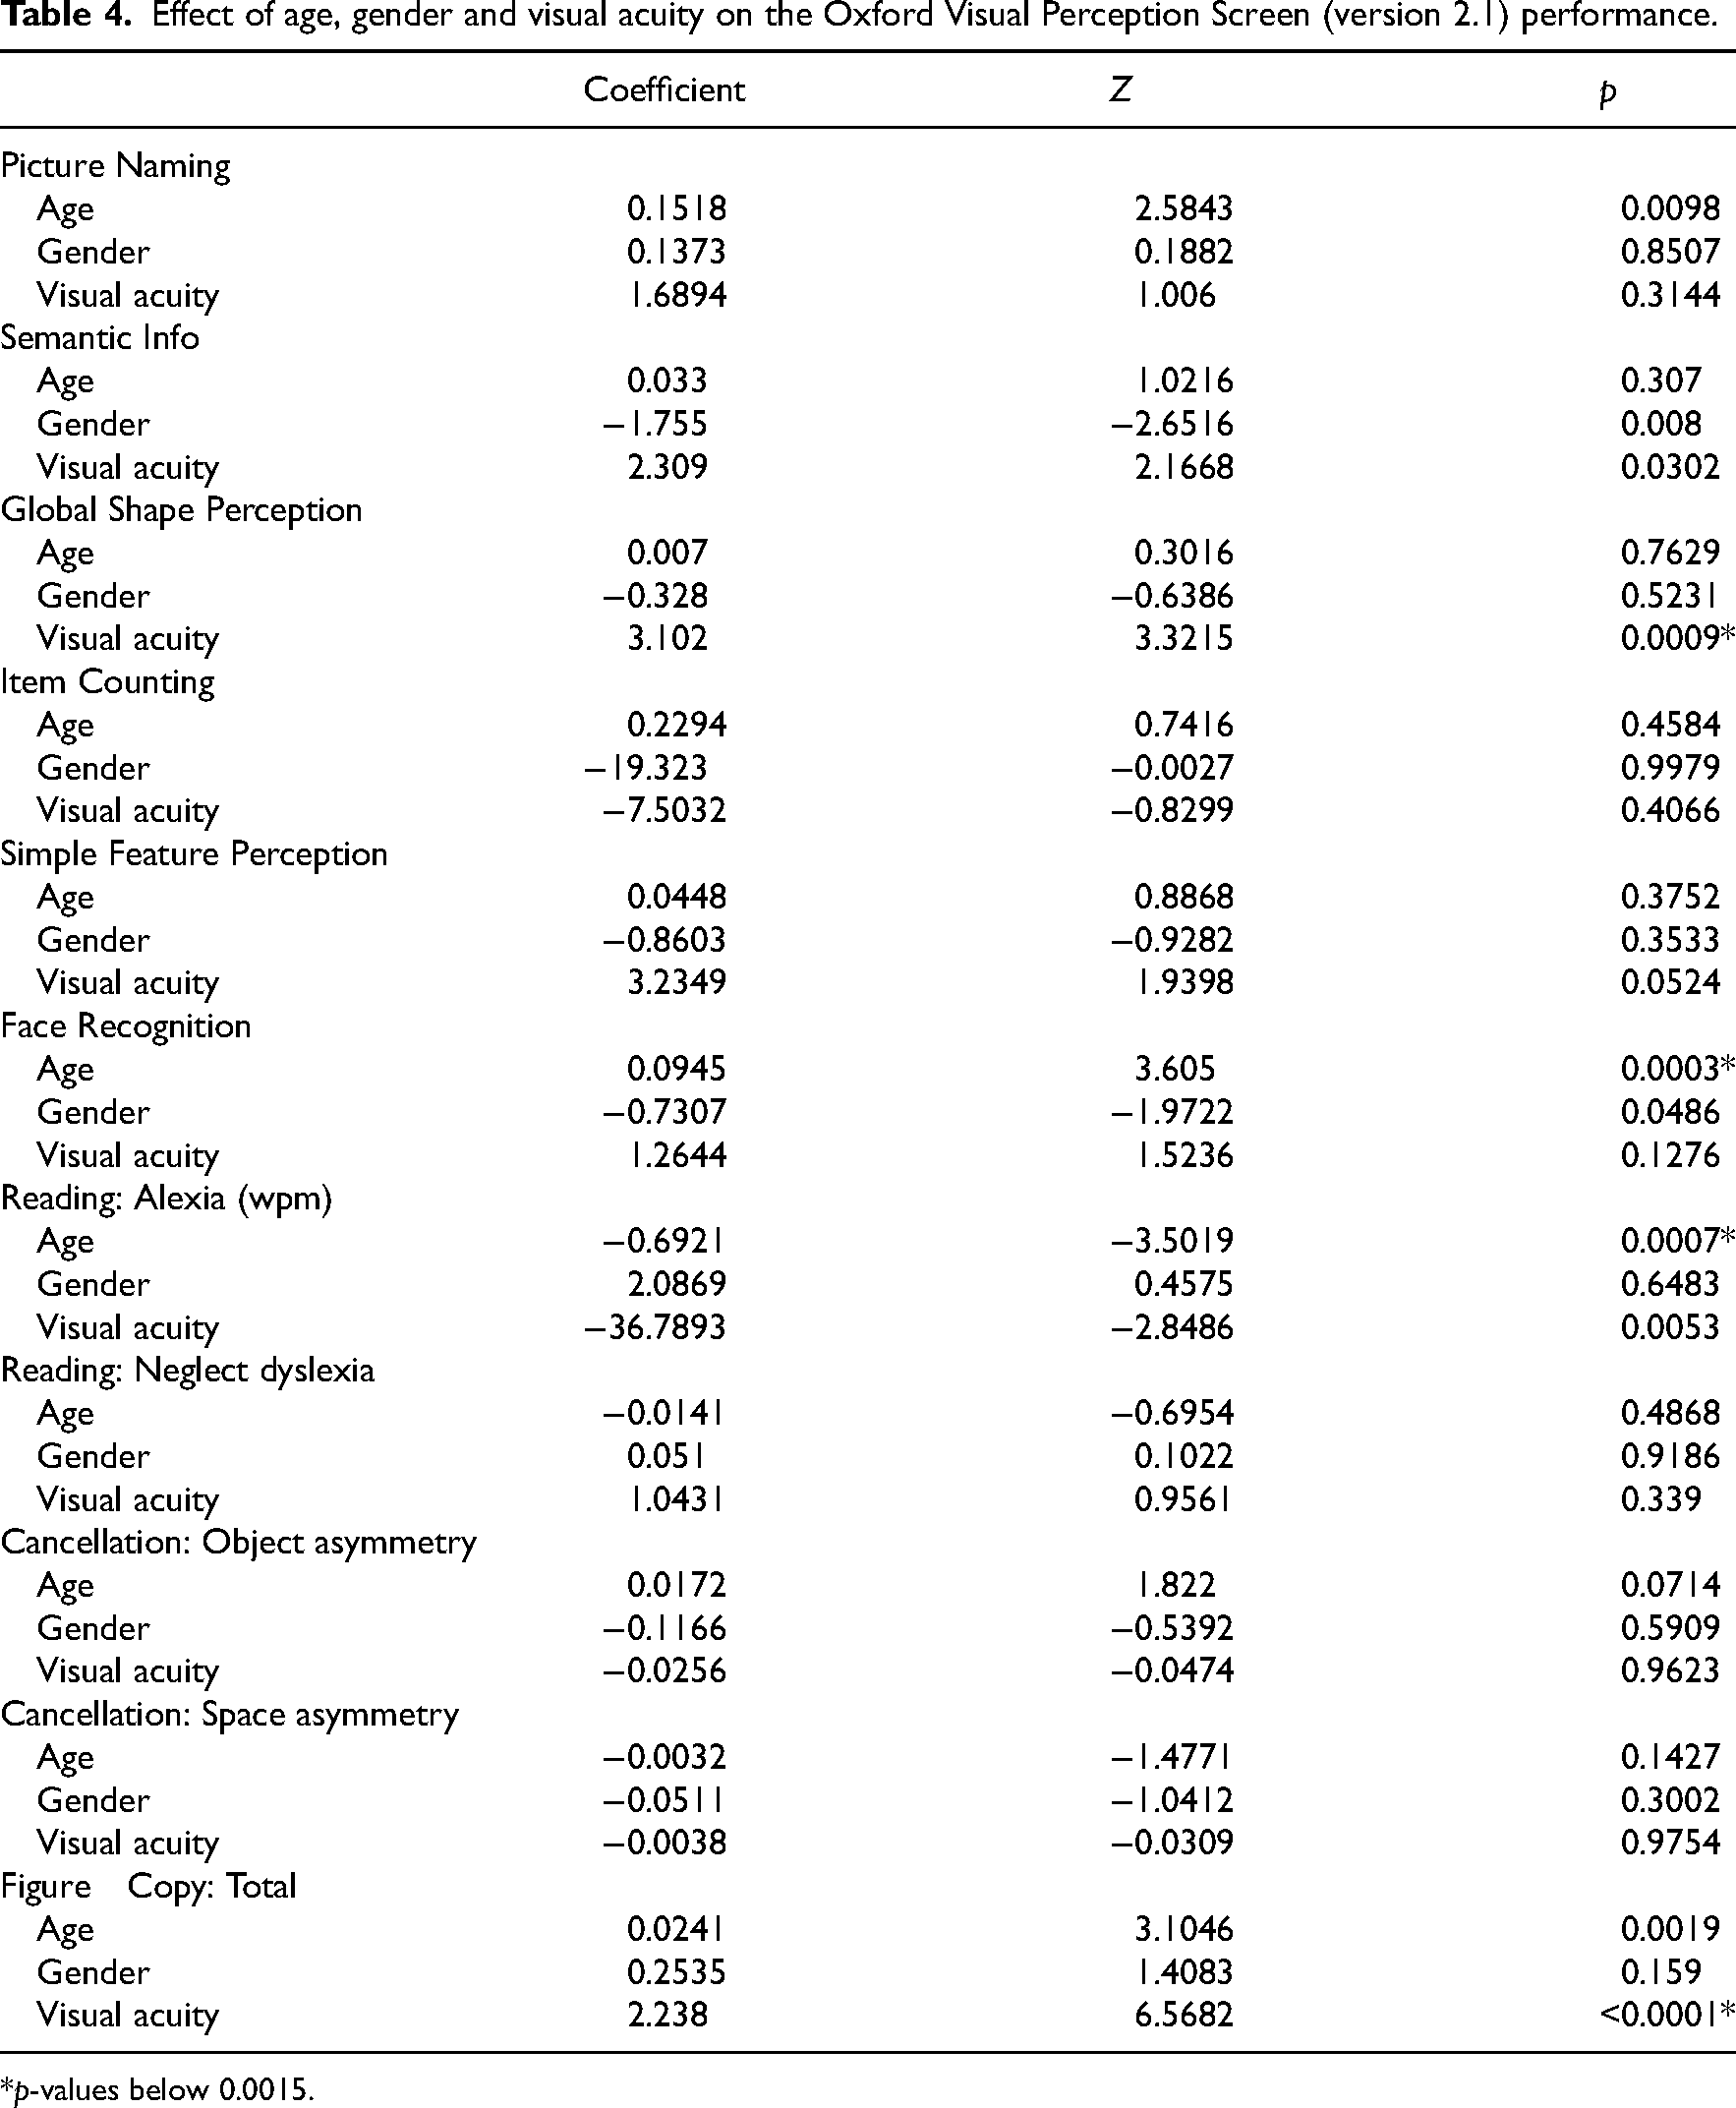
*p-values below 0.0015.
The observed decrease in performance with increasing age provided supporting evidence that in the population there is an effect of age on performance in the Face Recognition task (Z = 3.61, n = 107, p = 0.0003) and on reading speed in the Reading task (Z = −3.50, n = 105, p = 0.0007). In addition, we observed evidence that visual acuity negatively affects performance in the Global Shape Perception (Z = 3.32, n = 107, p = 0.0009) and the Figure Copy task (Z = 6.57, n = 107, p < 0.0001). Although it has been repeatedly demonstrated that visual acuity decreases with age,20,21 the correlation between visual acuity and age in our sample was low (r = 0.25), likely because we measured visual acuity while participants were wearing their habitual correction.
In addition to the normative data, we present data on eight example patient cases (see Table 5). Patients with Macular Degeneration that severely impacted their daily life (Case 1–2) failed several tasks of the Oxford Visual Perception Screen but their profile of scores is not indicative of any visual perceptual impairment that the Oxford Visual Perception Screen screens for and can therefore not be mistaken for a visual perception issue. Patients with cataract, glaucoma or dry eye with no to little reduction in near visual acuity and only a mild effect on daily life (Case 3–5) performed well on all tasks of the Oxford Visual Perception Screen. Cases 6–8 were diagnosed with visual perceptual difficulties following an extensive neuropsychological assessment with the Rivermead Perceptual Assessment Battery. Case 6 failed across all tasks of the Oxford Visual Perception Screen and had no subjective complaints about their vision. This profile is indicative of severe cortical blindness. However, their performance in the cancellation task was better than would be expected from a blind patient. Case 7’s scoring profile showed signs of prosopagnosia by failing the Face Recognition task, a visuo-constructive deficit as indicated by a low score on Figure Copy task, alexia, and neglect dyslexia (low score on both measures in the Reading task). They reported that naming colours was difficult and when objects are moving fast ‘their brain can’t keep up’, which is indicative of akinetopsia and achromatopsia. Case 8’s scoring profile was indicative of optic aphasia (failure on Picture Naming, but not on Semantic Info, Global Shape Perception, Item Counting, or Simple Feature Perception), and alexia and neglect dyslexia (low score on both measures in the Reading task).
The Oxford Visual Perception Screen (version 2.1) profile of nine cases with either sensory vision problems or with a stroke.
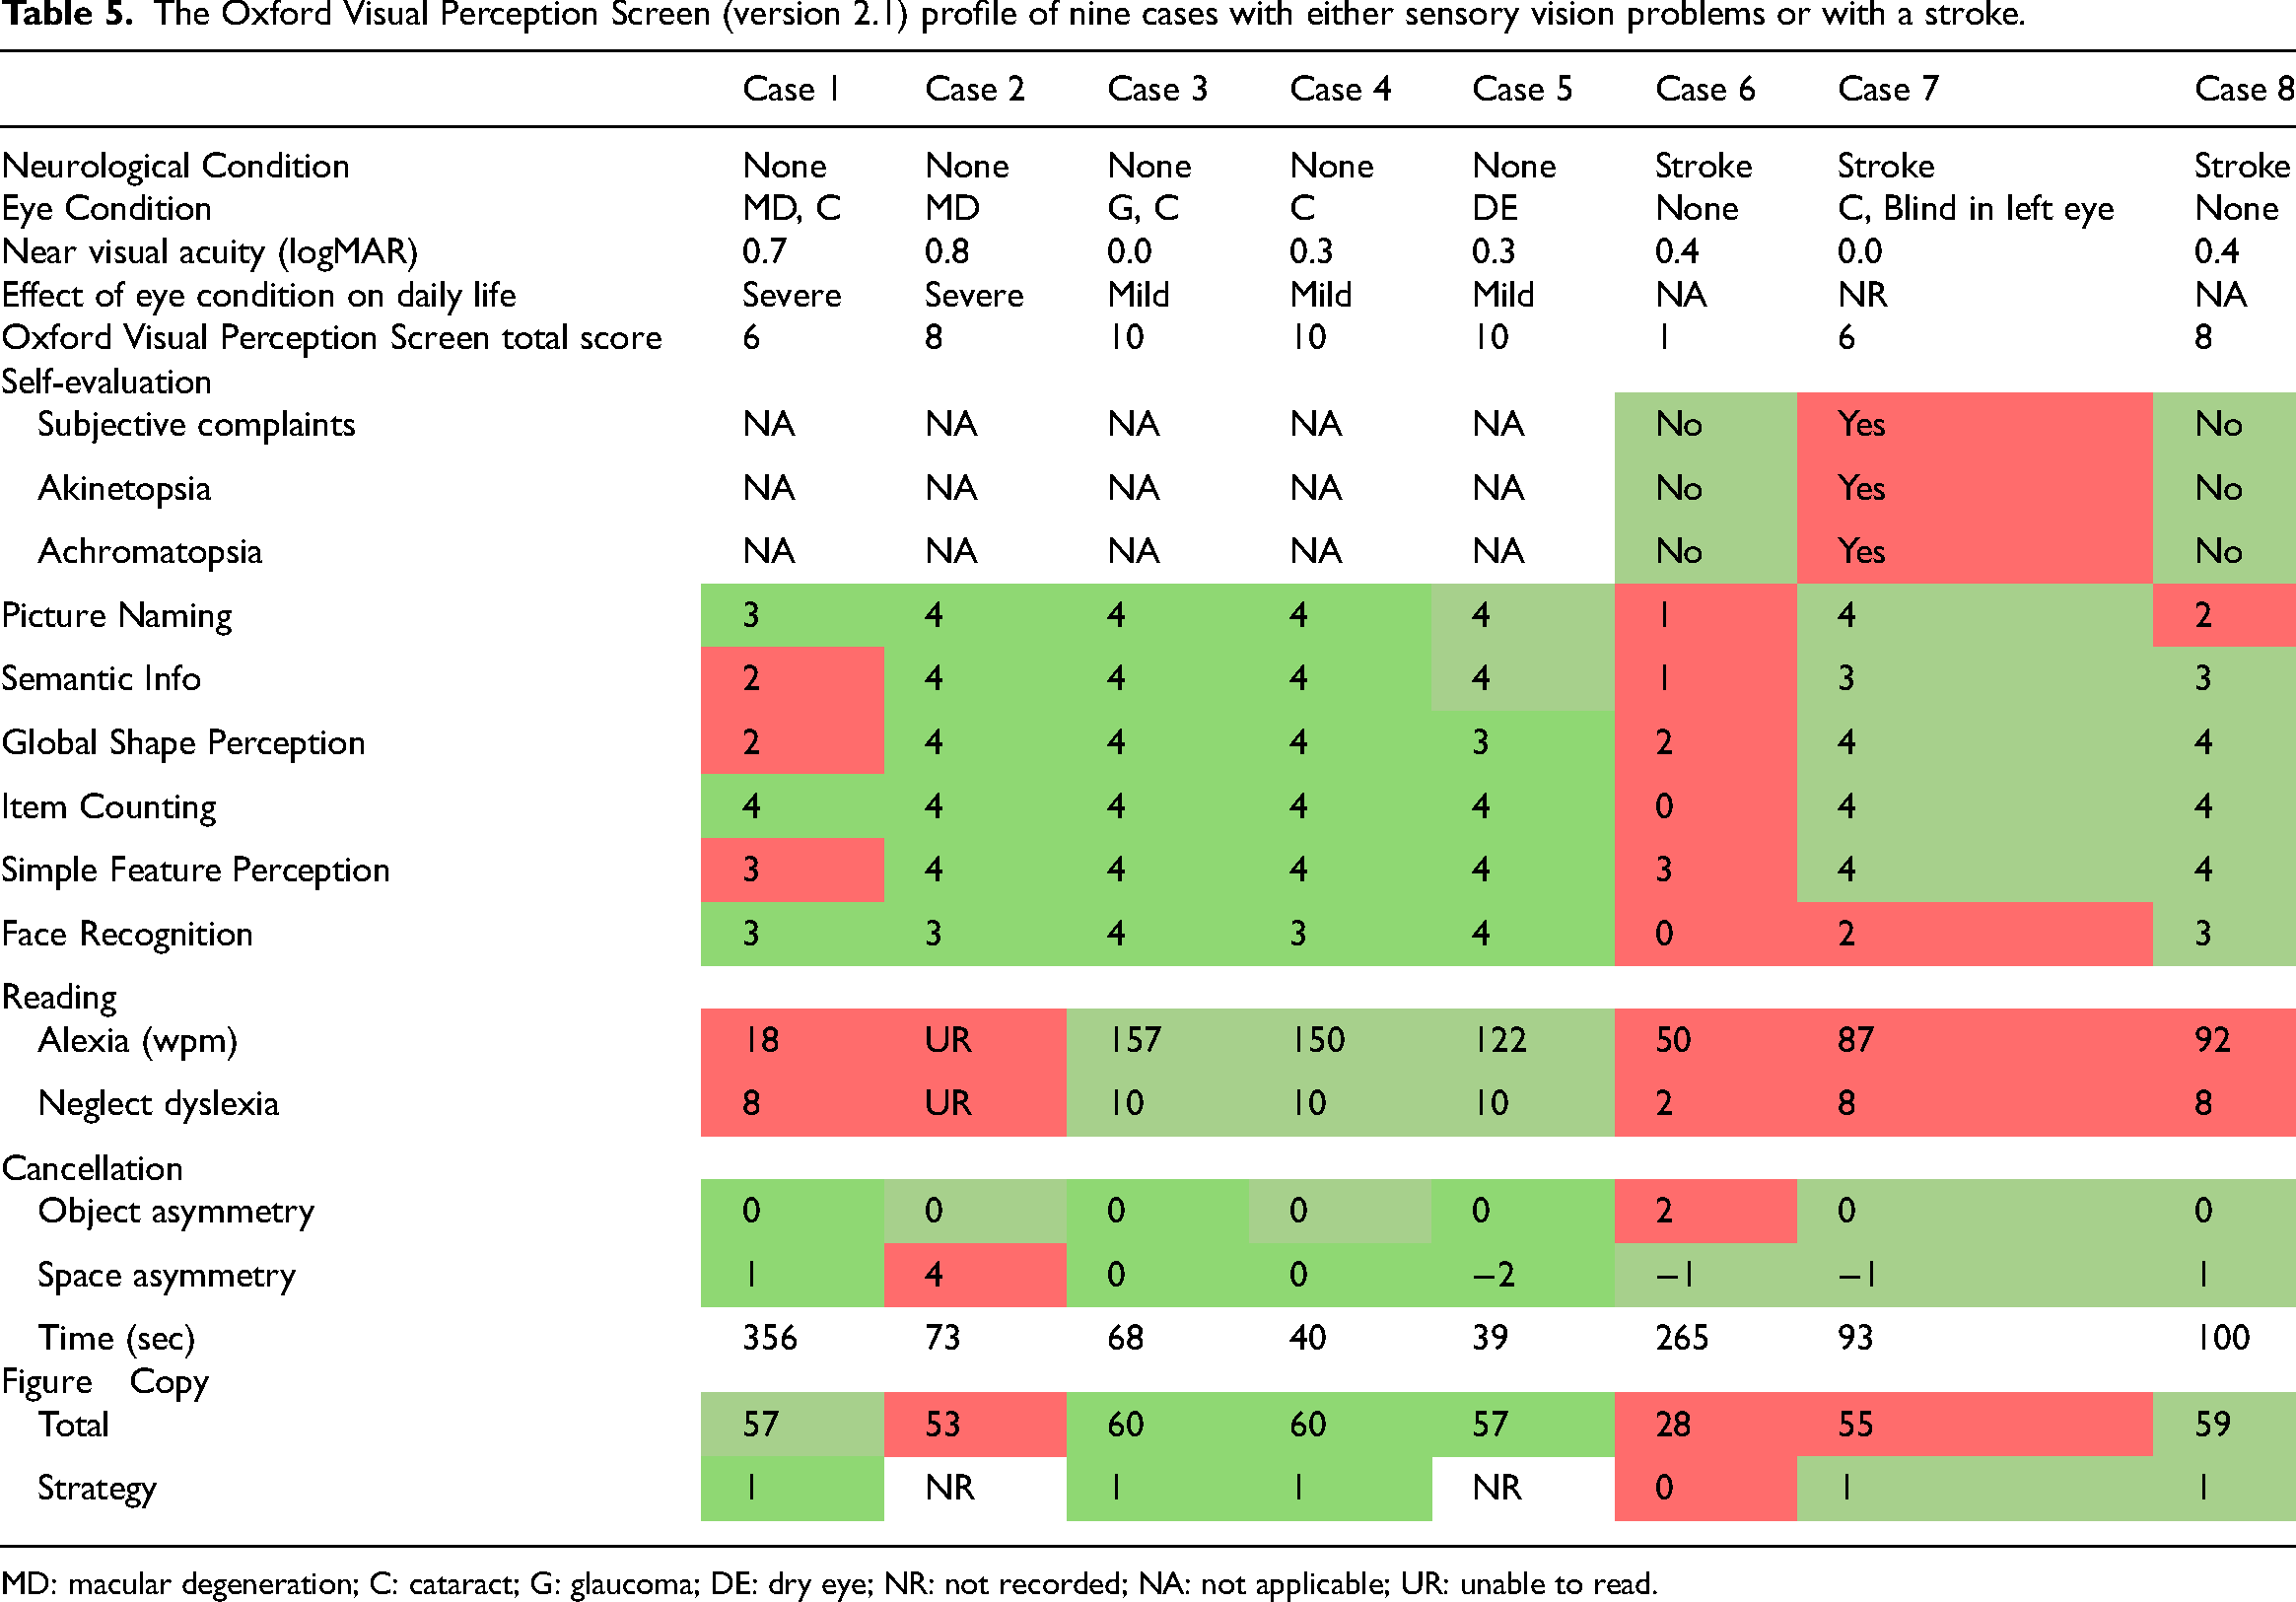
MD: macular degeneration; C: cataract; G: glaucoma; DE: dry eye; NR: not recorded; NA: not applicable; UR: unable to read.
Discussion
With the Oxford Visual Perception Screen, stroke survivors can be screened for 15 visual perceptual impairments. Our normative data of 107 neurologically healthy older volunteers provide a standardised benchmark for normal performance on the Oxford Visual Perception Screen. The scores on the tasks were highly skewed with many healthy volunteers obtaining the maximum score on each task. Based on our normative data, we have calculated 5th centile cut-off scores for normal performance on each task. The Oxford Visual Perception Screen was designed as a screening tool. This means it is not designed to comprehensively diagnose visual perception problems. Instead, the results of the Oxford Visual Perception Screen should provide pointers to which perceptual difficulties might be present, in order to support referral for comprehensive assessment and inform interim rehabilitation advice.
The Oxford Visual Perception Screen aims to fill the gap in existing visual perception assessments for a quick and easy to use screening tool that is accessible for stroke survivors. Although some existing tests like the Rivermead Perceptual Assessment Battery 3 and the Occupational Therapy Adult Perception Screening Test 8 have excellent psychometric properties,22–24 they are not always feasible to complete with stroke survivors at the acute stage because of their length, because of reliance on verbal communication, or because cumbersome testing materials that make it difficult to complete at bedside. These practical barriers mean existing screening tests are not often used in clinical settings. 9 With the development of the Oxford Visual Perception Screen, we focused on practicality and key requirements as identified by health professionals. The Oxford Visual Perception Screen is a screening test that takes 15 min, making it feasible for stroke survivors with limited concentration in the first few days after a stroke. Health professionals can learn to administer, score and interpret the Oxford Visual Perception Screen by watching a 20-min video. In addition, the Oxford Visual Perception Screen is portable and compact, making it feasible to be completed at bedside. Through these features, the Oxford Visual Perception Screen has the potential to change the screening for visual perception impairments in clinical practice.
A strength of the study is the age range of our normative sample: 45% of our volunteers were above 80 years old and the average age was 74.2 years old (SD = 11.2). A limitation is the education level and ethnicity in our normative sample. Seventy-three percent of our volunteers completed higher education compared to only 28% in the general population of England and Wales. 25 In addition, nearly all our participants were of white ethnicity. The effect of education and ethnicity on performance in visual perception tasks is debatable26,27 with some studies highlighting the need for ethnicity specific normative data for neuropsychological tests.28,29 In future, the effect of education and ethnicity on performance in the Oxford Visual Perception Screen should be further explored.
A second limitation are the prerequisites for the Oxford Visual Perception Screen. Patients need to have a good understanding of the language to comprehend the instructions and understand the answer options. In addition, a basic education with literacy is a condition for the Reading task. Furthermore, our normative data showed that a minimum near visual acuity of 0.7 logMAR with habitual correction (equivalent to 6/30 or 20/100 Snellen and 0.20 decimal acuity) is required for the Reading task. The other tasks of the Oxford Visual Perception Screen have not been tested in people with poorer near vision than 0.8 logMAR (equivalent to 6/38 or 20/125 Snellen and 0.16 decimal acuity). Finally, a note should be made about any cognitive (e.g. executive functions), communication (e.g. aphasia) or physical impairments (e.g. arm weakness, fatigue) that might have an influence on performance, and thus for the Oxford Visual Perception Screen to be conducted following first-line screening on these aspects (e.g. with the Oxford Cognitive Screen 13 ).
As a third limitation, the current study does not evaluate the diagnostic accuracy, reliability and validity of the Oxford Visual Perception Screen, for which work is ongoing. To evaluate the diagnostic accuracy (e.g. sensitivity, specificity and false positive and false negative rate), a comparison must be made between impairment classifications of patients’ visual perception based on the Oxford Visual Perception Screen and on a gold standard test for visual perception. The current data do not allow such evaluation. This will need to be addressed in future research. Although the design choices and case examples provide some initial evidence of validity this is only preliminary. For instance, the Oxford Visual Perception Screen was designed so common ophthalmological conditions in elderly people 30 lead to a different pattern of scores and mistakes compared to the visual perceptual impairments. The case series indeed suggest that although patients with severe ocular conditions can fail some of the tasks in the Oxford Visual Perception Screen, their mistakes can usually be explained by their ocular condition and/or their profile of failed tasks does not correspond to any of visual perceptual impairments that the Oxford Visual Perception Screen screens for. In the future, the effect of common sensory vision conditions like cataracts, glaucoma and macular degeneration could be systematically evaluated in a sample for which detailed optometric and ophthalmological information is available. Until then, a note should be made of any ophthalmological or sensory vision problems that might affect the interpretation of the Oxford Visual Perception Screen scores. In addition, research into test-retest reliability and inter-rater reliability will show if the Oxford Visual Perception Screen test scores are stable across test sessions and examiners. A sufficiently powered validation study with stroke survivors assessing convergent and divergent validity is essential to develop the evidence-base to support the use of the Oxford Visual Perception Screen in clinical practice.
In sum, here we presented a new standardised screening tool for visual perception following stroke along with normative data and cut-offs. Following future validation research, the Oxford Visual Perception Screen has the potential to improve the detection of visual perception difficulties after stroke and support the planning of subsequent in-depth assessment and decisions on interim rehabilitation advice until a diagnosis is confirmed. The Oxford Visual Perception Screen is available to download at https://oxvps.webspace.durham.ac.uk/.
The Oxford Visual Perception Screen provides a standardised assessment to systematically screen nearly all stroke survivors for visual perception difficulties. The Oxford Visual Perception Screen screens for 15 different visual perception impairments in 10 short tasks. Normative data of 107 healthy older volunteers provide a benchmark for normal performance on the Oxford Visual Perception Screen through cut-off scores for each task. The Oxford Visual Perception Screen makes screening for visual perception difficulties more accessible through a quick 15-min assessment that is easy to administer and interpret by health care professionals from various disciplines.Clinical messages
Footnotes
Acknowledgements
We would like to thank our student research assistants Yat Chan, Emily Iskaros, James Marsh, and Akshita Rai, who contributed to the collection of normative data and stimulus development. We also thank the stroke patients and carers who got involved as image creators or advisors on the project. We further extend our gratitude to all health professionals, researchers and older volunteers who provided feedback on early versions of Oxford Visual Perception Screen or participated in the above studies. Finally, we are grateful for the stimulating discussions with members of the research groups at the University of Oxford, where this work was initiated, and at Durham University. Special thanks to Sam Webb and Nancy Xiaotong Ding who supported pilot studies during development.
Author contributions
KV: conceptualisation, funding acquisition, methodology, resources, supervision, project administration, data curation, formal analysis, visualisation, validation, writing – original draft. RC: investigation, project administration, writing – review & editing. RS: investigation, writing – review & editing. CG: investigation, writing – review & editing. MFC: investigation, writing – review & editing. FG: investigation, project administration, writing – review & editing. ND: conceptualisation, funding acquisition, methodology, resources, supervision, validation, writing – review & editing.
Ethical considerations
All procedures were reviewed by the Psychology Ethics Committee at Durham University or the Health Research Authority Derby Research Ethics Committee and were given a favourable opinion (reference numbers PSYCH-2022-01-19T13_53_52 and 23/EM/0086).
Consent to participate
All participants provided their written informed consent to participate.
Consent for publication
All participants have provided written informed consent for publication.
Declaration of conflicting interest
The authors declared the following potential conflicts of interest with respect to the research, authorship, and/or publication of this article: ND is a developer of the Oxford Cognitive Screen but does not receive any remuneration from its use. KV is a developer of the Oxford Visual Perception Screen but does not receive any remuneration from its use. KV occasionally receives reimbursements for travel expenses when invited to present the work described in this manuscript or deliver training on visual perception difficulties after a brain injury.
Funding
The authors disclosed receipt of the following financial support for the research, authorship, and/or publication of this article: Dr Kathleen Vancleef and Prof Nele Demeyere are funded by the National Institute for Health and Care Research (NIHR) for this research project (Advanced Fellowship NIHR301715 and NIHR302224 respectively). The views expressed in this publication are those of the authors and not necessarily those of the NIHR, NHS or the UK Department of Health and Social Care. The work was also financially supported by the Stroke Association under fellowships awarded to Dr Kathleen Vancleef (TSA PDF 2017/03) and Prof Nele Demeyere (TSA LECT 2015/02).