
Abstract
Objective:
To design, develop and psychometrically evaluate a stroke-specific measure of confidence, the Confidence after Stroke Measure (CaSM).
Design:
Cross-sectional.
Setting:
Adults in the community.
Participants:
Stroke survivors and healthy elderly participants.
Methods:
Questionnaire items were generated based on the literature and qualitative interviews and piloted with expert groups to establish face validity. A 53-item CaSM was administered to stroke survivors and healthy elderly participants in the community. A second copy was posted four weeks later. Completed questionnaires were analysed for extreme responses, missing values, construct validity (factor analysis), convergent validity, divergent validity, reliability (internal consistency and temporal stability) and comparing responses according to age and gender.
Results:
Stroke (n = 101) and healthy elderly participants (n = 101) returned questionnaires. Eight items were removed that had extreme responses and large numbers of missing values. Six items had item total correlations <0.3 and were removed. A further item was removed demonstrating gender difference. An exploratory factor analysis was conducted on the remaining 38 items. A 27-item three factor solution was derived assessing Self-Confidence, Positive Attitude and Social Confidence, which explained 52% of variance. Cronbach’s alpha coefficient demonstrated good internal consistency (α = 0.94). A test re-test on the 27 items indicated good temporal stability (r = 0.85, P = 0.001).
Conclusion:
The 27-item CaSM was a valid and reliable measure for assessing confidence in stroke survivors.
Introduction
Stroke survivors have identified ‘finding the best ways to improve confidence after stroke’ as a research priority. 1 Lack of confidence is common, regardless of the level of impairment 2 and affects people’s abilities to carry out daily life activities. Social interactions have been found to be particularly fearful experiences due to lack of confidence.
Confidence has been described as being central to recovery, 3 suggesting when stroke survivors are more confident they are able to progress better, whereas low confidence often prevents them from achieving what they want to do. 3 This in turn leads to worse well-being and worse long-term outcomes.3,4
A narrative literature review summarised the confidence after stroke literature. Electronic bibliographic databases, such as CINAHL and PsychINFO, were searched. The conclusions from the review were that confidence comprises of individual beliefs about ability or capability to achieve, based on these beliefs. Improving confidence is of clinical importance, as the potential for worst long-term outcomes, due to lack of confidence was evident. 3 An interview study with stroke survivors, 2 found that identity loss, fear, social confidence, role confidence, skill mastery and attitudes and beliefs were components of the meaning of confidence.
In summary, confidence after stroke, has been defined as ‘a combination of self-efficacy, self-esteem and input from the environment that influences individual belief in the ability to do what it is stroke survivors want to do’. 2 While this definition indicates confidence is closely associated with self-efficacy, 5 it encompasses the essence of ‘being’ confident in themselves and with others.
There are currently two self-efficacy measures for people with stroke, the Stroke Self-Efficacy Questionnaire (SSEQ) 3 and the Daily Living Self-Efficacy Scale (DLSES). 4 These aim to assess some aspects of low confidence after stroke. However, the SSEQ does not include a social component and it lacks items on instrumental activities of daily living. Perceived self-efficacy is assessed in relation to basic activities of daily living and self-management activities. The DLSES 4 includes items on psychosocial functioning; however, it omits low self-worth and low mood, which are believed to be components of a person’s confidence. 2
Low confidence increases dependence and leads to social isolation 6 preventing people from living active lives after their stroke. One outcome of rehabilitation is an increase in a person’s confidence to carry out daily life activities (self-efficacy) and an emotional feeling of confidence in one’s self (self-worth). Therefore, there was a need to design a patient reported, valid and reliable measure of confidence which would assess confidence, as defined more broadly than in previous measures.
A Confidence after Stroke Measure (CaSM) was designed in two phases. Phase 1, included the face and content validity testing. Phase 2 evaluated the convergent and divergent validity and the reliability.
Methods
The study was granted ethical approval on 21 March 2013 from the University of Nottingham, School of Medicine, and Ethics Committee. Reference: Q14032013 and from the National Research Ethics Service Committee, South Central Hampshire on 23 July 2014, REC reference number 14/SC/1154. A conceptual framework was developed, guided by the COsensus of Standards for the selection of Measurement Instruments in health (COSMIN) 7 and health measurement texts.8,9 The framework guides new measure developers to use consistent measurement terms. These terms were used to add clarity and uniformity when describing the development process of the CaSM. 8
A plan for the design and development of the CaSM is illustrated in Figure 1.
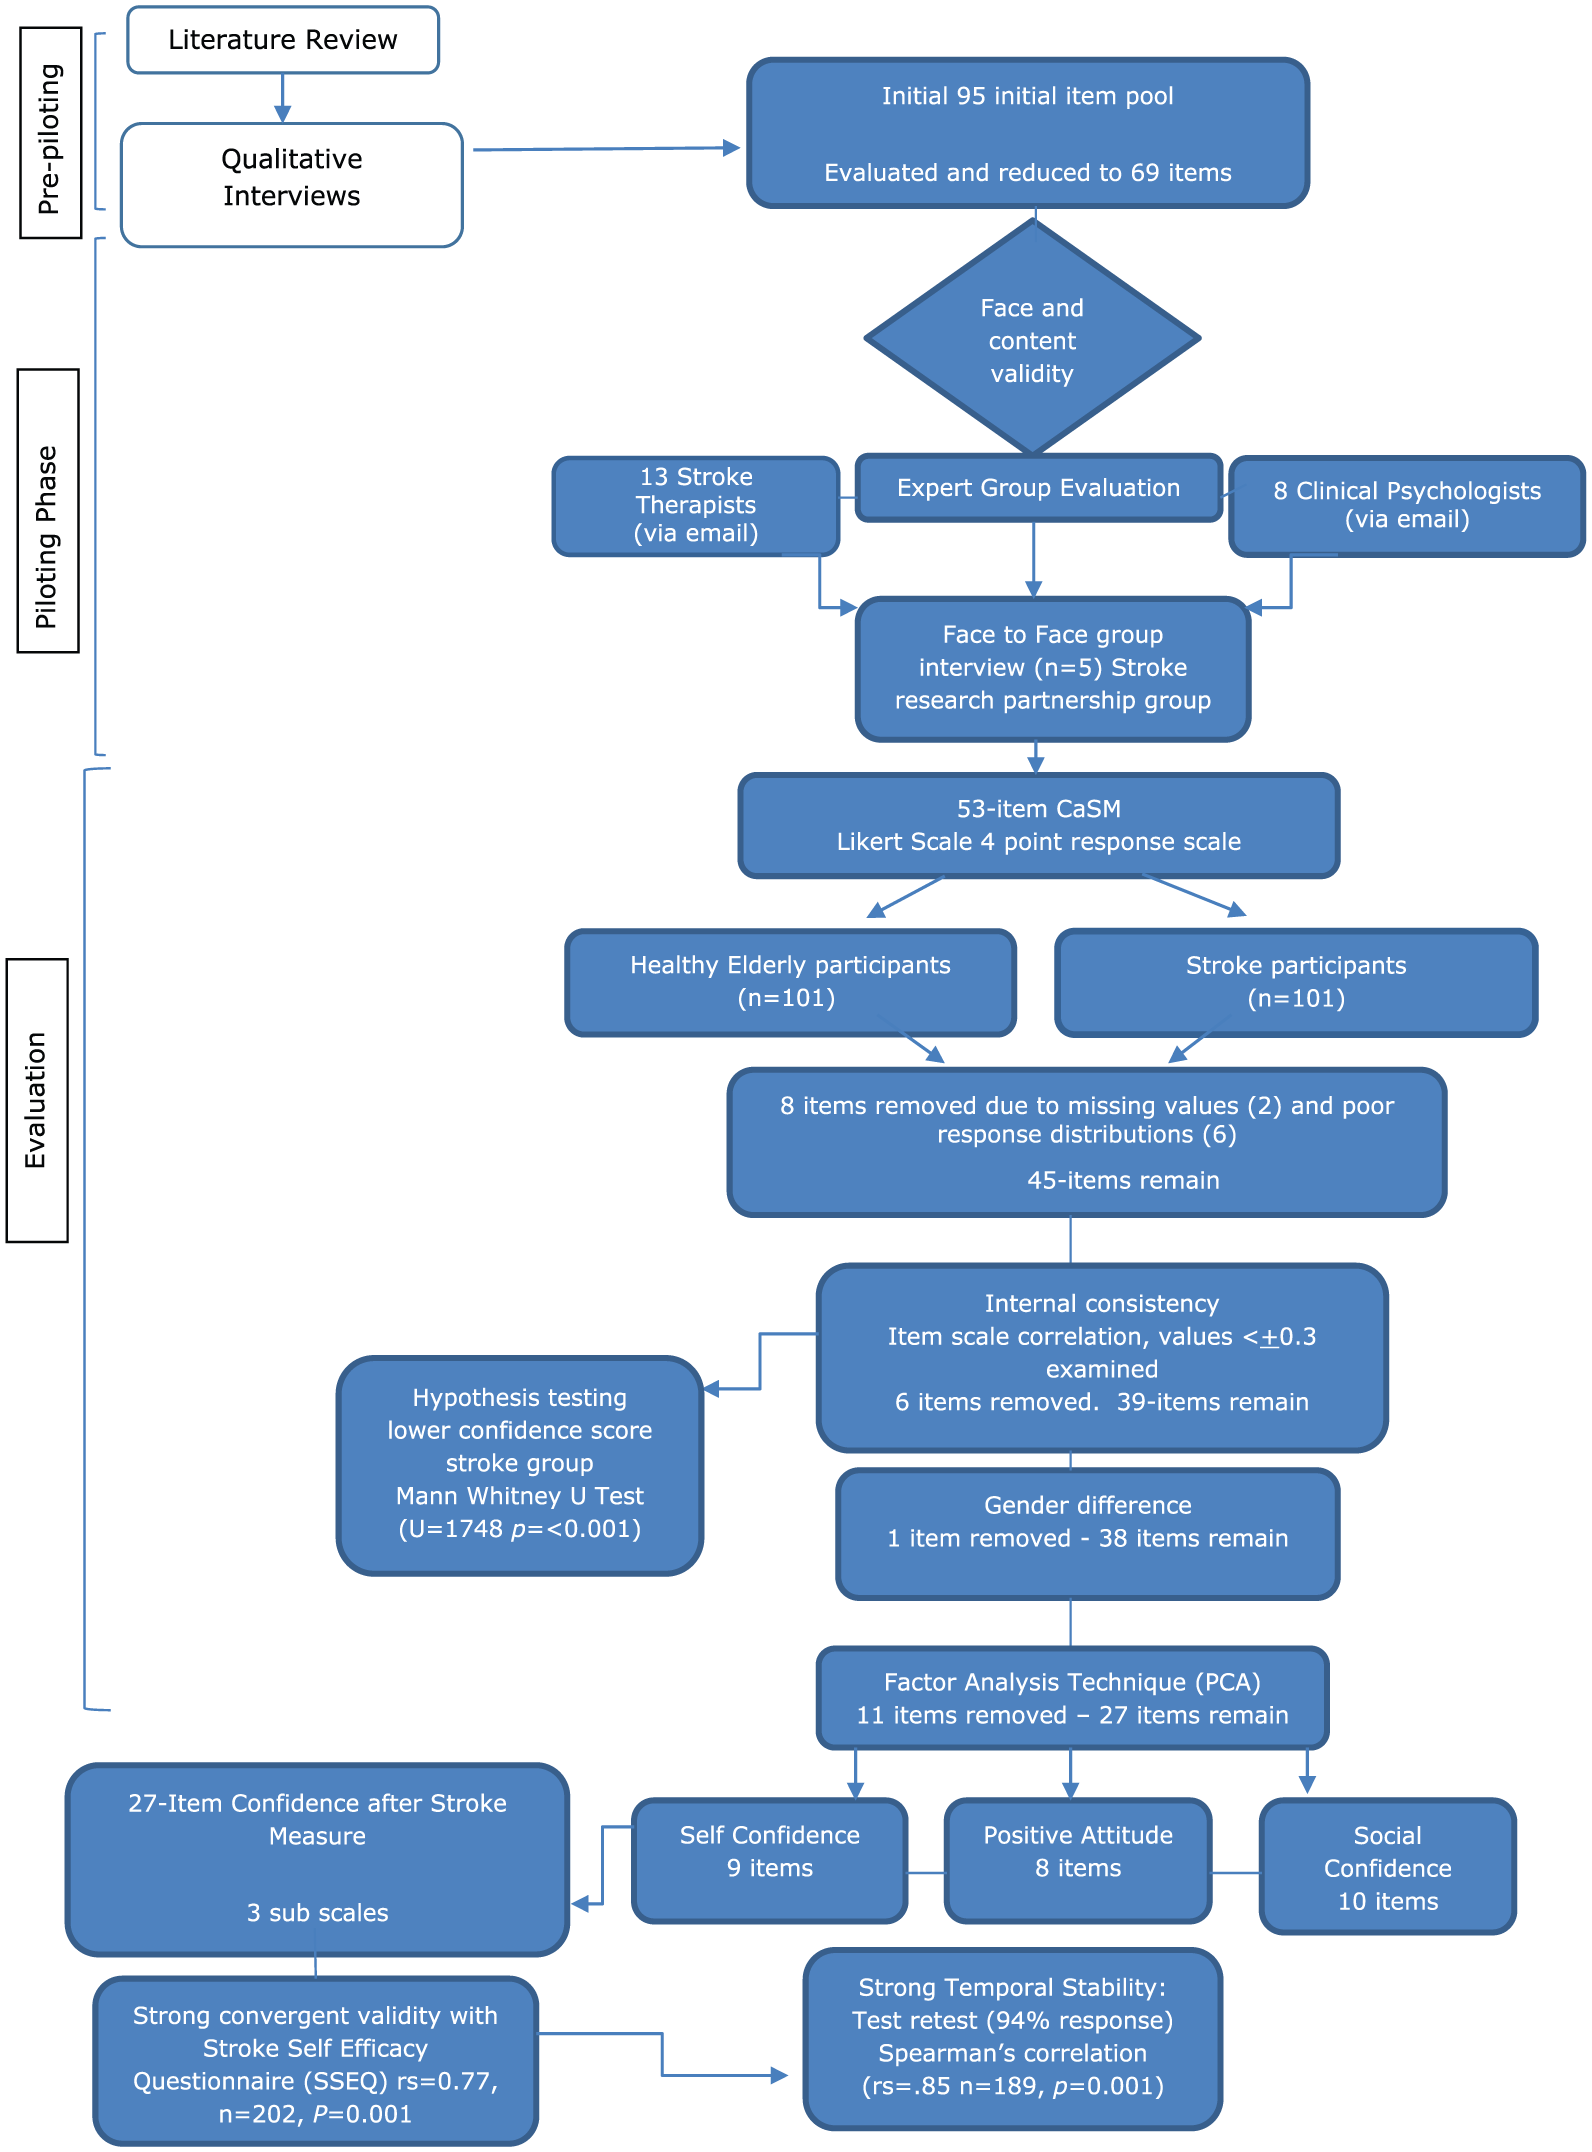
Flow Chart -Developing a Confidence after Stroke Measure (CaSM).
Phase 1: face validity and content validity testing
Expert opinion was used to establish face and content validity as advocated in measurement texts.9,10 A list of 95 statements were generated from a qualitative study 2 and the literature, see Supplementary Table 1. Where possible stroke survivors’ own words were used. Statements were evaluated by the author and supervisory team (N.L., P.L.). Complex statements, items with dual meanings and long repetitive statements were removed, and 69 statements were selected for further evaluation. A 69-item questionnaire was drafted and emailed to two expert groups, 13 stroke therapists (Group 1) and 8 clinical psychologists (Group 2). Participants were selected on the basis of their research and clinical expertise in stroke rehabilitation, known to the research team through stroke networks. A third group, five members of a stroke research partnership group were also invited to comment on the questionnaire. Their views were sought on the acceptability of the questionnaire to stroke survivors. All three groups gave their opinion on the response format and whether the items appeared to capturing all the important and relevant domains of confidence.
Based on the feedback from the expert groups, the questionnaire was reduced to 53 items.
In addition, a few statements were reworded for easier readability. Different scale formats were piloted with the stroke survivor expert group. A Likert scale was the preferred option as it was easily understood; this response format is advocated as a valid and reliable method to measure attitude, beliefs and opinion 10 and therefore appropriate to measure confidence. A three, four and five point response to each item were considered. A neutral response often leads to misinterpretation, and it is useful to force respondents to answer one way or another. 11 A four-point response was strongly advocated by stroke experts. Items were scored 0,1,2,3, for the positive items and 3,2,1,0 for the negative items, with a possible score range from 0 (low confidence) to 159 (high confidence).
Phase 2: assessment of reliability and convergent validity methods
Stroke participants were recruited from a variety of community sources. Information was posted on stroke organisation web sites, such as, the Stroke Association and Fighting Strokes, and interested participants were asked to contact the researcher. The researcher visited local stroke clubs and two lay conferences, one national and one local, and explained the study. Healthy elderly participants were recruited from a local retirement village, and activity clubs, such as bowls and tennis clubs. The researcher also used a search engine to identify activity groups with a national distribution, such as walking groups, luncheon clubs and the Dickens Society. A key person within each group was identified and asked to distribute questionnaires to willing participants. In addition, potential participants could contact the researcher independently.
Interested participants were sent or given an information sheet and a questionnaire pack. The questionnaire pack included a demographic information sheet, the 53-item version of the CaSM and the SSEQ. 3 The SSEQ 3 was included to assess convergent validity. Each item requires a rating of the level of ‘certainty’ to perform a task. Scores range from 10 (high confidence) to 0 ‘not at all confident’.
Instructions were provided on how to complete the questionnaires and a stamped addressed envelope was provided for returning the questionnaires to the researcher.
The CaSM was posted to all participants, four to six weeks later, and they were asked to return the completed CaSM in a pre-paid reply envelope.
The data were analysed using SPSS© version 22. Checks were conducted on 10% of all data records. These were randomly selected by a research administrator (G.A.) and checked by the primary researcher. Any data entry errors were corrected.
If necessary, the researcher made one telephone call to try and obtain any missing data. The proportion of missing values was calculated, items with high proportions were considered for removal as this suggests they are not acceptable to respondents. Items of which >85% of responses were in one extreme category were considered for removal as these did not add value but increased burden.
A chi-squared test for independence was used to compare the frequency of responses between the two groups. A Fisher Exact test was conducted on items where the conditions of the chi-squared were violated <5. 12 Items demonstrating statistically significant differences were examined for removal.
Item total correlations were calculated to assess homogeneity within the measure. A Mann–Whitney U Test was used to compare the stroke survivor group scores with the healthy elderly group scores, a statistically significant difference was expected. This test was also used to compare responses according to gender.
The sample size for a validation study of >100 is considered ‘excellent’. 13 However, exploratory factor analysis requires a sample of 200. 14 Therefore, the aim was to recruit 200 participants.
Internal consistency was calculated by using Cronbach’s alpha. 15 Test–retest reliability was assessed using Spearman’s correlation and The Wilcoxon Signed Rank Test.
The underlying factor structure of the CaSM was determined using a five-stage framework. 14 The suitability of the data to conduct an exploratory factor analysis was confirmed by assessing the sample size n > 200 and inspecting a correlation matrix for correlation coefficients of >±0.3. The purpose of an exploratory factor analysis was to decide how many components to extract. Kaiser’s criteria (eigenvalue >1 rule), 16 Scree test and 17 cumulative percent of variance extracted and parallel analysis 18 were all used to inform the component structure.
Results
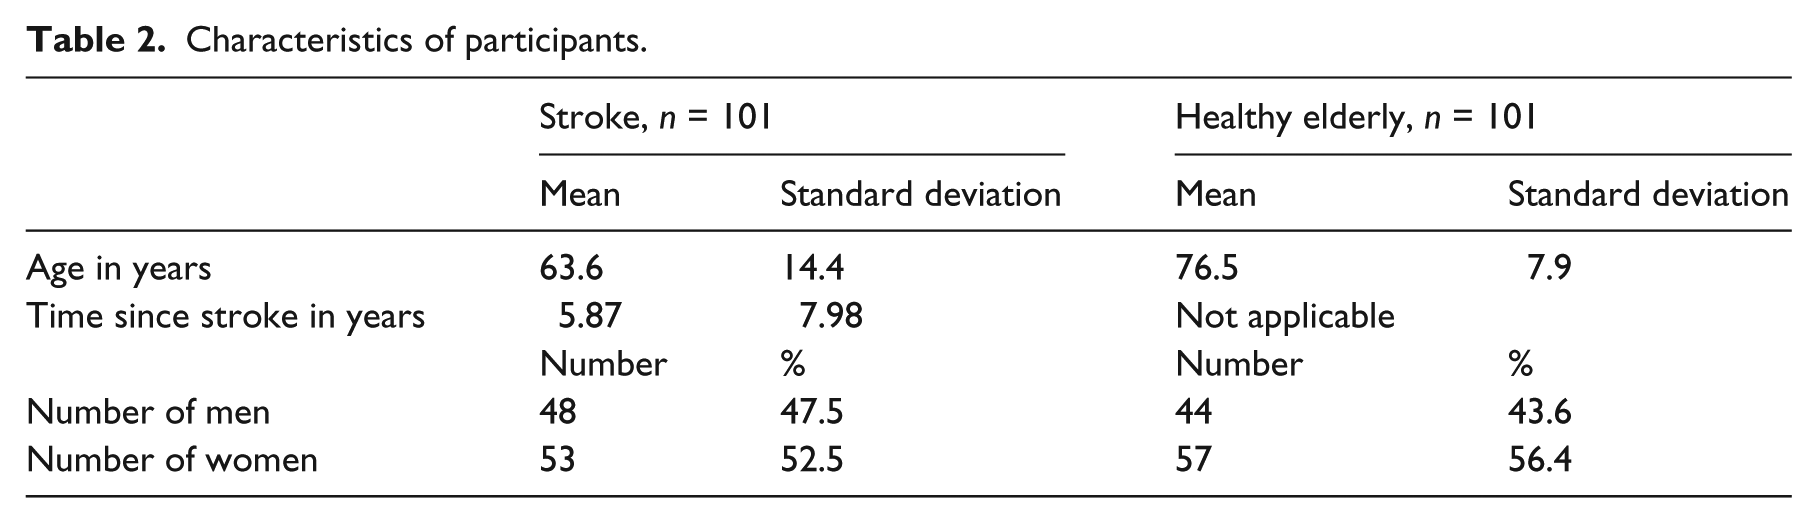
Two hundred and two participants returned the questionnaires (74%) of the 270 sent. Participants had a mean age of 70.1 years (SD = 13.3; range 22–97) and 92 (45.5%) were men. The groups were comparable in age and gender distribution, see Table 2.
Characteristics of participants.
The healthy elderly respondents were recruited from community groups (n = 96, 95%) and personal contacts (n = 5, 5%). The stroke respondents were recruited from stroke voluntary organisation groups (n = 41, 41% [including n = 13, 13% with self-reported aphasia]), stroke lay conferences (n = 17, 17%) and patient support websites (n = 9, 9%) networking with a stroke community, such as stroke meetings and university contacts (n = 19, 19%), Stroke News publication (n = 9, 9%) and a retirement village (n = 6, 6%).
The data were initially examined for item redundancy. Six items had poor response distributions, that is, >85% responses to the item were in the extreme category. Items 5 and 40 had 101 (50%) missing values, item 51 had 11 (5%) and item 37 had 19 (9.5%). There were eight participants who left a whole sheet of the questionnaire blank; this missing information was collected by telephone. Eight items showed a statistically significant difference between healthy elderly and stroke participants (P < 0.05). Three of these items (22, 43 and 53) also had poor response distributions and another item (51) had a high number of missing values and so they were removed. Four items (9, 29, 38 and 48) with statistically significant difference between healthy elderly and stroke participants were retained in the questionnaire for further analysis. Eight items were removed, as illustrated in Table 3.
Items removed due to poor response distributions or large number of missing values.
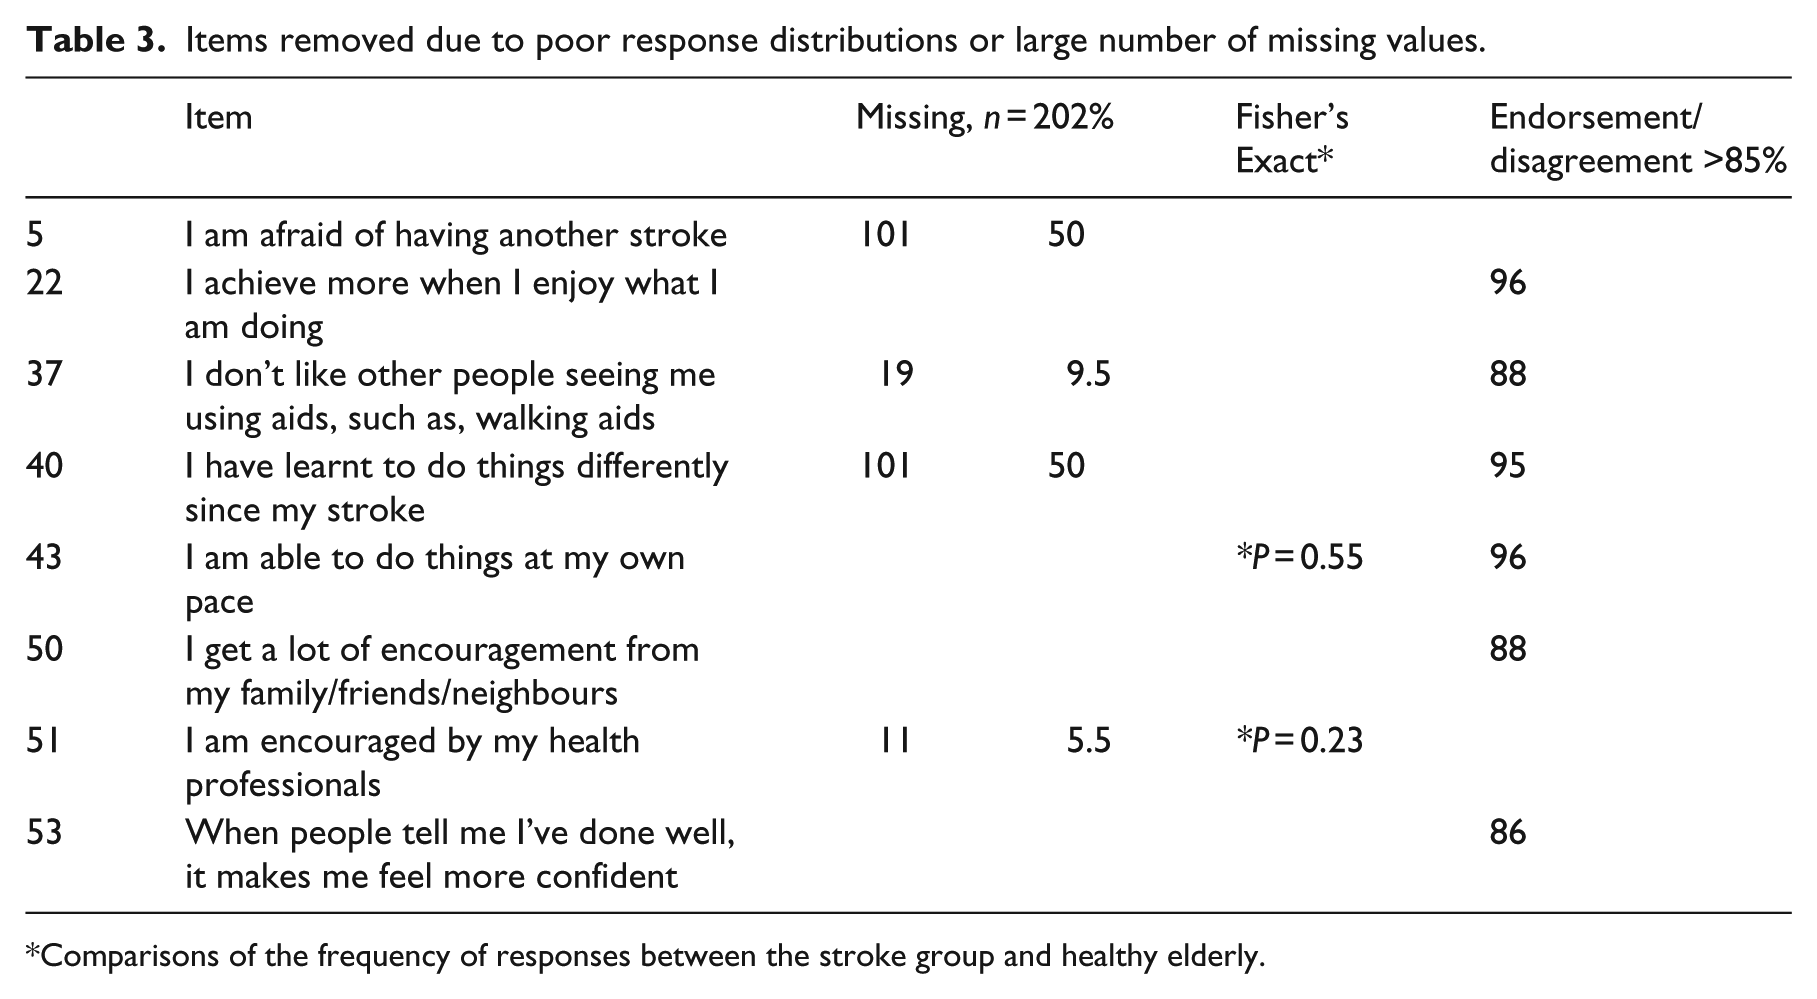
Comparisons of the frequency of responses between the stroke group and healthy elderly.
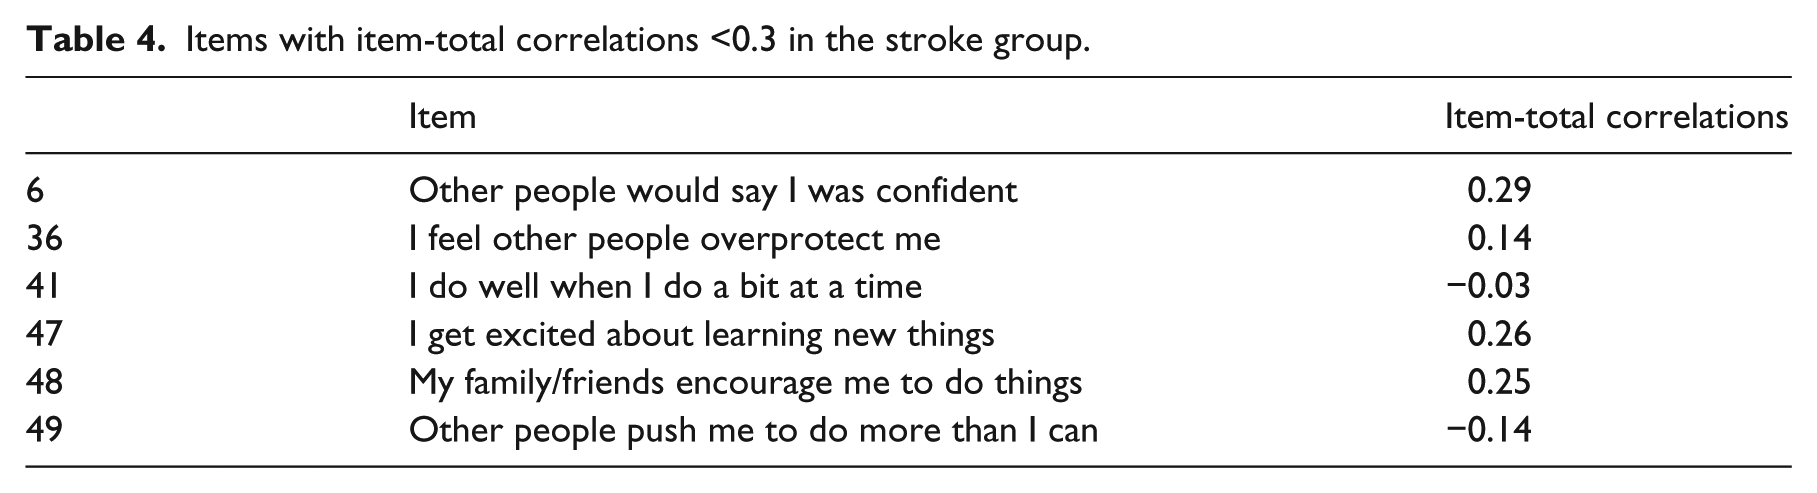
The internal consistency of the scale was α 0.93 in stroke participants and a = 0.93 in the healthy elderly participants. Six items had corrected item-scale correlations less than ±0.3 in the stroke sample (n = 101) and were removed. Results are shown in Table 4.
Items with item-total correlations <0.3 in the stroke group.
Following these analyses, the CaSM was reduced to 39 items. A Mann–Whitney U Test demonstrated a statistically significant difference between the healthy elderly and stroke group scores with higher scores in the healthy elderly group (u = 1748, P < 0.001).
The effects of age were also investigated. There was a weak significant correlation (rs = 0.25, n = 101, P = 0.001) between the CaSM and age in the healthy elderly group and a weak significant correlation in the stroke group (rs = 0.21, n = 101, P = 0.03). Responses of men and women were compared using the Mann–Whitney U Test. There was no significant difference between CaSM scores of men and women (u = 4403, P = 0.11). Each item was also examined for gender different responses using a chi-squared test. Item 9 ‘I am confident in my own home’ showed statistically significant differences between men and women and was removed (P = 0.04) resulting in a 38-item questionnaire.
A principal component analysis (PCA) with oblique rotation was performed on the 38 items using a five step approach. 14 The sample size was adequate (n > 200), with the majority of coefficients>±0.03. The Kaiser–Meyer–Olkin measure of sampling adequacy was 0.94 which exceeded the recommended value of 0.6 and the Bartlett’s Test of Sphericity reached statistical significance (P = 0.01) supporting the factorability of the correlation matrix. Eight items were removed at stage 1, a further three were removed at stage 2 of the principal component analysis. The items were as follows: even though I practice tasks, I don’t improve; I feel I can push myself to achieve; I can usually handle what comes my way; I do not have much to be proud of; I believe I am a failure; It is difficult to handle situations that are unplanned; I worry I am not safe to use electrical equipment or appliances; I have a fear of failure; I worry I will fall and hurt myself when I am out; I feel I am not very good company and I feel terrified when I try to do something new.
A final principal component analysis was conducted on the 27 items. A scree plot point of inflection showed a break after the fourth component. The parallel analysis indicated retaining two components, and a third component was also deemed appropriate to retain (eigenvalues = 10.50, 2.03 and 1.53). Pattern and structure coefficients for three components of the 27 items are illustrated in Table 5.
Factor structure (oblique rotation) of the CaSM (27 items).
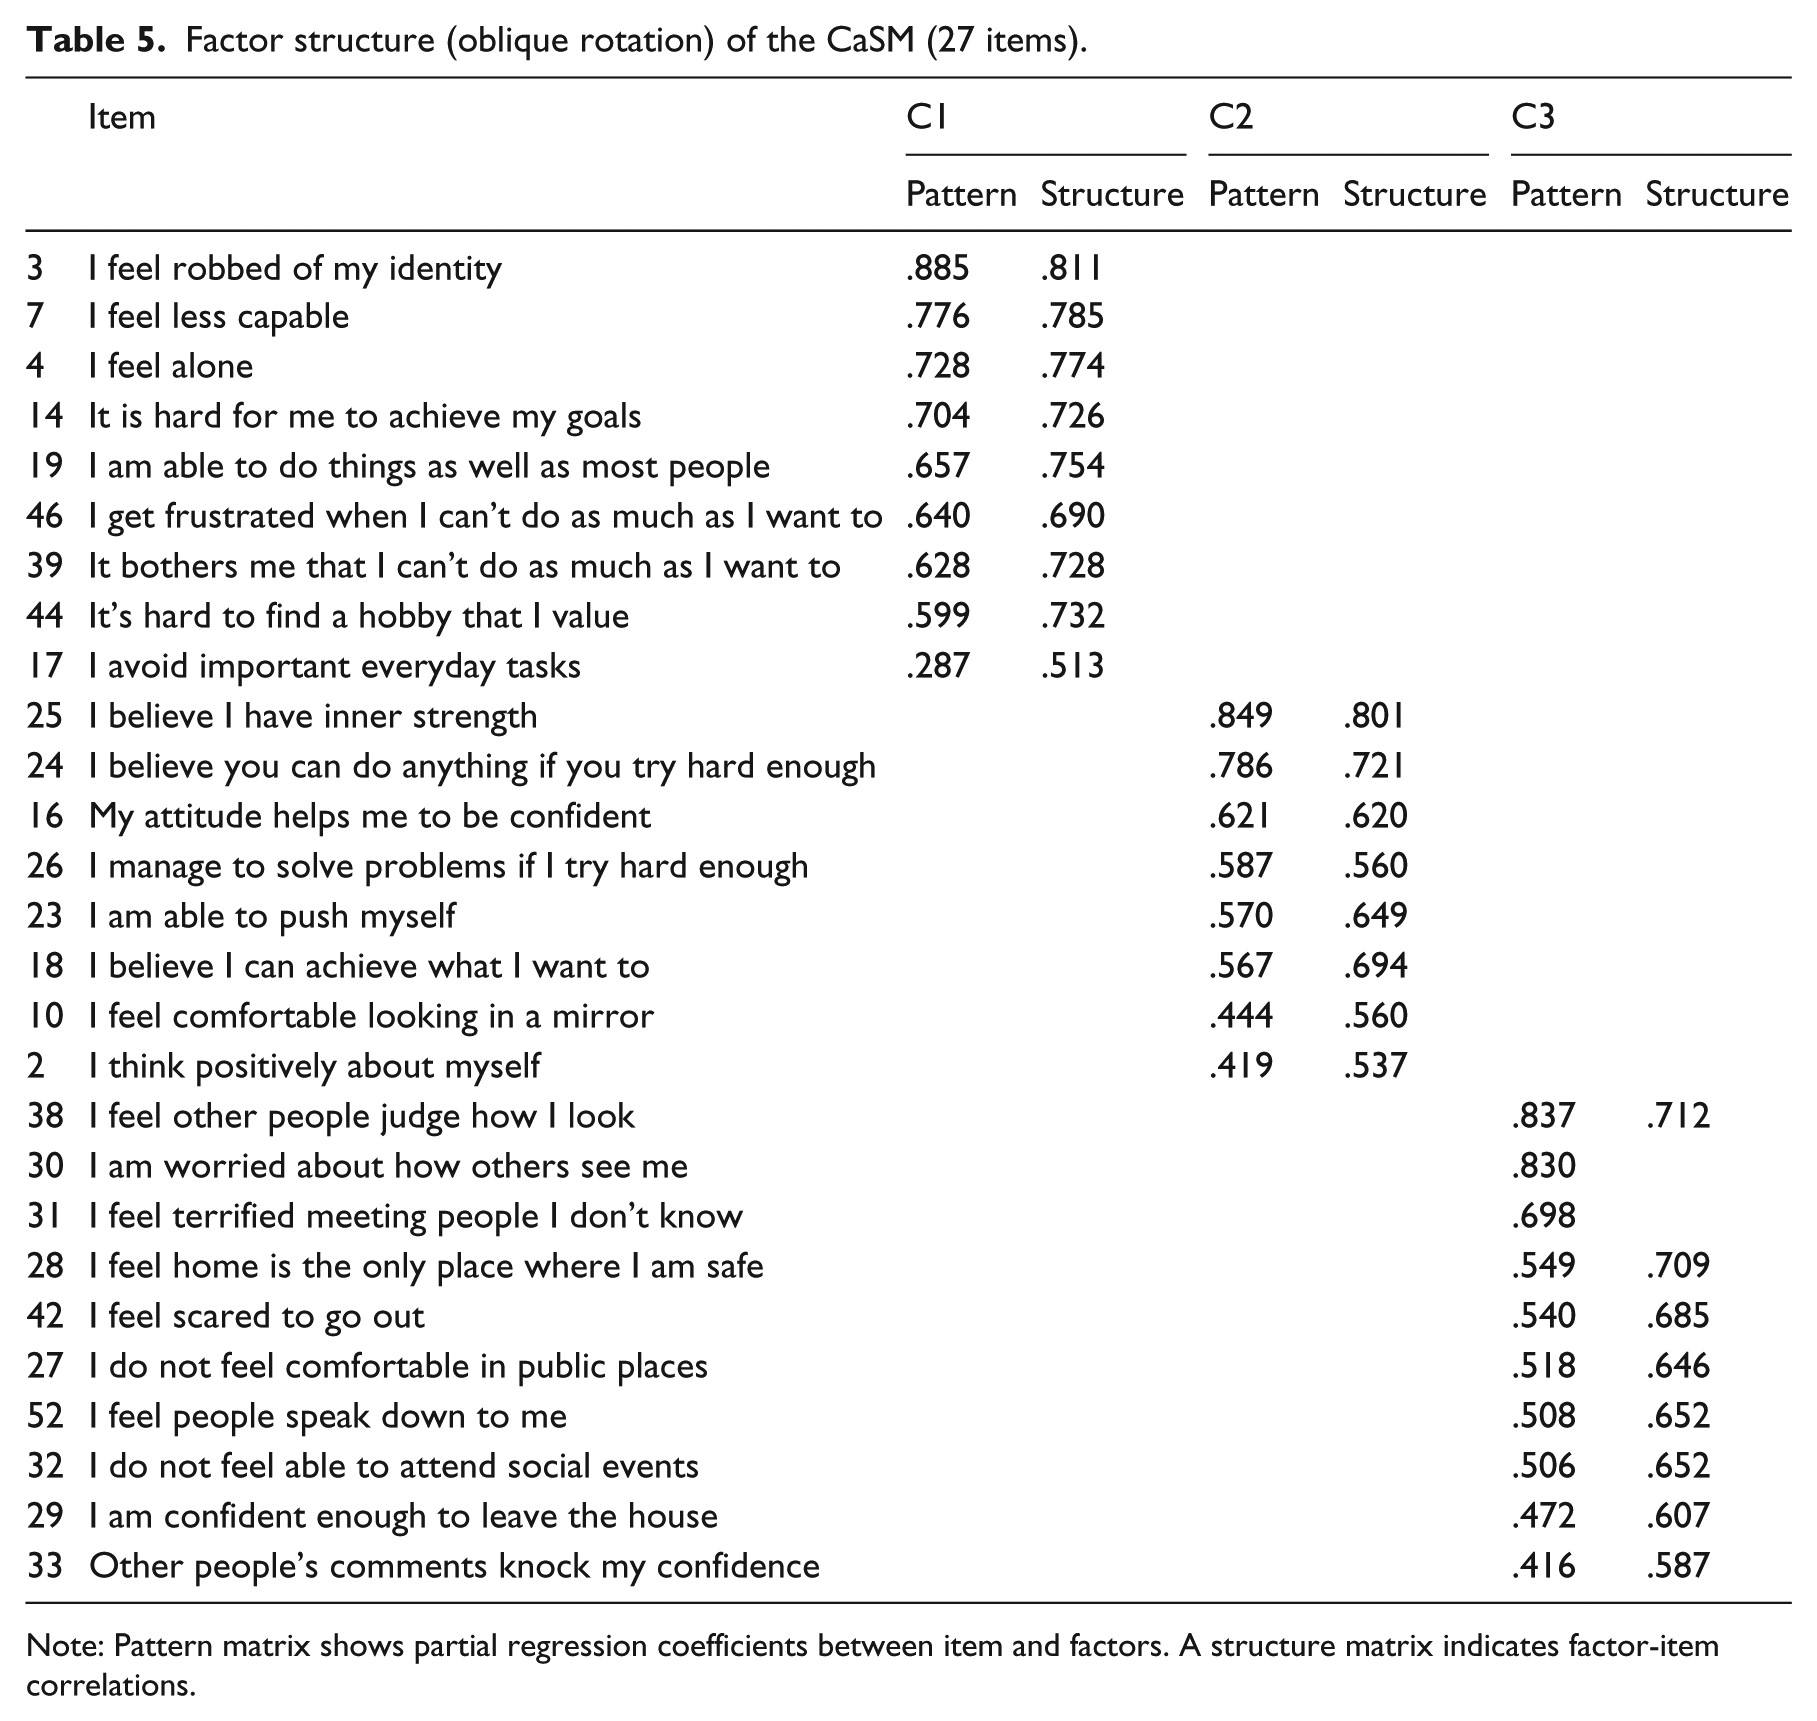
Note: Pattern matrix shows partial regression coefficients between item and factors. A structure matrix indicates factor-item correlations.
A three component solution explained 51.98% of the total variance. Component 1 contributed 38.9% of the explained variance, component 2 contributed 7.51% and component three 5.56%. The components were interpreted as self-confidence, positive attitude and social confidence.
The 27-item CaSM is presented in Supplementary Figure 2.
Internal consistency of the 27-item CaSM was calculated by repeating the Cronbach’s α co-efficient. The results indicated a high internal consistency, in both stroke, (α = 0.92) and healthy elderly participants (α = 0.90).
The internal consistency of the three components was also calculated using Cronbach’s α. The results indicated a high internal consistency for each sub-scale self-confidence, α = 0.89; positive attitude, α = 0.82; social confidence, α = 0.88.
Spearman’s correlation was calculated between the 27-item CaSM and the SSEQ. There was a high and statistically significant correlation (rs = 0.77, P = 0.001).
Of the 202 participants who agreed to be contacted, 189 returned the second questionnaire (94%). Spearman’s correlation revealed a strong correlation between the two time points (rs = 0.85, P = 0.001). A Wilcoxon Signed Rank Test showed no statistically significant difference between time points (P = 0.04).
Discussion
A stroke-specific measure of confidence, the CaSM was developed guided by the COSMIN checklist 7 in addition to health measurement texts.8,9 Psychometric evaluation of the CaSM indicated it had good content validity, internal consistency, reliability over time, convergent validity and comprised three subscales.
This systematic process tested the items with stroke survivors, ensuring that the questions and response scales were easy to understand and covered the relevant content. The response rate (74%) was higher than the expected response of 60% for health questionnaires, 19 suggesting the questionnaire even in the long format was acceptable to stroke survivors. However, the scale was shortened from 53 to 27 items, in an attempt to reduce burden on respondents, without losing items that underpinned the meaning of confidence, described by stroke participants. 2 This means it is likely to be an acceptable length for stroke survivors.
The sample size for the factor analysis was considered adequate. 20 Using multi methods to decide how many components to extract is supported by the literature.14,21 This factor analysis resulted in a three-factor solution representing self-confidence, positive attitude and social confidence explaining 52% of the variance. Each component demonstrated good interrelatedness between items and was unidimensional. 22
Support for convergent validity was provided by a high correlation, with the SSEQ. 3 The SSEQ assesses confidence in relation to functional performance and self management, but does not measure social or psychological components of confidence. The CaSM covers these additional components.
The limitations of the study were that the contact sheet did not include a question about ethnicity, so it was not possible to check that the questions were appropriate for those in different ethnic groups. There were 13 participants (6%) who were aphasic, indicate that the CaSM can be completed by some people with communication problems. However, it would be useful to establish the level of communication skills required to complete the measure.
Further research is needed to confirm the suitability of the CaSM as an outcome measure. This requires determining the responsiveness to change over time and the minimal clinically important difference in score. Rasch analysis, 23 which uses item response theory as opposed to classical test theory, could be used to examine any further item redundancy to confirm the overall fit of the model and the dimensionality.
The primary goal was to develop systematically a confidence measure that could be used to guide appropriate treatment. Low levels of confidence are often a barrier to progress in rehabilitation 3 and may prevent people from achieving their recovery potential. Identifying and monitoring confidence levels may help ascertain whether low confidence is a barrier to recovery.
In conclusion, the CaSM is a comprehensive measure of confidence that has demonstrated good psychometric properties. It can measure subcomponents of confidence, that is, self-confidence, positive attitude and social confidence. This is useful as stroke survivors may have self-confidence in their daily activities, for example, but may lack social confidence. The CaSM was acceptable to stroke survivors. Evaluating confidence levels in order to facilitate and target appropriate rehabilitation is necessary to enable people to be optimistic about leading meaningful and active lives after their stroke.
Clinical Messages
The Confidence after Stroke Measure (CaSM) is the first known comprehensive measure of confidence to be developed for use specifically after a stroke.
It was systematically developed and found to be valid and reliable.
The CaSM is a practical self-reporting measure, acceptable to stroke survivors.
A stroke social confidence scale is novel.
Footnotes
Authors’ note
Gail Arnold did the data checking and is referred to in the article as (GA).
Declaration of Conflicting Interests
The author(s) declared no potential conflicts of interest with respect to the research, authorship, and/or publication of this article.
Funding
The author(s) disclosed receipt of the following financial support for the research, authorship, and/or publication of this article: Stroke Association 10.13039/501100000364 Doctoral Research Training Fellowship 2012-2015.
References
Supplementary Material
Please find the following supplemental material available below.
For Open Access articles published under a Creative Commons License, all supplemental material carries the same license as the article it is associated with.
For non-Open Access articles published, all supplemental material carries a non-exclusive license, and permission requests for re-use of supplemental material or any part of supplemental material shall be sent directly to the copyright owner as specified in the copyright notice associated with the article.