
Abstract
Introduction
As healthcare systems around the world move towards fee-for-service funding models, the Department of Health for England has embarked on a programme called ‘Payment by Results’. 1 In the UK, the National Health Service (NHS) is actually made up of four separate health services (England, Scotland, Wales and Northern Ireland), each with slightly different contracting arrangements. The model described in this article relates, so far, to the English experience. However, the issues are wide-reaching and the principles discussed have relevance, not only for other parts of the UK, but also for other countries with socially supported health systems.
The Payment by Results programme introduces activity-based payment systems to reimburse providers on a case-by-case basis – as opposed to a ‘block contract model’, in which the provider is paid a flat annual fee to provide an agreed level of service. Payment is made according to a standard national ‘tariff’ – the price tag attached to any unit of care, wherever it is delivered. The challenge, however, is to develop a casemix classification and associated payment model which are fair to both the provider and purchaser, by accounting adequately for the mix and complexity of patients treated and the care and resources involved.
Rehabilitation poses some particular challenges for casemix development. These are described in a companion paper, alongside a description of other international casemix and payment models to explore how other countries have addressed this problem. 2 Readers unfamiliar with this area of work may find it helpful to read that article first, as it provides useful contextual background to this paper. Payment models range from ‘episode rates’ (prospective payment of a ‘fixed tariff’ for each episode regardless of length of stay), to ‘bed-day’ or ‘per diem’ rates (payment at a standard daily tariff). Both systems have disadvantages, so other alternative payment models have been explored for rehabilitation. 2–5
The English casemix classification of ‘Healthcare Resource Groups’ (HRG version 4) currently includes just 20 categories for inpatient rehabilitation, based on diagnostic codes. However, the Department of Health for England has accepted that further refinement is required for the classification to be fit for the purpose of defining casemix and associated tariff development. Learning from international casemix models, the Expert Reference Panel for HRG Development in Rehabilitation has proposed a casemix and costing methodology based on patient complexity and patient level costing.
The purpose of this article is (a) to describe the rationale and methods that will be used for collection and collation of casemix data and costing information and (b) to present preliminary data of the type that will underpin the development of a multilevel weighted payment model, and ultimately tariff development in the context of rehabilitation in England. The model is presented in the context of neurological rehabilitation, where existing casemix models perform particularly poorly. However, it is expected to have application in other areas of rehabilitation and long-term care.
Rationale for development of a new methodology
Diagnosis is a relatively poor indicator of costs for in-patient rehabilitation, 6,7 where nursing and therapy staff input (as opposed to medical treatments) are the major cost-indicators. 8–10 Many of the well-established international casemix systems use function-related casemix classifications, based on measures of physical independence in activities of daily living (e.g. the Functional Independence Measure (FIM)) as a surrogate for resource requirements. However, for reasons described in the companion paper, 2 these do not perform well as predictors of cost in patients with complex neurological conditions 11 which form the bulk of the caseload for the majority of specialist rehabilitation services in the UK. Therefore, although these international casemix systems provide a useful model to build on, they are not in themselves fit for purpose as a casemix and costing model for rehabilitation in the UK.
In addition, the UK has a very different health culture from that in the United States or Australia. The UK NHS provides the most comprehensive publicly funded healthcare system in the world. In the light of current plans to merge health and social services, rehabilitation services have an increasingly important role, because the State will at last be able to recoup the cost benefits of improved independence through long-term savings in the cost of ongoing care. Under these conditions, longer lengths of stay in rehabilitation may be supported to allow patients with more complex needs to reach their full potential, providing they can be justified on grounds of cost-efficiency (i.e. it can be demonstrated that the savings in ongoing care offset the initial investment in rehabilitation). 12,13 However, this requires a different approach to payment. Patients with complex needs are expected to incur higher treatment costs, which will vary over time. Fair payment should be weighted in proportion to costs of providing treatment, and should also vary in relation to those costs, as the patient’s needs change over time.
Brief overview of proposed casemix and payment model
The Department of Health for England has defined three levels of specialization for rehabilitation services 14 which are detailed in the companion paper. 2 Level 1 (tertiary) and level 2 (district level) specialist services are those with the skills and resources to provide rehabilitation for more complex cases. They will be designated by the service commissioners in line with predefined criteria. 14 The proposed multilevel payment model will be applied in these designated units.
To improve the sensitivity of the casemix classification, episodes of rehabilitation within each HRG category will be adjusted for case complexity. The weighted per diem payment model is based on serial complexity ratings, which will be measured using the Rehabilitation Complexity Scale 11 (see below).
The payment is weighted in proportion to the differential costs of treating patients in five bands of complexity, based on the total RCS score.
The daily payment rate is adjusted according the level of complexity, and so allows for change over time.
Payment for the overall episode is calculated at discharge, depending on the number of days the patient spent at any given complexity level.
The critical feature of this casemix and payment model is that it is fair to both payer and provider. The provider receives reimbursement to meet the additional costs of providing for patients with complex needs. However, the payer does not continue to pay high rates for a patient who had very complex needs on admission, but who progresses to lower levels of need in the course of their recovery. Complexity may go up or down, but is expected to fall for most patients over time as they regain independence, and the corresponding reduction in payment provides an incentive towards early discharge.
In order to claim the higher rate payments for patients with complex needs, specialist services must also be able to demonstrate that they provide the additional inputs to meet those needs. Similarly, payers who meet those extra costs are entitled to ask for evidence that their investment has led to meaningful outcomes in terms of improved independence, reduced ongoing care costs, or at least the attainment of individual goals for rehabilitation. Therefore a national data set has been established to record ‘needs’, ‘inputs’ and ‘outcomes’. Service designation will be contingent on data set reporting for all specialist inpatient neurorehabilitation episodes. 14
How the data will be gathered
In 2008, the UK National Institute for Health Research awarded a five-year Programme Grant for the development of a nationally coordinated approach to casemix development and person-centred commissioning for the provision of neurorehabilitation services. 15 The programme is registered as a Payment by Results Improvement Project and is being undertaken in collaboration with the British Society of Rehabilitation Medicine and the NHS Information Centre. The Australasian Rehabilitation Outcomes Centre (AROC) is a third collaborating organization, as our proposed methodology is modelled on systems which have been developed over the last 10 years in Australia.
An agreed national data set has been established and is currently being collated through the UK Rehabilitation Outcomes Collaborative (UKROC) database. The database will ultimately provide centralized collation and analysis of patient episode data from all level 1 and level 2 specialist inpatient neurorehabilitation services. Once the payment model is fully developed, the database will have the functionality to provide automated calculation of the weighted payment for each episode from serial RCS ratings and length of stay data. In addition to providing information on casemix and costing to inform development of national tariffs, the database will also have future application for benchmarking of services, and prospective cohort analysis to evaluate effectiveness and cost-efficiency in different service models. Although primarily designed for implementation of Payment by Results in England, the UKROC database is available to all UK countries.
Data collection systems – the UKROC data set and tools for data collection
The full UKROC data set (see Appendix 1) includes information on patient demographics, response and waiting times, diagnosis/procedure codes, length of stay and discharge destination. It also includes a series of tools to capture: (a) complexity of rehabilitation needs, (b) the inputs provided to meet those needs and (c) outcomes. The system is hierarchical, more detailed tools being used to define higher levels of complexity in low volume/high cost services, as shown in Figure 1. The payment model described here is designed for level 1 and 2 specialist services.
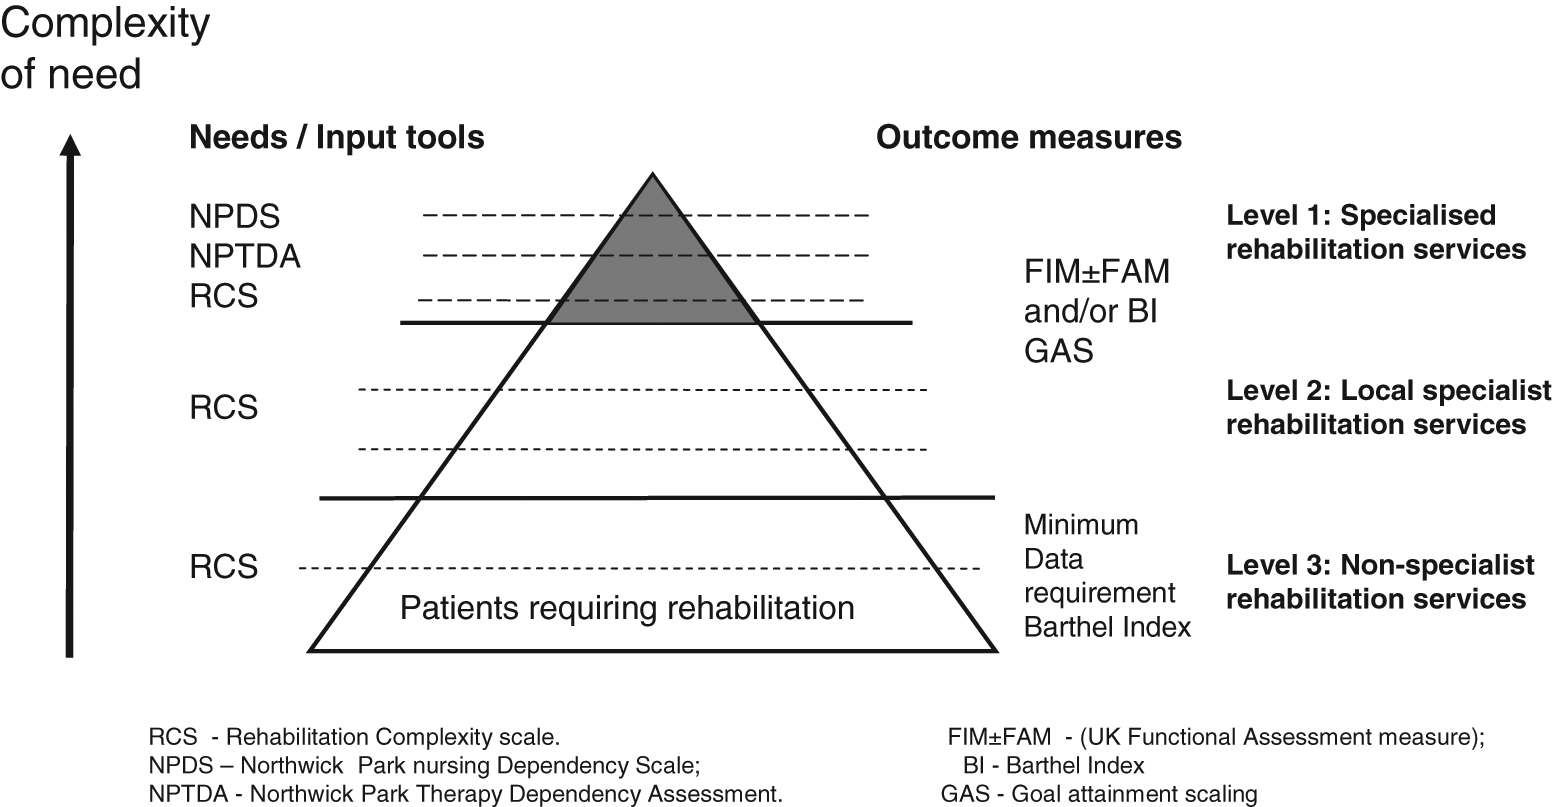
Tools for measuring complexity of need, inputs and outcomes across the three levels of rehabilitation service provision. A hierarchical system of data collection has been developed, so that low-cost/high-volume services are not overburdened by data collection. The RCS and Barthel Index offer simple practical measurement of complexity and outcome in the level 3 and some level 2 services. For level 1 services, the Northwick Park Dependency Scales and the Functional Assessment Measure (with optional goal attainment scaling) provide more detailed definition of the needs and interventions as well as opportunities for evaluation of outcomes and cost-efficiency in patients with complex needs.
The tools by which this information is gathered have been previously developed and validated, but are undergoing further development in the course of the programme to adapt them for the various different contexts in which they are to be applied.
Complexity of rehabilitation needs is captured by the Rehabilitation Complexity Scale (RCS) – a simple measure of the requirements for care, nursing, therapy and medical management. 11
Rehabilitation inputs are captured by the Northwick Park Dependency scales. These are used to identify the rehabilitation resources provided in relation to caseload complexity: The Northwick Park Nursing Dependency Scale (NPDS)
16,17
provides an assessment of care and nursing needs and translates by way of a computerized algorithm to an estimation of nursing and care staff hours.
18
The Northwick Park Therapy Dependency Assessment (NPTDA)
19
is the therapy equivalent, which collates therapy inputs from the multidisciplinary team and also translates by a computerized algorithm into an estimation of therapy hours for each discipline (including medical staff). These tools are designed to be used either prospectively to capture ‘needs’ or retrospectively to capture ‘inputs’ actually provided.
19
In the context of this study, they are applied retrospectively as a measure of the resources (staff time) that were used.
Outcomes. All units are asked to collect a minimum of standardized outcome data which includes either a Barthel Index, 20 the FIM21 and/or UK Functional Assessment Measure (UK FIM+FAM). 22 (These outcome measures were chosen because previous work has shown that 95% of specialist rehabilitation units in the UK were already using one or more of them as part of routine clinical practice. 23,24 ) Recording of goal attainment scaling (GAS) offers a further non-mandatory option for capturing individualized person-centred outcomes, where providers consider that the standardized measures fail to capture the intended goals for treatment. 25,26
Costing methodology
In 2009, the Department of Health for England published standards for patient-level costing. 27 Few services in the UK have patient-level costing systems sophisticated enough to allocate the direct costs of treatment to individual patients prospectively. Instead, we have taken a pragmatic approach.
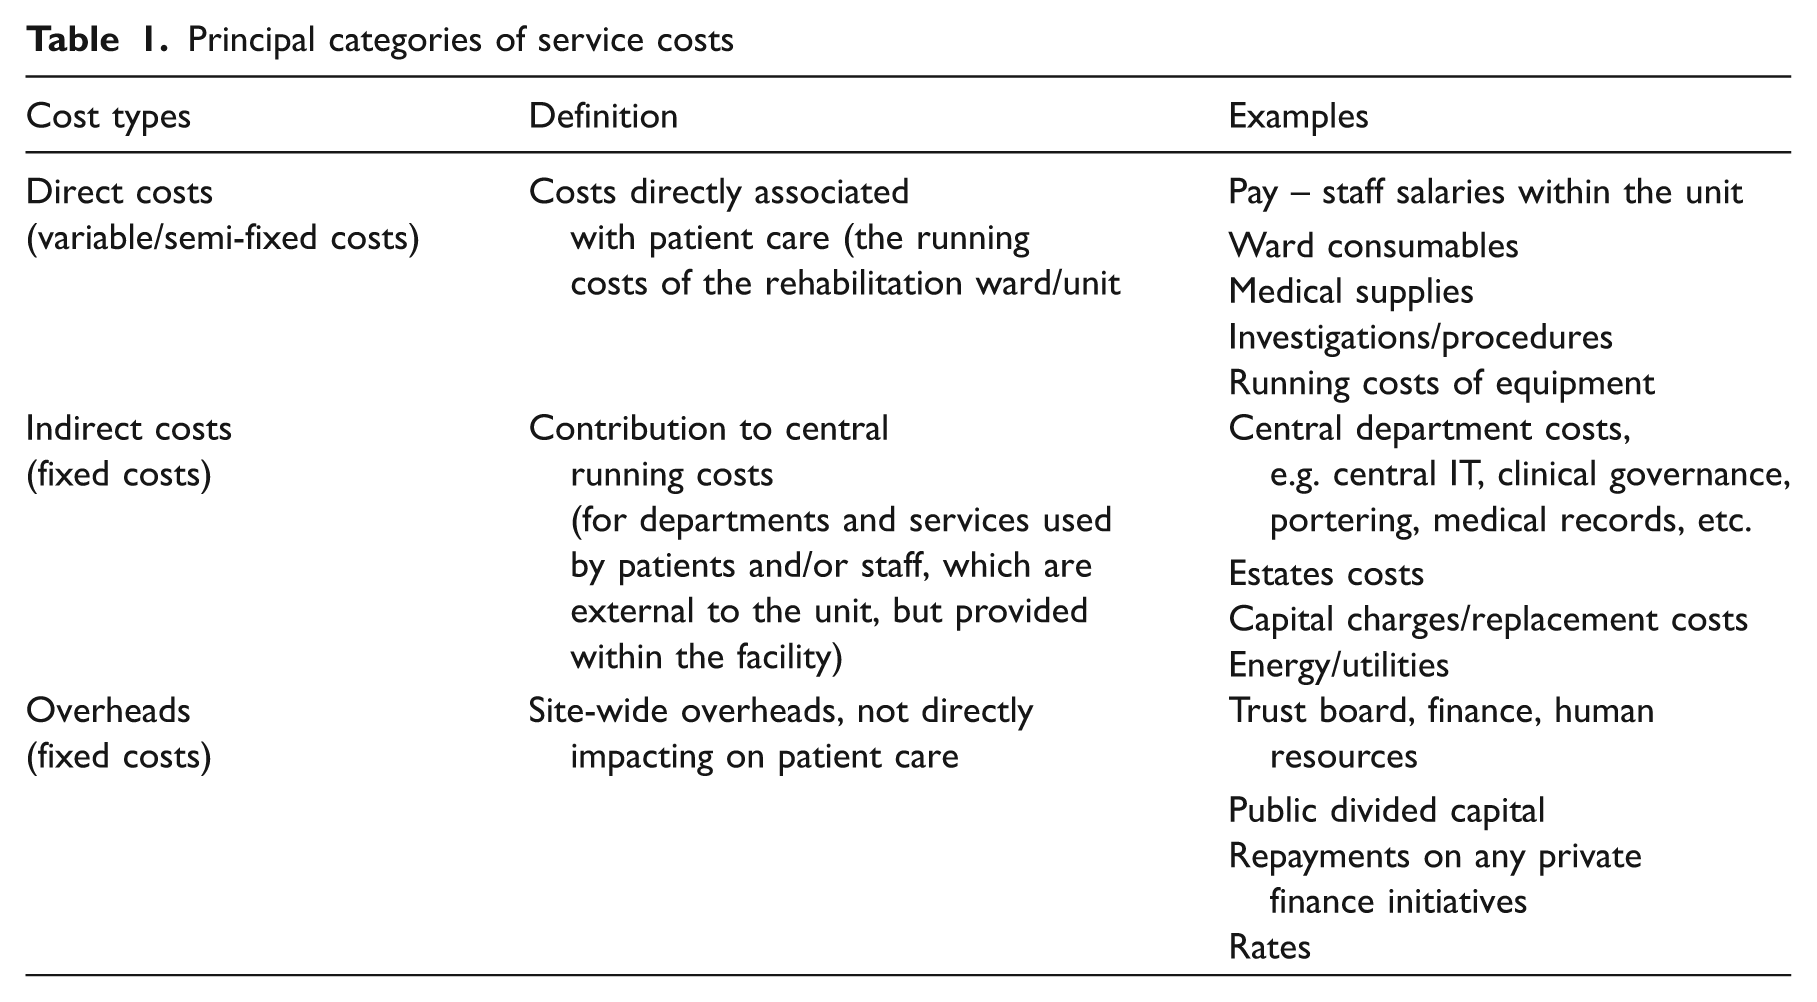
Service costing information is gathered from retrospective analysis of unit budget statements and accounting costs. Reported costs are then verified by site visits to ensure that there is a consistent approach to cost definition, attribution and allocation. A standard template has been devised for attributing individual lines within the budget statement to different cost types, based on the Department of Health for England’s Patient Level Costing Standards. This will allow more detailed future analysis to identify the source of any large cost variances between different services. As a starting point, costs are collated under three main cost types (‘direct costs’, ‘indirect costs’ and ‘overheads’) as shown in Table 1. The majority of direct costs vary with patient throughput or complexity, and are either ‘variable’ (e.g. staff pay, consumables) or ‘semi-fixed’ (ward and administration) costs; while indirect costs and overheads costs are largely ‘fixed’.
Principal categories of service costs
Bed day costs and weighted costing model
At the simplest level, average bed day costs may be derived from the total annual cost divided by the annual occupied bed days as shown in Figure 2a. However, these do not take account of the differential costs of treating patients with complex needs. The weighted bed-day costing model has been developed allow for this variation in cost.
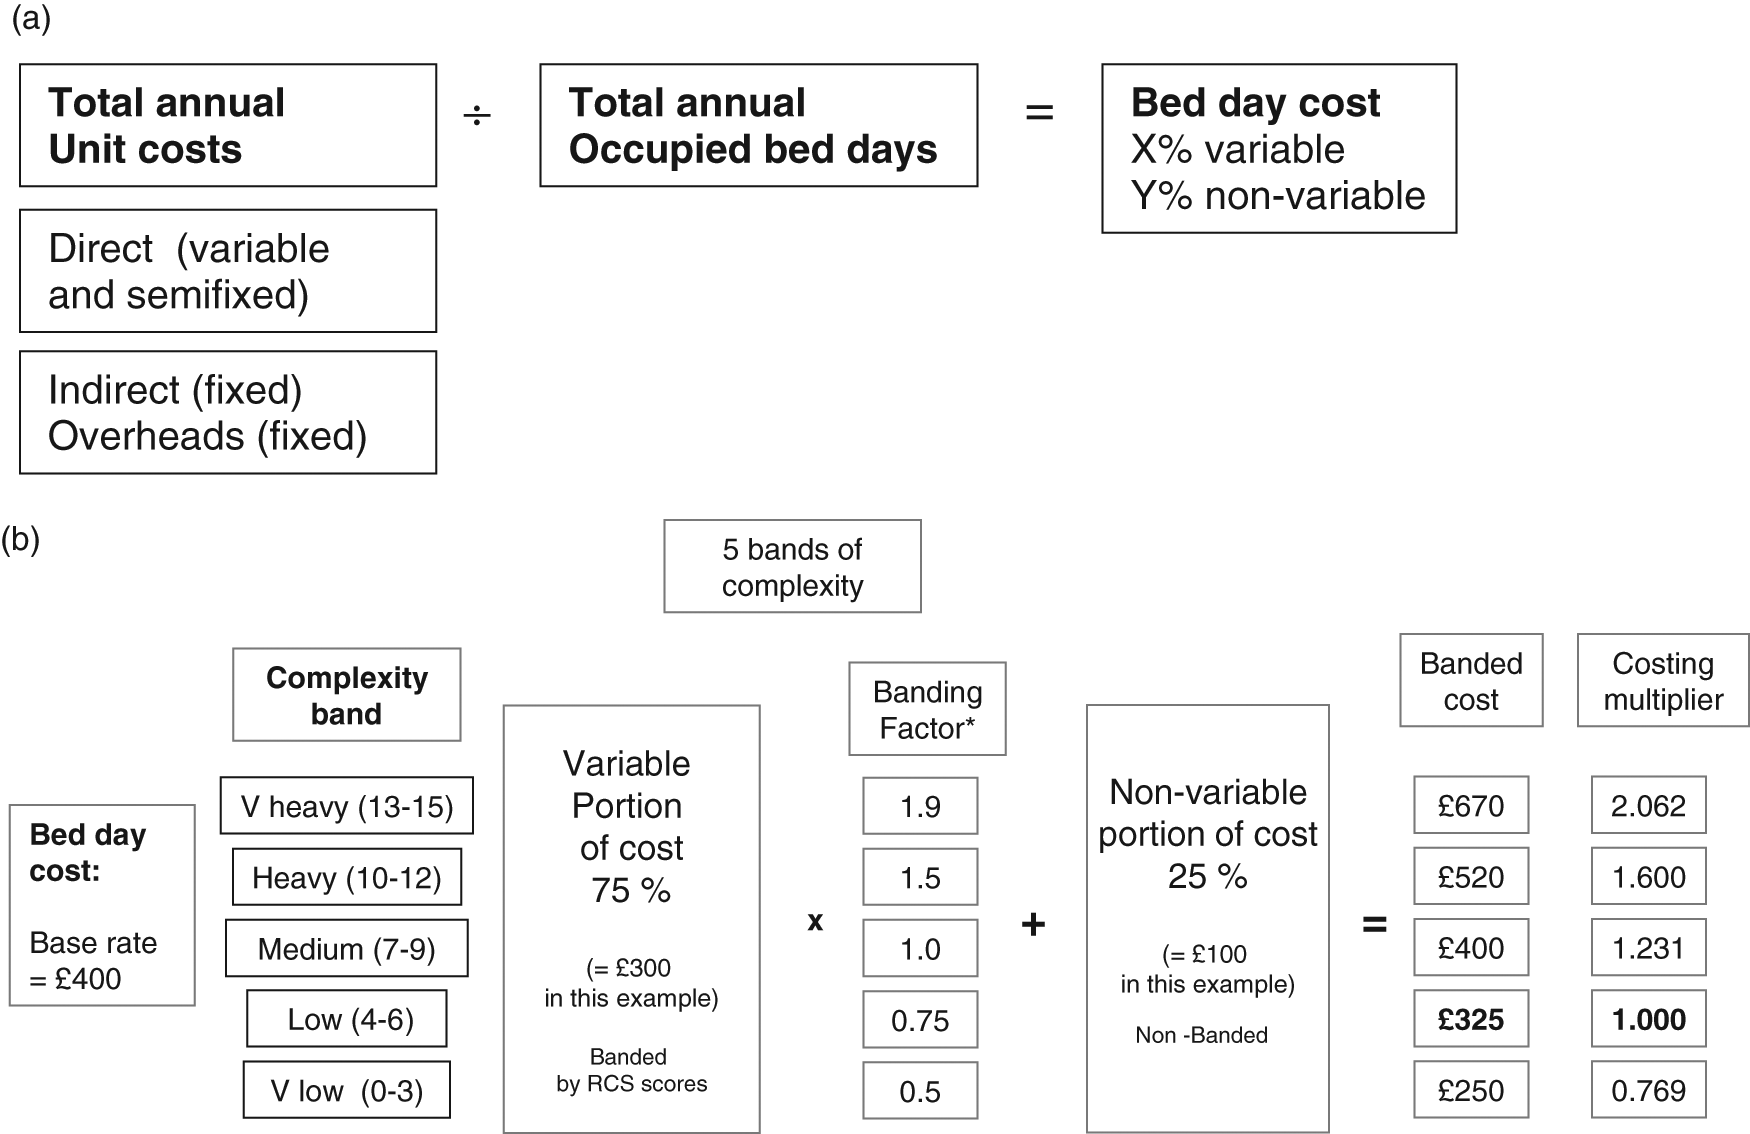
Simple and weighted costing models. (a) Simple costing model. (b) Weighted costing model. See Table 3 for derivation of the banding factor. (a) Shows how the fixed and variable portions of the bed-day cost is derived from the patient level costing figures. (b) For the purpose of illustrating the model simply, a base rate of £400 per bed-day was taken, giving a variable portion (75%) of £300 and a fixed portion (25%) of £100. Multiplication of the variable portion only by the banding factor then provides the banded costs from which a set of costing multipliers is derived. *See Table 3 for derivation of the banding factor.
In this model, weighting is applied only to the variable proportion of the bed-day cost, which is expected to vary with patient complexity. The key determinants of rehabilitation complexity are the requirements for nursing, therapy and medical care, and staff time makes up the greatest component of the variable costs. In our weighted model, the total rehabilitation complexity score is used to band patients into five different levels of complexity: very low (RCS 0–3), low (4–6), medium (7–9), high (10–12) and very high (13–15). Information derived from parallel application of the Northwick Park Dependency Scales is then used to determine the relative proportions of staff time associated with each complexity band. This staff time ratio is then applied as a banding factor to the variable portion of the bed-day cost to derive a banded cost, from which a costing multiplier is developed, as illustrated in Figure 2b.
Exemplar of the weighted costing model based on preliminary data collected in one service
Development of the weighted costing model is best understood through an illustrative example. Preliminary data have been collated from one service to demonstrate how this model will be applied.
The Regional Rehabilitation Unit at Northwick Park Hospital provides a tertiary (level 1) specialist inpatient neurorehabilitation service for younger adults (mainly aged 16–65 years) with complex neurological disabilities. The unit has a ring-fenced budget, and analysis of the budget statement and accounting figures from 2008/9 demonstrated that the variable costs made up approximately 75% of the total annual costs, with non-variable (fixed and semi-fixed) costs accounting for the remaining 25%.
Within this service, complexity (RCS) scores, and dependency scores (NPDS and NPTDA) scores are routinely collected at fortnightly intervals for all patients. The scores are recorded as part of routine care-planning, and collated in the main multidisciplinary ward round. Now that all staff are familiar with the tools and fully trained in their use, the dependency scores take 5–10 minutes to rate per patient, and it takes no more than 5–7 minutes to record RCS scores across the whole ward (24 beds). Staff use the information on a daily basis for clinical planning and decision-making, and so do not report excessive burden in gathering these data.
During the 30-month period between June 2006 and December 2008, 1200 parallel ratings were collated for the consecutive cohort of all admitted patients – a total of 179 cases. The mean age of this sample was 44 years (SD 14.8) and the male : female ratio was 110 : 69. A total of 139 (78%) had acquired brain injury (49% stroke, 14% traumatic and 14% other causes); 20 (11%) had spinal cord injury and 20 (11%) other neurological conditions). The mean length of stay was 78 days (SD 64, range 12–469). The relationship between the RCS, FIM, Barthel Index and dependency scores in this series is described elsewhere. 11
The first step in development of the weighted costing model was to determine the relative proportions of staff time associated with each of the five complexity bands. Each RCS score provides a snapshot of the case complexity of an individual for the week in which it was recorded, and the corresponding NPDS and NPTDA provide an estimate of the hours of therapy and nursing staff time that were utilized for that patient during that week. Table 2 shows a breakdown of the mean nursing and therapy hours per week for each of the five complexity bands from our 1200 parallel ratings. In this sample there were no RCS ratings in the 0–3 score range. The box plots in Figure 3 confirm that the data for total staff hours/week within the remaining bands are normally distributed and separate quite cleanly into the four bands. The midpoint (RCS score 7–9) is taken as the reference point for the purpose of banding, and the ratio of total staff time is expressed in relation to the mean value for this medium complexity group, giving two higher and two lower bands.
The distribution of nursing and therapy staff hours across the five complexity bands
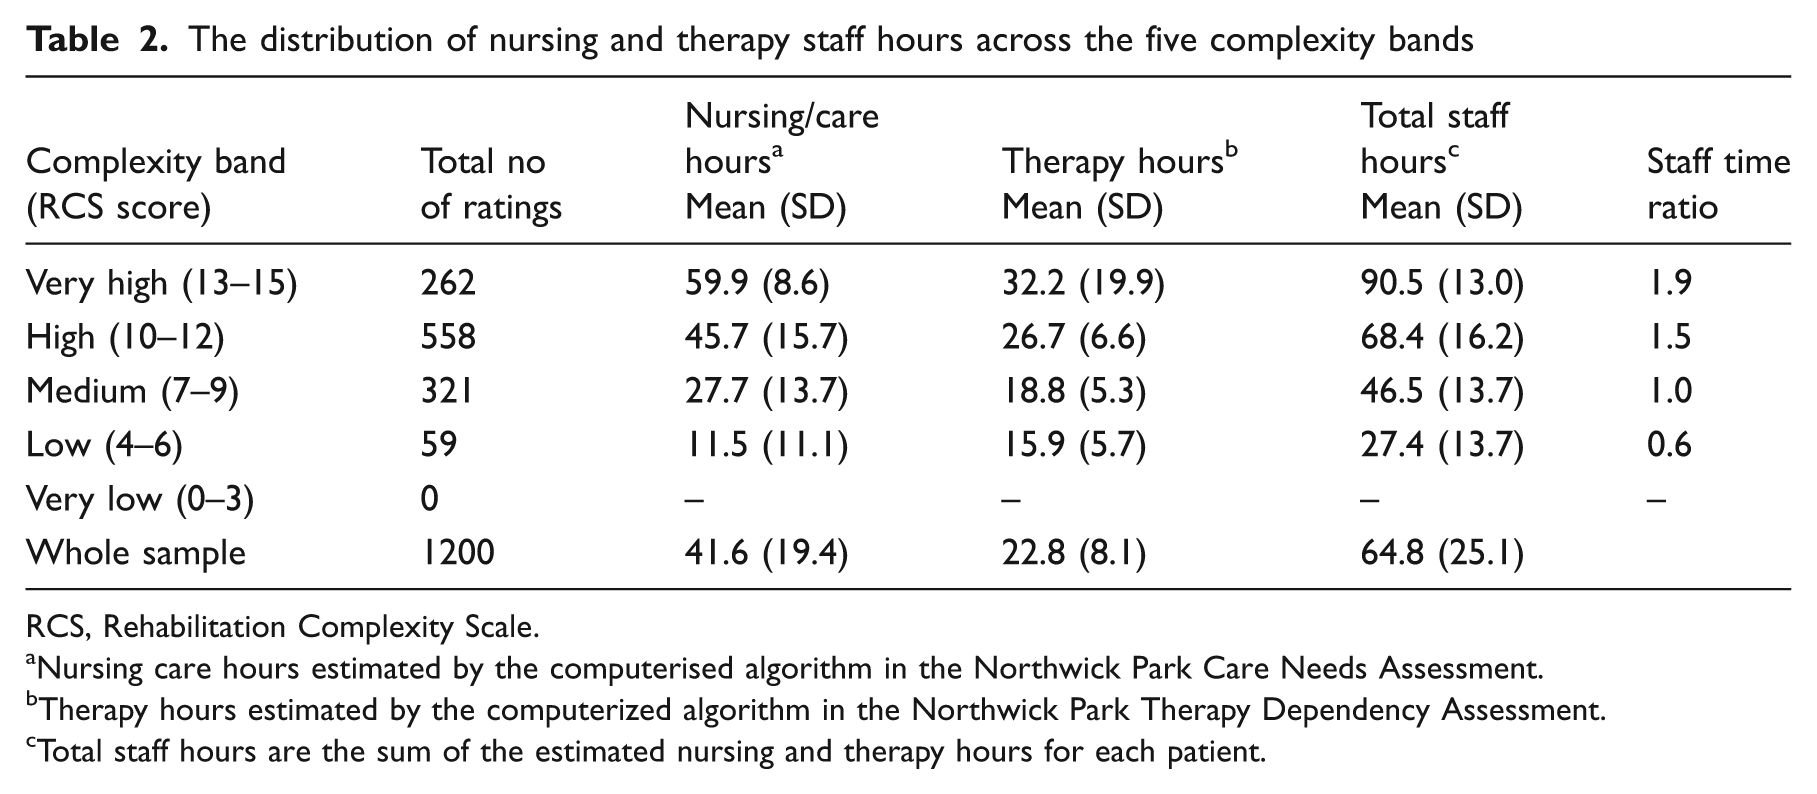
RCS, Rehabilitation Complexity Scale.
Nursing care hours estimated by the computerised algorithm in the Northwick Park Care Needs Assessment.
Therapy hours estimated by the computerized algorithm in the Northwick Park Therapy Dependency Assessment.
Total staff hours are the sum of the estimated nursing and therapy hours for each patient.
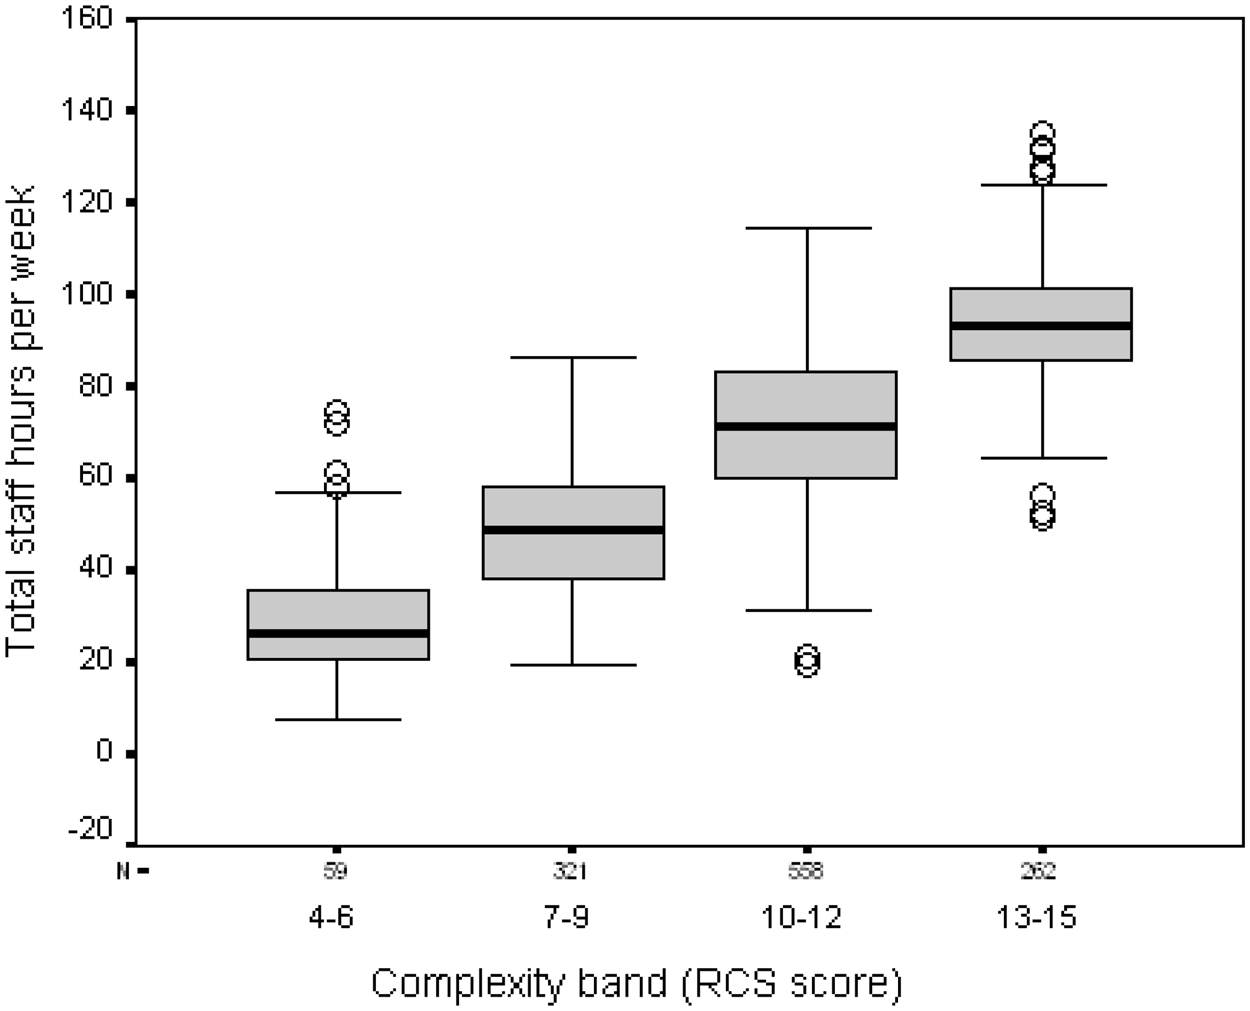
The distribution of total nursing and therapy staff hours per week across the different complexity bands. Total staff hours per week are estimated through the Northwick Park Nursing and Therapy Dependency Scales.
In Figure 2b, this staff time ratio is applied as a ‘banding factor’ to the variable portion of the bed-day cost and added to the non-variable portion to develop banded costs, from which a set of costing multipliers is derived to develop the weighted bed-day costing model. This example is set on a notional mid-point rate of £400 per bed day to simplify the calculations, but the costing multipliers so derived are independent of the figure chosen for this mid-point rate and vary only with the staff time ratio and the proportion of variable and non-variable costs. The base rate for the costing multiplier was taken as RCS 4–6 (rather than 0–3) because a previous cross-sectional analysis of RCS scores from 45 specialist inpatient neurorehabilitation services (levels 1 and 2) across the UK showed that RCS scores below 4 are rarely recorded in these specialist services, 28 which is also in keeping with experience from our unit.
Table 3 shows an exemplar calculation of how a weighted bed-day cost based on this model would work out for a notional 20-bed district neurorehabilitation (level 2) service with a total annual service cost of £3 million and 33% of the caseload in the ‘high’ or ‘very high’ complexity bands. Figure 4 illustrates how the multilevel payment model would be applied through serial complexity ratings over the course of a single-case episode based on the costings for this notional service.
Example of calculation of a weighted bed-day cost for a notional district specialist (level 2) inpatient neurorehabilitation service
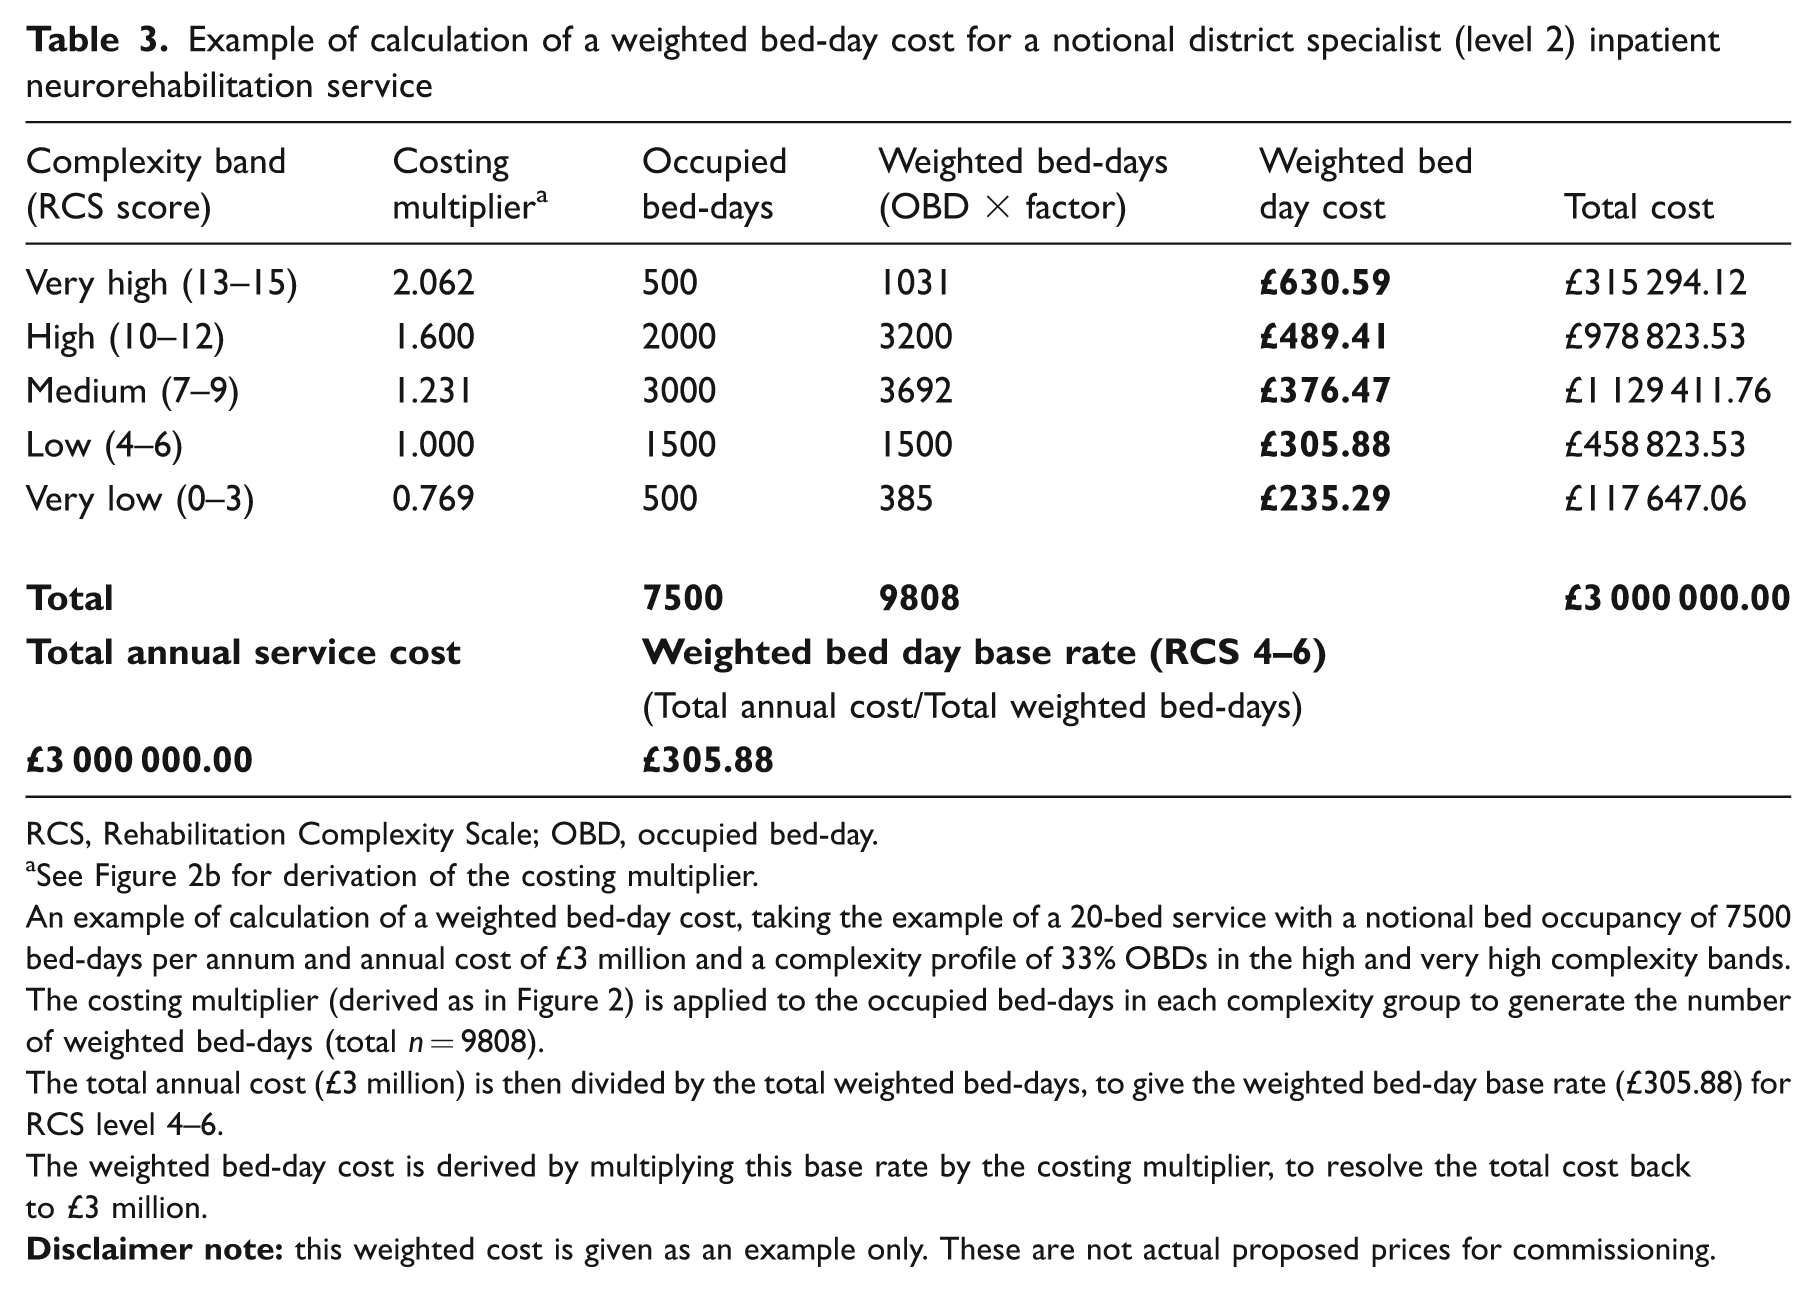
RCS, Rehabilitation Complexity Scale; OBD, occupied bed-day.
See Figure 2b for derivation of the costing multiplier.
An example of calculation of a weighted bed-day cost, taking the example of a 20-bed service with a notional bed occupancy of 7500 bed-days per annum and annual cost of £3 million and a complexity profile of 33% OBDs in the high and very high complexity bands.
The costing multiplier (derived as in Figure 2) is applied to the occupied bed-days in each complexity group to generate the number of weighted bed-days (total n = 9808).
The total annual cost (£3 million) is then divided by the total weighted bed-days, to give the weighted bed-day base rate (£305.88) for RCS level 4–6.
The weighted bed-day cost is derived by multiplying this base rate by the costing multiplier, to resolve the total cost back to £3 million.
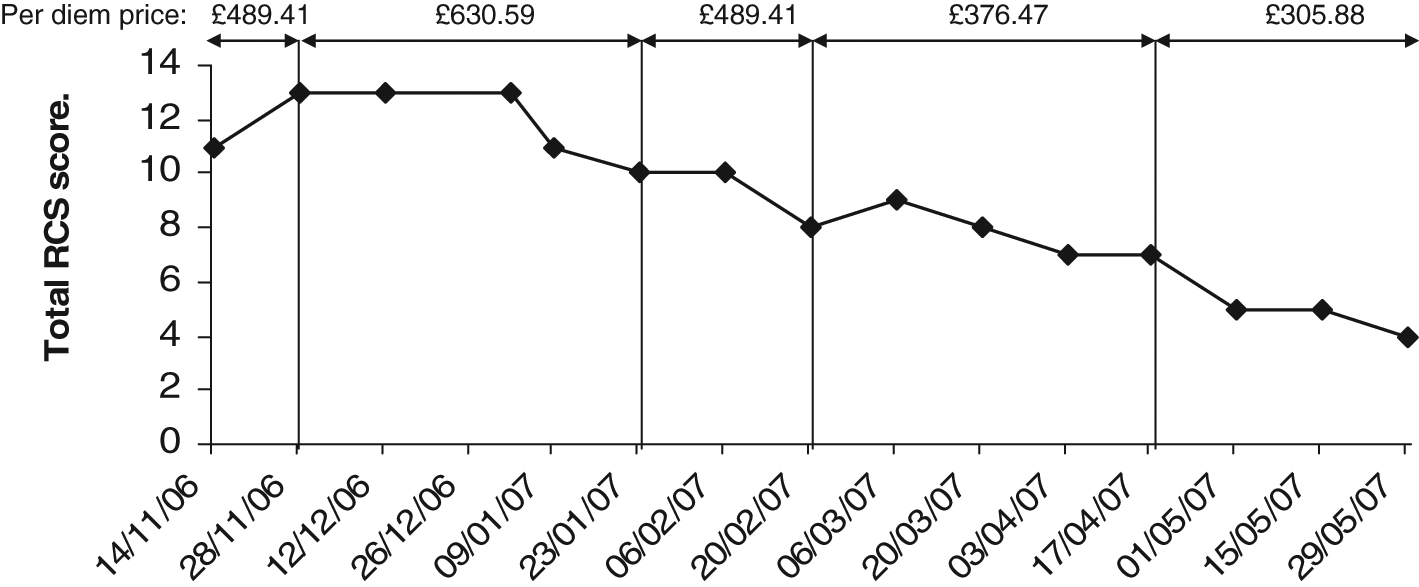
Illustration of a multilevel payment model. RCS, Rehabilitation Complexity Scale. This illustrates the application of the multilevel per diem payment model in a single case. The total episode of 194 days was made up of 42 ‘very heavy’, 48 ‘heavy’, 70 medium and 34 ‘light’ days, at a total cost of £86 730.
Before this weighted costing model could be used to inform tariff development at a national level, we need to examine the extent of variability between different service levels and types and to describe the reasons for that variation. The next step in development is therefore to obtain similar sets of costing and activity data from a range of different services. An accompanying paper in this issue 29 reports preliminary costing data from 17 specialist neurorehabilitation services across England.
Discussion
In this paper we have proposed a novel casemix and costing methodology to underpin the development of healthcare tariffs for specialist neurorehabilitation in the UK, and presented data from one service to illustrate how the multilevel weighted payment model would be applied.
As noted in the companion paper, 2 many of the international casemix models use the FIM or Barthel Index as a proxy of needs for rehabilitation but, for the reasons already given, these do not perform well in complex neurorehabilitation settings. The Resource Utilization Groups (RUG-III) casemix classification offers a further alternative, which is similar to our approach in that it attempts to capture costs more directly through resource use across therapy, nursing and medical care. 30 However, the RUG-III was found to have limited application in the context of specialist neurological rehabilitation because of ceiling effects in the rehabilitation intensity groupings (the highest category receives ‘450 minutes (7.5 hours) or more of rehabilitation per week’, which is just half of the therapy time received by the lowest RCS category in our series).
The Rehabilitation Complexity Scale takes a broader based approach to the categorization of complexity, capturing care, nursing therapy and medical needs in parallel. It was designed to be very simple and intuitive to apply, with minimal rating burden for clinical staff. It is shown to be psychometrically robust and to capture medical and therapy inputs not identified by the FIM or Barthel. 11 Like the RUG-III, it has some ceiling effects and an extended version (the RCS-E) has recently been developed. Whether either of these instruments will provide adequate explanation of the variance in costs of treatment on their own, or whether further parameters will need to be included in the equation, will become clear over time and in the course of this programme. However there are advantages to all parties if the system can be kept as simple as possible.
The authors recognize some limitations to this approach:
The lack of fully developed patient level costing systems means that costing data can at best be an approximation. The exemplar service described here was fortunate in having a ring-fenced budget and accounting system. We acknowledge that it may prove harder for some services to separate out the costs of their services from more general departmental budgets. Nevertheless we believe that this method is significantly more robust than the standard reporting of reference costs, by which the Department of Health for England otherwise gathers information on service costs.
The tools by which complexity of rehabilitation needs and the interventions provided to meet those needs are undergoing further development in parallel with the data collection. Ideally, the tools would be fully developed and evaluated prior to application. However the timescale for introduction of Payment by Results is such that these two stages must be undertaken in parallel. That said, the psychometric characteristics of the instruments have been well described and they are shown to be robust even in their current form.
The estimate of staff hours provided by the Northwick Park Dependency tools may not be as accurate as formal activity analysis, but they are used here because they are timely to apply in routine clinical practice. As the introduction of Payment by Results is intended to be cost neutral, it is the relative proportion of staff time across the different bands rather than the absolute values that are of primary interest. Therefore they are considered to be adequate for this purpose.
The RCS provides only a crude evaluation of requirements for rehabilitation, and we recognize that more detailed tools will be required to define the precise patient characteristics which determine needs for treatment and which patients will benefit. However, users report that it is easy to collect, 28 which is keeping with our experience, and the data presented here suggest that it provides reasonably robust separation for the purpose of banding into broad levels of resource use.
As with any casemix system, there is the theoretical potential for gaming – for example if providers were to overscore the RCS scores to in order to maximize income. The parallel collection of dependency scores and staff profiles provides some protection against this, as inputs should be commensurate with complexity profiles, and units with low staffing levels simply could not provide the require intensity of rehabilitation. The requirement for submission of data to the national UKROC database 14 provides a critical opportunity for benchmarking and comparison. Experience from the Australian data set suggests that any consistent anomalies in the data are usually quite readily identified, through robust central data monitoring and comparative analysis (AROC team, personal communication, 2011).
Even with the proposed multilevel weighted payment model, the generation of national tariffs may prove challenging, as payment for patient treatment must cover all costs and services vary widely in the extent of services offered. For example, some provide bespoke equipment as part of treatment, others charge separately for this. In addition, not all clinical roles can be explicitly linked to individual patient care. Some act as specialist advice centres, providing very extensive support for local and community teams as part of their service, while others operate in relative isolation. Setting a national tariff on the average performance may therefore result in loss of valued activities, unless these can be identified and accounted for as part of the cost reporting.
To address this latter issue, the Department of Health for England has recently introduced ‘Best Practice Tariffs’ which set tariff prices normatively (i.e. what the cost should be if best practice is followed, rather than the national average of reference costs).31 Normative pricing represents an alternative incentive model to change practice according to predetermined quality criteria, providing those criteria can be adequately defined and justified. This may be an option for future tariff development in the context of rehabilitation, and is currently being explored in the context of stroke rehabilitation in level 3 services only (see Figure 1).
Throughout the world, casemix for community-based care has lagged behind inpatient care. Ongoing developments in the England include the introduction of community and ‘pathway’ tariffs, which support vertical integration of payment for services across the hospital–community divide. As yet the methodology for pathway tariffs is poorly defined, but the multilevel payment model proposed here would lend itself very well to pathway tariffs, and so may have much wider application and policy relevance than just within the field of rehabilitation. It could, for example, be applied in many areas of longer term care including palliative care, mental health and ongoing support for patients with chronic conditions. We further believe that this model may also have relevance for other countries, especially those with well-developed state-supported care systems, which will allow the savings accrued from long-term reduction of care costs to be rechannelled to support adequate investment in rehabilitation.
Clinical messages
Patients with complex needs incur higher treatment costs.
Fair payment should be weighted in proportion to costs of providing treatment and should allow for variation over time
A multilevel weighted per diem payment model offers a practical tariff solution for specialist neurorehabilitation services that is fair to both payer and providers.
It is expected to have application in other areas of rehabilitation and long-term care.
Footnotes
Appendix
The UK Rehabilitation Outcomes Collaborative (UKROC) data set
| Category | ✓ | Data field | Response |
|---|---|---|---|
| Unit details (Fixed for each unit) | □ | Unit identifier | Unit name/code |
| □ | Designation | Level 1/level 2/level 3 (non-specialist) | |
| Patient details | □ |
|
NHS number – local (pseudonymized for national data set) |
| □ | Date of birth | Date: Birth | |
| □ | Gender | List: Male/female | |
| □ | Race | List: Race/ethnicity | |
| □ | Postcode | Postcode | |
| □ | Primary care trust (PCT) | PCT/code | |
| □ | Strategic health authority (SHA) | SHA/code | |
| □ | Diagnosis at assessment | Text: primary diagnosis | |
| □ | Date of onset | Date: (set at first of month or year, if not precise) | |
| Referral and processing | □ | Source of referral | List: Hospital/community |
| □ | Date of referral | Date: referred | |
| □ | Date of assessment | Date: assessed | |
| □ | Details of assessor/team | List: Unidisciplinary/multidisciplinary | |
| □ | Date of decision/waiting list | Date: on waiting list | |
| Admission details | □ | Admission date | Date: Admitted |
| □ | Admitted from | List: Hospital (specialist/general)/home/nursing home | |
| □ | Type of admission | List: Assessment only/active rehab/disability management | |
| □ | Dependency category on admission | List: High/medium/low | |
| □ | Anticipated discharge date | Date: | |
| □ | If delayed discharge –reason | Text or list (e.g. waiting for housing/care package) | |
| Interruption of rehab | □ | Total interruption days | Number: Days transferred to other ward |
| If any | □ | Reason for interruption | Text or list (e.g. intercurrent illness/procedure) |
| Discharge | □ | Discharge date | Date: Discharged |
| □ |
|
Number: Days (calculated field) | |
| □ | Mode of episode end | List: discharge/death/transfer to other ward | |
| □ | Discharge destination | List: Home, nursing home/residential care/other rehab | |
| Diagnosis/coding | □ |
|
HRG code |
| □ |
|
Primary ICD-10 code or diagnosis | |
| □ | Secondary diagnoses | Secondary ICD-10 codes | |
| Spinal cord injury (SCI) | □ | ASIA impairment scale (SCI) | American Spinal Injuries Association (ASIA) score |
| Amputee rehab | □ | SIGAM grade (lower limb) | UK Special Interest Group for Amputee Medicine Grade |
| Costing data | □ | Unit cost per bed-day | £– |
| □ |
|
£– | |
| Standardized costing and outcome data-Please collect itemized scores using the UKROC database software | |||
| Complexity | Admission | Discharge | |
| All services | □ |
|
Rehabilitation Complexity Scale: Item level and total scores |
| Level 1 services | □ | NPDS | Northwick Park Nursing Dependency Scale |
| Level 1 services | □ | NPTDA | Northwick Park Therapy Dependency Assessment |
| Outcome | Admission | Discharge | |
| All services | □ |
|
Barthel Index |
| Level 2 services | □ | FIM Motor | Functional Independence Measure–Motor subscale score |
| Level 2 services | □ | FIM Cognitive | Functional Independence Measure–Cognitive subscale score |
| Level 1 services | □ | UK FIM+FAM Motor | UK Functional Assessment Measure–Motor score |
| Level 1 services | □ | UK FIM+FAM Cognitive | UK Functional Assessment Measure–Cognitive score |
| Optional | □ | GAS | Goal attainment scaling |
| Optional | □ | (FIM+FAM Impairment Set) | Neurological Impairment Set collected alongside UK FIM+FAM |

Ethics approval
The Regional Rehabilitation Unit gathers this outcome data routinely in the course of clinical practice. Permission has been obtained from the Harrow Research Ethics Committee to report the data retrospectively for research and audit purposes (Ref 04/0405/47).
Competing interests
Outcome measurement is a specific research interest of our centre. The RCS, NPDS and NPCNA were all developed through this department, but are disseminated free of charge. Professor Turner-Stokes is lead author on the papers which describe their initial development and validation, as well as that of the UK version of the FIM+FAM. However, none of the authors has any personal financial interests in the work undertaken or the findings reported. We are not aware of any other competing or conflicts of interest.
Acknowledgements
The authors gratefully acknowledge the hard work of the Regional Rehabilitation Unit staff in collecting the data presented in this study, and the cooperation of the patients to whom it belongs. Special thanks are due to Heather Williams, Jo Clark, Hilary Rose and Sarah Harris for their roles in coordinating data collection.
We also gratefully acknowledge members of the Expert Reference Panel for HRG Development, including staff from the NHS Information Centre and the Department of Health for England Payment by Results Team for their helpful feedback and support during the development of the costing model.
Copies of the Rehabilitation Complexity Scale, NPDS, NPTDA and costing template are available free of charge from the corresponding author.
Funding
This article presents independent research commissioned by the National Institute for Health Research under its Programme Grants for Applied Research funding scheme (RP-PG-0407-10185). The views expressed in this article are those of the authors and not necessarily those of the NHS, the NIHR or the Department of Health. Financial support for the preparation of this manuscript was also provided by the Dunhill Medical Trust, the Luff Foundation.