
Abstract
Introduction
In common with other healthcare systems around the world, the UK National Health Service (NHS), is moving towards activity-based ‘cost per case’ payment systems according to a standard national tariff – the so-called Payment by Results scheme. 1
In two other papers in this issue we have:
discussed the challenges for tariff development in the area of rehabilitation and explored some established international casemix and payment models that have been developed to address these 2 and
described the rationale and development of a proposed casemix system for reimbursement of inpatient specialist (level 1 and 2) neurorehabilitation services in the UK. 3
The proposed multilevel weighted per diem payment model is based on serial complexity ratings and is expected to have application in other areas of long-term care, and also for health systems outside the UK.
The next step is to establish the service costs associated with the payment model. In an initial analysis, we have described a pragmatic Patient Level Information Costing Systems approach (‘Pragmatic PLICS’) to develop a weighted costing model for inpatient neurorehabilitation, based on pilot data from one centre. 3 This paper describes the extension of that approach.
The most pressing need was to collate costing data for the highly specialist services which would otherwise be at risk of destabilization if there was a single tariff structure for all service levels. We collated data on costing and service characteristics from 17 specialist neurorehabilitation services in England to determine the range and variation between different levels of service, and to determine the extent to which this type of cost analysis could be used to underpin tariff development for Payment by Results.
Methods
Setting
The UK National Definition Set for Specialised Services 4 describes three levels of rehabilitation service based on the catchment population and the proportion of patients with highly complex needs (see companion paper for details 2 ).
The British Society of Rehabilitation Medicine has provided more precise defining criteria, 5 and proposed a subdivision of level 2 services. The Rehabilitation Complexity Scale (RCS) 6 provides a crude, but simple, estimate of caseload complexity within a given service. 7
Level 1 (tertiary) services carry a selected caseload with a high proportion of complex cases (60–70% RCS score >10) and serve a regional catchment population (>1 million).
Level 2a (supra-district) carry a mixed caseload (at least 50% RCS >10) and serve a supra-district catchment population (600 000–1 million).
Level 2b specialist services carry a less complex caseload operate within a district level catchment population (typically 350 000–500 000).
Level 1 services are also expected to fulfil a regional networking role – acting as centres for training, research and equipment demonstration; providing advice for commissioners, and support for other rehabilitation teams in the management of complex patients. Level 2a services are expected to provide a similar role within their locality. A further requirement for both levels is the systematic reporting of the full national data set of benchmarking and outcome data to the UK Rehabilitation Outcomes Collaborative (UKROC) database. 3
Data collection
Twenty-eight service providers of specialist inpatient neurorehabilitation services (levels 1 and 2a) in England were approached and asked to:
provide an estimation of full annual costs for their service, based on retrospective analysis of unit budget statements and accounting costs, and
complete a service profile questionnaire, which included information about the nature of their staffing levels, facilities, catchment population and annual activity figures.
Costs were collated using a standard costing template, devised to attribute individual lines within the budget statement to different cost types, in line with the UK Department of Health’s Patient-level Costing Standards. 8 Each centre was provided with the template, accompanied by detailed protocols and notes to assist completion and consistency. Data returns were followed up with site visits and correspondence from expert advisors and analysts, in order to clarify and verify the data and to ensure consistent approach to cost definition. Depending on the availability of information, actual costs or budget statements for 2008/9 or 2009/10 were used, and then inflated or deflated to a common price base. All data used in this paper relates to the actual final figures reported by providers for the full financial year 2009–10.
Analysis and data handling
The returns were collated in Microsoft Excel and analysed using SPSS version 18 (SPSS Inc., Chicago, IL, USA).
Costs were divided according to principal cost type (direct, indirect and overheads). Direct costs were also broken down into the following components: variable costs (staff pay, non-pay, equipment/facilities), and semi-fixed costs (ward costs and office/admin costs).
For the purpose of the payment model, costs were classified according to behaviour – variable and non-variable (fixed and semi-fixed) costs.
Key determinants of total costs were identified using stepwise multiple regression tests.
Descriptive statistics were calculated for principal service characteristics and costs, including range, mean and standard deviation (or median and interquartile range (IQR) where data were significantly skewed).
For the purpose of comparison between the level 1 and 2a services, costs and service characteristics were calculated per occupied bed. Mann–Whitney tests were used to identify significant differences, because of the small number of services in each group.
Results
Of the 28 units approached, 20 provided data, but three were excluded because of incomplete information. The units were distributed across England as follows: the London region (5 units), North-West (4), North-East (1), Midlands (3), South (2), South-West (2). The size of the population served was not especially helpful in separating level 1 and 2a services. Instead these categories were separated on the basis of the broader defining criteria as described above 4,5 as identified in the service profile. Eight units were identified as level 1 adult services and seven as level 2a adult services. Two of the units were children’s specialist rehabilitation services – these are shown separately for the purpose of descriptive comparison, as they differ quite markedly from the adult services (see Discussion).
Table 1 shows an analysis of costs, broken down by cost types and behaviour across the three levels of service. ‘Direct’ costs made up 83.3% of the costs overall, with ‘indirect’ costs and ‘overheads’ making up the remaining 17%. Mann–Whitney tests demonstrated no significant difference in the proportion of costs between level 1 and 2a services. Staff pay made up 66% of the total costs of adult services for both level 1 and 2a units. Stepwise multiple regression confirmed that staff pay was the single strongest predictor of total costs, accounting for 95% of the variance.
Analysis of services costs and breakdown of cost types between the level 1, 2 and children’s services
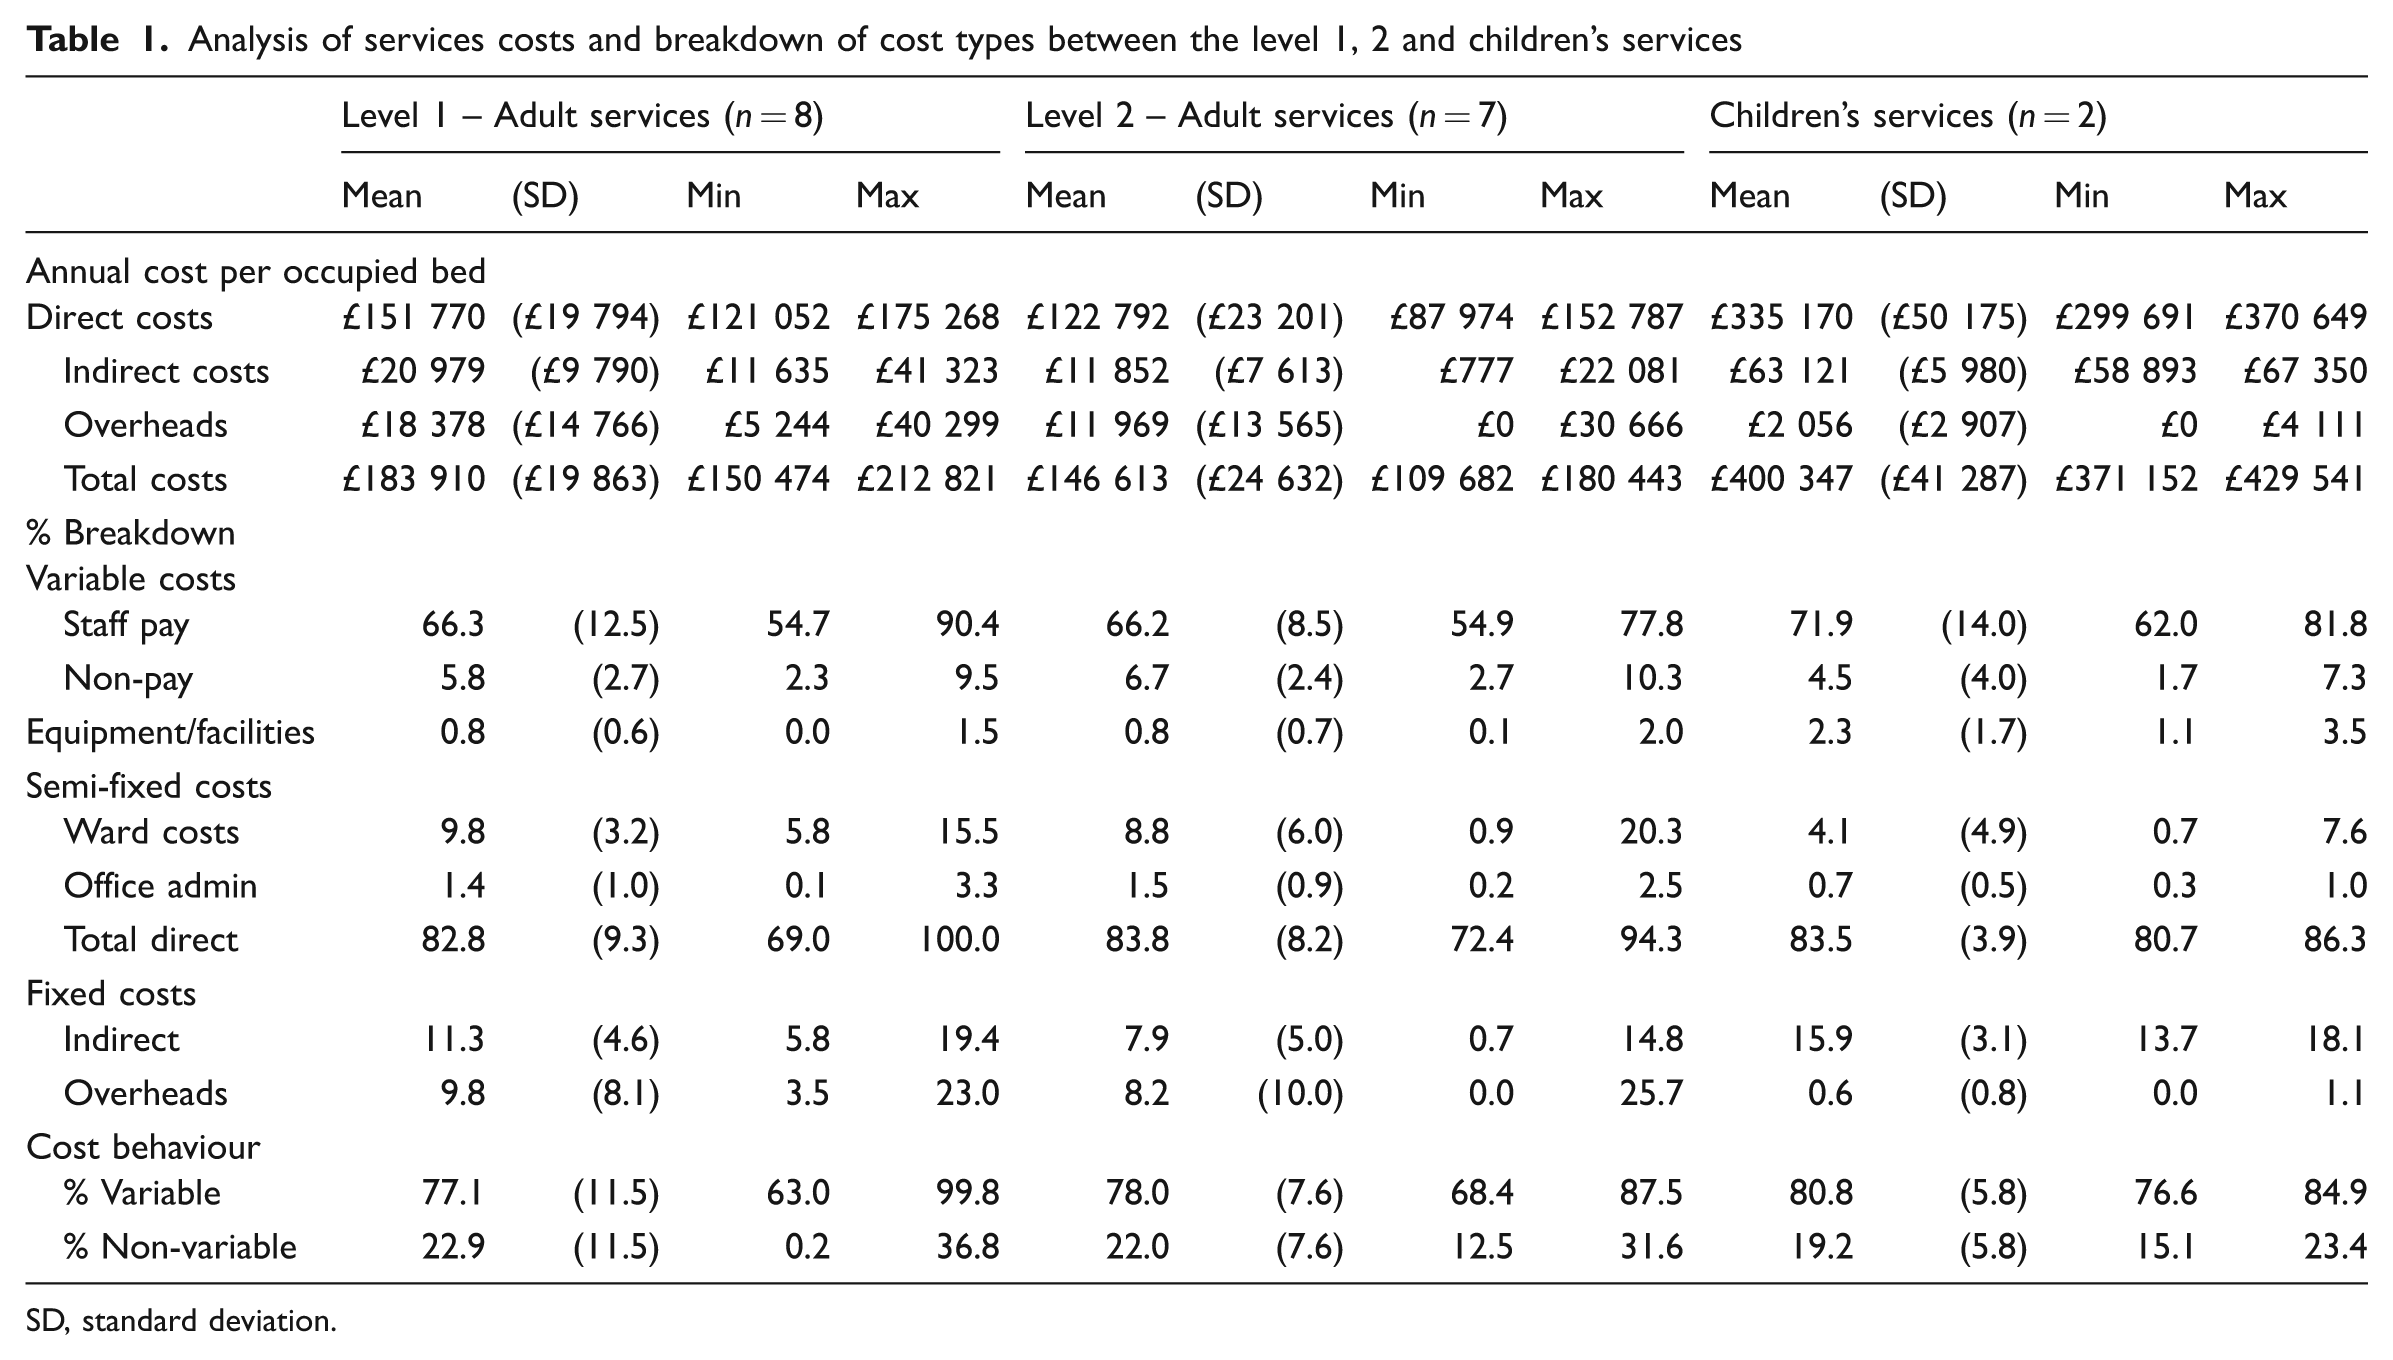
SD, standard deviation.
Costs were also broken down into ‘variable’ and ‘non-variable’ components. The variable component was reasonably consistent, with a median of 75–76% across the three service types.
In order to understand the cost structure and cost drivers of the service it is necessary to take into account the relative size and activity (occupied bed-days) of the services. We anticipated that level 1 services would in general be larger and have greater costs than the level 2a services, due to higher levels of staffing, equipment and facilities required to support their complex caseload. Table 2 shows an analysis of capacity, activity and staffing levels across the three service types. Units size varied marked (from 5 to 54 beds), with a mean of 23 beds (median 22, IQR 14–29) overall. As expected, level 1 services tended to be larger than the level 2a units, and to have a lower proportion of occupied beds, but neither trend reached statistical significance.
Summary descriptive statistics for capacity, activity and staffing levels compared between service levels
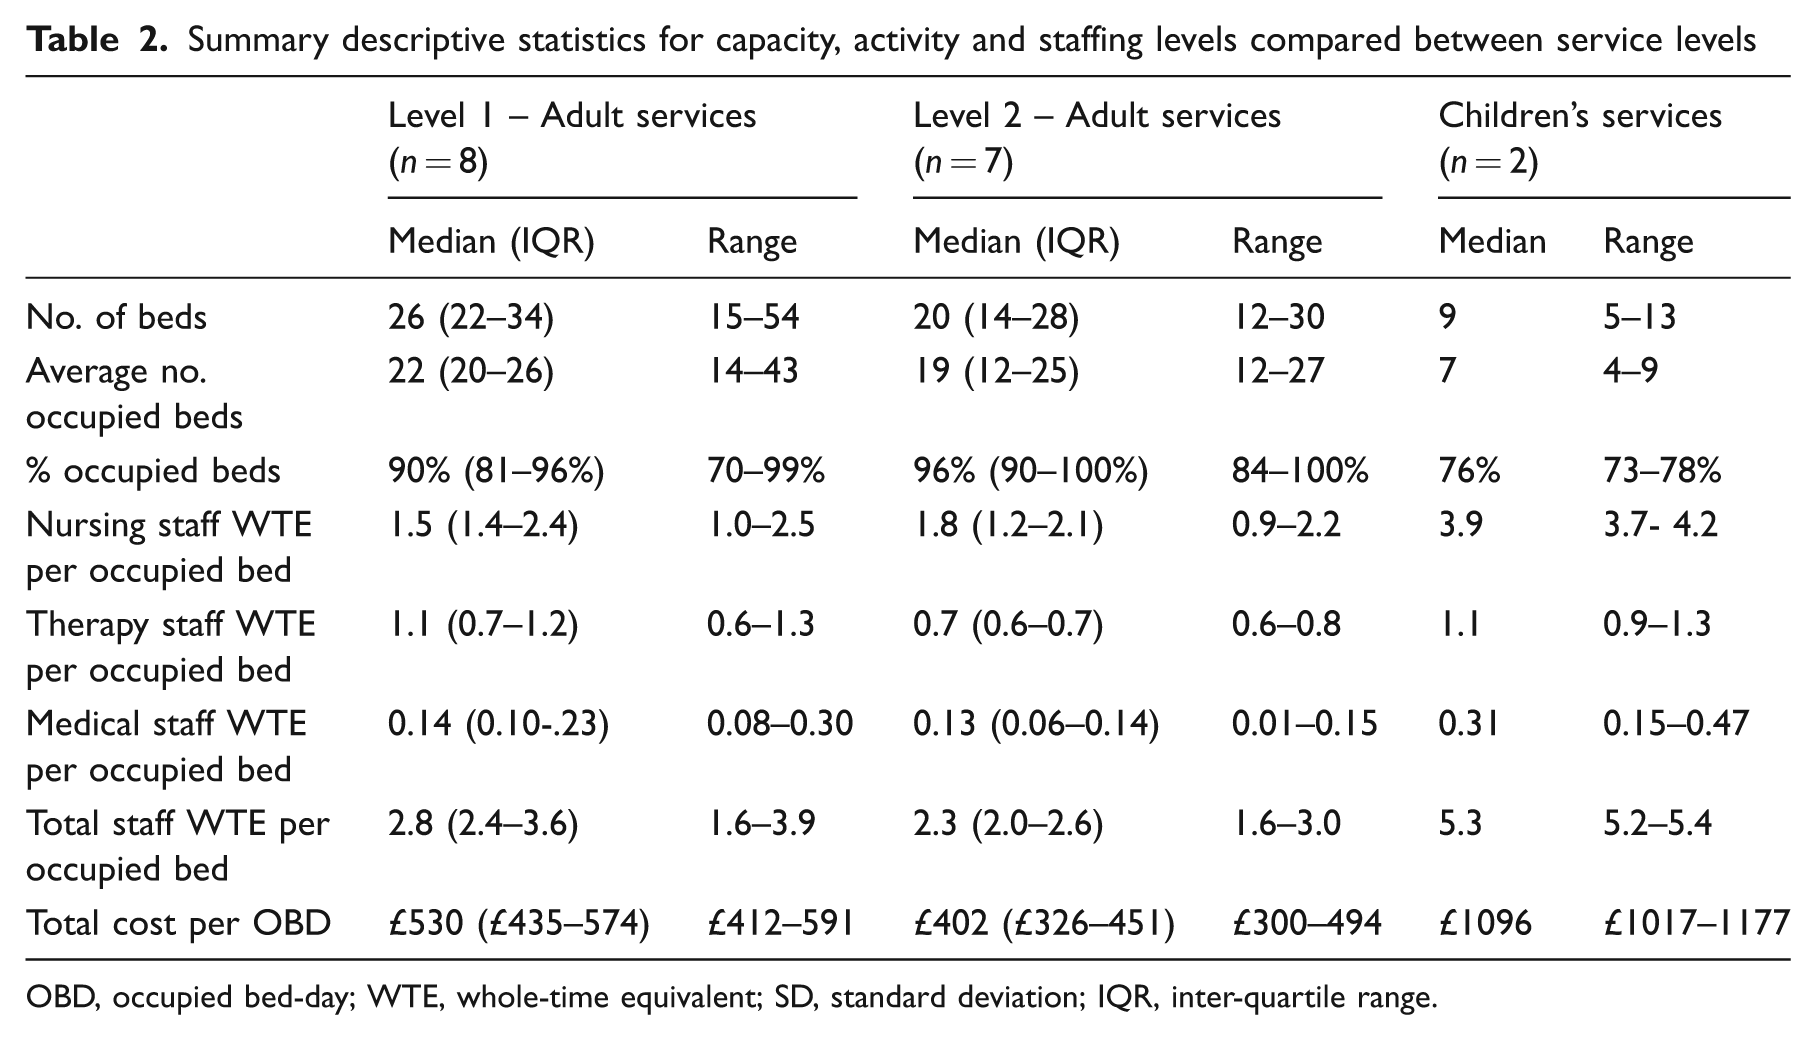
OBD, occupied bed-day; WTE, whole-time equivalent; SD, standard deviation; IQR, inter-quartile range.
Staffing levels were analysed per occupied bed (Table 2). The level 1 services had higher staffing levels overall, with significantly higher total staff pay costs/occupied bed (Mann–Whitney z = –2.2, P = 0.03). Breakdown of staffing by discipline revealed the same trend across medical nursing and therapy disciplines, but only the therapy staffing numbers were significantly higher (z = –2.0, P = 0.05). Figure 1 illustrates the distribution of bed-day costs across the three service types. The median total cost/occupied bed-day was £530 (IQR 435–574) for the level 1 services, compared with £402 (IQR 326–451) for the level 2a services (z = –2.5, P = 0.009), but was more than twice that for the children’s services (£1096, range 1017–1177).
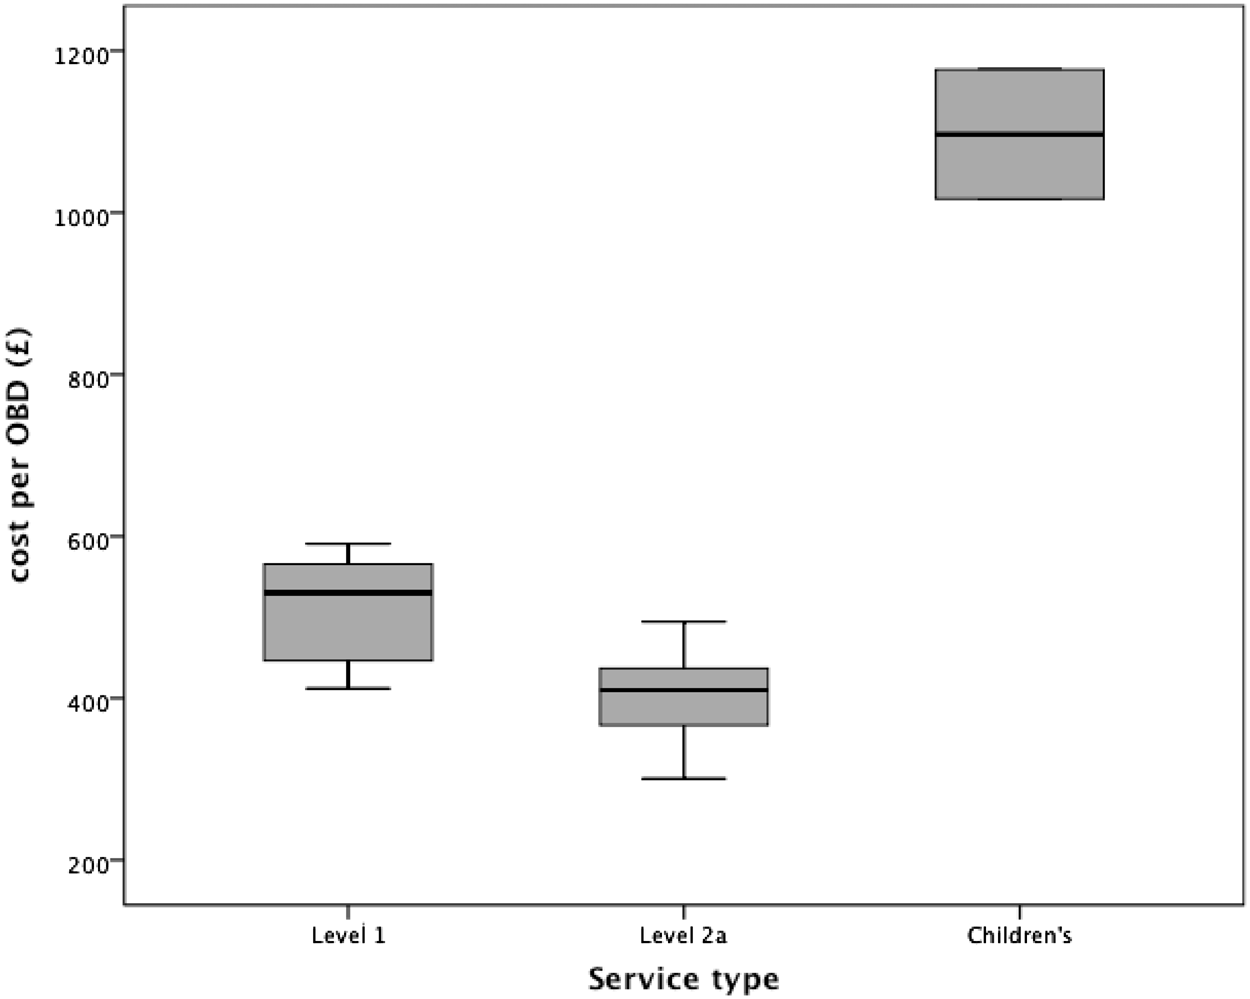
Distribution of cost per occupied bed-day across the three service types.
Discussion
This analysis confirms the feasibility of using a pragmatic Patient Level Information Costing Systems approach to estimate service costs for specialist rehabilitation services in England. The percentage breakdown of costs was consistent across all three service types, with direct costs making up 83%, and the variable component 76% overall. Staff pay made up 66% and accounted for 95% of the variance of the total costs in adult services. The cost of childrens’ services was almost twice that of the adult services.
In general, the greater the proportion of service costs that can be assigned directly to patient care the greater the accuracy of the final costing data. 8 The consistent finding in this study that direct costs made up 83% suggests that the cost base is robust and can be used with some confidence to develop a costing analysis for a future tariff.
The proportion of variable and non-variable costs is required for the weighted costing model. 3 The finding that variable costs consistently made up 75–76% costs across all three service types confirms that the 25/75% assumed in the proposed model represents a reasonable split.
International health costs analyses estimate that staff wages make up the majority of costs (65–80%) in healthcare services in most countries. 9,10 Our findings were consistent with this. The percentage breakdown of costs was similar for level 1 and 2a units, with staff pay accounting for two-thirds (66%) of all costs. The children’s services did show a slightly higher proportion of staff costs (particularly with respect to nursing and medical staff) and equipment – reflecting the more intense general demands of caring for very disabled children, and supporting their parents – as well as the need for bespoke equipment.
As anticipated, level 1 services cost significantly more per occupied bed than the level 2a services (median £530 vs. £402, P < 0.01). The difference appeared to be largely related to higher therapy staffing levels – in keeping with the requirements of a more complex caseload, and also the extended networking role that level 1 services offer to support other local services.
A significant limitation of this study is that contemporaneous cross-sectional complexity data (RCS scores) were not available from the majority of services. We were therefore not able to break down the bed-day activity by complexity group in order to apply the full weighted costing model. 3 Other weaknesses are that we cannot be certain of the validity of the reported costs or workloads. Even though reported costs were verified as far as possible by site visits and follow-up correspondence from both expert advisors and analysts, the standards of financial and activity monitoring did vary somewhat between service providers. It was generally easier to identify costs for free-standing rehabilitation units than for those operating in a ward within an general hospital setting.
Nevertheless some useful lessons have been learned for future analysis. Of all the costing data collected in this analysis, staff costs were the easiest to identify. All providers stated that they had accurate information readily to hand with respect to their staffing establishment, including the details of individual salaries with on-costs for each staff member. In this study, staff costs accounted for 95% of the variance in total costs. This suggest that, for future service costings, the total annual staff costs projected by 150% would provide an acceptable estimate of total service costs. The only additional information then required to apply the weighted costing model would then be the total occupied bed-days and the cross-sectional RCS scores.
Clinical messages
Level 1 specialist neurorehabilitation services cost significantly more per occupied bed than the level 2a services.
The difference is largely related to higher therapy staffing levels, in keeping with the requirements of a more complex caseload.
The total annual staff costs projected by 150% may provide an acceptable estimate of total service costs.
Footnotes
Ethics approval
This study collated only service costing and summary activity data only and so did not require research ethics permission. The programme is registered as a Payment by Results Improvement Project.
Acknowledgements
The study was undertaken in collaboration with the British Society of Rehabilitation Medicine and the NHS Information Centre. The authors gratefully acknowledge the hard work of the services providers who contributed the data presented in this study, and the cooperation of the staff in their accounting and finance departments. Special thanks are due to Marsha Merchant for her work in collating the costing data.