
Abstract
This paper examines changes in employment and job allocation across various industrial sectors in English regions over the years 2009–2021. The aim is to investigate regional resilience by analysing the impact of economic shocks on the make-up and productivity of English regions via dynamic shift-share analysis. The evidence reveals that employment in key industries across English regions remained largely unaffected by economic shocks, also due to the COVID-19 pandemic which prevented occupational shifts through furloughing and essential worker selection. But we also find that while comparative lack of specialisation insulated many English regions from the more damaging aspects of exogenous shocks, the resulting economic turmoil in these regions impacted key sectors differently. The findings contribute to our understanding of regional economic resilience and how it is influenced by industrial diversity, productivity, and economic policy.
Introduction
In an increasingly connected world, global crises have the potential to greatly derail the growth and development of regions. Understanding the medium- to long-term implications of such crises for regions is, therefore, an essential task to combat the deleterious consequences of these events. In this paper, we specifically examine regional resilience during times of crisis through the lenses of employment change, productivity, and economic policy.
The study focuses on resilience, interpreted from the sole perspective of a region’s capacity to adapt and recover from an external economic shock. The analysis concentrates on English regions, but it has implications for regional economies beyond these shores. Using changes in the numbers employed across different industrial sectors (which equates to our definition of occupational change in this study) to measure resilience is an integral component in economic development research (see, inter alia, Boschma, 2015; Martin and Sunley, 2015; Saviotti, 1996) and an approach consistent with analyses of resilience that focus on an economy’s capacity to recover from a negative exogenous disturbance in terms of speed of recovery and structural transformation (Frenken et al., 2007; Fingleton et al., 2012; Martin and Sunley, 2015; Martin, 2012). For example, Martin (2012) used regional employment change in UK regions, framed around notions of resilience and hysteresis, to explore structural development as a result of recessionary pressures. More recently, Tyler et al. (2017) demonstrate the divergent paths of British cities and regions through structural transformation by using industrial sectors as their unit of analysis.
This paper builds on this literature by examining a recent series of temporally contiguous economic shocks, the financial crisis of 2008/9 closely followed by the political misadventure of Brexit from approximately 2016 and, finally, the COVID-19 pandemic over the period 2019–21. We consider institutional responses to these crises, their impact on English regional employment and productivity, and by extension, regional economic resilience. To understand the influence of these crises, employment change and productivity across industrial sectors for English regions for 2009-21 are subjected to empirical scrutiny.
The work limits itself to English regions for consistency, as significant differences can be found in the economic development pathways of Welsh, Scottish, and Irish regions. It uses Standard Industrial Classification (SIC) and Standard Occupational Classification (SOC) data from the Office of National Statistics (ONS) with consideration of definition changes explained and accounted for (see, e.g. ONS, 2022, 2023b). The analysis shows that the impact of externalities on key industrial sectors was considerably less for specific industrial sectors, though with some variance between regions. However, analysis of productivity using Gross Value Added (GVA) and regional employment numbers uncovers surprising sectoral differences. Taken in combination with institutional actors’ attempts to mitigate the worst effects of these economic shocks, our study demonstrates that greater consideration needs to be given to economic policy responses to ensure that well-intentioned, short-term actions do not have longer-term unintended consequences.
Our key findings point to the import of institutional and political factors in determining not just regional development but also regional resilience, in keeping with the work of Swanstrom (2008), and Dawley et al. (2010). During three temporally proximate external crises, from 2009 to 2019, which detrimentally affected regional economic performance, the UK government responded with economic policies that prioritised job retention. These actions helped maintain employment, but they did so at the cost of productivity, thus skewing our understanding of adaptive capacity and recovery in the context of resilience. This point is evidenced by dynamic shift share analysis of all English regions which shows that regional competitiveness was not the driver for the growth of regional industrial sectors. Only London and, to a lesser extent, the East and South East show significant troughs and subsequent robust recovery, but the replicability of such success outside these regions is questionable. Specifically, strongly centralised legislation and projects that benefit the capital and, possibly, surrounding regions are not enough to act as an engine of growth for the rest of the economy.
In the next section, we review different theoretical approaches to understanding regional economic development and resilience. This is followed by a discussion on the nature of the economic shocks and institutional responses to these crises. Then, we outline the usefulness of utilising a dynamic shift share analysis and productivity measures to investigate these economic transformations. The subsequent section presents the analysis, identifying key sectors and regions subjected to detailed examination. The penultimate section focuses on the data challenges of the Pandemic period, unveiling the impact of furloughing on employment change. The paper concludes with a discussion of key findings, recommendations for future policy development, an acknowledgement of limitations, and profitable avenues for future research.
Resilient regions
Before considering how resilient English regions were to the three temporally contiguous economic shocks, it is first necessary to examine the concept of resilience in greater detail. Turmoil in global markets and a series of negative economic shocks in quick succession over nearly two decades have renewed interest in understanding the impact of sharp downturns in the business cycle on labour employment in regional economies. Central to much of this academic focus is the concept of ‘resilience’, often defined as the ability of a socio-economic system to ‘bounce back’ from an externally located shock (Hill et al., 2008; Foster, 2007). Within this specific definitional framework, resilience is considered a measure of how quickly this recovery occurs, reflecting how regions anticipate, prepare for, and respond to shocks (Fingleton et al., 2012; Giannakis and Bruggeman, 2017; Martin and Gardiner, 2019).
The concept has generated both support and criticism (Davoudi and Porter, 2012; Martin and Sunley, 2015; Pendall et al., 2010). Hu and Hassink (2020) identify a number of key weaknesses to resilience as a basis for understanding regional growth and development. First, the focus on equilibria of economic activity. Second, the lack of institutional and policy analysis. Last, the eschewing of cultural and social factors affecting adaptability. These concerns mirror those of Swanstrom (2008), and Dawley et al. (2010). Despite such disquiet shaping much of the ongoing debate around resilience, the increased instances of resilience frameworks as instruments for policy-making decisions point to a wider acceptance of the concept outside academic debate (Giannakis and Bruggeman, 2017). This wider adoption reflects the cautious optimism of scholars who see the value of the idea while accepting the need for theoretical improvements (Frenken et al., 2007; Fingleton et al., 2012; Martin and Sunley, 2015; Martin, 2012).
The ability to explore differences between regions and explain why some are more successful than others in responding and adapting to shocks lies at the heart of this approach (Overman and Puga, 2002). Sutton and Arku (2022) divide resilience into two forms, performance and capacity. The former measures a response to a shock, while the latter assesses the regions’ adaptive capabilities. Key features that determine the pace and level of recovery are adaptation, adaptability, and diversity (Dawley et al., 2010; Hu and Hassink, 2020; Overman and Puga, 2002). Although the pivotal concepts of adaptation and adaptability remain the most debated notions in urban and regional resilience research (see, e.g. Hu and Hassink, 2020; Martin, 2012), there appears to be convergence in the literature around the idea that they form a dynamic interplay, that resilience necessitates securing ‘adaptation and adaptability simultaneously’ (Boschma, 2015: 734), and that related variety is a conditio sine qua non to developing the requisite industrial or institutional mix to forge regional resilience in the long-run (Boschma, 2015; Hu and Hassink, 2020).
Martin (2012) poses the important question of equilibrium, and whether an economy returns to the same level as before or instead, moves along a completely different growth path. What if, for example, a regional economy is irrevocably altered by a short, sharp, shock? Martin and Sunley (2015) applied three distinct approaches to measuring regional change. First, a focus on resistance to a shock, as well as the ability to recover. The speed by which the system responds defines its resilience (Davoudi and Porter, 2012). The second approach considers economic structure and the possibility of moving into a new equilibrium state (Giannakis and Bruggeman, 2017). The final evolutionary approach examines the adaptive capacity of a region and its growth potential after a shock (Pendall et al., 2010; Pike et al., 2010). The ability of a regional economy to structurally reconfigure firms, institutions, or technologies to take advantage of new developmental pathways would be determined by the rate of business churn, entrepreneurship, innovation, diversity, availability of skilled labour, etc. (Martin 2012). Angulo et al. (2018) differentiate between regions with a low resistance (or ‘negative hysteresis’) that respond poorly to recessionary shocks and reach a lower equilibrium thereafter, and those with a higher threshold of resistance (‘positive hysteresis’) that rebound much more strongly after a downturn.
Pendall et al. (2010) are also critical of equilibrium analysis that presumes an almost steady state in a region. Instead, they draw on institutional theory and path dependence to frame thinking around resilience, that is, the host of institutional, social, and cultural factors that are already in evidence before an economic shock. Path dependence becomes particularly important, setting in place the possibilities that will be realised by present economic actions (Martin and Sunley, 2015; North, 1993; Setterfield, 1997). Swanstrom (2008) emphasises how the power of sovereign political authority affects regional development. In particular, in exploring the value of the resilience framework for thinking about how metropolitan or regional areas respond to challenges, Swanstrom (2008) alerts to the influential role of state governments in shaping the rules and institutions that govern metropolitan/regional areas amid the inherent power and conflict struggles that typically characterise regional governance. The latter point is pivotal for English regions. Copeland and Diamond (2022) believe that economic policy in England is hindered by a lack of institutional capacity at regional level and below. As will be demonstrated by our analysis later in the paper, the role of national policy in agenda setting for economic and regional development in particular is not only crucial but also sub-optimal. Policies focussing on job creation only can serve to dampen innovation and diversity. Moreover, the potential for a rapid rebound gauged exclusively on the basis of changes in employment figures can hide underlying problems of productivity.
A recurring and connected issue when considering resilience is that of productivity. A central interest in our study is whether economic shocks influence opportunities for higher productivity occupations. As Perrings (2006) notes, resilient systems that are productive in the long term may not prove to be in the short term. Tsiapa et al. (2018) stress the importance of embeddedness, resilience, and productivity being in evidence prior to a shock as being central to resistance and recovery. Giannakis and Mamuneas (2022) support this view, arguing that policies building a region’s competitive strengths can dampen negative shocks and improve recovery after. What is of interest is how a series of short, sharp shocks impacts English regional economies that are already under pressure from a range of institutional, cultural, and structural factors.
Kitson et al. (2004) make the very important observation that measures of productivity can be distorted and serve to distract from more serious underlying problems, potentially to the detriment of employment growth. This has not stopped policymakers from attempting to increase productivity through initiatives emphasising innovation, skills training, etc., a process Kitson et al. (2004) reflect on with the following observation, ‘It is as if a sort of Say’s law of regional competitive advantage is being invoked: if all the “drivers” are in place, then demand for the region’s products and services should follow’ (Kitson et al., 2004: 996). We do not subscribe to this uncritical stance presuming the positive impact of policy actions on regional competitiveness. In fact, we are of the view that this prevailing mindset may explain, for example, why policy responses to shocks that focus on employment retention are often undertaken with little thought given to labour market ramifications, the belief perhaps that with all the productivity policy tools in place, the natural outcome of employment maintenance interventions will be the manifestation of higher productivity jobs. As will be shown in our analysis, this is not the case for many English regions.
Economic shocks and their regional impacts
In keeping with the work of Sherwood-Call (1990), Overman and Puga (2002), Hassink (2010), Dawley et al. (2010), and Davoudi and Porter, (2012), we consider not just the impact of sudden economic downturns on regional employment through a resilience lens but also whether different exogenous events have differing regional reactions from an occupational perspective. Importantly, we frame our analysis around the question of productivity as a measure of success when considering ‘bounce back’ from an economic shock.
The first crisis we consider is the financial crisis of 2007-9. Widely perceived as a result of regulatory negligence, the global meltdown of financial institutions, precipitated by widespread failures in the US subprime mortgage market, saw international economies enter an extended period of recession. This shock brought to an end an extended period of Hyper Globalisation and replaced it with what Brakman and Van Marrewijk (2022) refer to as a period of Slowbalisation, a slowing or halting of the globalisation process (p. 408). The consequences were far-reaching; Groot et al. (2011) gave an approximate estimate of 3%–4% decline in GDP in the UK by mid-2010, and the same in unemployment. The crisis served to re-ignite the debate over spatially unbalanced growth in the UK economy, that national economic growth was too centrally focused on the South of England, with too great a dependency on the fortunes of London (Gardiner et al., 2013).
Compounding the economic challenges bequeathed by the credit crisis was the decision by the UK government to signal its intent to leave the European Union in 2016, having far-reaching, long-term repercussions for UK regional economies, so firmly embedded was the UK economy in the EU common market (Di Cataldo, 2016; Ramiah et al., 2017; Van Reenen, 2016). Van Reenen (2016) provides an example of much of the economic commentary in the build-up to the referendum in 2016 as well as the months after, arguing that the long-term effect of a hard Brexit would be greater barriers to trade, skills mismatch in the work force and falling investor confidence. In November of the same year, Van Reenen estimated this would manifest in social welfare losses of between 1.3% and 2.6% and productivity losses of up to 9.5% within 10 years of Brexit being completed, depending on a ‘soft’ or ‘hard’ landing (pp. 372-7). Other analysts also predicted a contraction in trade (Brakman et al., 2018; Dhingra et al., 2018), a sectoral downturn regionally (Ramiah et al., 2017), and a difficult trading environment post-Brexit (Tetlow and Stojanovic, 2018).
While the final Brexit decision was not taken until March 2017 and actual exit did not occur until January 2020, the attendant uncertainty and the necessity for future proof planning served to inhibit investor confidence and depress economic activity prior to the actual exit itself (Tetlow and Stojanovic, 2018). Hall refers to ‘waiting in the shadow of Brexit’ arguing that the long wait cast a pall over everyday life including economic activity (Hall, 2022). The role of economic experts was particularly crucial with many predicting highly negative consequences, compared to a handful of more positive assessments (Hall, 2022; Minford, 2019). Reports from manufacturers and local policymakers attested to the negative impact that the spectre of Brexit held for regional economies (MAKE, 2018a, 2018b, 2019, 2020).
Disaggregating the actual impact of leaving the EU is greatly complicated by the emergence of the COVID-19 pandemic during the same period. Efforts have been made to try to understand the geographies of deleterious economic outcomes associated with the pandemic (Allain-Dupré et al., 2020). Cross et al. (2022) found that the economic effect of COVID-19 was more acutely felt in poorer areas, though job retention schemes dampened the immediate effect on employment (Andras, 2022). Trade in UK services exports decreased in all regions apart from London and Northern Ireland, which saw increases of £8.4 billion and £65.0 million, respectively. Growth in these regions was driven by financial and insurance activities as well as the information and communication sector (ONS, 2022). Exports in transportation, storage, accommodation and food services as well as the manufacturing sector were particularly vulnerable to the crisis (ONS, 2022).
The scale and severity of these three crises, allied to their temporal proximity, necessitated a strong response from governing bodies. The role of such institutional efforts to mitigate the worst effects is crucial to framing our understanding of resilience in regional economies during shocks (Hassink, 2010; Pendall et al., 2010; Swanstrom, 2008). It was not just monetary support that served to dampen economic travails, decision-making related to sectoral winners and losers, and later command economy style occupational selections, all served to alter the response of regions to economic downturn. Thus, the response of institutional actors may have inadvertently altered regional economies, giving credence to the views of Martin (2012) and Martin and Sunley (2015).
An example of such actions is the contested decision to provide a government bailout in response to the financial crisis in the UK banking sector. The near insolvency of major financial institutions engendered a fiscal intervention to provide liquidity, debt guarantees, and recapitalisations causing losses of public funding of up to £18 billion, eventually rising to £32 billion in 2012 (Culpepper and Reinke, 2014). This direct intervention in the form of quantitative easing (QE) not only changed the nature of the banking sector (for a balanced critique of the QE policy mission, see De Vita and Abbott, 2011), but employment figures were also altered by effectively propping up weakened areas of the UK economy.
The political response to the 2016 referendum on European membership also provides an example of policy distorting economic life. Johnson and Mitchell (2017) argue that there were two key policy responses by government: the reduction of interest rates and the relaxation of fiscal regulation and accountability related to borrowing. Partly, this stemmed from the recognition that many UK regions stood to lose substantially from the end of EU structural funds. In the immediate aftermath of the referendum vote in 2016, much of the commentary in relation to the financial sector revolved around pessimistic predictions of job and capital flight (Armour, 2017). However, the introduction of the ‘Temporary Permissions Regime under the Financial Conduct Authority’ gave the sector an interim reprieve, allowing businesses using EU passporting rights to operate in the UK until December 2023. The signing of the UK-EU Trade and Cooperation Agreement in 2021 gave preferential treatment to certain service sectors, including the financial one (European Affairs Committee, 2022). In this instance, recognition of key sectors and actions taken to support the business environment restored confidence and offset an impetus toward greater capital and labour mobility.
The final policy initiatives to consider are those pertaining to the 2019 pandemic. The socio-economic impact of COVID-19 was extensive, with large swathes of populations in different countries isolating to stem the flow of infections. In the UK, this seclusion included schemes to both support homeworking but also furloughing of staff. Working from home offered a means of risk avoidance, for example, 46.6% of people in employment were engaged in work at home in April 2020, with 86.0% of those workers choosing this option as a result of COVID-19 (ONS, 2020a, 2020b). Starting in March 2020, 11.2 million workers were also cumulatively placed on furlough up until February 2021 (ONS, 2020b, 2021). These figures were included in the Business Register and Employment Survey (BRES) data for that year, captured within their respective occupations, but the act of furloughing served to freeze these occupations in place in terms of survey returns according to the Northern Ireland Statistics and Research Agency (NISRA, 2023).
The same holds true for those workers identified as key to maintaining the effective functioning of the economy. Employees deemed essential were asked to continue to work during the pandemic. These employees, categorised as ‘key workers’, represented 32.6% of the total UK workforce (ONS, 2020a, 2020b). The centrality of these key workers to the economy during these years inhibited shifts in and out of the labour force. Whilst early assessments of furloughing hail this policy intervention as an unambiguously successful (albeit temporary) response to the COVID-19 crisis to preserve jobs, thus preventing unemployment and enabling a swifter recovery (see Spencer et al., 2023), we wish to draw attention to the important fact that furloughing and identifying key workers, by hindering movement within and across sectors, skewed any analysis of sectoral shifts. These effects of furloughing also provide a rationale for including in our analysis the impact of the COVID-19 pandemic, despite the analytical difficulties this endeavour presents.
Methodology
We use Dynamic Shift Share Analysis (DSSA) to examine employment change within UK regions (as well as regional competitiveness), which is central to the question of regional diversity, regional specialisation, and resilience. Dynamic shift-share analysis is not only a fit-for-purpose method to employ given the central purpose of the present study but an ideal analytical tool to unveil important patterns in the data. Going well beyond the presentation of a mere set of statistics or stylised facts, the dynamic shift-share results are the outcome of a careful application of a rigorous, empirical (based on replicable ‘observation and experiment’) methodology that is duly analytical in nature. The method is further legitimised by its increasing adoption in studies aimed at identifying differences in economic development across regions and analysing the structural changes within them (the recent study by Dobrzanski et al., 2024, aimed at both identifying the regions left behind in the CEE countries and analysing the structural and productivity changes taking place within them, is a case in point). Below we discuss both Shift Share and Dynamic Shift Share analyses, and the value of the latter in particular.
Simple shift-share first emerged in the 1940s as a means of representing changes in local or regional economic structures compared to the national picture. By taking 2 years as a start and endpoint and comparing change in a specific region compared to national growth and change, a picture of sectoral change (

Change in employment in an industry is equal to employment in that industry in a specific year, less employment in that industry in the first year of comparison. This is equal to change due to national trends added to ‘Change due to Industrial mix’ plus ‘Change Due to Local Shift’. In essence, shift share gives a broad overview of employment change in an industrial sector between two fixed periods in time and estimates how much can be attributed to national growth overall, how much can be explained by growth in the industry itself, and how much employment can be explained above or below expected change that can be ascribed to local or regional factors. It does not offer explanations for change but points to where it is likely occurring. The method is attractive for its utility in identifying areas of economic activity worthy of further investigation. However, it lacks nuance and has received criticism for only offering a partial picture of change. The most serious criticism relates to the initial weights for industrial composition, which do not reflect changes in industry mix.
Shift-share is also very sensitive to the degree of industrial disaggregation (Richardson, 1978). Results are still meaningful at the first level of occupational categorisation using an index such as SIC 2007. However, as one moves from sections to sub-sections, for example, moving from Section B ‘Mining and quarrying’ to sub-section B5 ‘Mining of coal and lignite’, the sheer number of sub-categories makes meaningful analysis less feasible (Loveridge and Selting, 1998). For this reason, the majority of this work concentrate on the 21 main sections of SIC 2007, with use of sub-sections made for illustrative purposes only.
Important factors like demographics, business cycles, emergent markets, or capital investment are not considered. To better understand trends over time, Barff and Knight (1988) recommend calculating shift-share values annually and tracking change using these moving points. The results are then presented as either a summation of all annual change, or all annual shift-share figures calculated for each year, and in this way evening out annual fluctuations while still giving a reasonably accurate picture of activity (Kochanowski et al., 1989; Loveridge and Selting, 1998). This dynamic version of shift-share analysis gives a better understanding of what is happening between the start and end points of the shift-share analysis itself and is typically presented as a series of years, or often summed or averaged to give a better overview of change from the start and end of the period under analysis.
As Knudsen (2000: 19) notes, DSSA also ‘allows for the identification of unusual years and years of economic transition’ which is crucial when examining data for the trends emerging from economic shocks. However, while such approaches are useful for understanding industrial change at a regional level compared to the national picture over time, they do not readily indicate regional trends by themselves. Lahr and Ferreira (2021) suggest that regions may have business cycles of their own and recommend a separate analysis of same (2021, p. 10). For the purposes of this research, the summation approach has been chosen due to the volume of data and number of regional and sectoral components under scrutiny. The approach is supplemented where appropriate with examples of change over time. Further, the key performing sectors in each region during the period of interest have been chosen for examination. Additionally, a separate regional analysis of the most important sectors across English regions, as recommended by Lahr and Ferreira (2021), helps reveal the underlying factors explaining sectoral performance as identified by shift-share analysis.
Regional analysis and results
The data for the regional analysis was supplied by the Office of National Statistics through NOMIS, the repository of official census, and labour market statistics. Two open access datasets were used for replicability: the Annual Population Survey and the Business Register and Employment Survey (BRES). 1 The former is a residence-based labour market survey encompassing population, economic activity (employment and unemployment), economic inactivity, and qualifications. BRES is an employer survey of the number of jobs held, broken down by industry. BRES publishes employee and employment estimates at detailed geographical and industrial levels and is the official source of employee and employment estimates by detailed geography and industry.
In terms of the data used, the industrial categories as defined in ONS, 2022 remain consistent across all (21) sectors (which we refer to as the first level – or highest categorisation – of occupational changes occurring in terms of employment numbers) and (96) sub-sectors throughout the period under review (ONS, 2022). 2 The only change in the data occurs in 2015 when numbers of PAYE workers are included in some categories for the first time, but the numbers are negligible. Three measures are used to examine occupational performance in varying industrial sectors in English regions over two time periods. These measures are employment, productivity, and DSSA. The first timeframe runs from 2009 to 2019, while the period of the pandemic will be treated separately, in the penultimate section, due to associated data collection challenges.
For 2009–2019, there is remarkable consistency across English regions other than London.
3
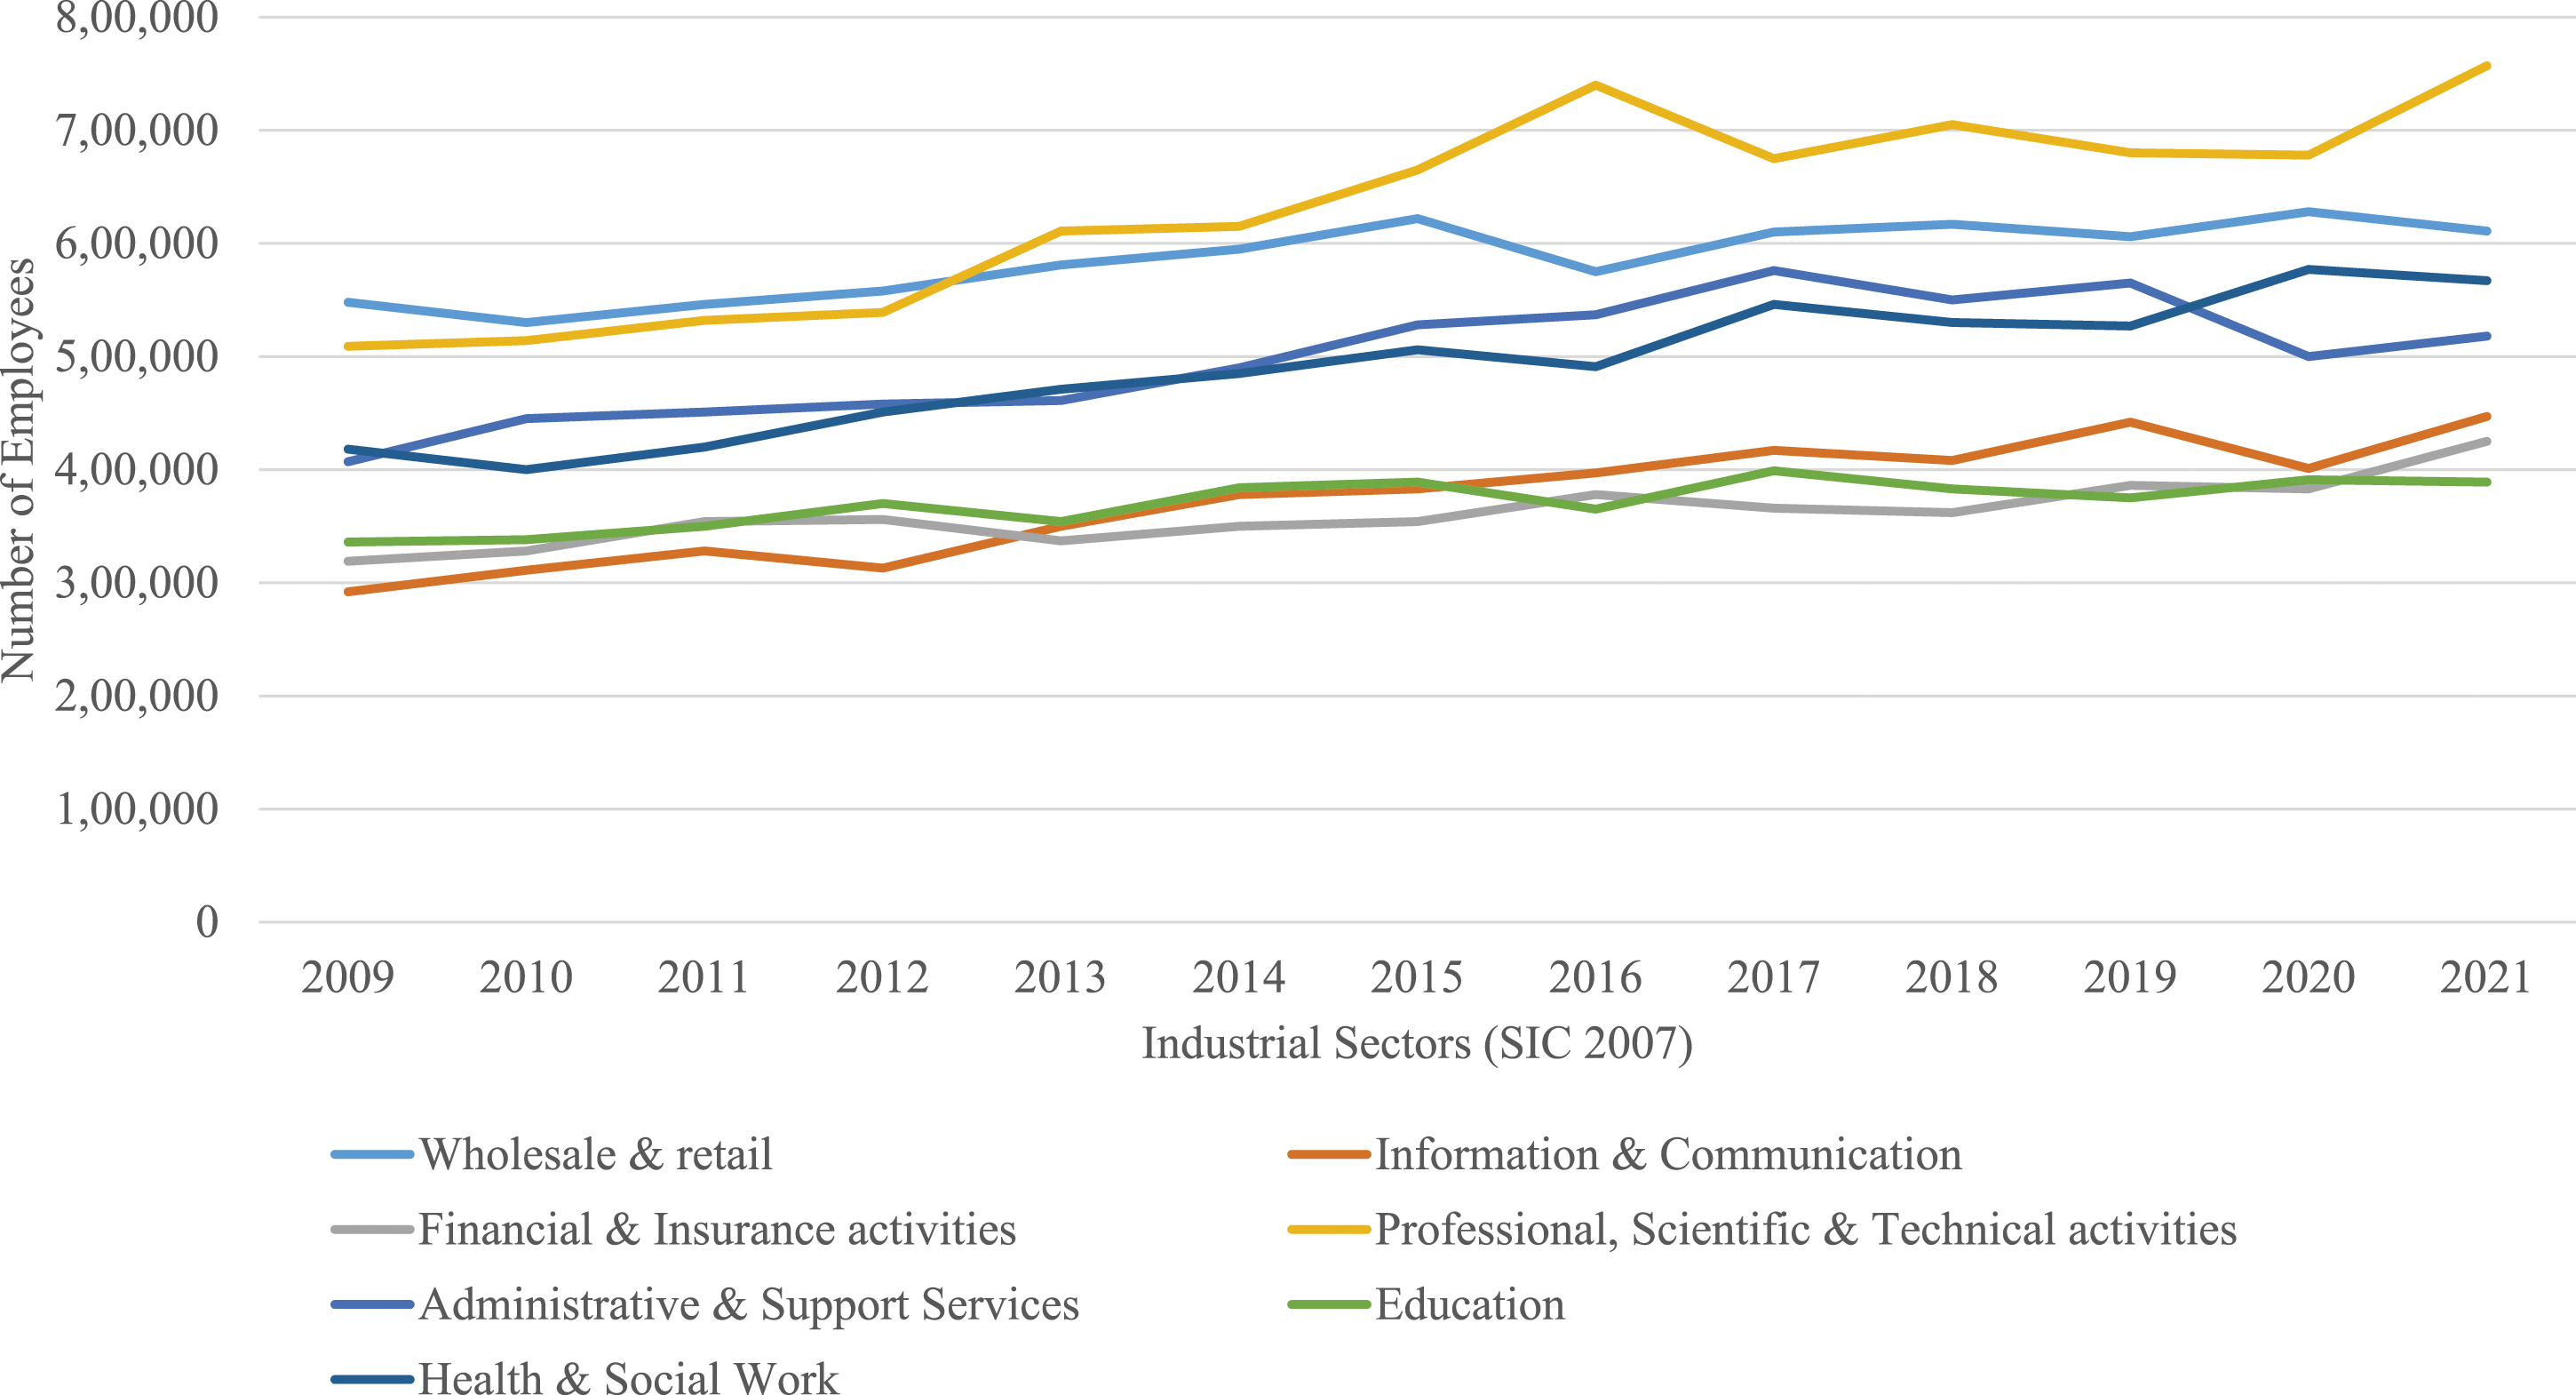
Looking at the top-performing sectors in the Midlands and Northern regions, ‘Wholesale and retail trade’, ‘Human health and social activities’, and ‘Manufacturing’ are the biggest employers, with the latter being replaced by either ‘Administrative and support service activities’ or ‘Education’ further South. Other crucial employers include ‘Accommodation and food service’, ‘Public administration and defence’, ‘Administrative and support service activities’, and ‘Professional, scientific, and technical activities’, though the importance of the retail sector and the health sector was rarely challenged. Figure 1 from the Yorkshire and Humber region is an example of occupational frequency for these years.
4
Changes in employment numbers in largest industrial sectors in the Yorkshire and Humber region, 2009–2019. Note: Source. Compiled from regional returns of the Business Register and Employment Survey 2022 using NOMIS, an official census and labour market statistics service supplied by the ONS. See: https://www.nomisweb.co.uk/.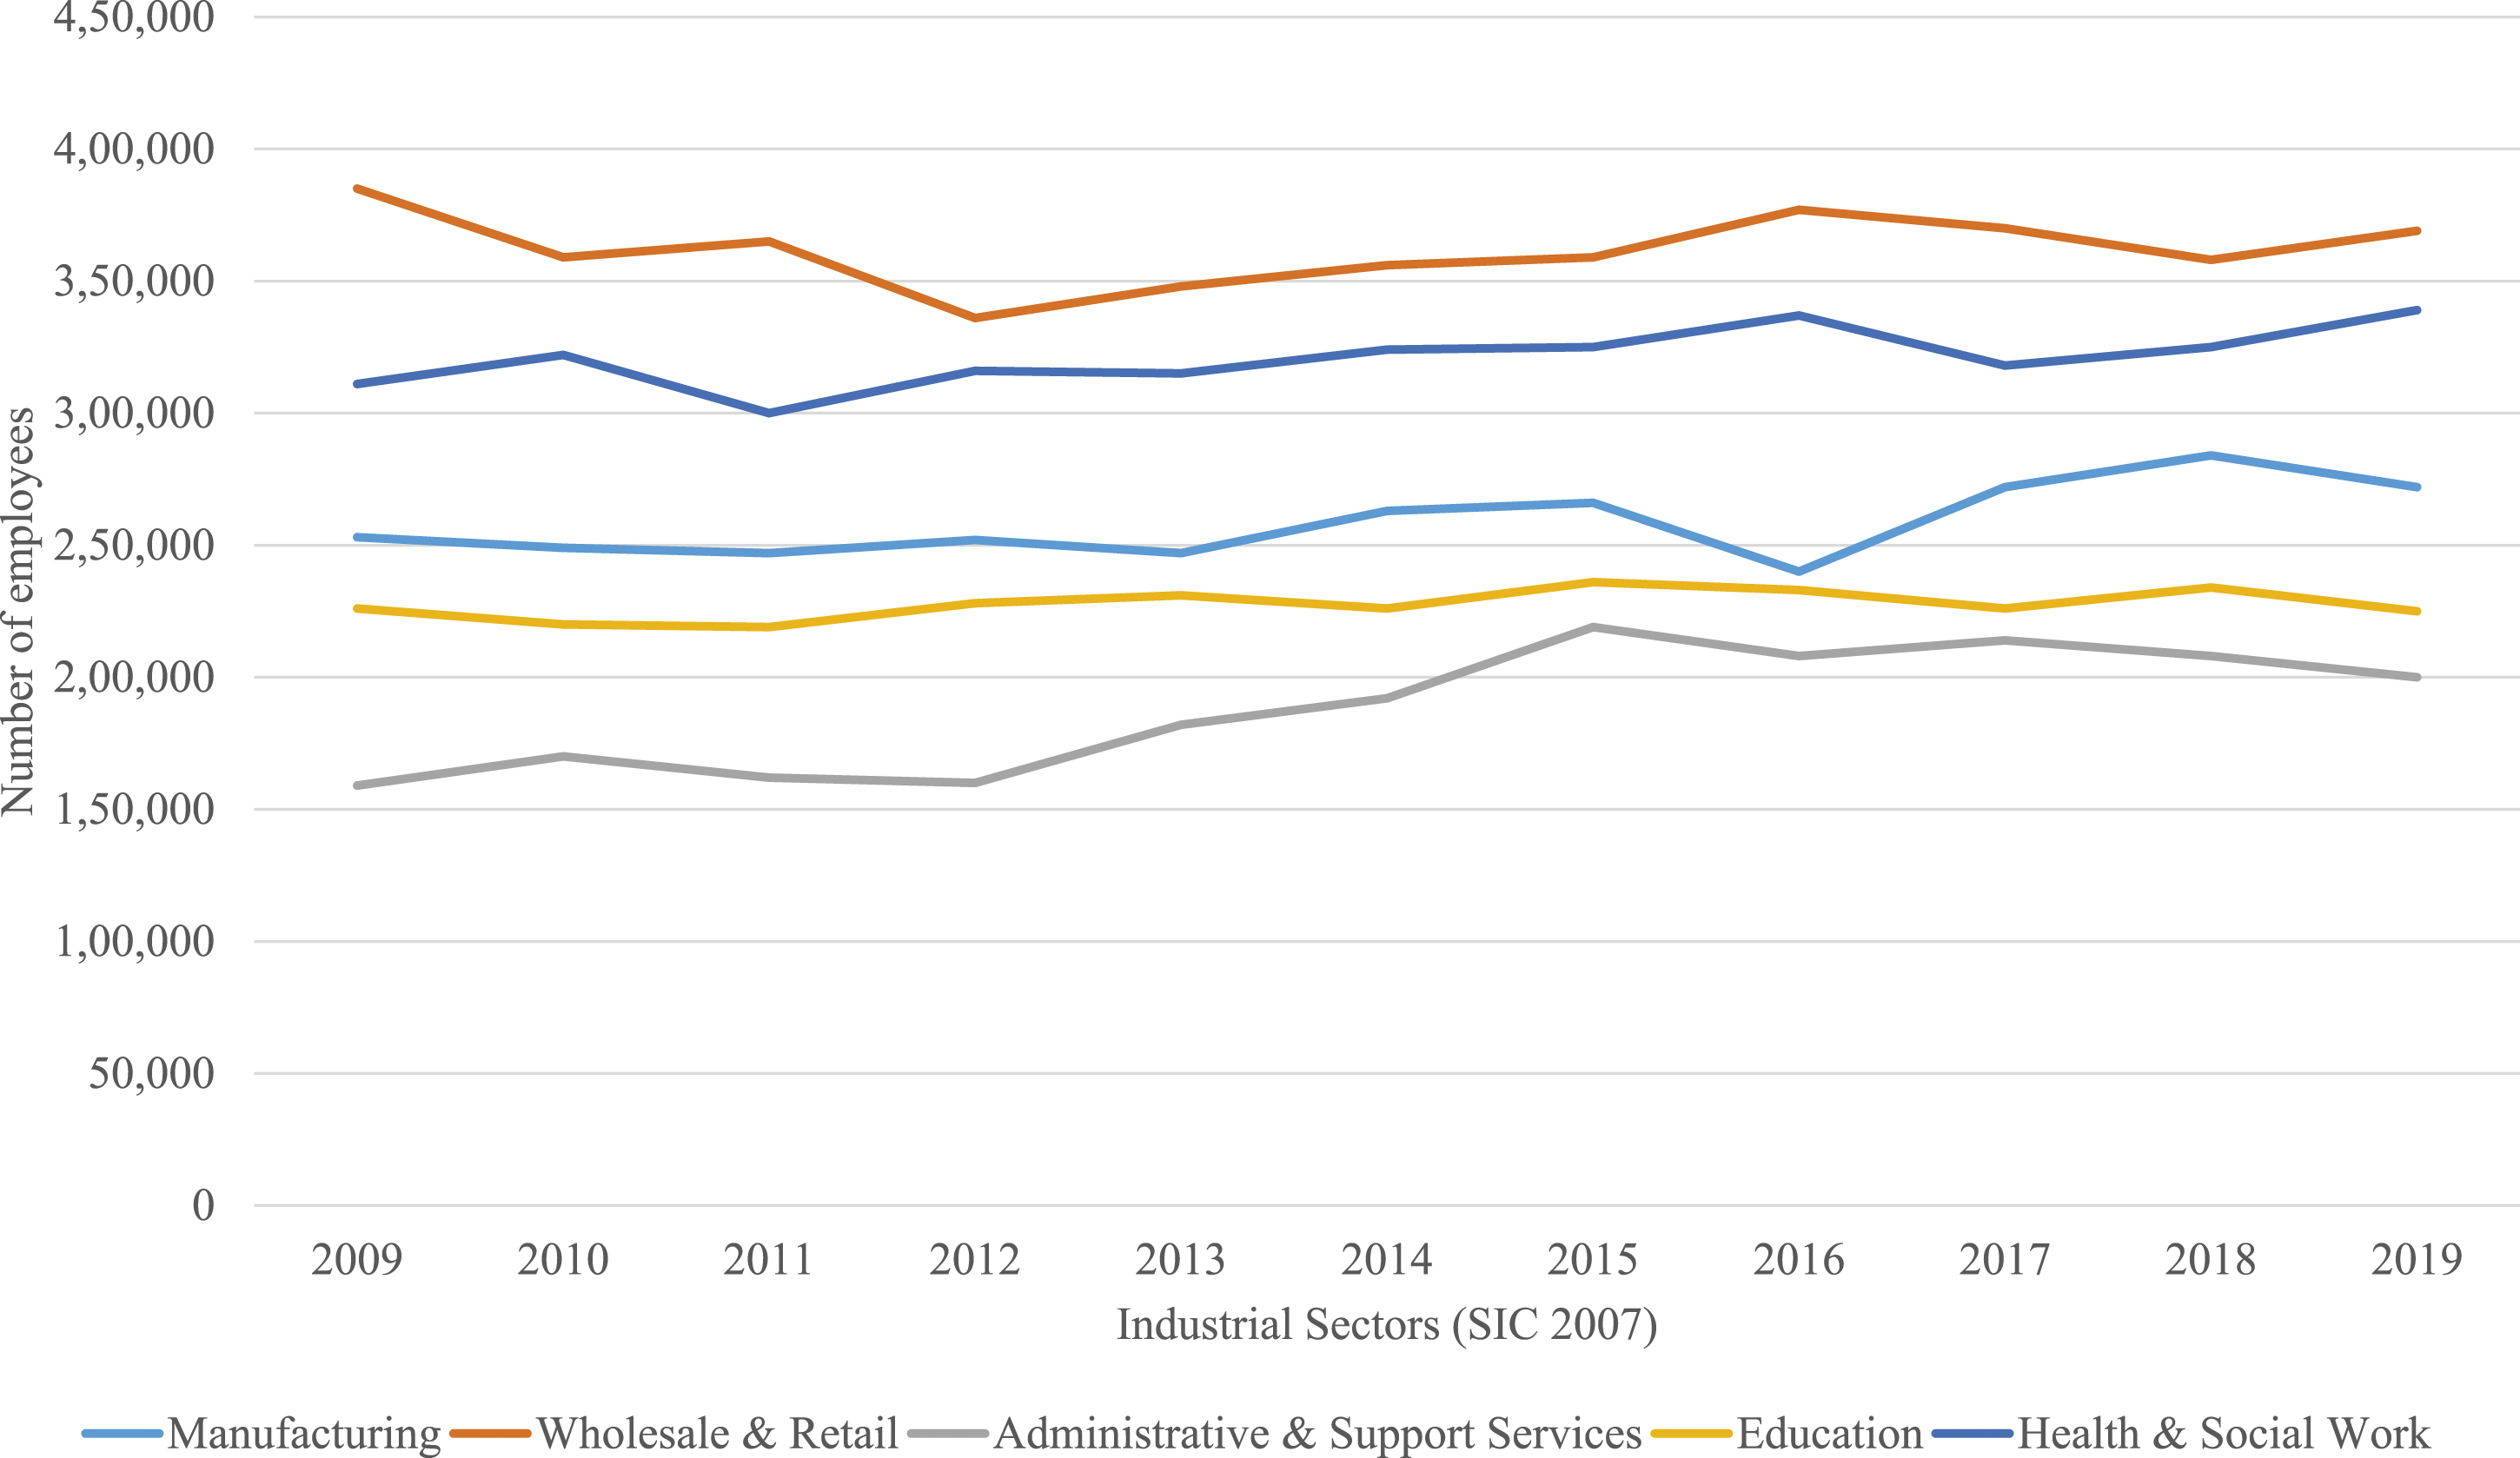
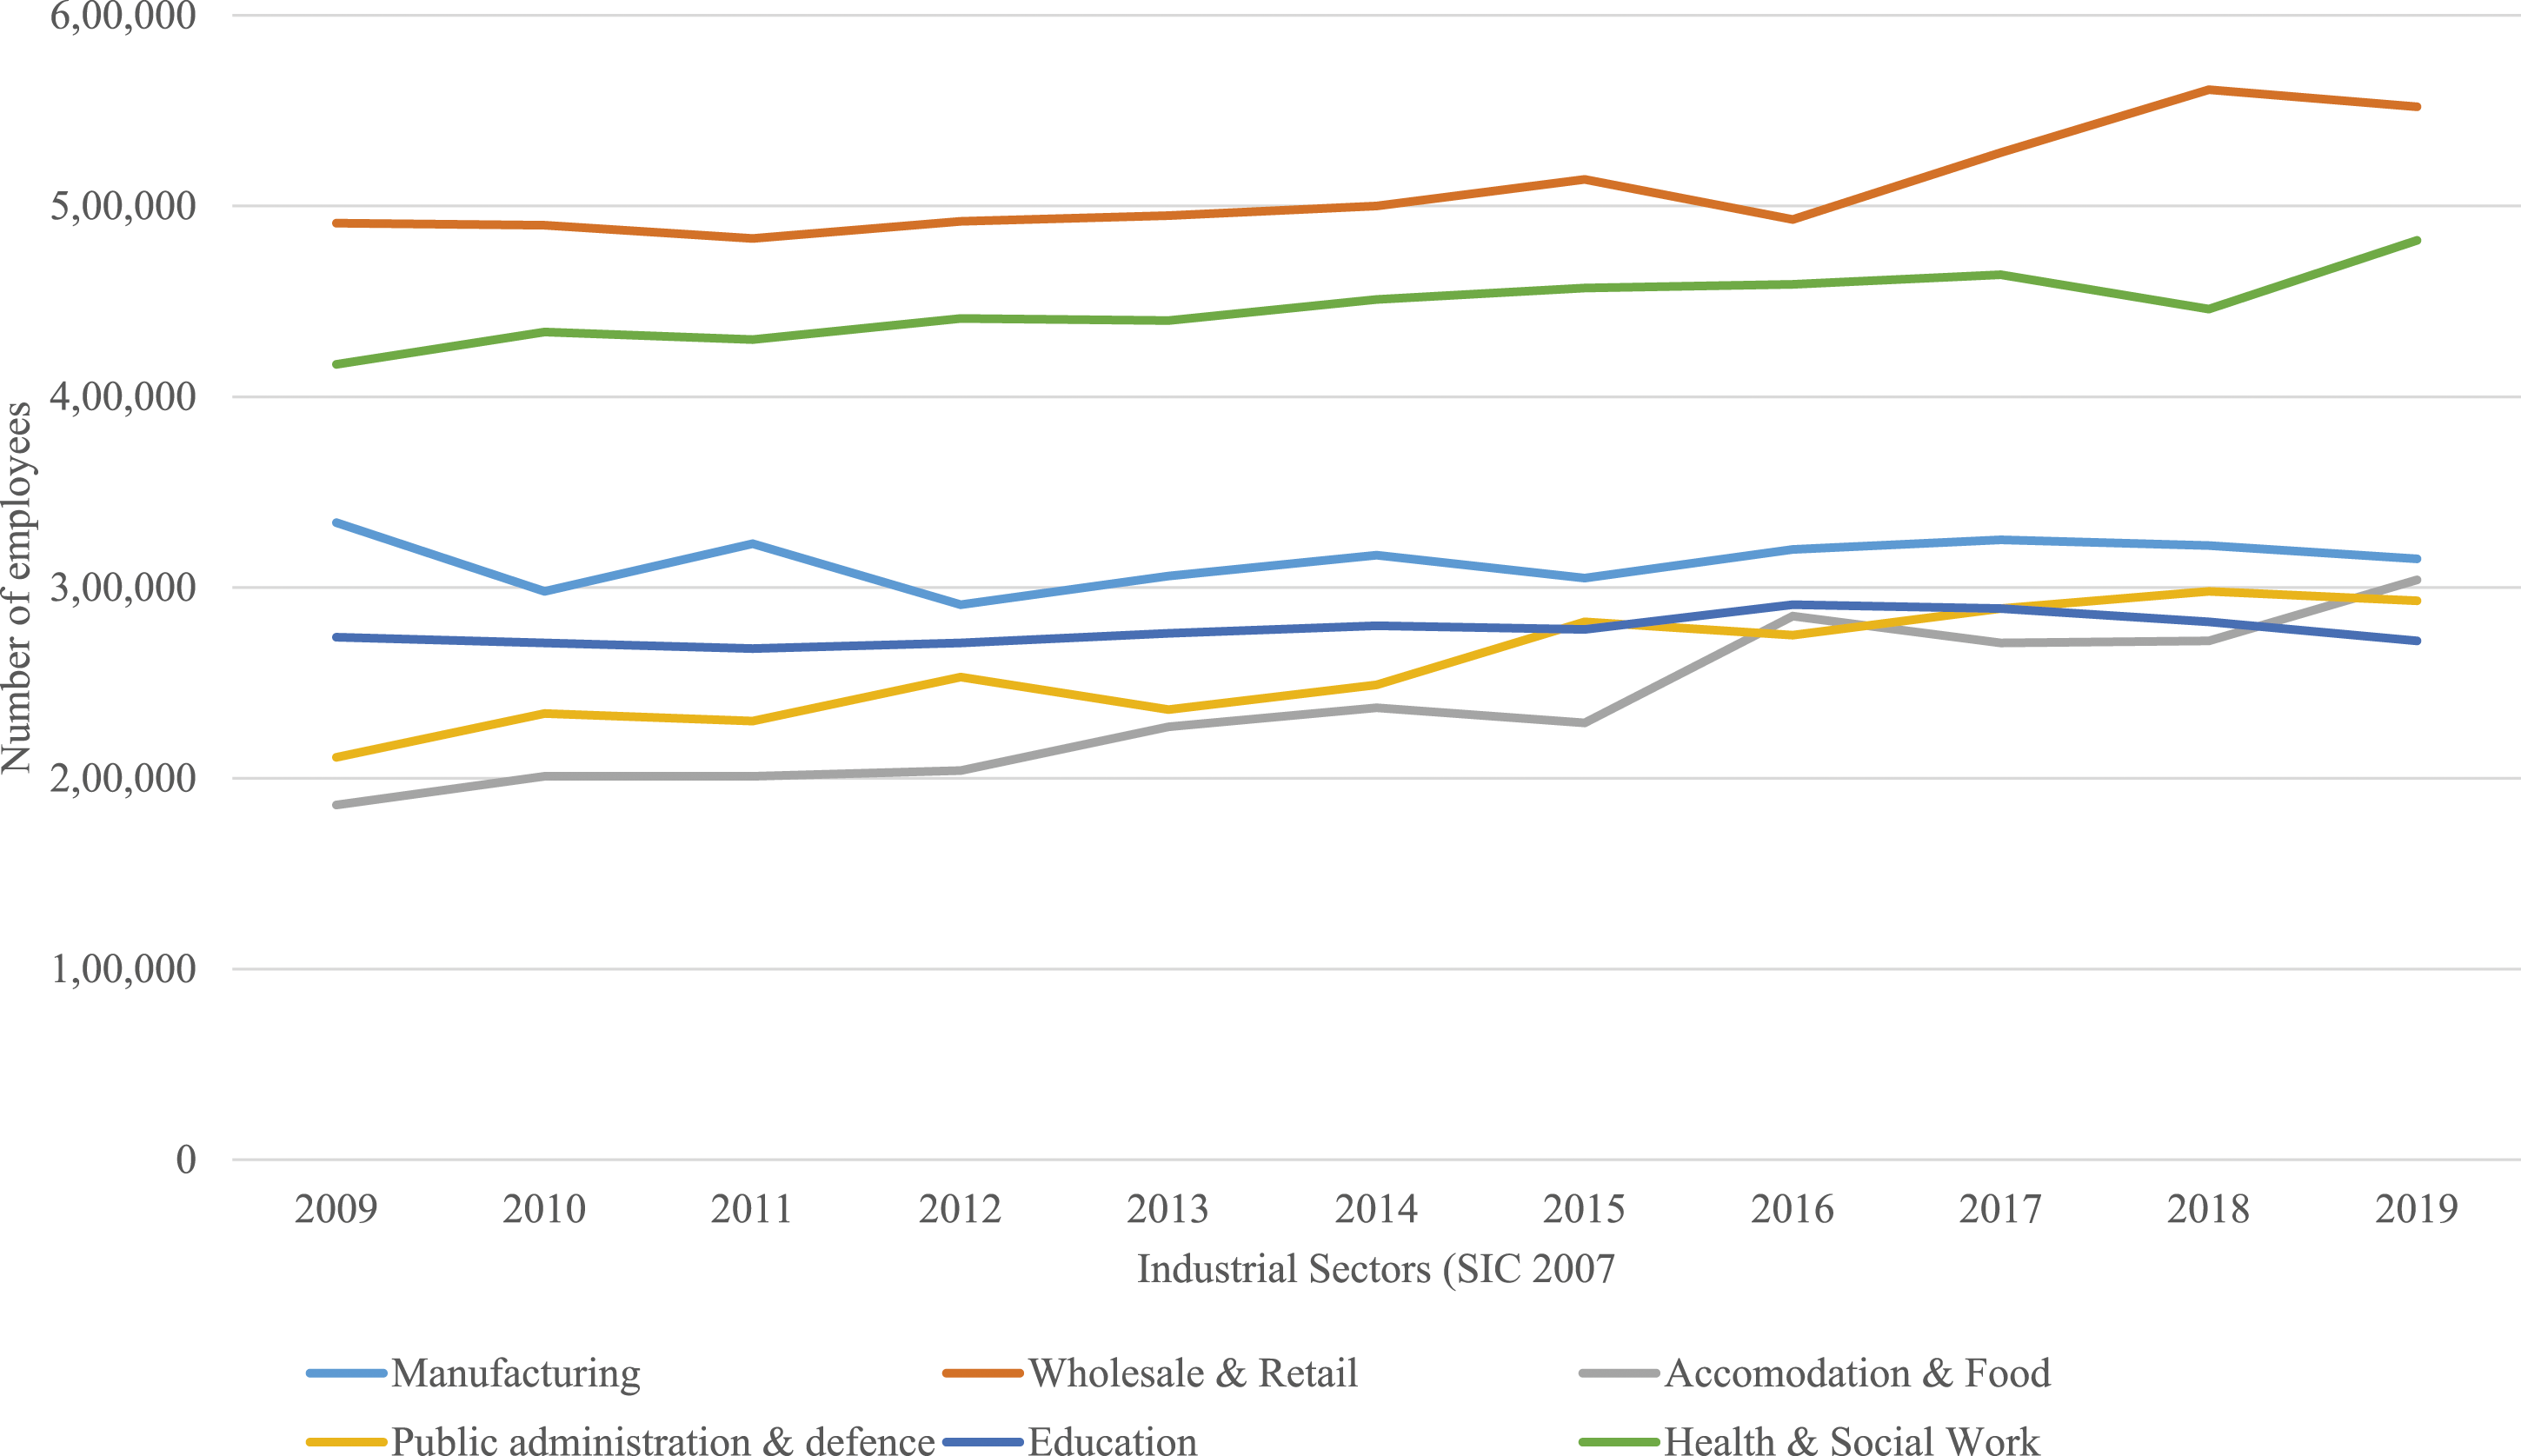
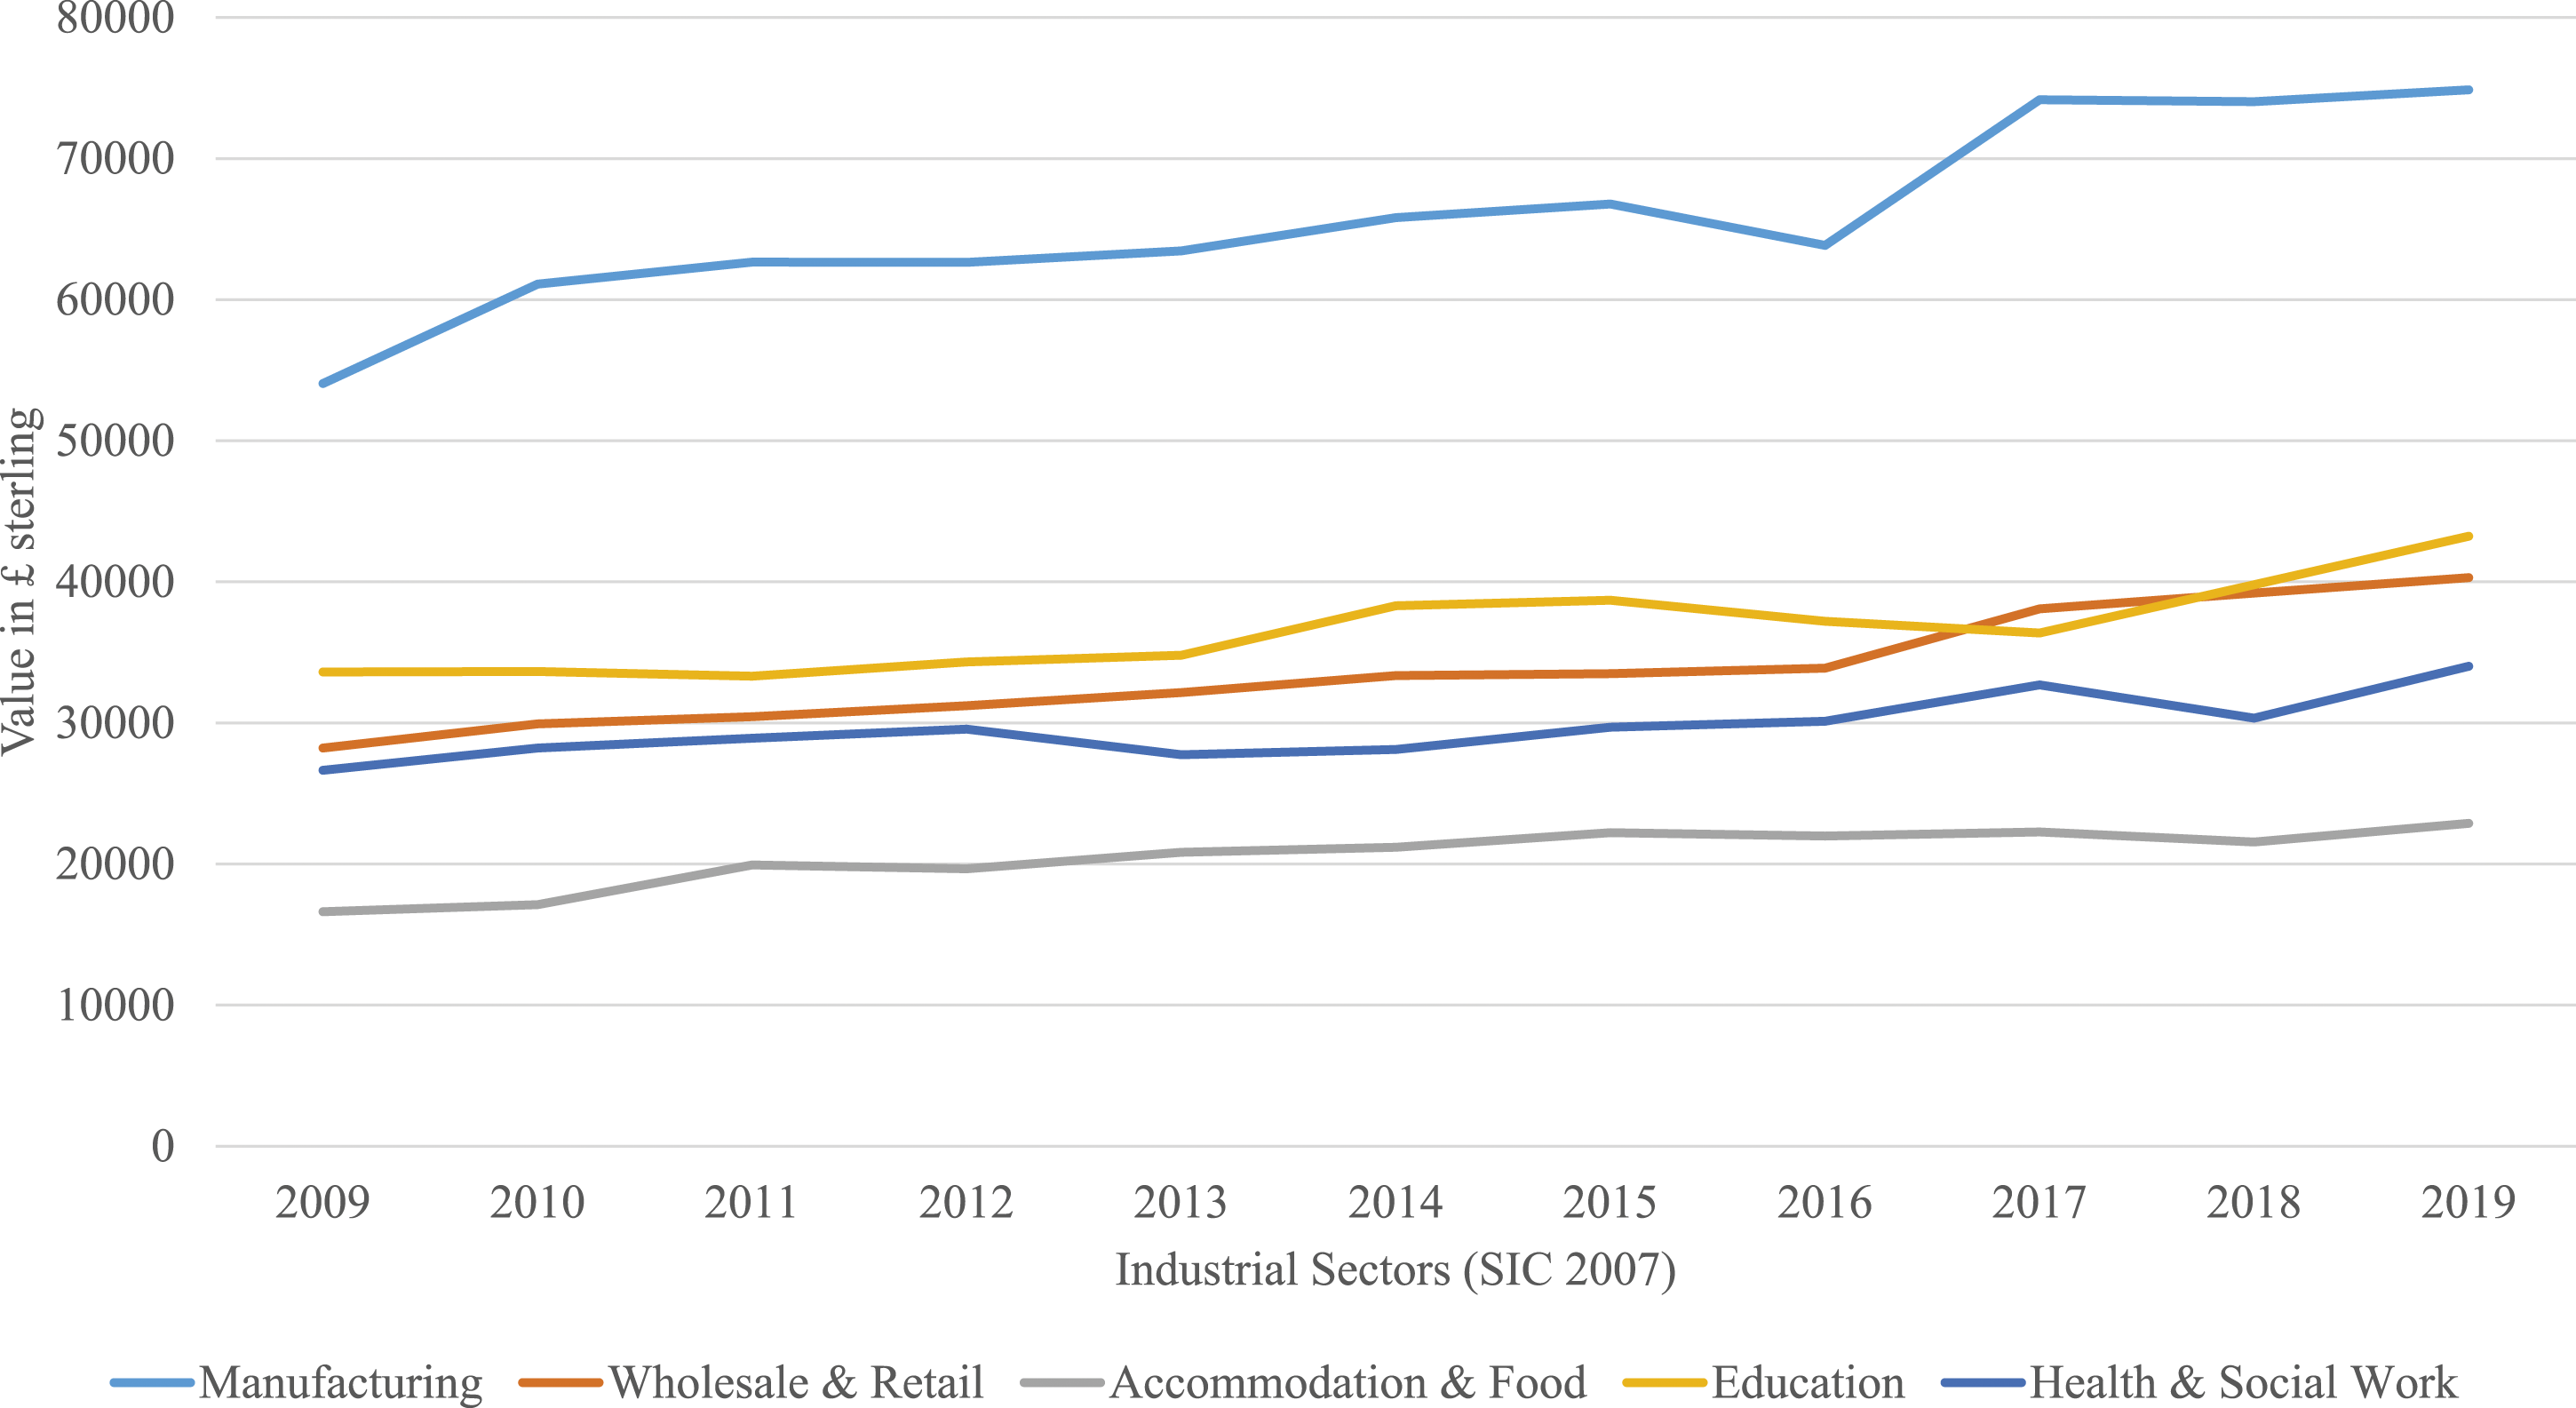
What is most surprising is how static employment in different industrial sectors is, even during periods of economic turmoil. For example, even though the retail sector struggles in terms of employment numbers post-financial crisis in 2009, it recovers from 2011 onwards and never falls back to that low level. The health sector follows a similar pathway, while administrative services thrive during the decade. Education appears unperturbed by exogenous economic shocks, a trend repeated across regions. The one key sector that trends downwards across a number of English regions, for example, in Yorkshire and Humber, the North West and East, is ‘Manufacturing’. Figure 1 shows a sharp fall after 2015, recovery through to 2018 and then decline once more, though still above the 2009 level. Figure 2 for the East shows a more pronounced downturn over time, while Figure 3 for the North West is also volatile but trending downwards. Changes in employment numbers in largest industrial sectors in the East region, 2009–2019. Note: Source. Compiled from regional returns of the Business Register and Employment Survey 2022 using NOMIS, an official census and labour market statistics service supplied by the ONS. See: https://www.nomisweb.co.uk/. Changes in employment numbers in largest industrial sectors in the North West region, 2009–2019. Note: Source. Compiled from regional returns of the Business Register and Employment Survey 2022 using NOMIS, an official census and labour market statistics service supplied by the ONS. See: https://www.nomisweb.co.uk/.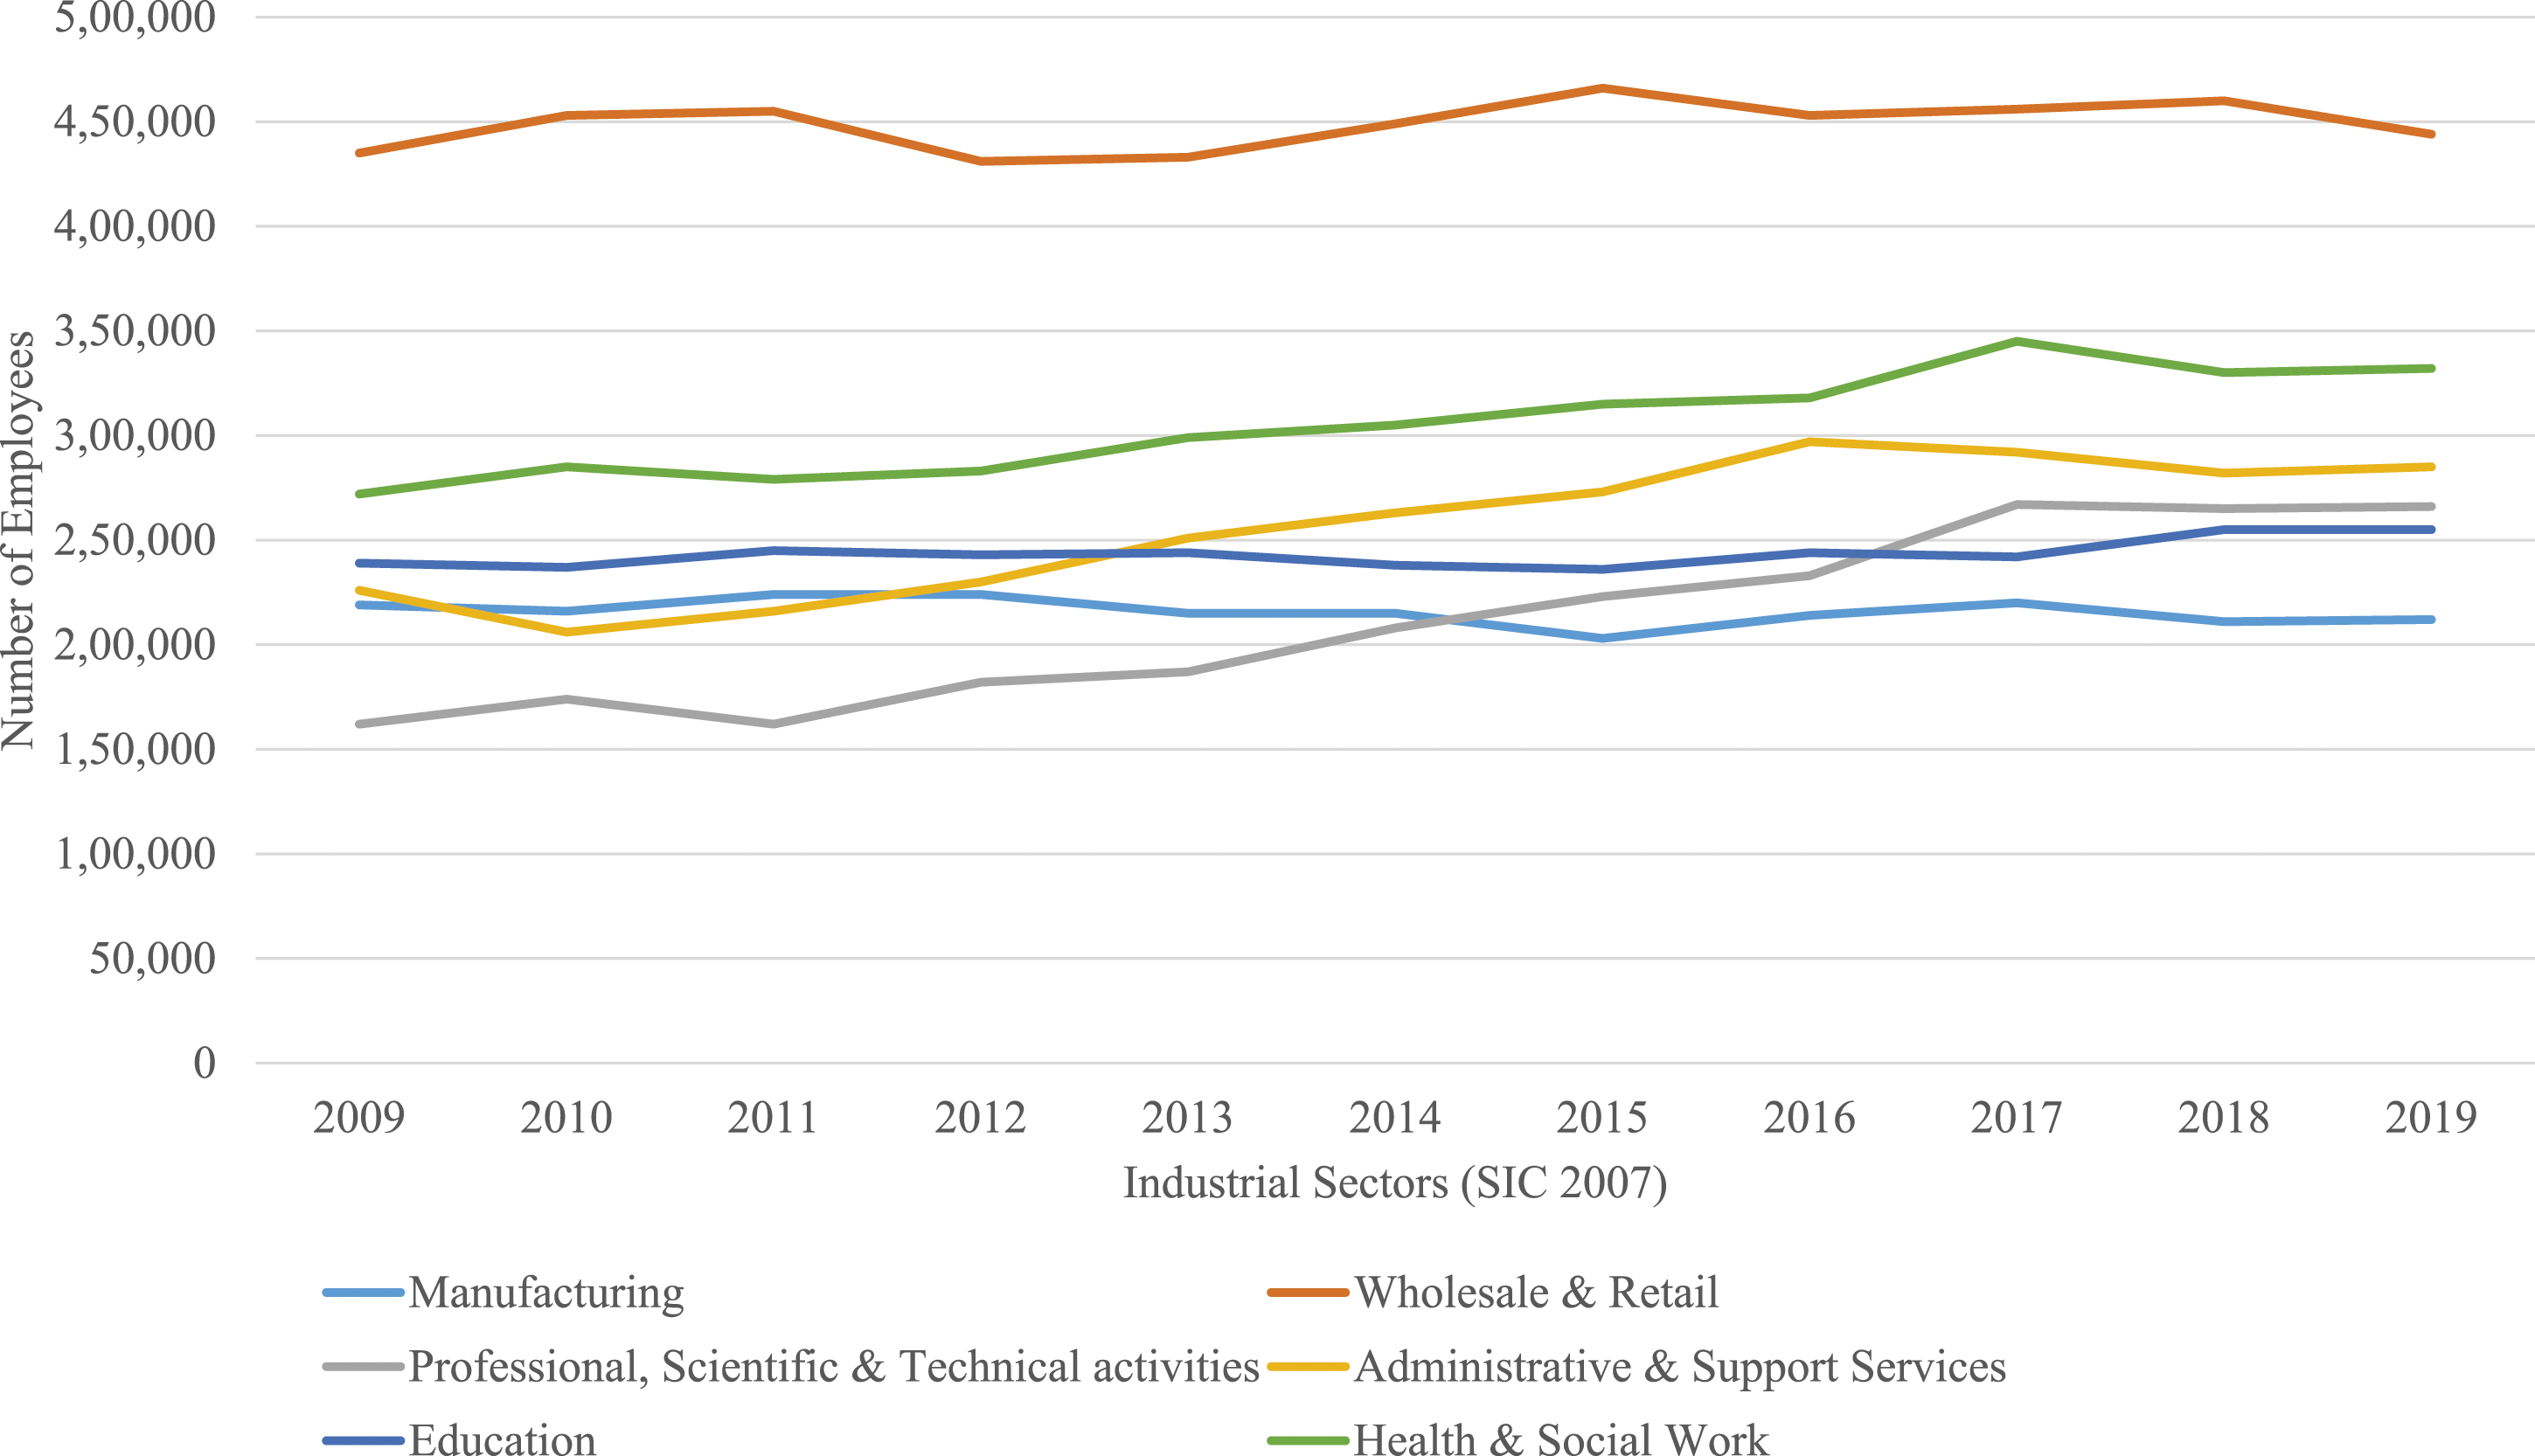
The outlier is London (see Figure 4), as the period under review shows near continuous growth in employment in largest sectors. The biggest employer is ‘Professional, scientific, and technical activities’. Much of this growth was down to the burgeoning numbers of those classified as being involved in ‘Technical testing and analysis’, notably in architecture and construction (ONS, 2023d). Arguably big construction projects were driving much of this success (APS, 2016; HMSO, 2021). Professional services surpassed the ‘Wholesale and retail trade’ sector in 2012/13, the second biggest employer in the region. Much of the success in retail in the London region is driven by warehousing, as London is a major retail hub for other regions (Pain, 2008). As with other regions, the health sector was a significant employer, closely followed by ‘Administrative and support services’ which included rental, leasing, construction, and financial services. Notably, ‘Manufacturing’ has a much lower presence in London than in other regions. Changes in employment numbers in largest industrial sectors in the London region, 2009–2019. Note: Source. Compiled from regional returns of the Business Register and Employment Survey 2022 using NOMIS, an official census and labour market statistics service supplied by the ONS. See: https://www.nomisweb.co.uk/.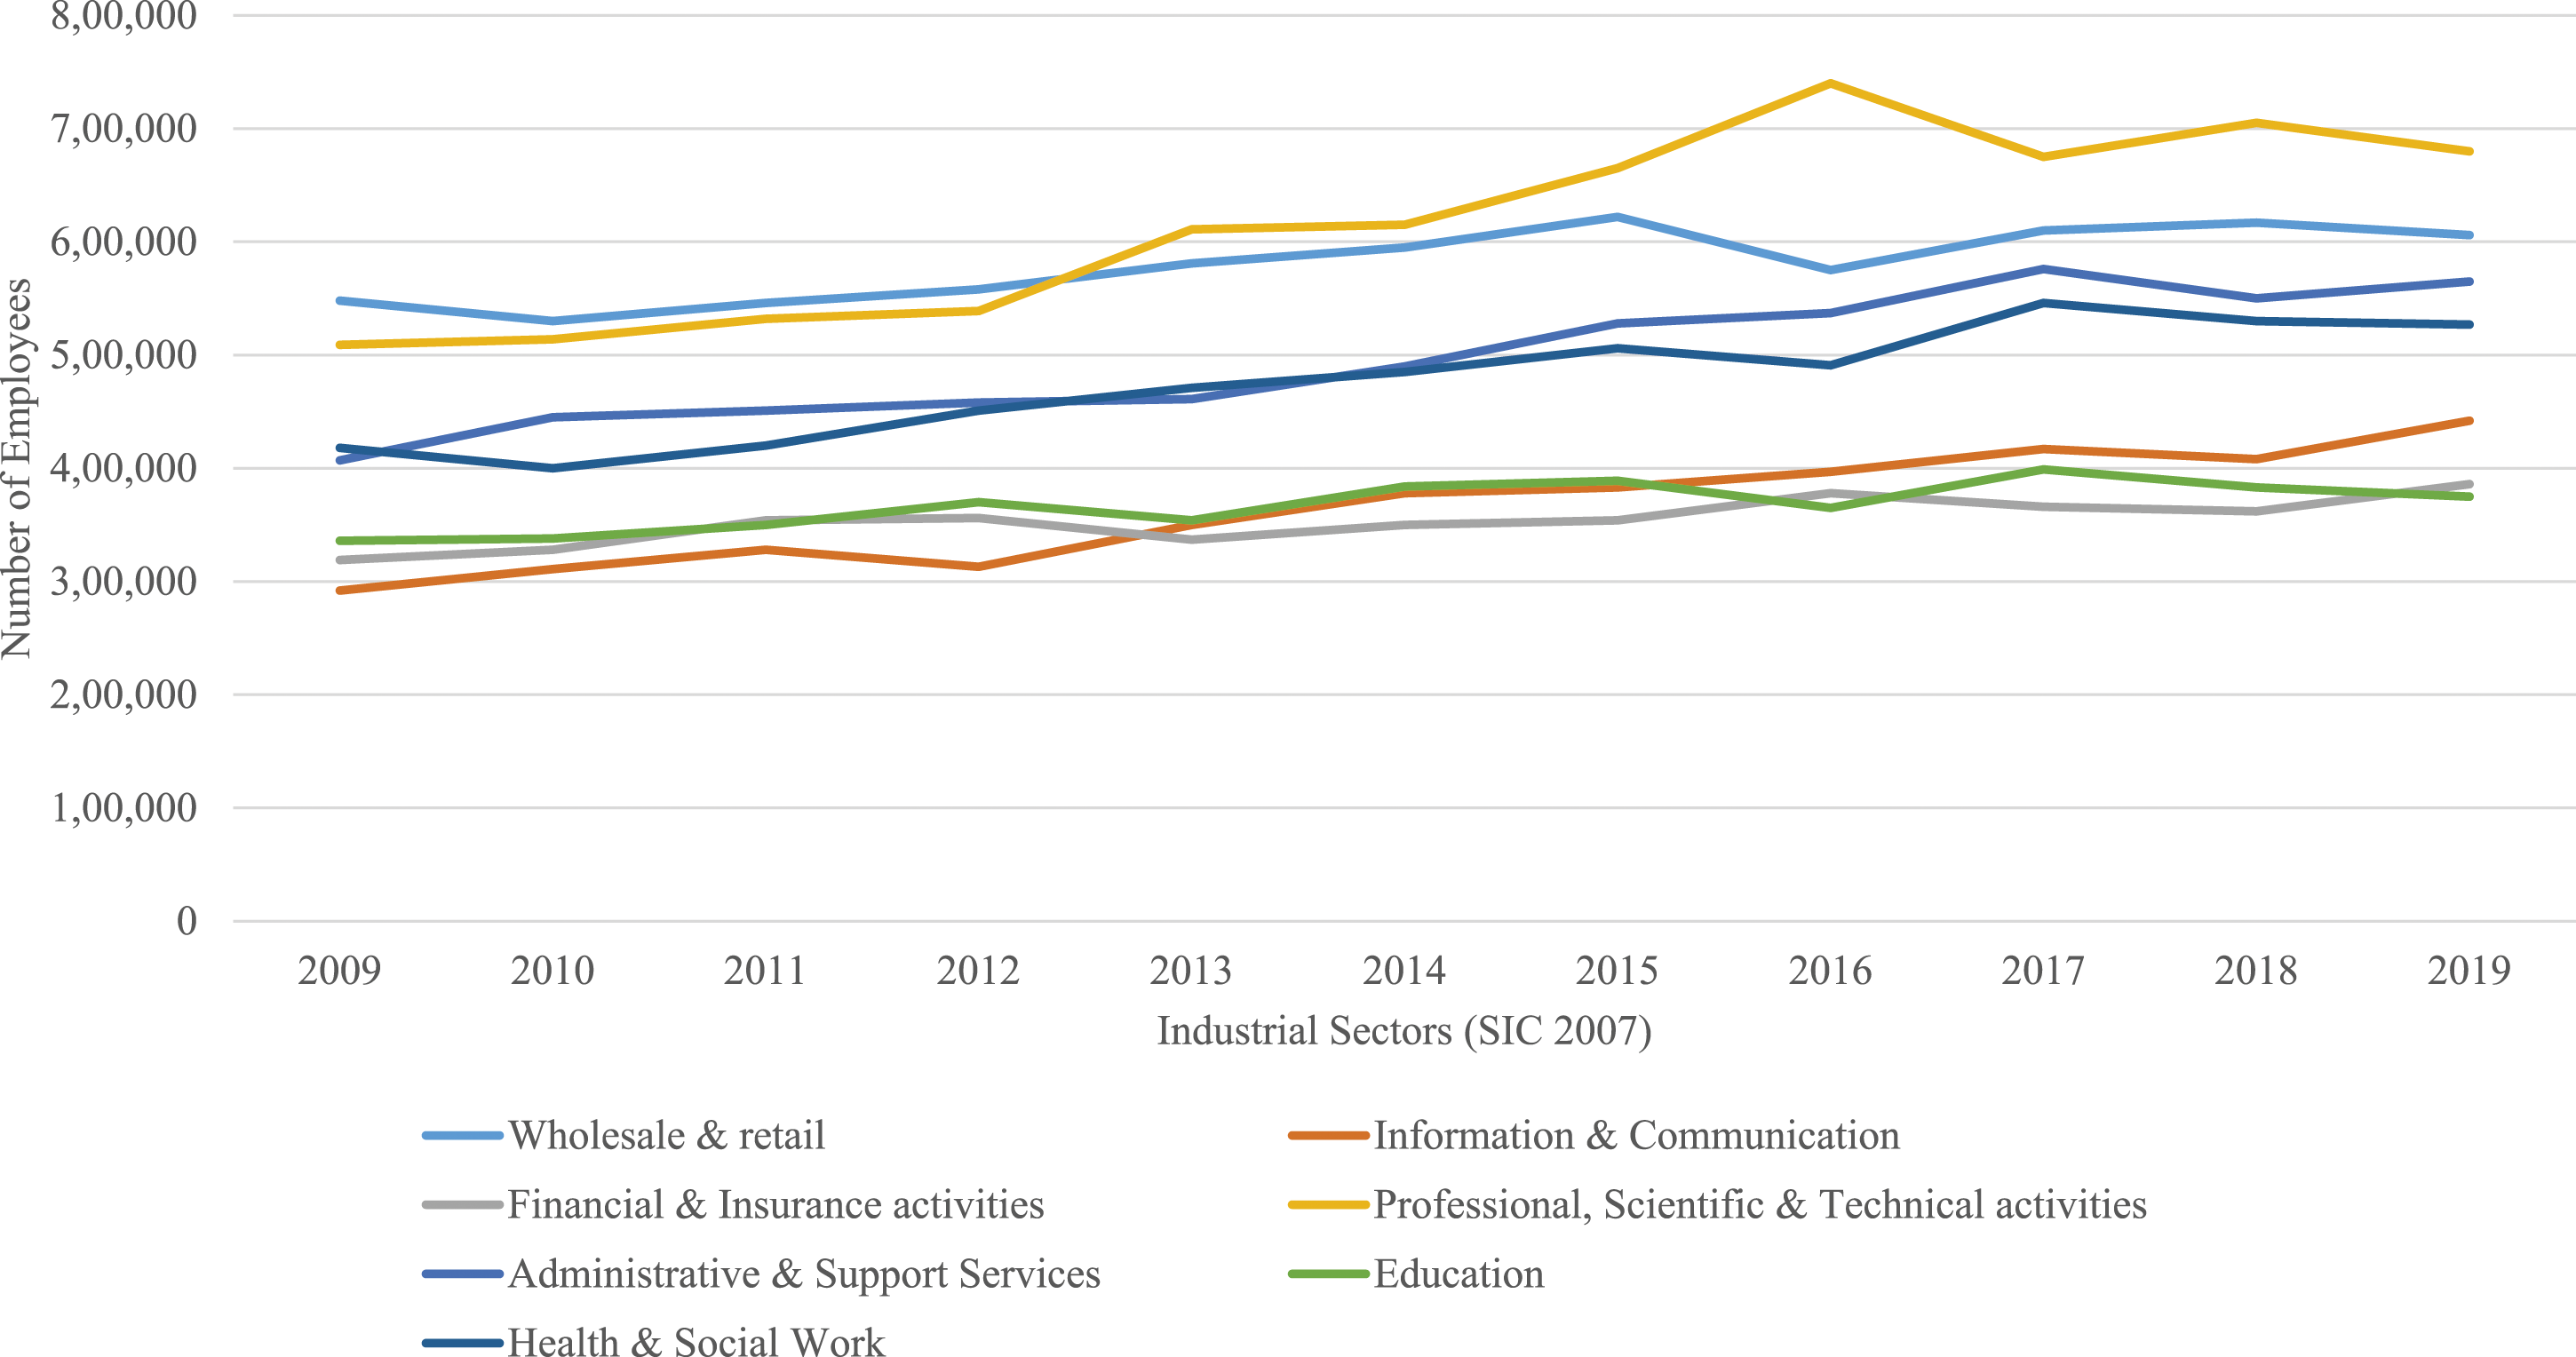
Considering speed of recovery as a measure of resilience (Davoudi and Porter, 2012), in terms of employment numbers alone, all English regions show remarkable resistance to a period of extended political and financial uncertainty, arguably demonstrating positive hysteresis (Overman and Puga, 2002; Setterfield, 1997; Angulo et al., 2018). It would appear that diversity in a region provides resilience as suggested by Boschma (2015). 5
However, such an approach does not lend itself to long-term success, particularly as, arguably, productivity lies at the heart of the biggest challenge facing English regions and serves to frame thinking around resilience in a very different light. Keeping in mind the concerns of Perrings (2006) and the import of pre-existing levels of productive capacity (Giannakis and Mamuneas, 2022; Tsiapa et al., 2018), a simple division of output by number of workers across sectors is revealing. In the East Midlands, an analysis of productivity in the region, shown in Figure 5, suggests that output per person is greater in the Manufacturing sector than the other heavily represented industries by employee number. However, this sector also has more fluctuation in productivity when compared to relatively modest changes in the other four leading industries in that region. Figure 6 for the South West shows a similar pattern; not only high productivity in manufacturing compared to other leading sectors but also greater volatility. Value of industrial sector output per employee in the East Midlands region, 2009–2019. Note: Source. Compiled from regional returns of the Business Register and Employment Survey 2022 using NOMIS, an official census and labour market statistics service supplied by the ONS. See: https://www.nomisweb.co.uk/. Value of industrial sector output per employee in the South West region, 2009–2019. Note: Source. Compiled from regional returns of the Business Register and Employment Survey 2022 using NOMIS, an official census and labour market statistics service supplied by the ONS. See: https://www.nomisweb.co.uk/.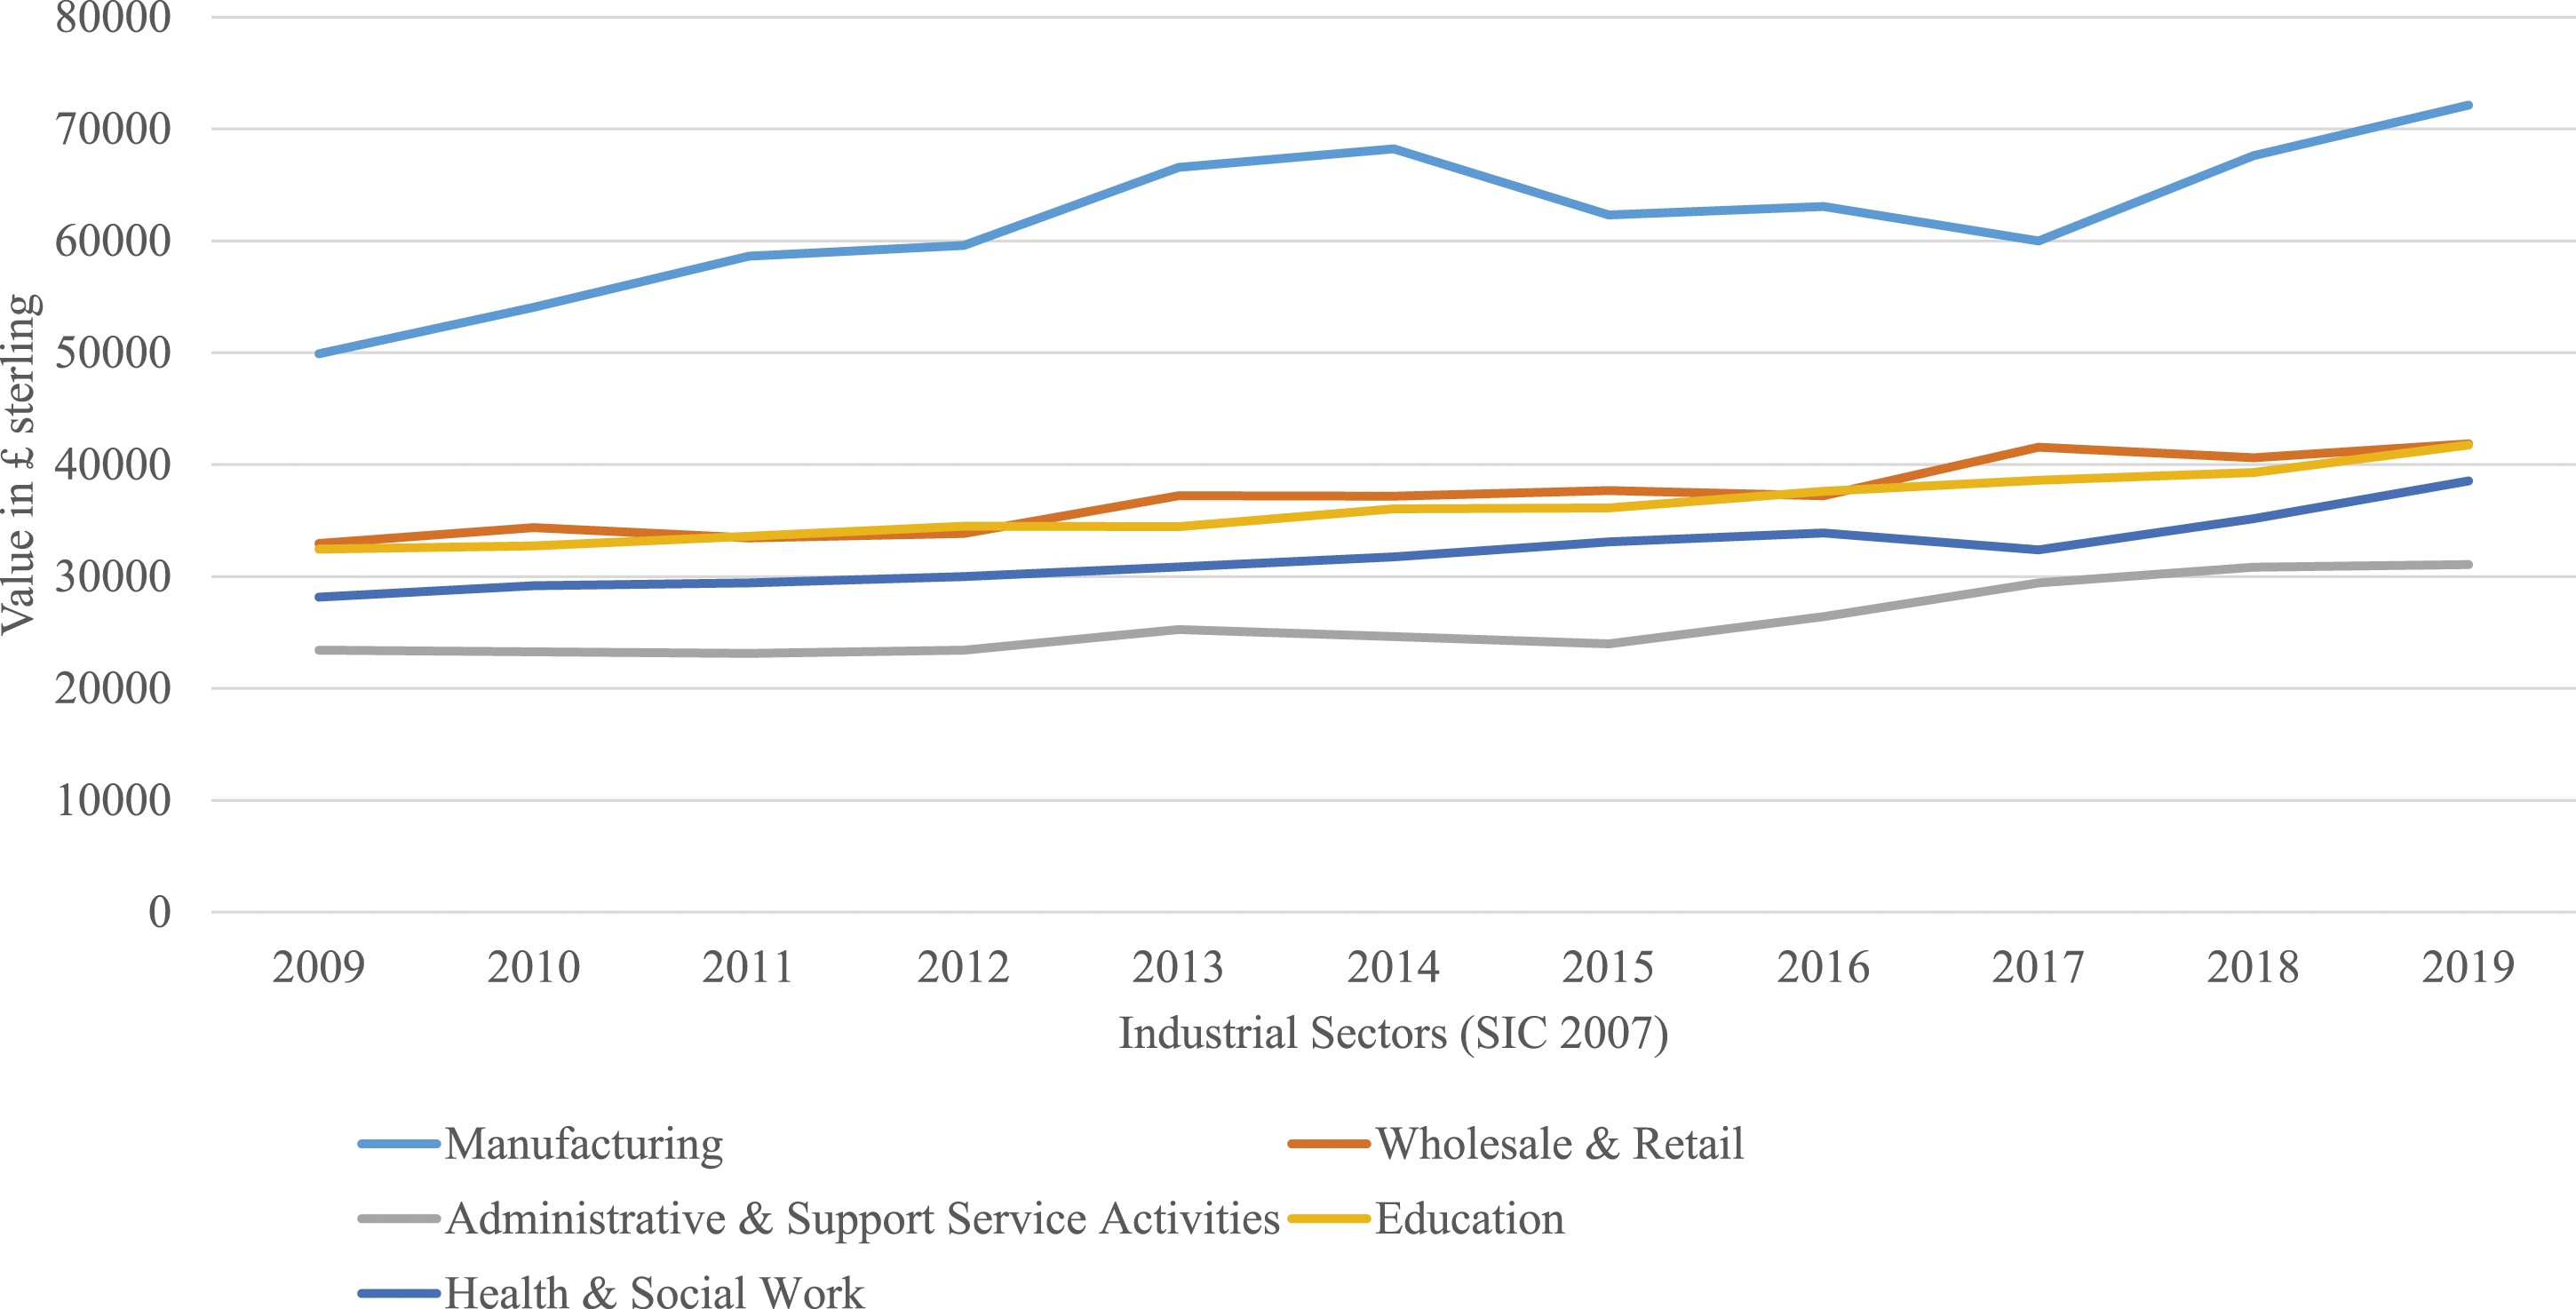
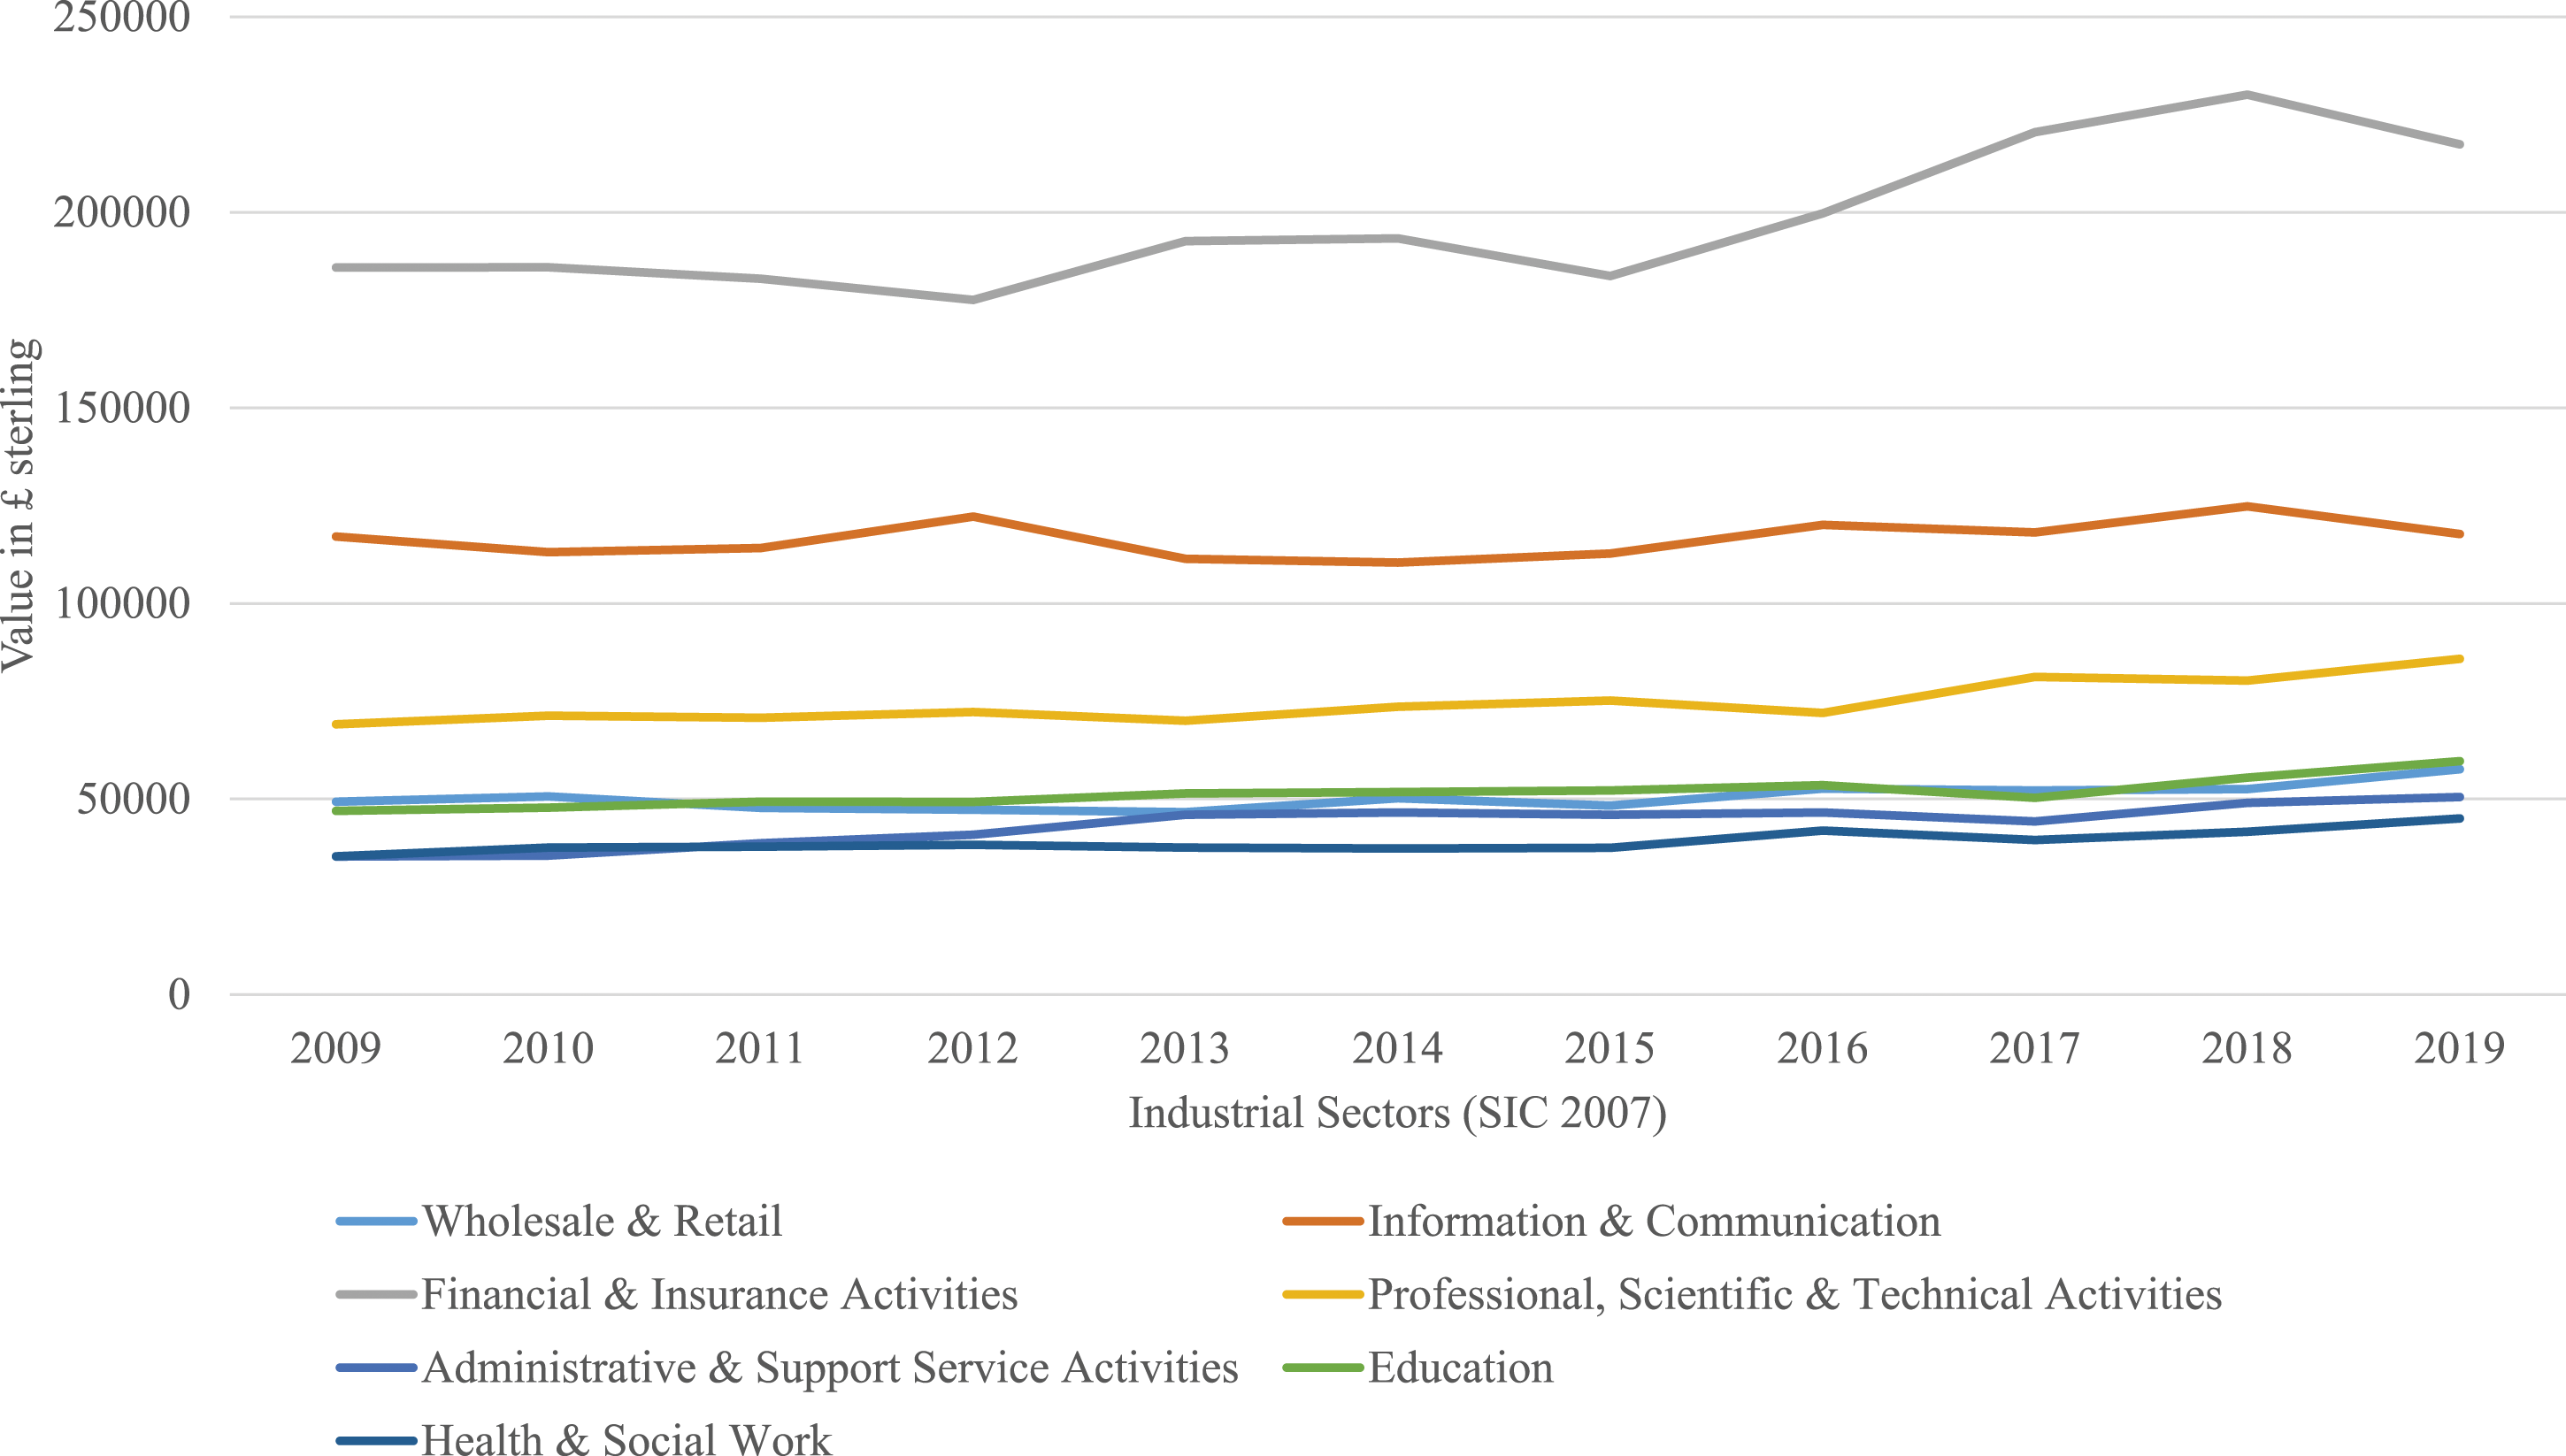
This trend of significantly higher productivity in manufacturing is replicated across all other English regions with the exception of London and the South East, where manufacturing had a far lesser presence. In the case of the South East, the lack of manufacturing just meant more low productivity sectors (see Figure 7). That is not to say that other English regions demonstrated less productivity than London, rather the presence of higher productivity sectors such as ‘Information and communication’, ‘Financial and insurance activities’, and ‘Real estate activities’ was in much greater evidence in London than other English regions (see Figure 8). Value of industrial sector output per employee in the South East region, 2009–2019. Note: Source. Compiled from regional returns of the Business Register and Employment Survey 2022 using NOMIS, an official census and labour market statistics service supplied by the ONS. See: https://www.nomisweb.co.uk/. Value of industrial sector output per employee in the London region, 2009–2019. Note: Source. Compiled from regional returns of the Business Register and Employment Survey 2022 using NOMIS, an official census and labour market statistics service supplied by the ONS. See: https://www.nomisweb.co.uk/.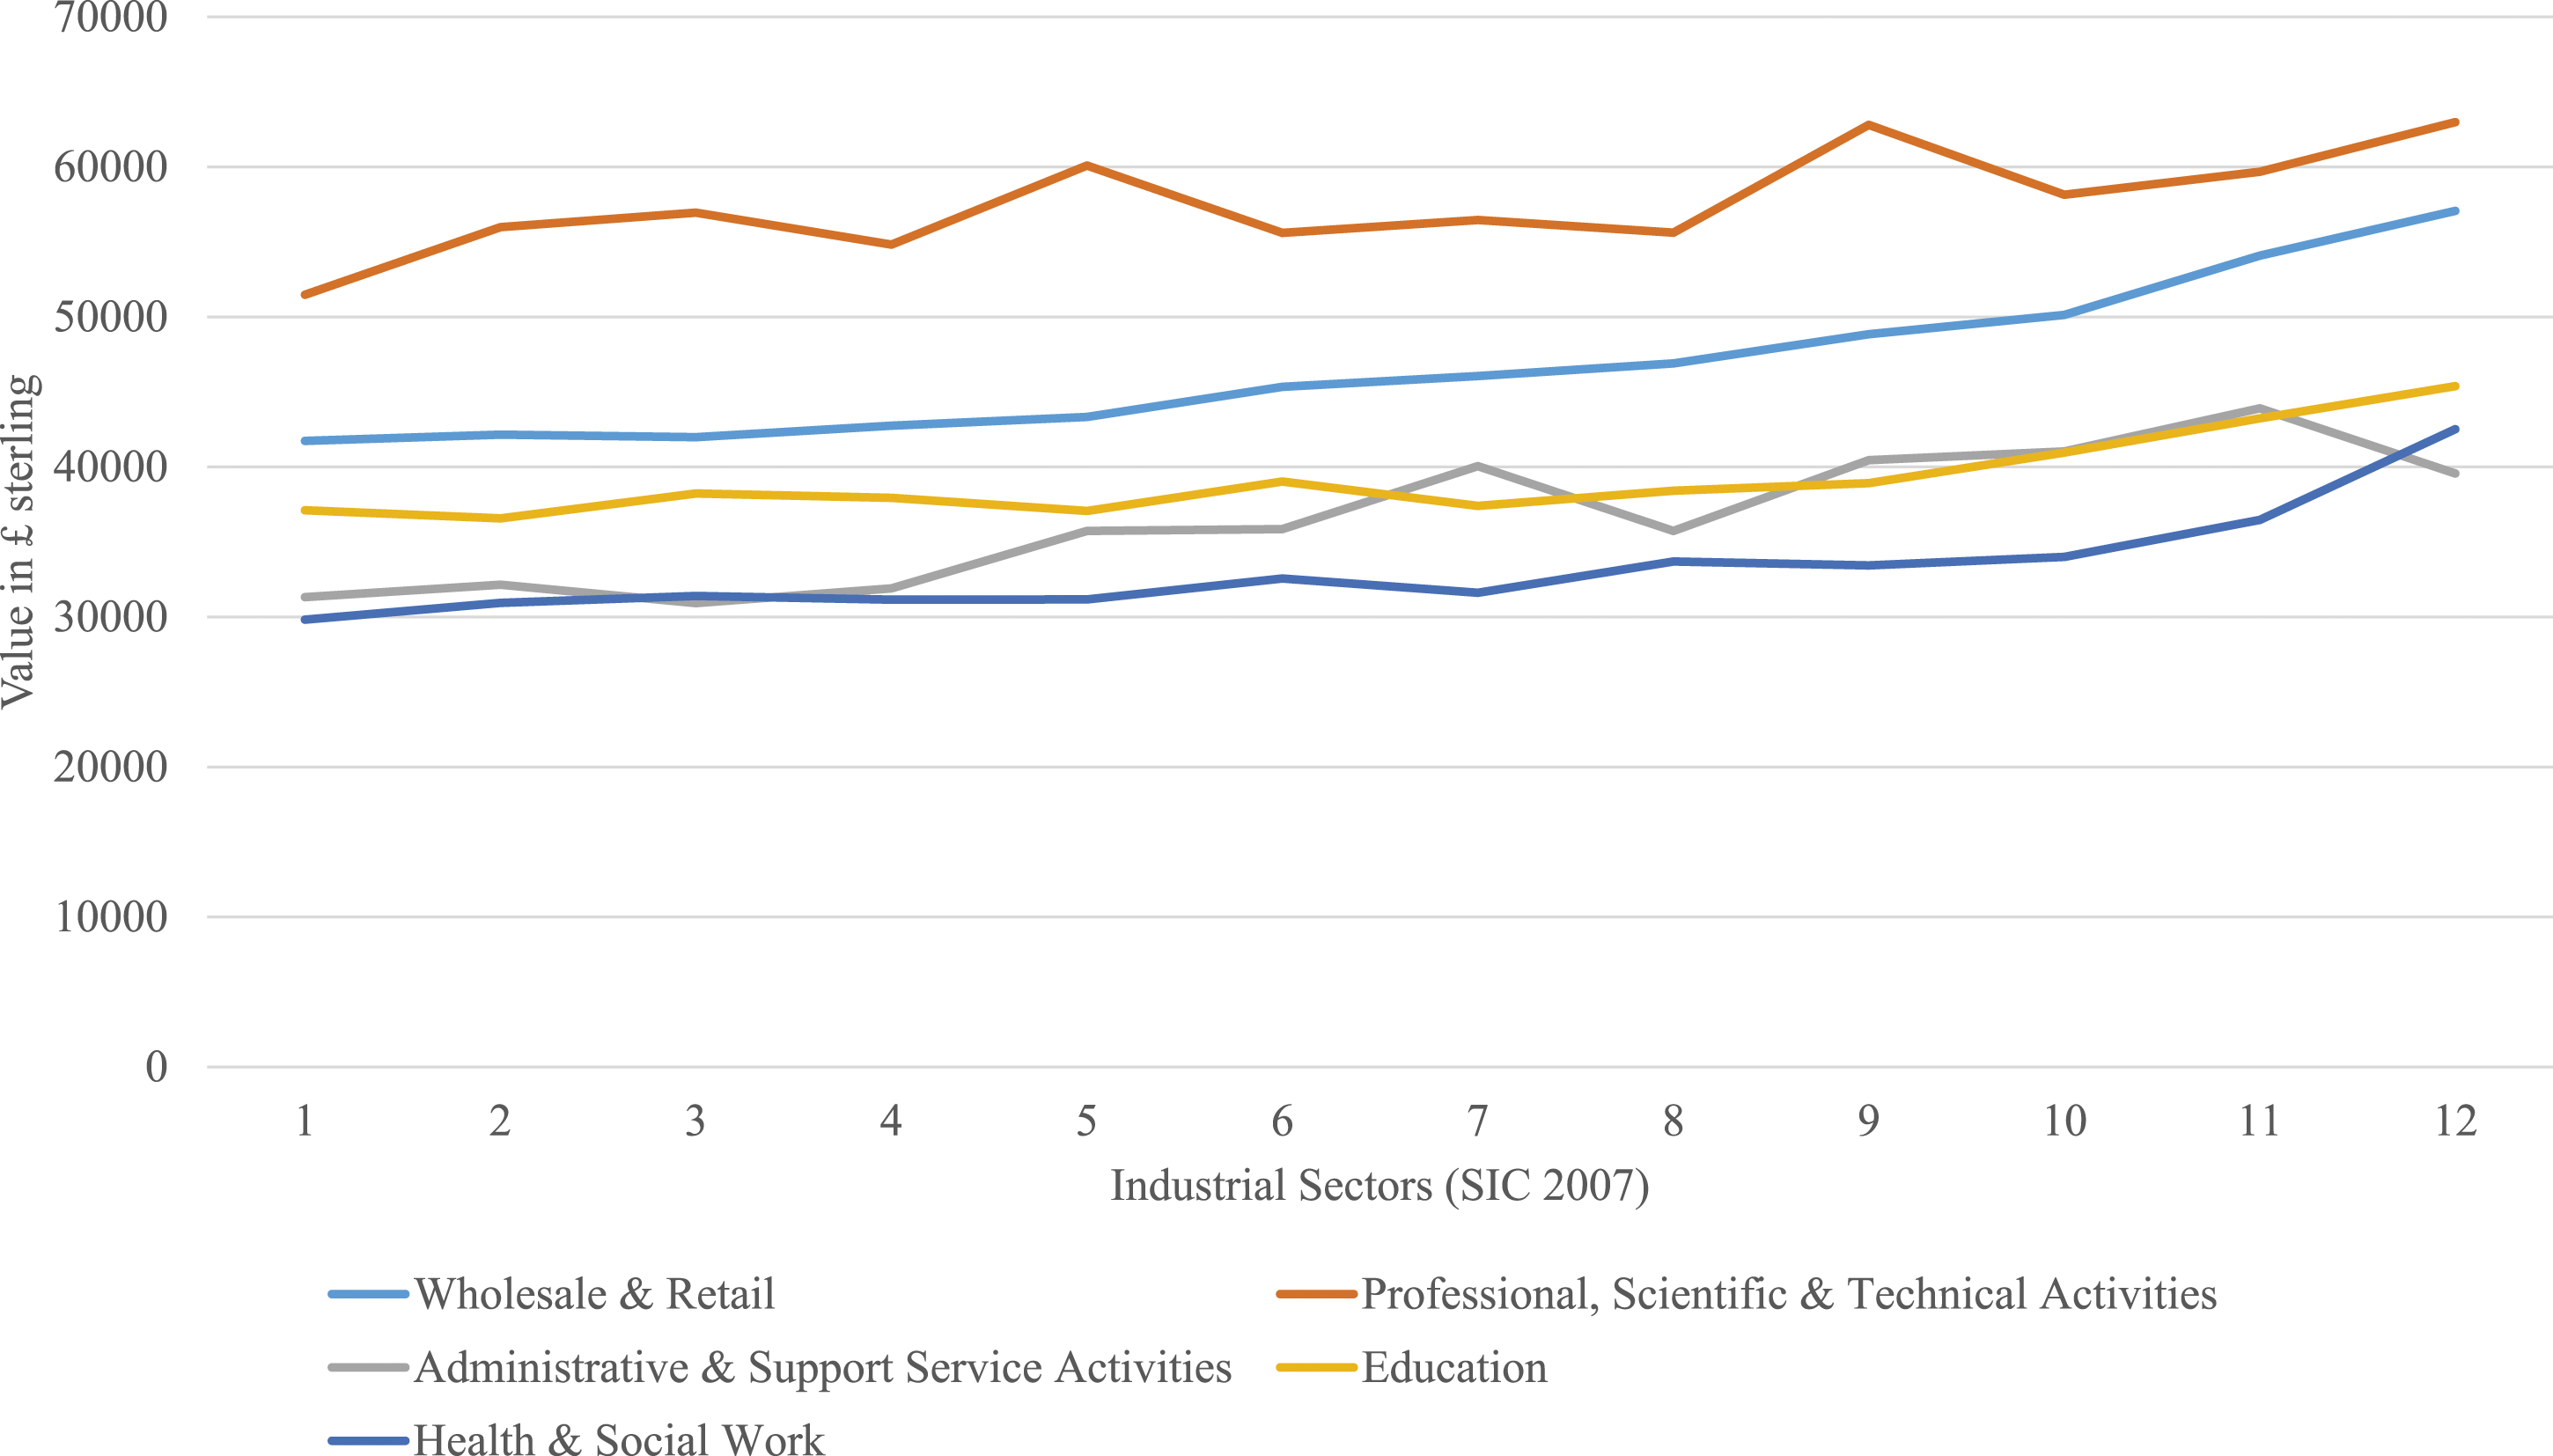
Unpredictable performance in the manufacturing sector in various English regions can be attributed, in part, to the prevailing mood of pessimism amongst manufacturers dating back to the Brexit decision in 2016. Here, the North East provides a good example of what occurred to varying degrees across many English regions. In the North East, the region’s heavy reliance on the automotive business, with over a quarter of output supplying the industry, meant the region was particularly susceptible to issues related to supply chains. Further, in 2015, 69% of manufacturing exports from the North East went to EU or other European countries, the highest of any of the English regions. The events of 2016 created significant challenges in both these areas (MAKE, 2019), helping to explain the downturn in manufacturing in the North East and the corresponding drop in investment confidence (MAKE, 2020). Similar stories are evident in the East and West midlands (MAKE, 2018a, 2018b). Despite the relatively higher productivity levels enjoyed, the sector remains beleaguered by problems of supply and demand. 6
The persistent challenge of low productivity in other leading sectors also gives pause for thought. It may seem surprising that sectors like health and education return such poor numbers despite confident assertions by regional authorities about the sophisticated profile of so many of the firms active in these industrial sectors (Invest Northeast England, 2023). However, such positive messages can be misleading, as much of the sector is not made up of high-skilled research units or advanced manufacturing. Workforce intelligence, a group commissioned by the Department of Health and Social Care, reported strong demand for thousands of social care workers for much of the decade, which constituted much of the employment in the health sector in the North East (Workforce Intelligence, 2022). Similarly, the Yorkshire and Humber region lies eight amongst UK regions in terms of productivity, despite the strong presence of health, education, and administration service, a fact that has vexed a number of different local enterprise partnerships, councils, and combined authorities active in the region in recent years (West Yorkshire Combined, 2021; YNYLEP, 2020). The issue of low productivity and dragging GVA is a long-standing one that is evident before the millennium (ONS, 2023a, 2023c). Notably, in the Yorkshire and Humber region, an above average number of employees were engaged in typically lower-skilled and lower-paid occupations from SOC categories 4–9 (ONS, 2023b, 2023c).
The question emerges as to how much resistance to economic stress – demonstrated by employment stability – masks the underlying problems of lack of economic transition to higher value, higher productivity economic activities, a key measure of economic well-being. Stable employment notwithstanding, the shift into lower productivity sectors during years of difficult economic conditions (in spite of increases in productivity in some sectors in some regions, as shown in Figures 5–8) means that while diversity may keep employment high, it can come at the cost of higher value activities (Martin and Sunley, 2015; Martin, 2012).
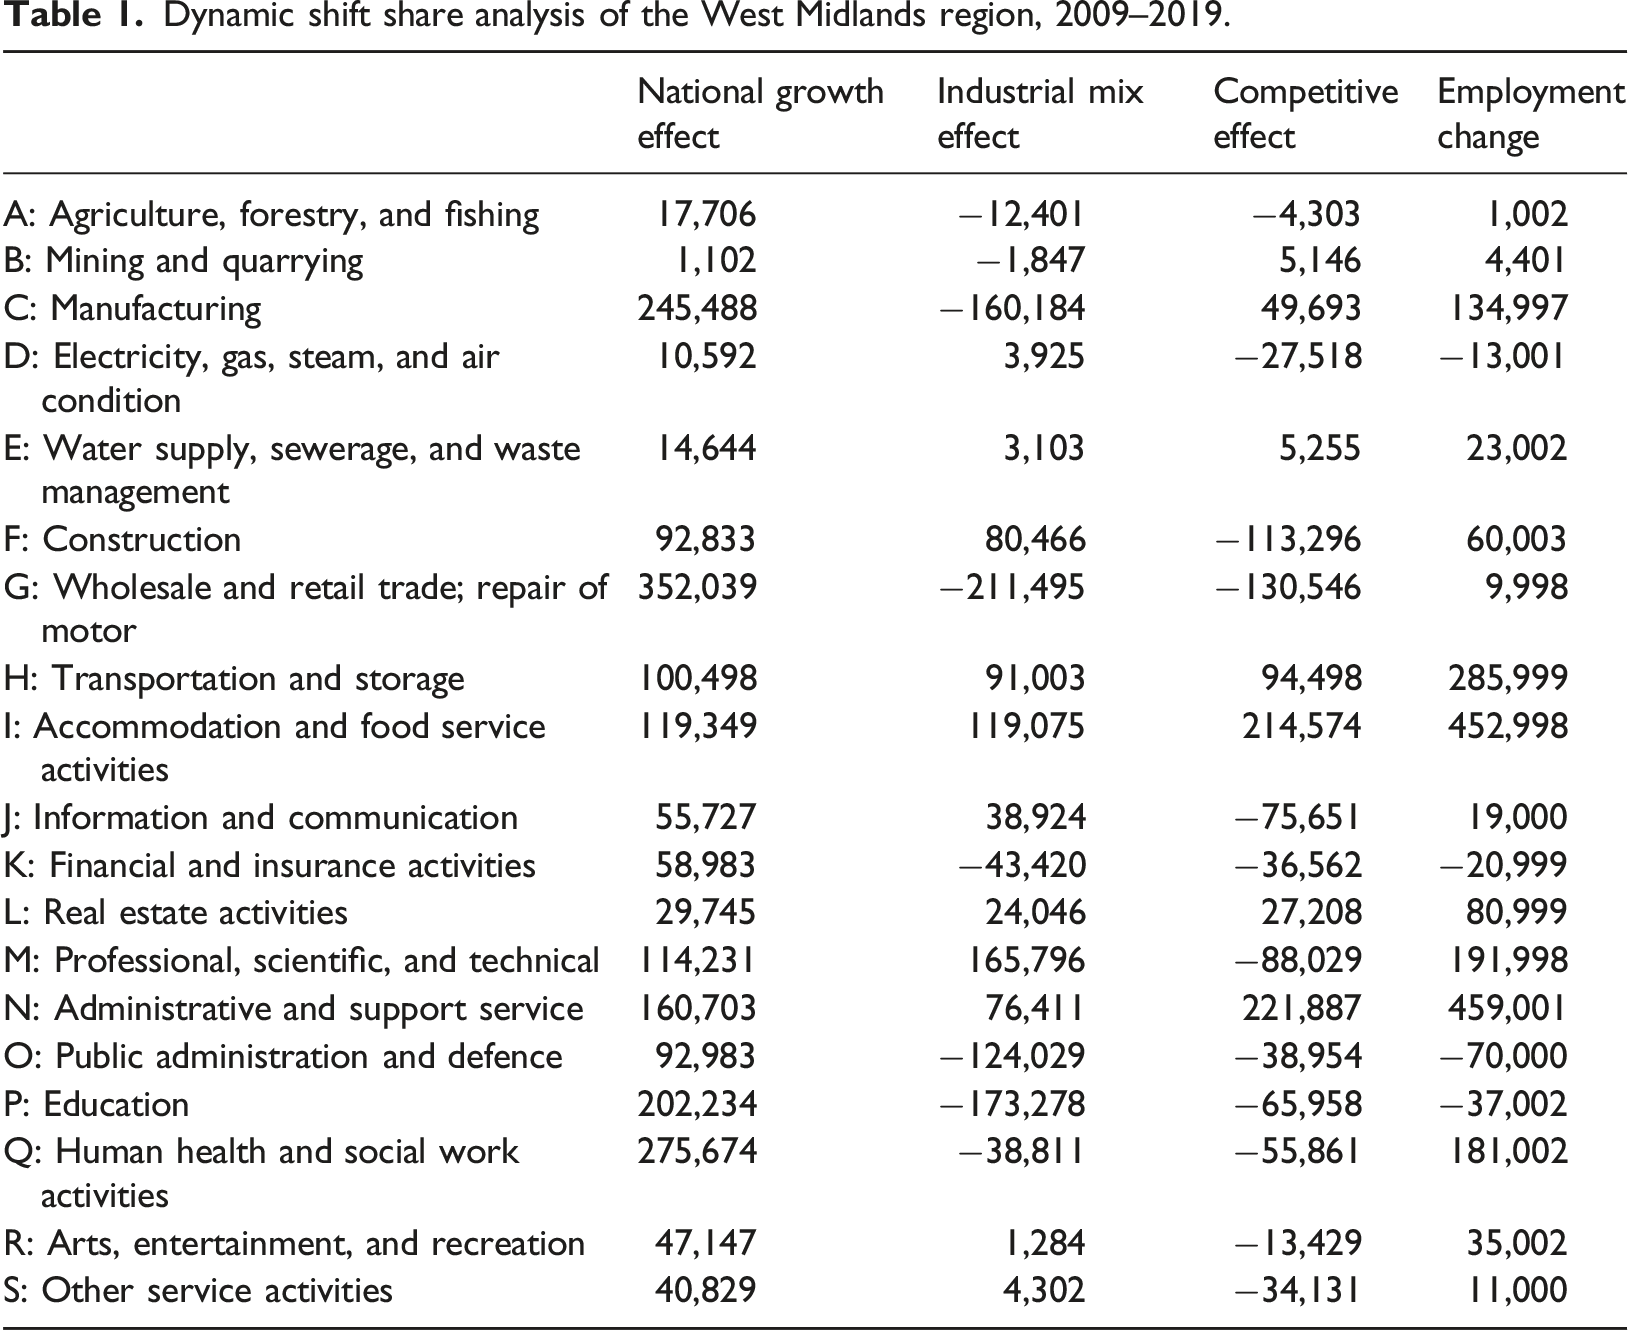
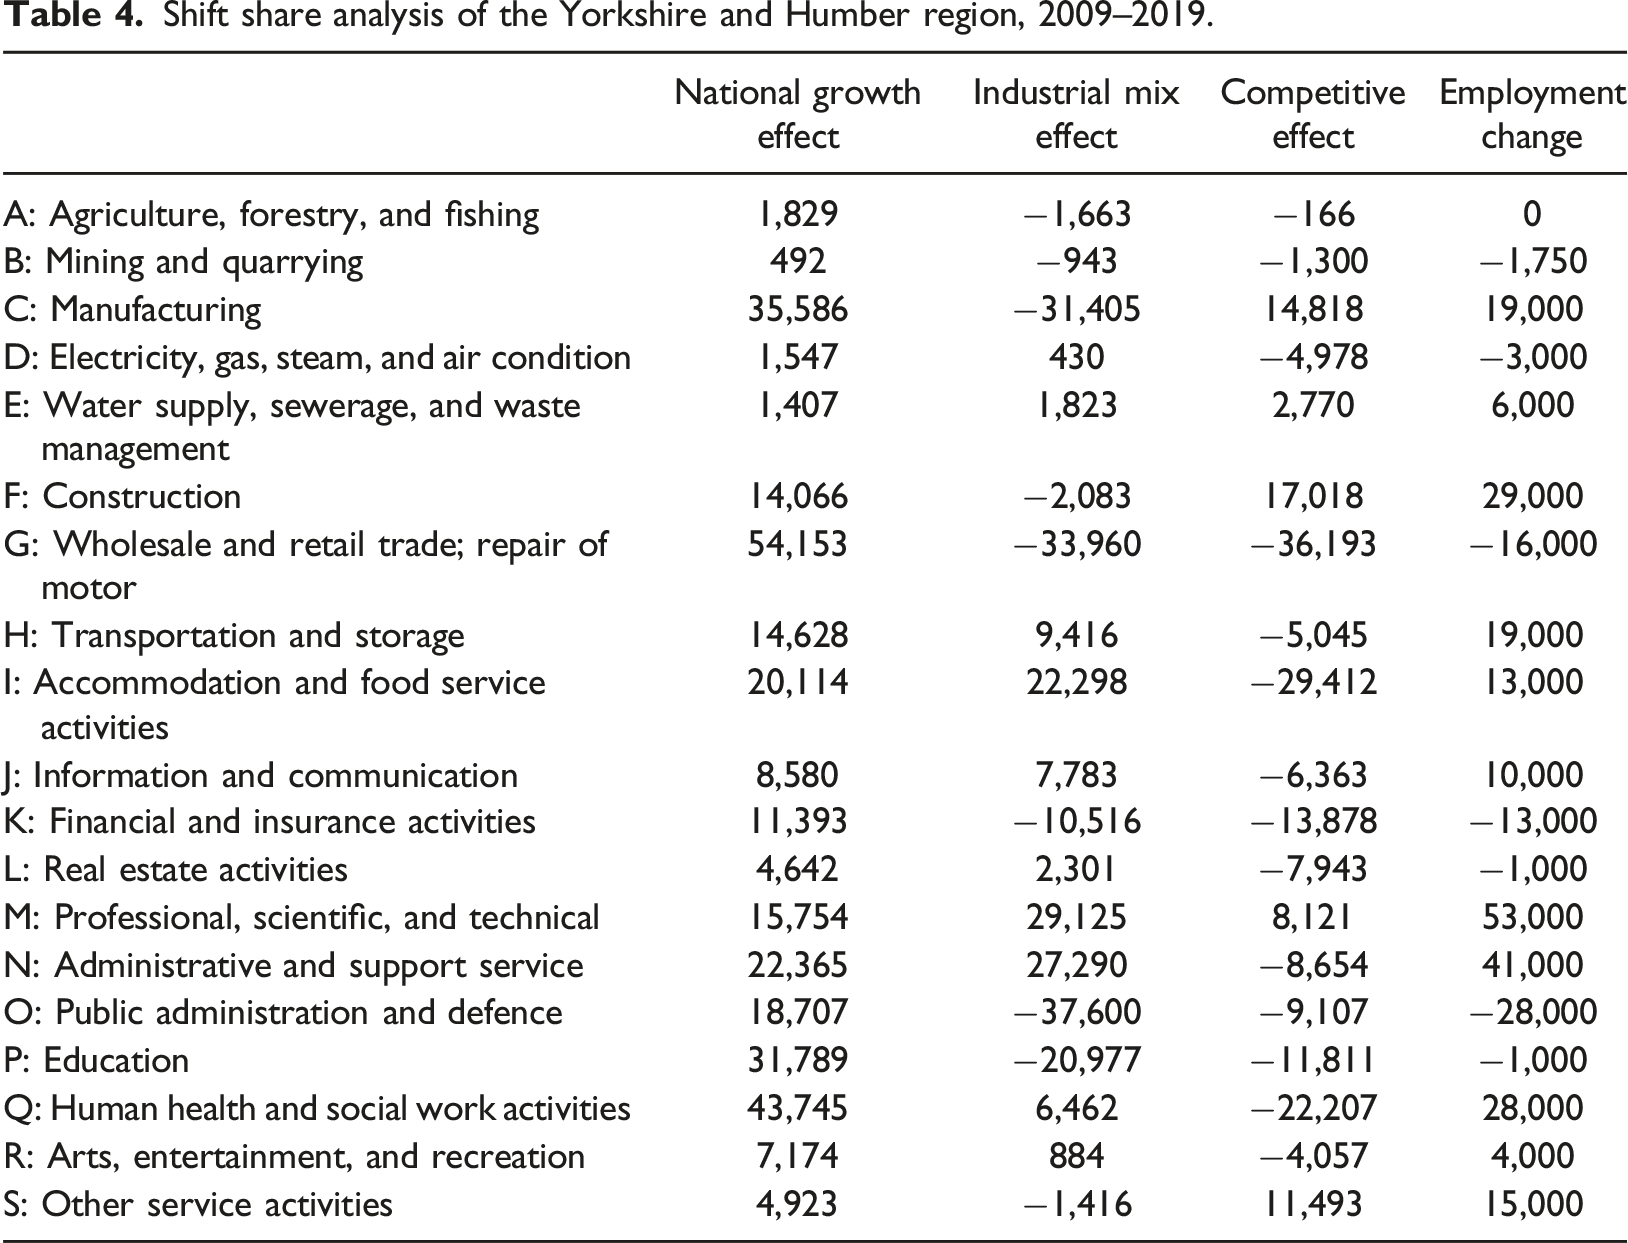
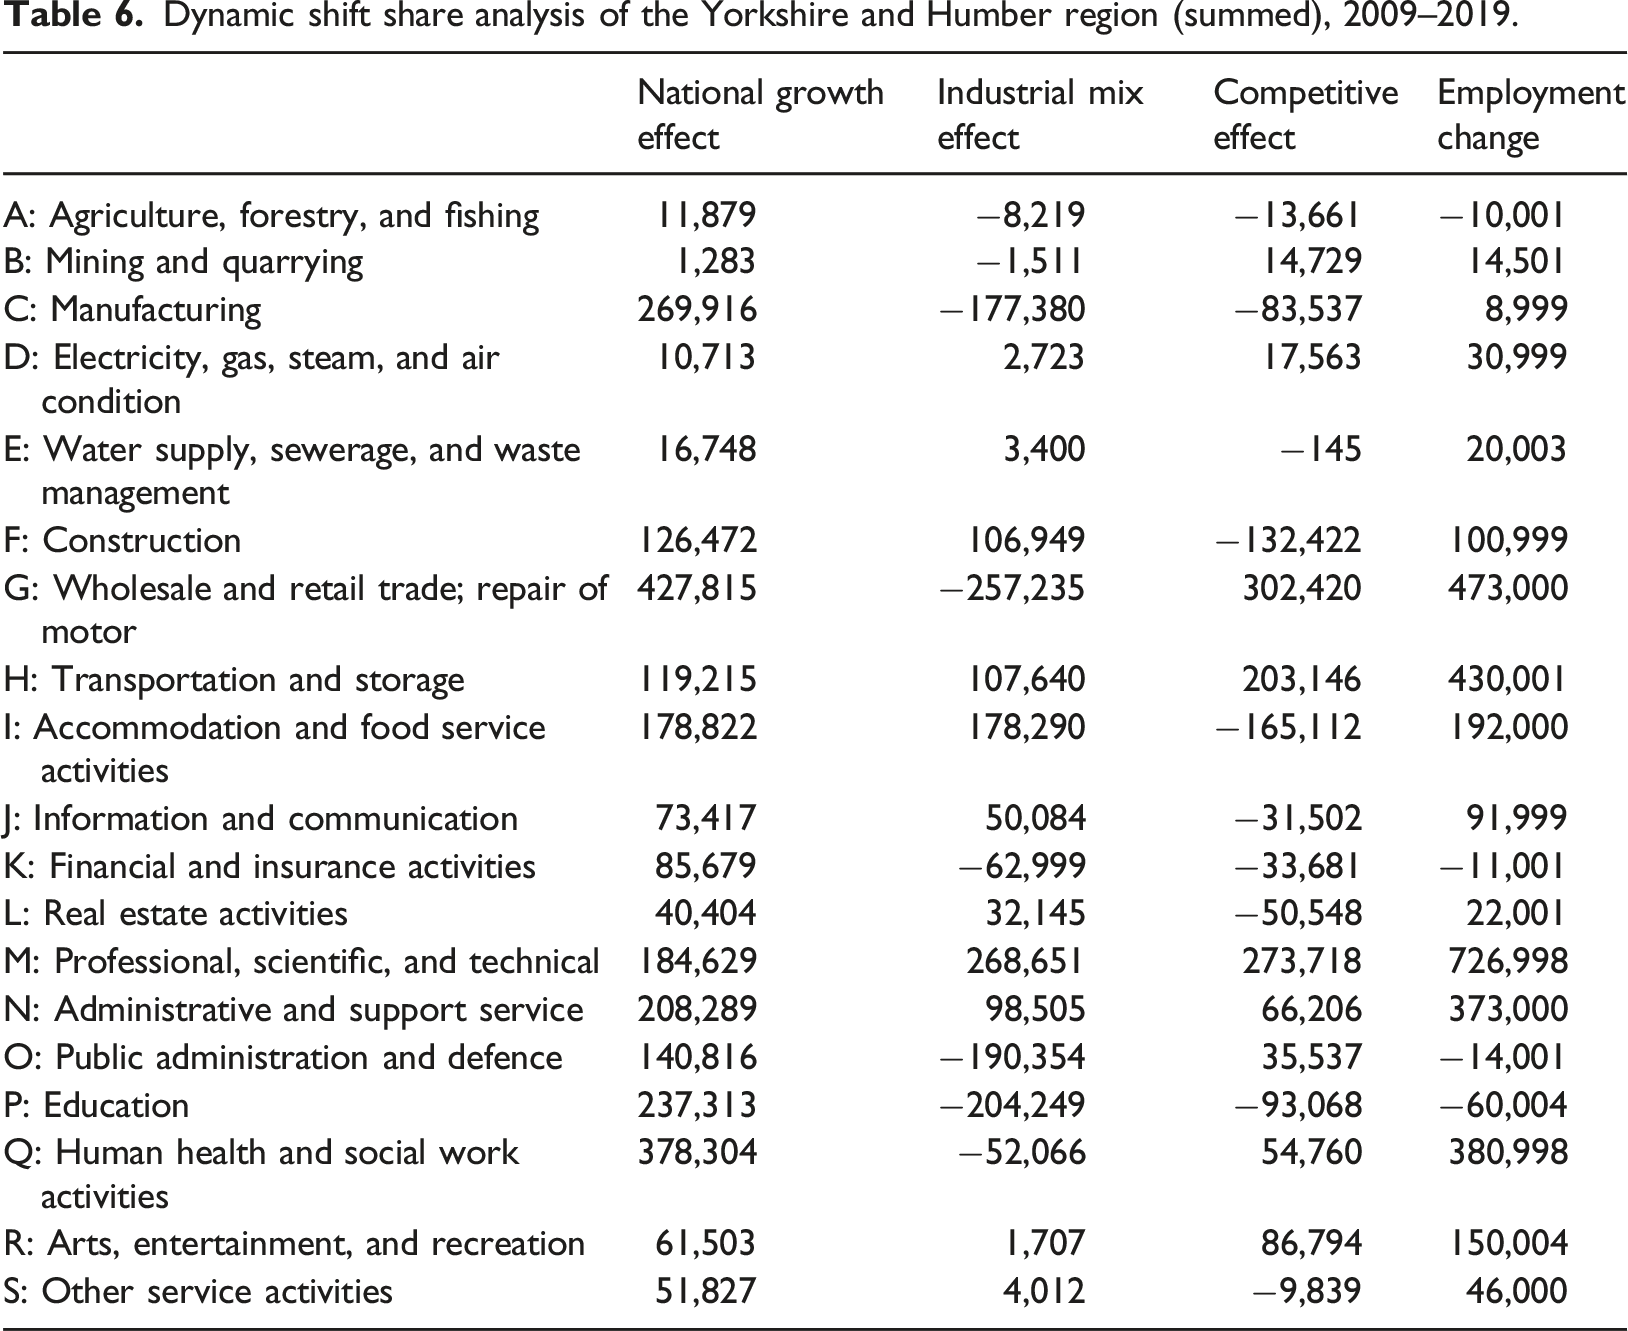
In tandem with concerns over productivity is the lack of regional competitiveness for key sectors in many regions outside of London. Looking at the sectors with the highest employment rates across English regions, in the North East, only retail and accommodation show a regional shift from 2009 to 2019. When this is summed across years, no growth can be attributed to regional competitiveness. The North West shows more success, with retail recording a change of 35,247 jobs due to regional growth from 2009 to 2019, while administration and support services also increased, by 16,106 jobs at the same time. When summed across the decade the picture is more positive, with health and professional, scientific, and technical services also accounting for regional growth. In Yorkshire and Humber only, manufacturing showed regional growth from 2009 to 2019, including over time.
Dynamic shift share analysis of the West Midlands region, 2009–2019.
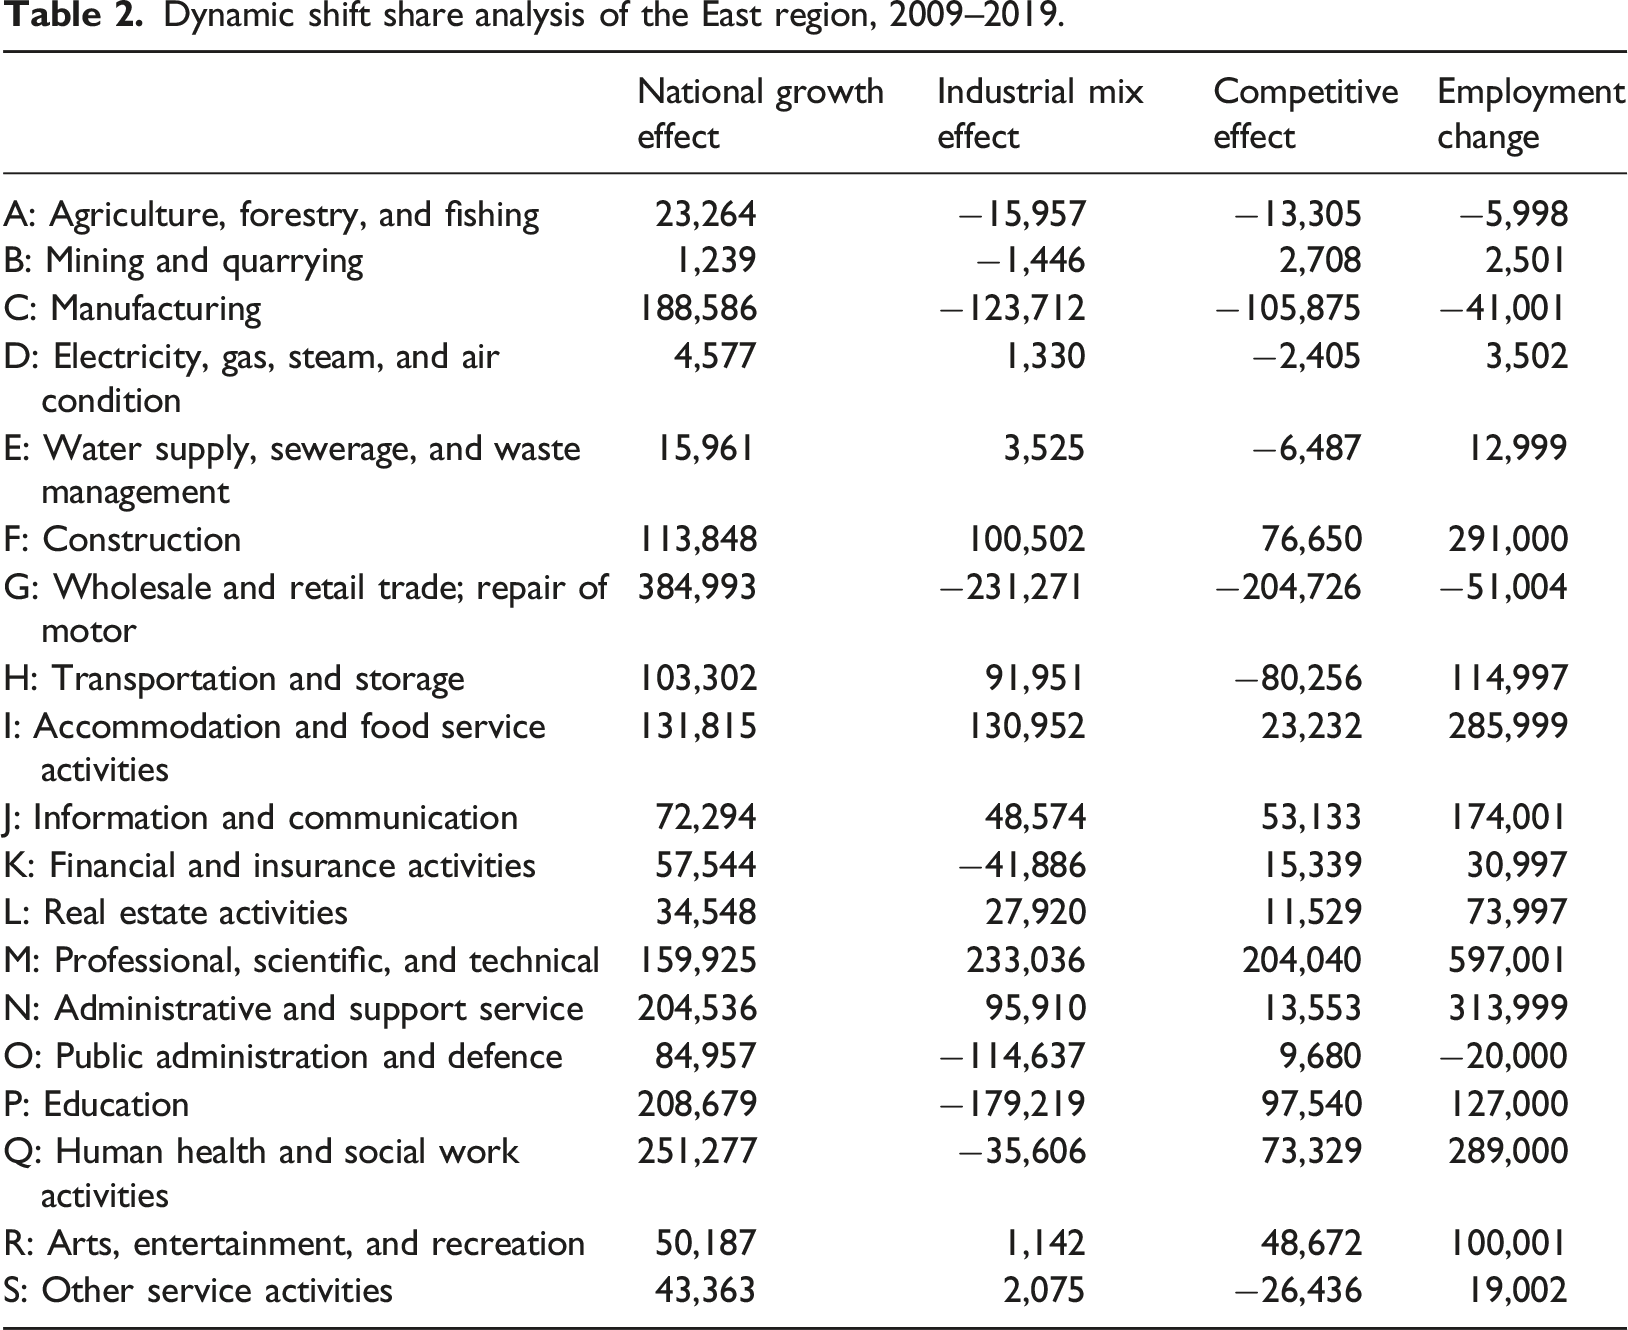
Dynamic shift share analysis of the East region, 2009–2019.
Dynamic shift share analysis of the London region, 2009–2019.
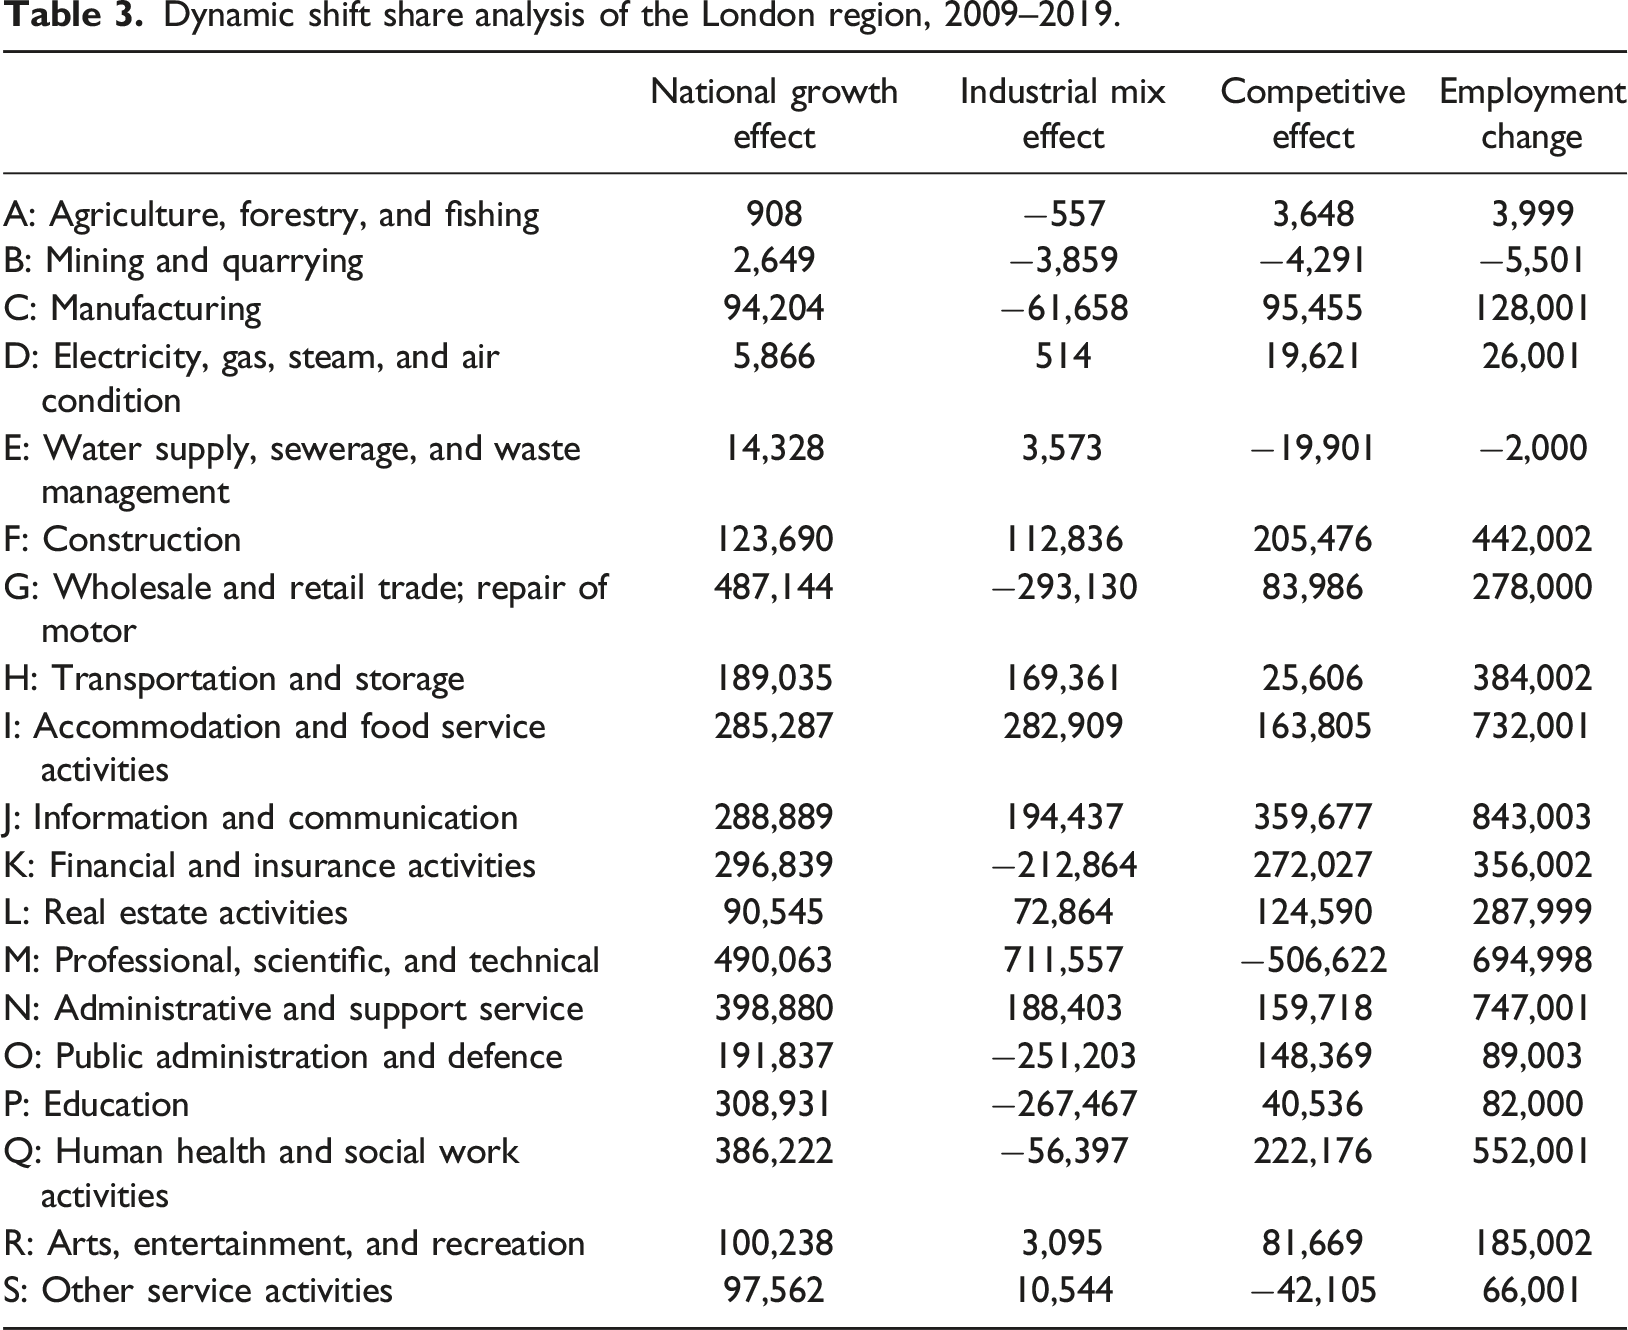
London overall showed considerable growth and investor confidence with any downturns associated with economic strife quickly overcome. This is also matched by regional GDP, with London showing exceptional levels of output and higher levels of growth compared to all other English regions during the years 2009-21. Notwithstanding the events of the pandemic being factored in, London produced double the output of all other English regions for these years. Even the South East only produced two-thirds of the output of London, as shown in Figure 9. Gross domestic product (GDP) at current market prices, pounds million, 2009–2019. Note: Source. Compiled from regional returns of the Business Register and Employment Survey 2022 using NOMIS, an official census and labour market statistics service supplied by the ONS. See: https://www.nomisweb.co.uk/.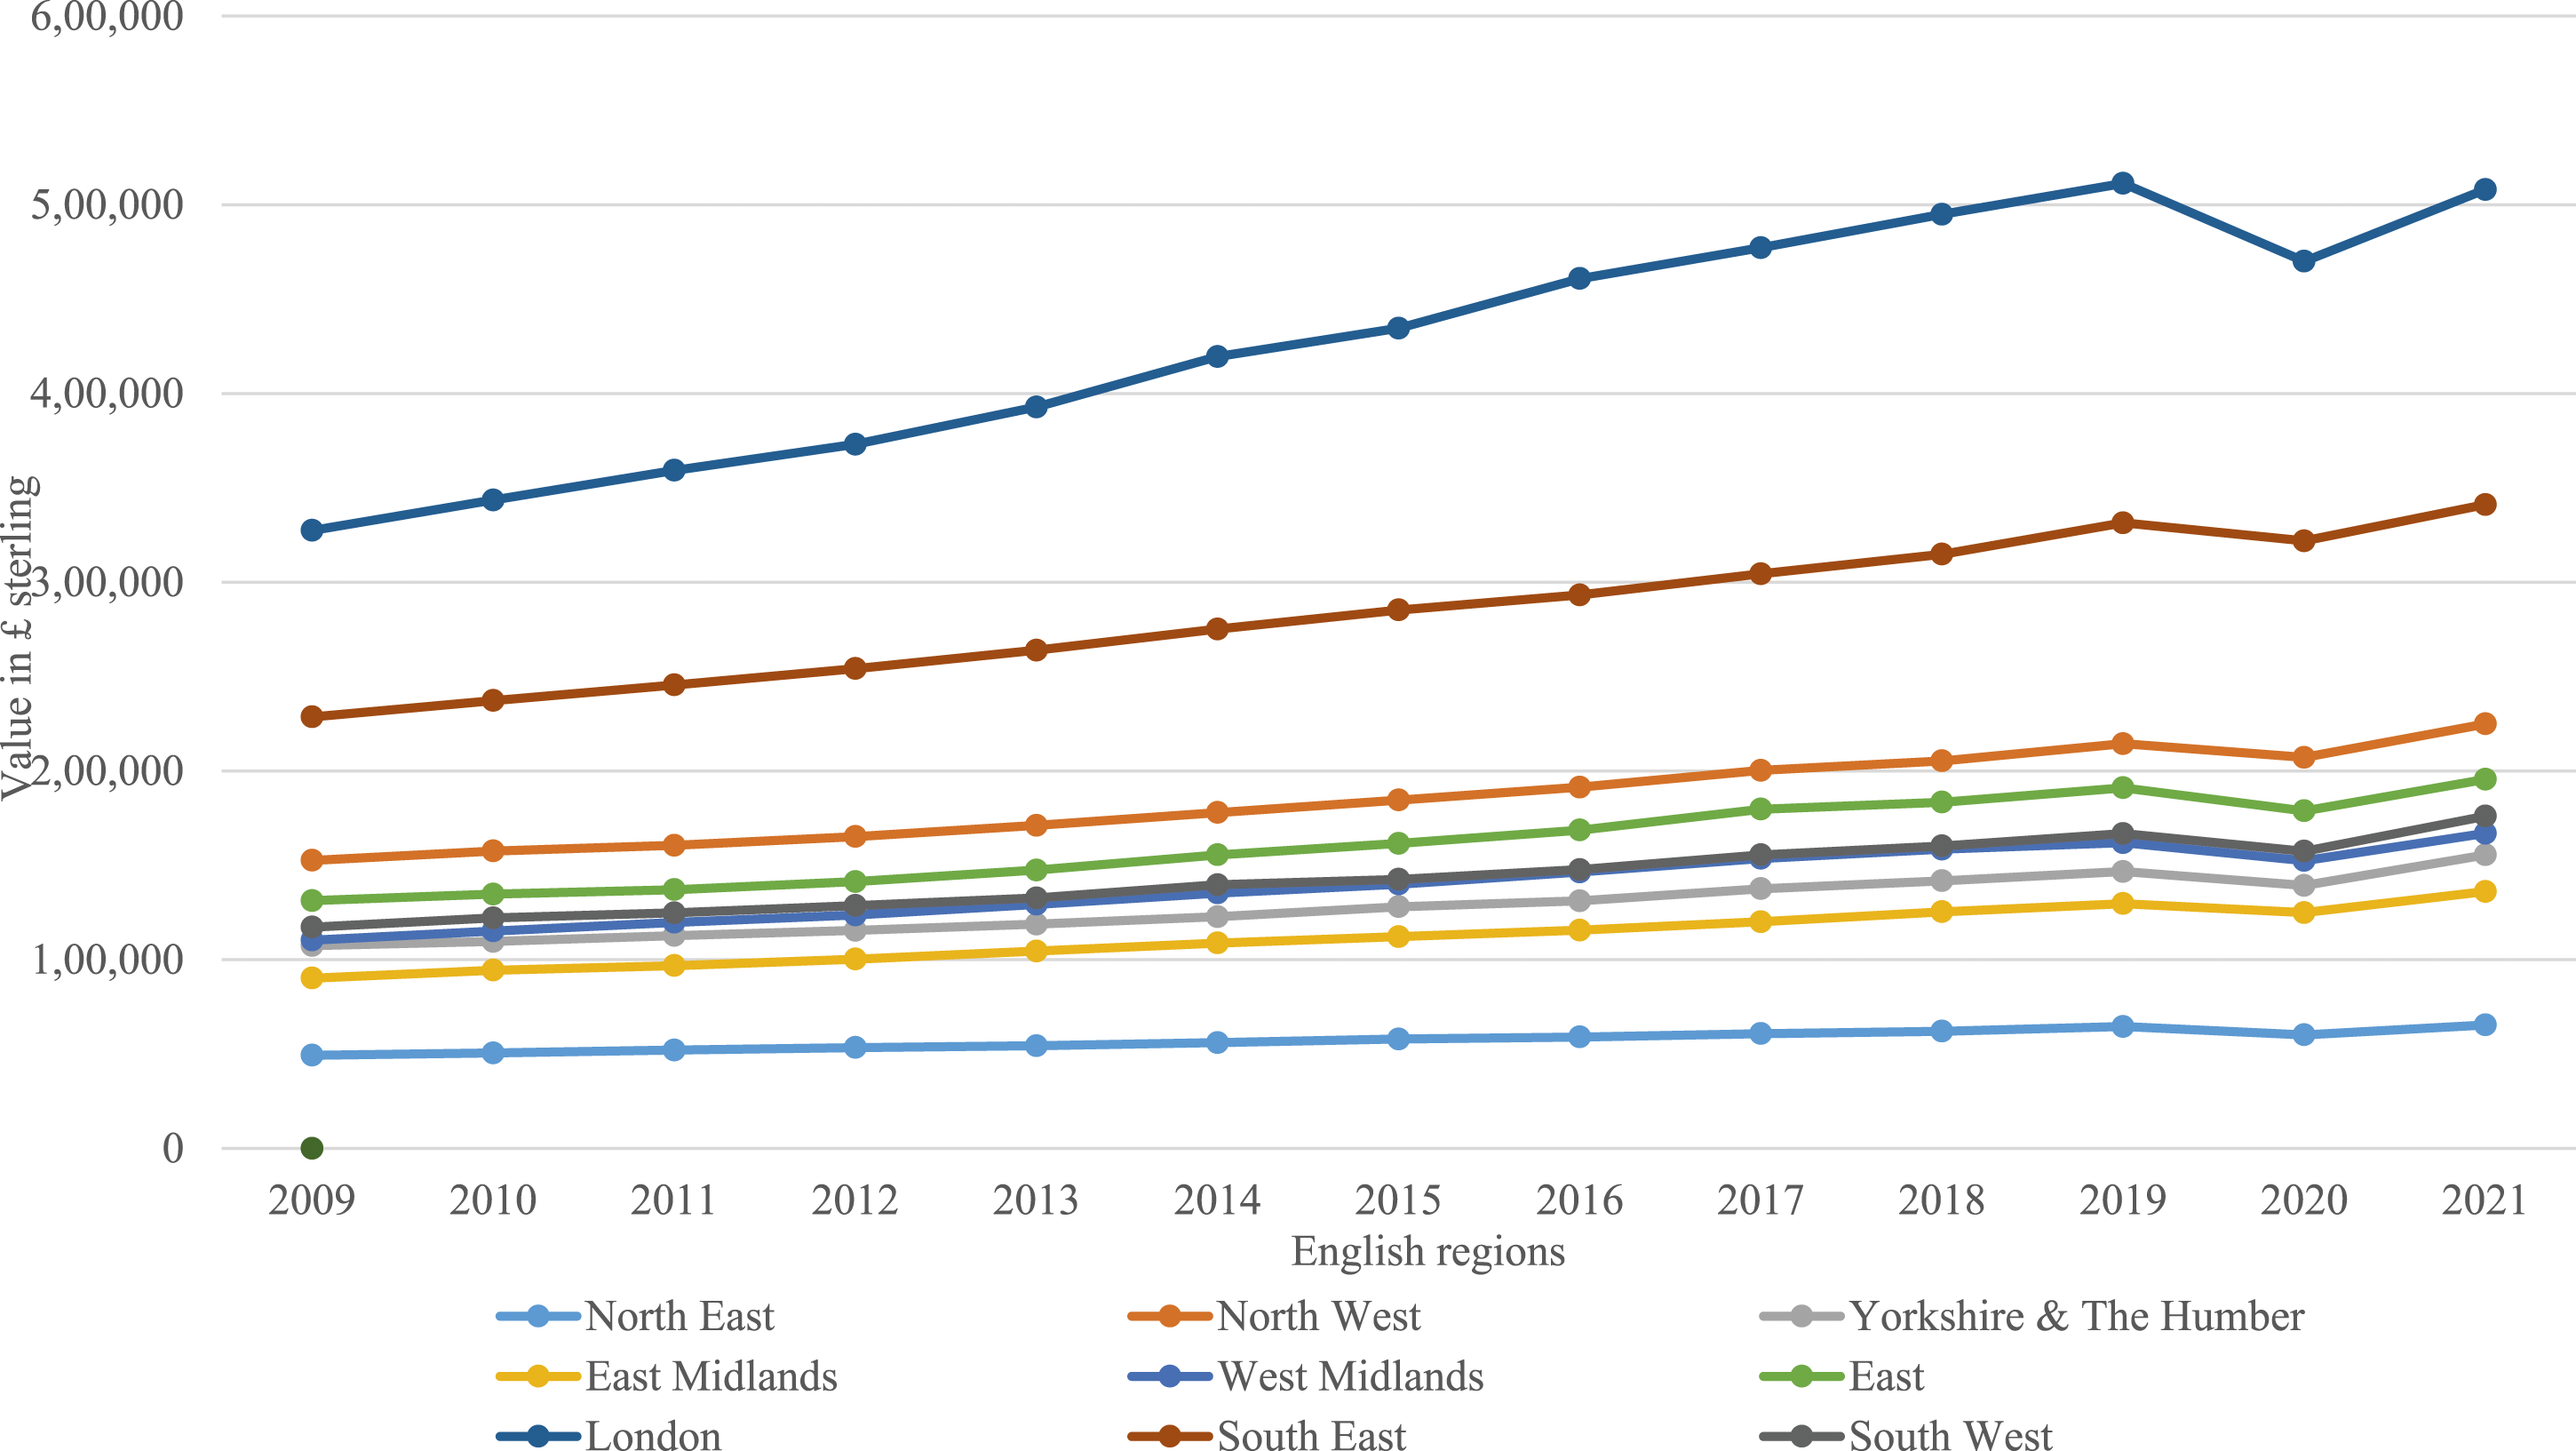
In part this may stem from major government-funded projects located primarily in London. Examples of high-cost infrastructural investment in London during this period include Crossrail (£14.5bn), HS2 (£50bn), Thameslink (£6.5bn), Airport Infrastructure Improvements: Heathrow, Gatwick (£4.2bn), Transport for London Major Schemes (£4.8bn), Northern Line Extension (£1bn), Thames Tideway Tunnel (£4.2bn), and the Redevelopment of Battersea Power Station (£5 billion) into office and living space (APS, 2016; HMSO, 2021). Furthermore, decisions like the banking bailout of 2007-9 also served to support the finance and insurance sector during a highly challenging period of financial upheaval (HCL, 2018). Space precludes a more detailed discussion of these output data, but UK regional GDP and the role of government spending in driving its growth is a topic worthy of further commentary by other researchers.
What emerges is a picture of national economic policy that has directly benefited key sectors in the UK economy. Government spending, in construction projects, bailouts, and quantitative easing, has manifested in stable employment and resistance to deep dips in labour engagement. Regions with high concentrations of industrial sectors that have directly benefitted from government intervention, such as construction and the finance sector, have flourished. In contrast, sectors with a more outward facing profile that have received less direct policy support, like manufacturing, have struggled, emphasising the import of cultural, institutional and policy factors when considering the issue of regional resilience, as noted by, Swanstrom (2008) and Pendall et al. (2010).
The importance of path dependency in establishing possible future pathways for growth (Martin and Sunley, 2015; North, 1993; Setterfield, 1997) was also in evidence, with dominant sectors prior to a downturn remaining central to the success of many English regions, though catch-up from other sectors was evident amongst the best-performing industries in all but two of the regions examined. However, when productivity and regional competitiveness are factored into economic performance, the picture is less convincing. Jobs are maintained but productivity suffers. Crucially, employment appears to be driven by national and sectoral growth rates, in turn benefiting from government spending, rather than regional specialisation. This conclusion echoes the findings of Copeland and Diamond (2022), namely, that national policy fails the needs of less affluent regions. Policy protects employment but rewards activities focused inwards to domestic markets, rather than those externally facing. This serves to maintain low productivity jobs, if not actively encourage their creation. This was especially evident during the pandemic period. Brown et al. (2020) conclude that devolved powers to regional actors in areas such as industrial policy are the most effective way to combat problems such as low productivity.
The challenge of the pandemic years
The decision to treat the years 2020-21 as a separate period of analysis stems from the problems associated with data collection during the pandemic. These years cannot be measured akin to the other economic crises, not because the pandemic isn’t part of the natural business cycle but rather because the reaction to them is so distinctly different. However, this does serve to underline the importance of institutional policy in framing regional resilience (Setterfield, 1997) and makes consideration of the impact of government efforts to maintain the functioning of the economy during the pandemic worthy of observation. Greater details around these challenges underscore the difficulty of extracting findings from the data.
A shift-share analysis is unsuitable for this purpose, but a dynamic version in a time series at least serves to show how catastrophic the impact of the health crisis was from an employment standpoint. For example, looking at the case of the largest English region in terms of employment, London, it is clearly evident how detrimental furloughing was. In terms of employment count, returns show the sudden dip associated with the pandemic (Figure 10). A short comparison of growth rates by leading industrial sectors also shows how the London region behaved in the years 2019-21 (Figure 11) with some increases in certain sectors. Frequency of employment in Industrial Sectors in the London region, 2009–2022. Note: Source. Compiled from regional returns of the Business Register and Employment Survey 2022 using NOMIS, an official census and labour market statistics service supplied by the ONS. See: https://www.nomisweb.co.uk/. Changes in employment numbers in largest industrial sectors in the London region, 2009–2021. Note: Source. Compiled from regional returns of the Business Register and Employment Survey 2022 using NOMIS, an official census and labour market statistics service supplied by the ONS. See: https://www.nomisweb.co.uk/.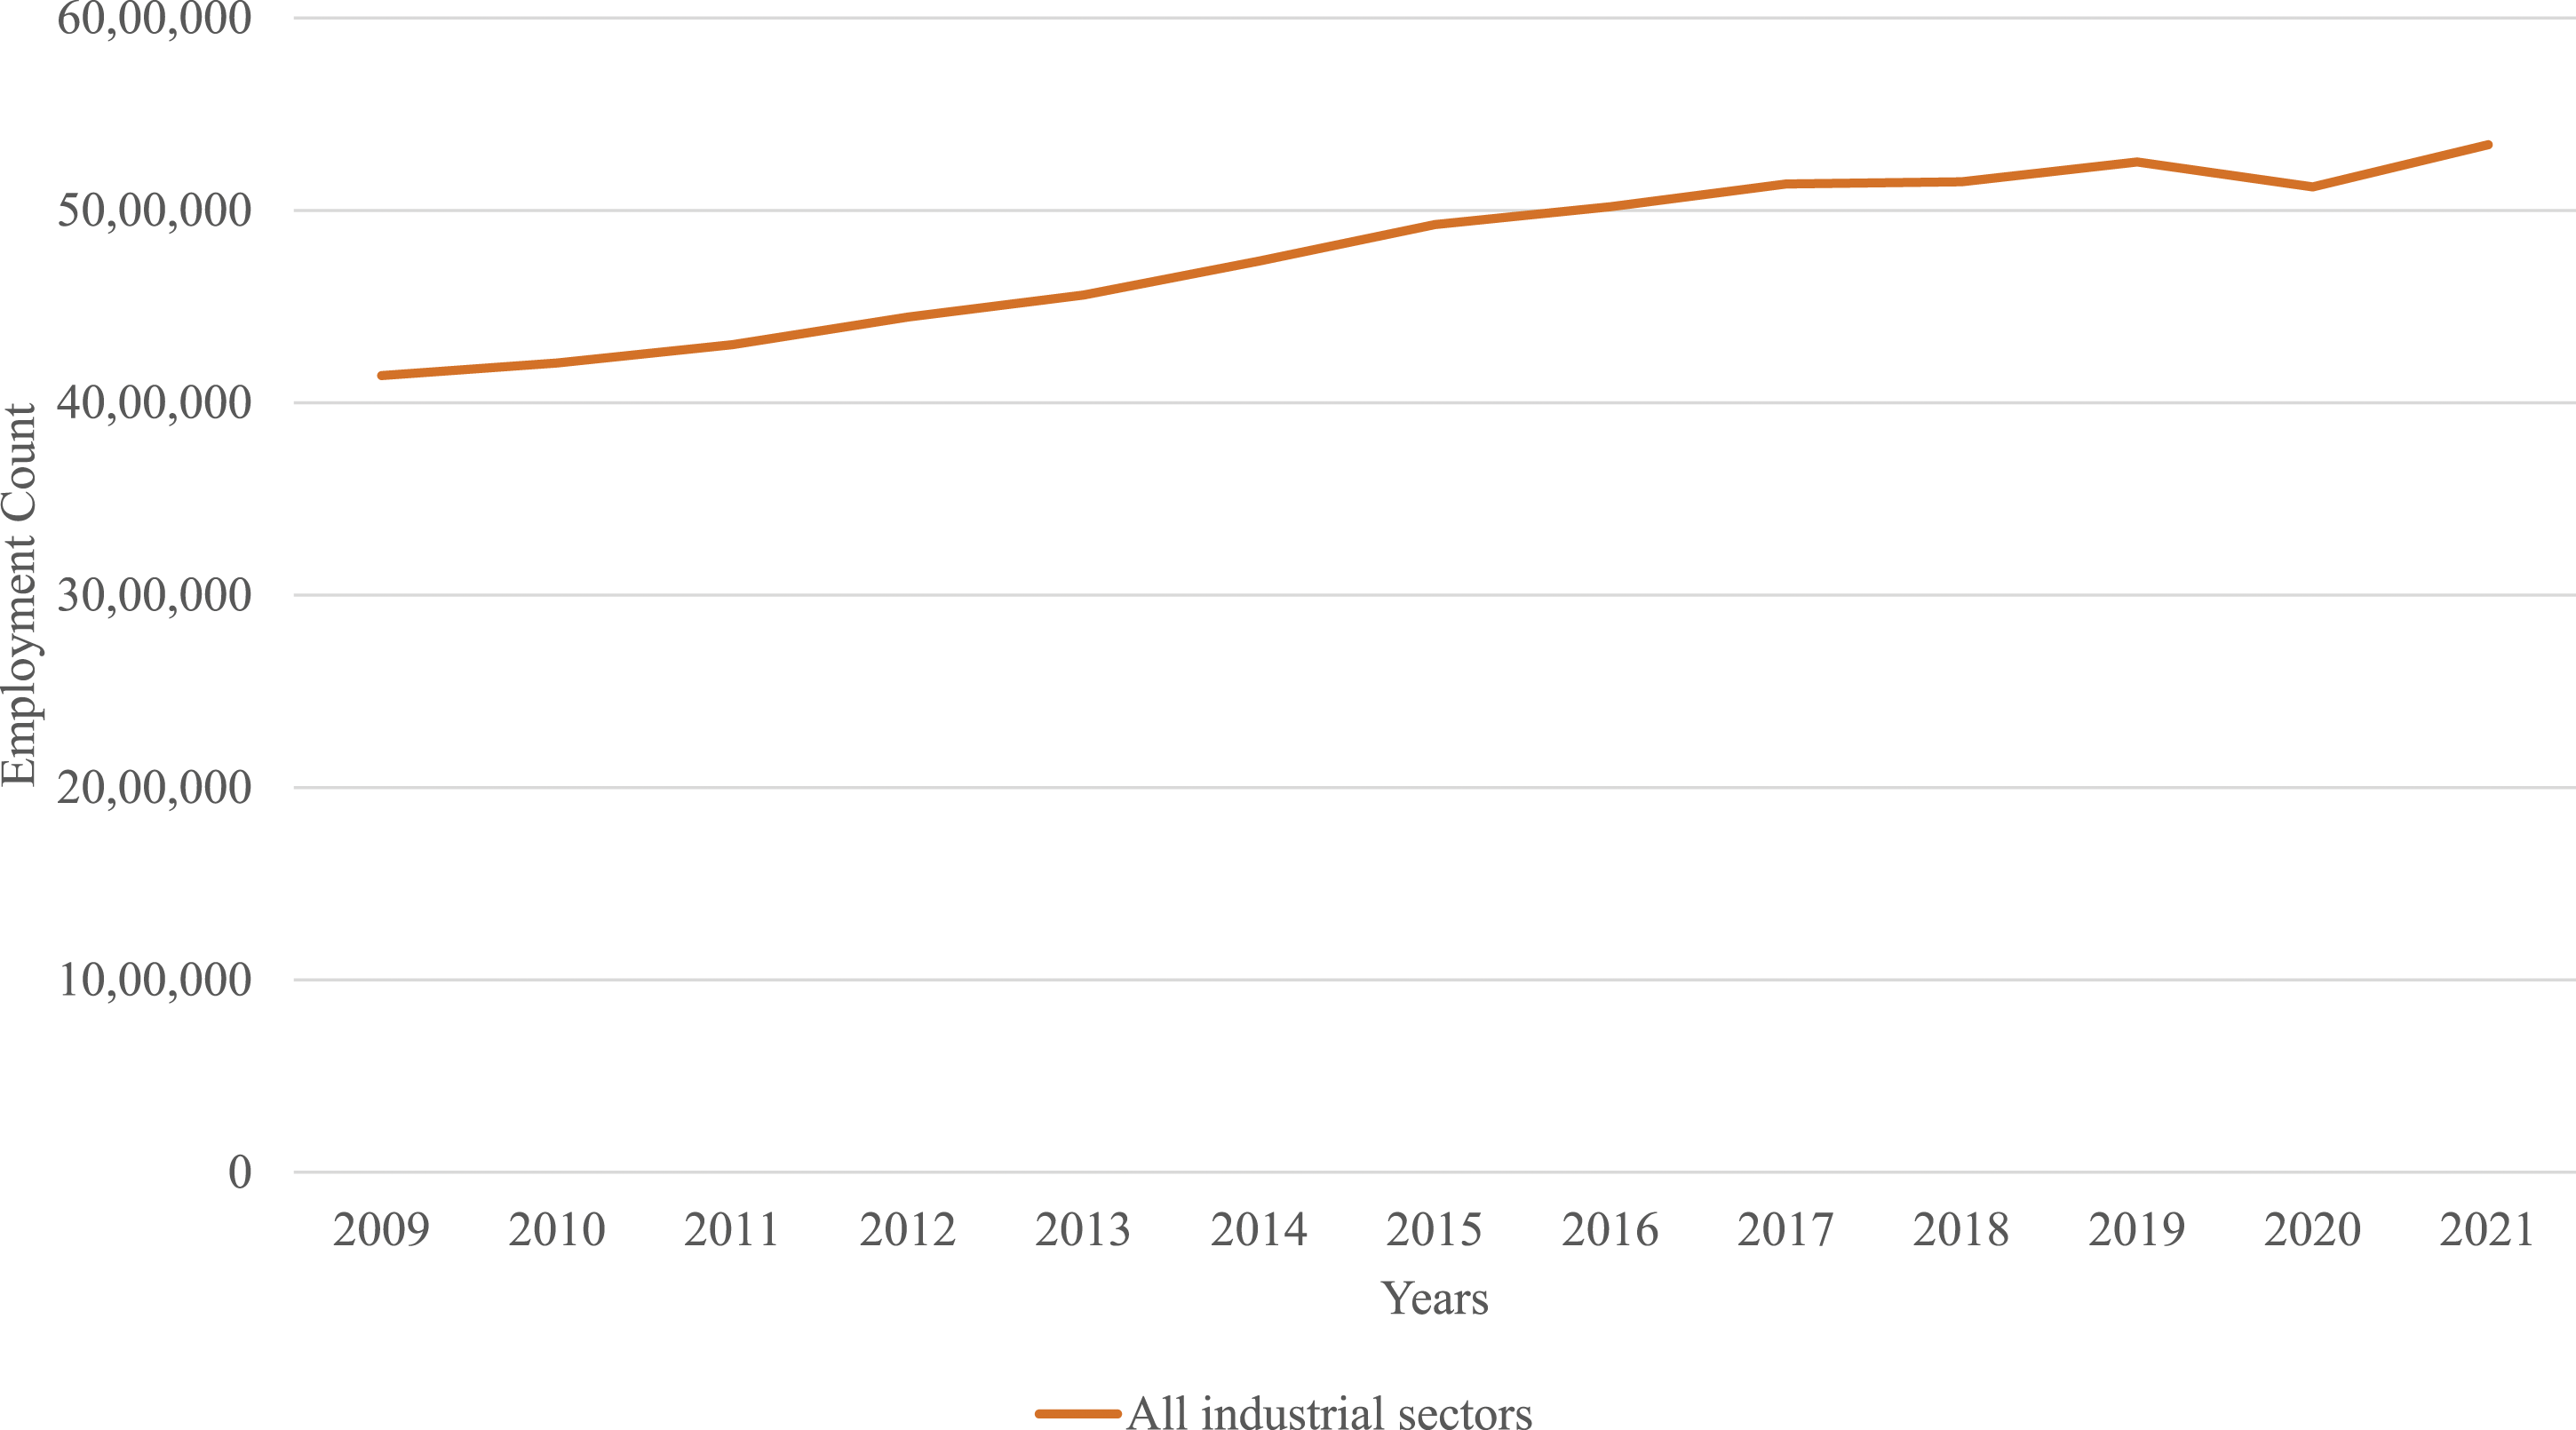
The dip is far less severe and the recovery less pronounced. Notably, some of the top-performing sectors were seemingly unmoved by events. However, it is not possible to determine how impactful furloughing and the selection of key workers would have been in shaping employment numbers. For example, key workers asked to continue working included those involved in ‘utilities’ and ‘communications’, would be captured under sectoral divisions such as ‘61: Telecommunications’ and ‘63: Information service activities’ in the ONS returns. This would result in an artificially higher level of resilience related to policy factors, rather than economic currents.
Shift share analysis of the Yorkshire and Humber region, 2009–2019.
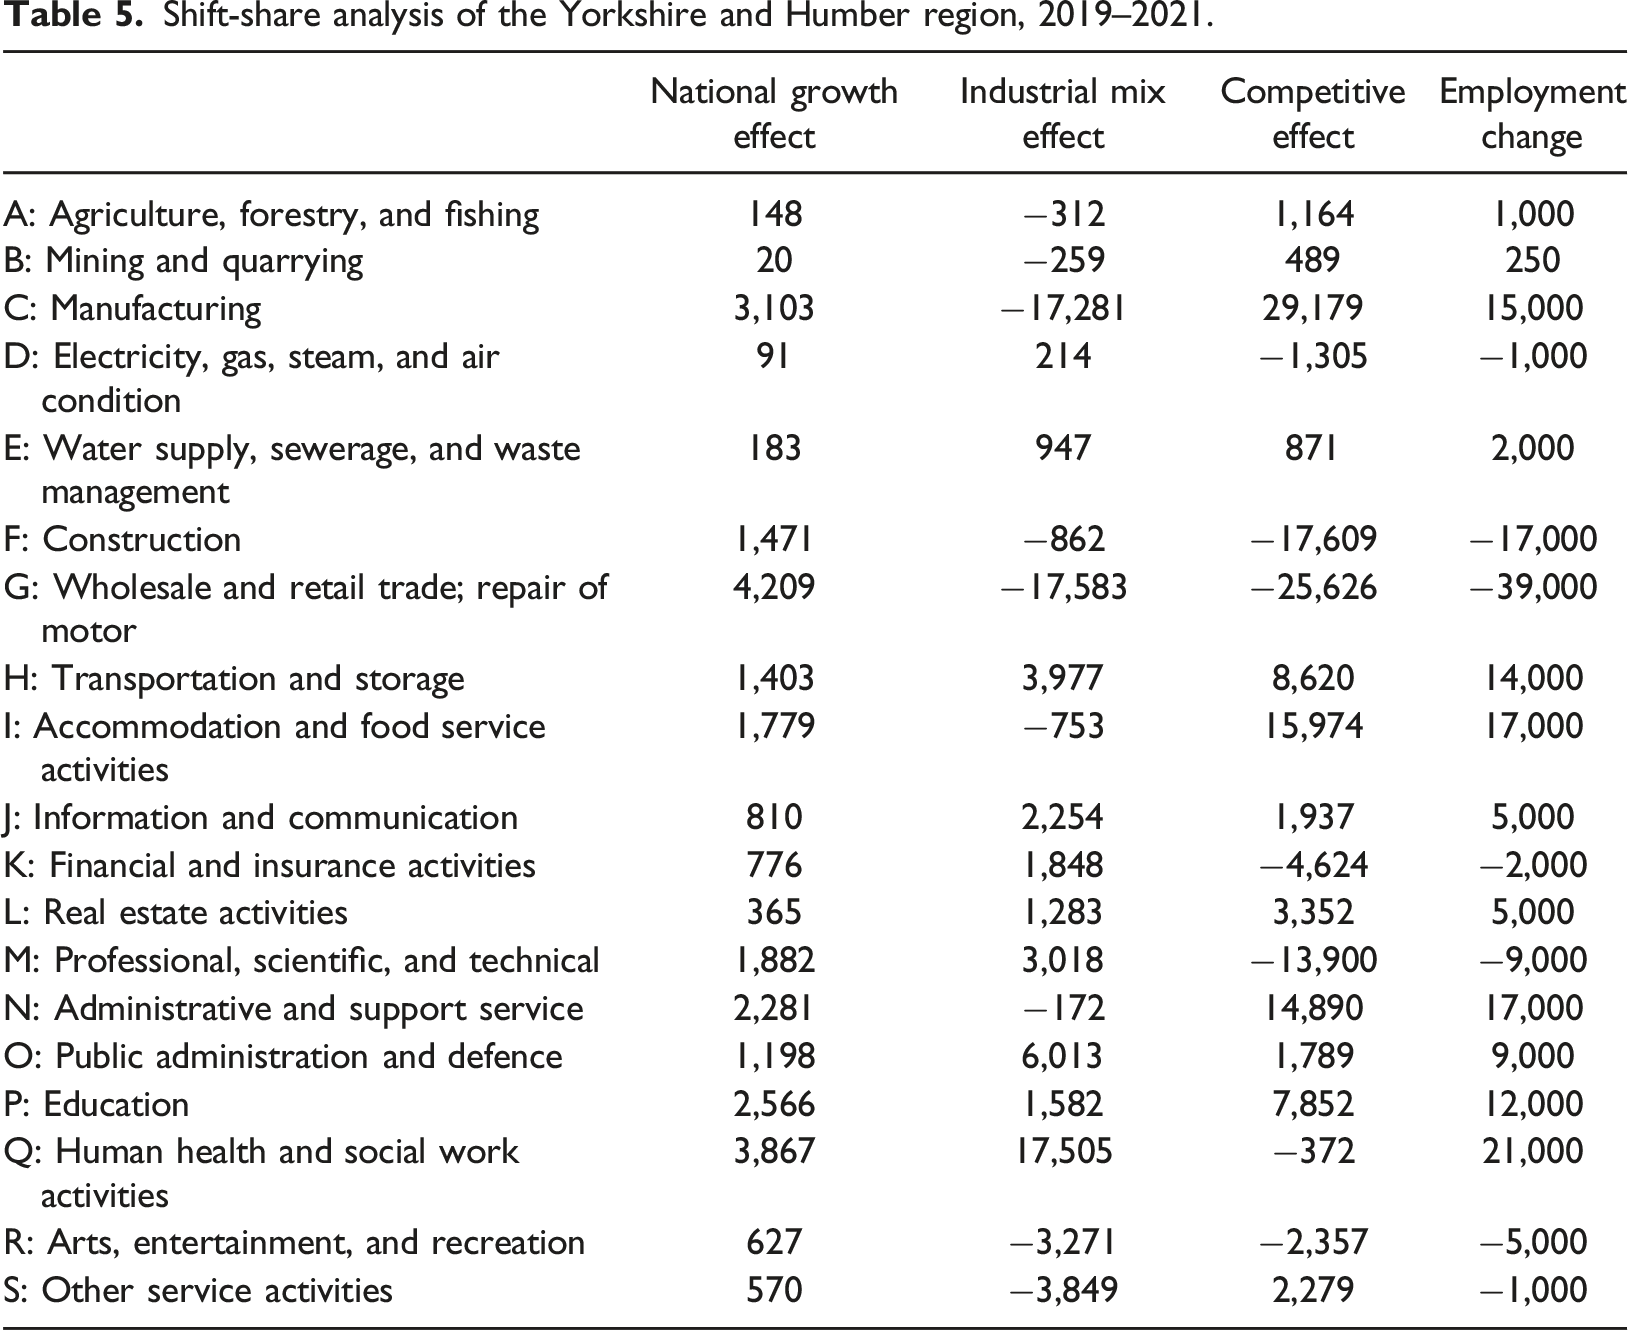
Shift-share analysis of the Yorkshire and Humber region, 2019–2021.
Dynamic shift share analysis of the Yorkshire and Humber region (summed), 2009–2019.
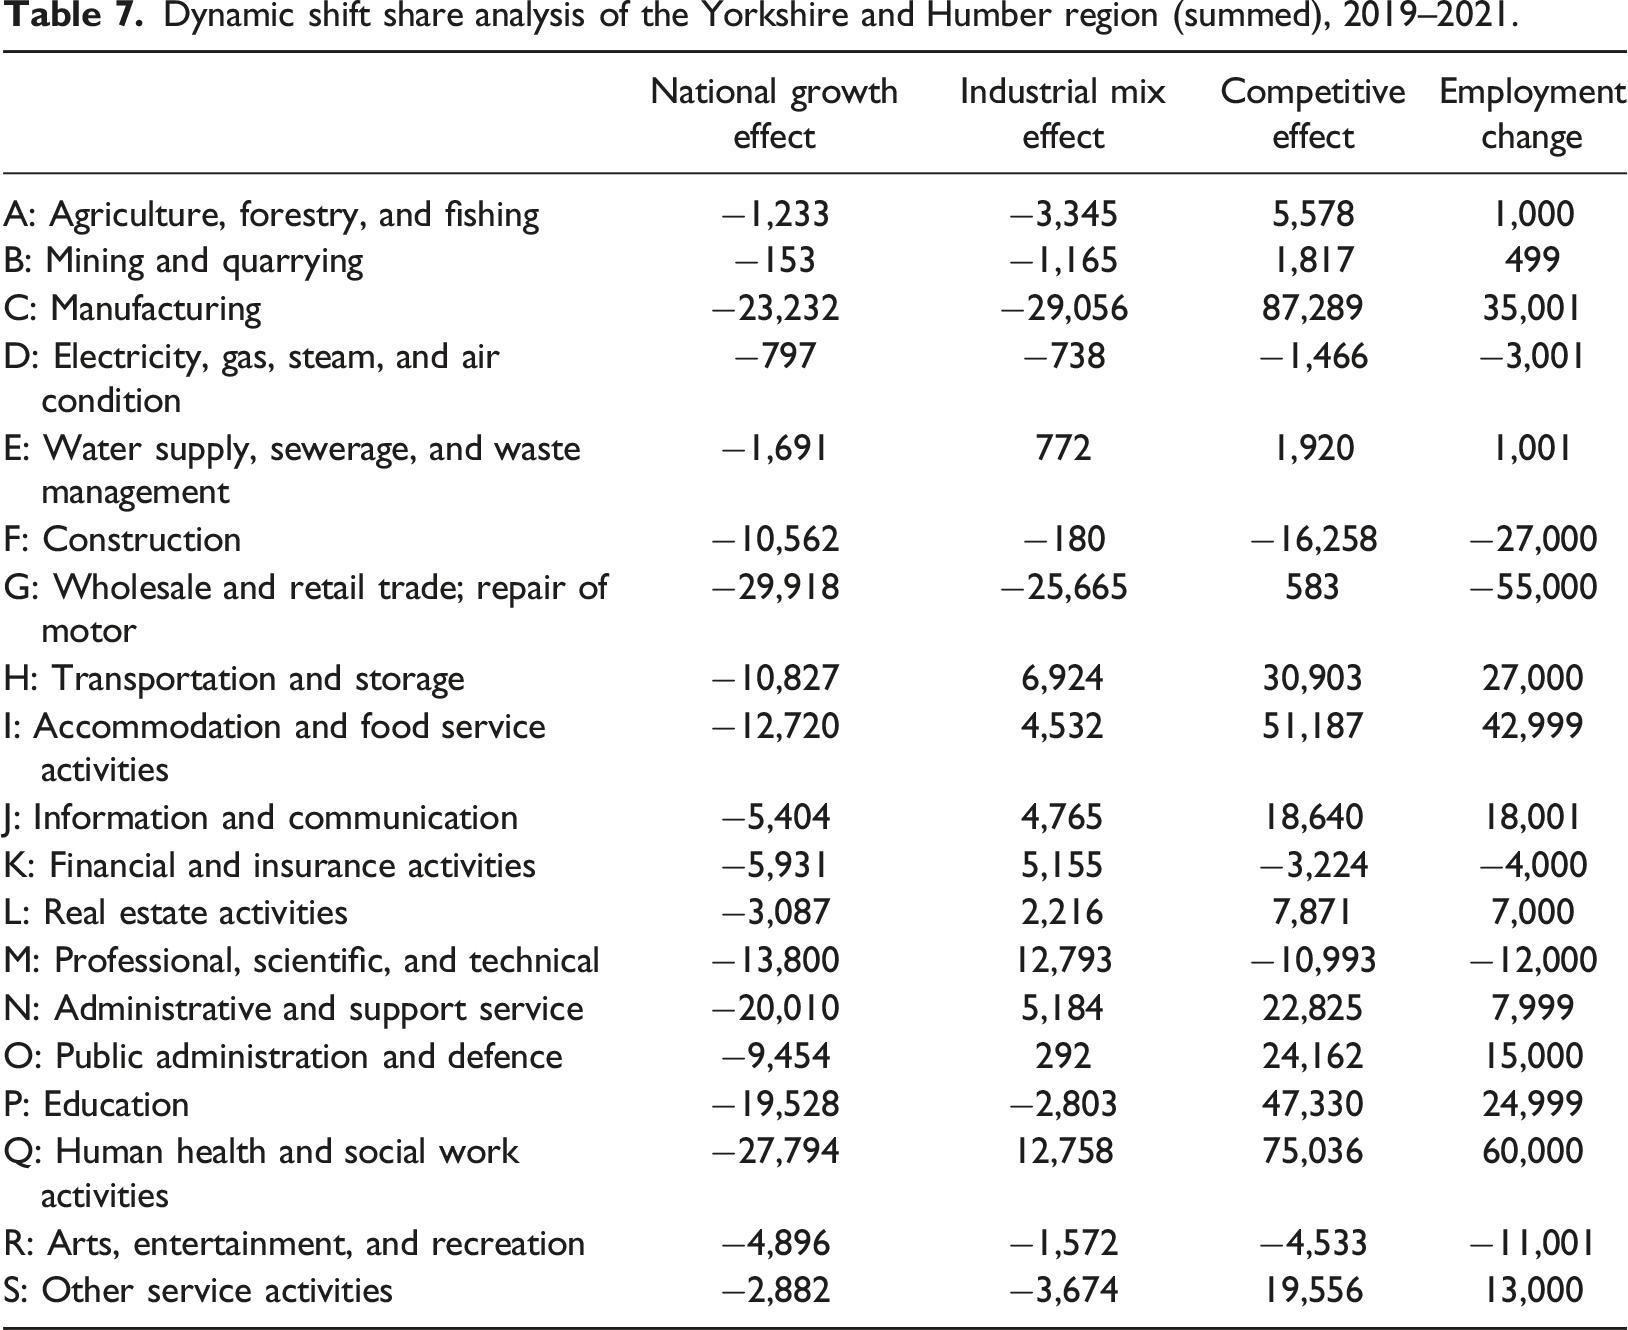
Dynamic shift share analysis of the Yorkshire and Humber region (summed), 2019–2021.
To continue would only serve to further confuse. Suffice to say that available data prevents a more telling and probing examination of the entire period. Furthermore, in terms of resilience, the use of the furloughing policy aimed at job protection has the effect of masking any structural flaws, potentially deepening them in the aftermath of the pandemic.
Conclusion
The present study highlights the importance of institutional policy not only in framing regional development but also in potentially skewing employment numbers and economic growth. In terms of the wider debates surrounding resilience and bounce back from economic shocks, this work locates itself within the school of thought that emphasises the role of institutions and policy in framing economic recovery including Hassink (2010), Swanstrom (2008), and Dawley et al. (2010). In a short period of time, the UK government was forced to respond to three different economic shocks. Their response was consistently to prioritise key institutions and, crucially, protect jobs. These policies were economically defensible, but from a resilience perspective served to dampen the troughs while directing the peaks of the business cycle, giving an erroneous image of adaptive capacity and recovery.
During the period under review, the majority of English regions showed the bulk of employed workers to be concentrated in few industrial sectors. Importantly, shift-share analysis demonstrates that the drivers for the growth of these sectors were national and industrial growth rates, rather than regional competitiveness. This point is crucial, as occupational change in these key industries across these regions remained largely unaffected by economic shocks, with the exception of the Pandemic period, though these figures are forcefully skewed due to furloughing and essential worker selection (as discussed earlier).
These findings suggest that the comparative lack of specialisation insulated many English regions from the more damaging aspects of these exogenous shocks. However, this only tells part of the story, since in these regions economic turmoil impacted key sectors differently. Manufacturing in particular, with long supply chains and an export orientated focus, was more affected than, for example, education, which moved largely unscathed through crises. However, the downside is the question of productivity. What emerges is the unlovely spectre that low-productivity occupations also play a role in resilience in these inwardly focused regions.
Unlike other English regions, London is an example of how regional specialisation and higher productivity activities are hit more strongly by exogenous shocks, but high investor confidence and impactful institutional policy in the form of construction projects can maintain investor confidence and encourage rapid recovery, echoing the views of Tsiapa et al. (2018) and Giannakis and Mamuneas (2022). Southern regions in close geographical proximity may also have benefited, consistent with the analysis of Martin and Gardiner (2019). However, the replicability of such resilience across other English regions remains questionable, particularly given the centrality of the London region to so much of the UK’s business and policy focus.
In answering the proverbial ‘so what?’ question, the significance of our findings lies not only in highlighting industrial sector variations in terms of resilience across regional contexts but, equally important, also in raising critical implications for the development of future economic policy. Specifically, strongly centralised legislation and projects that benefit the capital and, possibly, surrounding regions may not be enough to act as an engine of growth for the rest of the economy. Important, too, is the understanding that job maintenance activities that are broad in scope but short on detail are unlikely to resolve the productivity puzzle that beleaguers much of the UK economy and focused policies aimed at maximising regional specific growth factors should be considered. A cynical reader could still argue that regional resilience or competitiveness may be a red herring, after all, if national growth is strong does it matter if the regional component is low? This view has a long tradition not only in the literature but also in national policies, too. As Williamson (1965) argued, many countries’ governments have a tendency to see their own regional imbalances as uniquely pronounced and intractable. Yet, we are of the view that regional disparities matter, especially in terms of employment opportunities as they evolve across rising or declining regional economic sectors. Employment changes of the kind our data unveils can result in further differences in average living standards across regions, augment overall inequality, and entail some degree of unfairness or injustice, themselves, in turn, carrying non-trivial social and political consequences.
A few final caveats are in order. First, in reflecting on our findings, and their reliability, it is worth asking the question of the extent to which the patterns we unveil credibly align to meaningful underlying trends or shifts or, conversely, merely reflect the complex dance of random steps in occupational shares amid the inherent noise that typically accompanies employment data. This is an important question to square, especially in the context of the well-known ‘snapshot’ pitfalls of traditional SSA shift-share approaches, particularly during times marked by multiple external shocks. But, in our defense, we would argue that additional confidence can be placed on our findings given that we also employed a ‘dynamic’ shift-share approach that by allowing for the identification of atypical years and years of economic transition is better suited to account for such issues, especially when examining data for periods affected by external economic shocks.
Second, like any other study attempting to gauge regional economic resilience, we acknowledge that its measurement is not exact, and it is based on what is inevitably a subjective interpretation and evaluation of how the economic system under scrutiny responded to shocks by comparing data over time. We, therefore, encourage further research into the development of resilience indices and/or indicators that would allow future studies a more precise measurement of regional resilience, especially one capable of tracking trends across regions or countries.
Third, it is important to stress that – consistent with our focus – the present study examined resilience from the sole perspective of the regional capacity to bounce back and recover from shocks, which was the circumscribed interest of our endeavour. However, we recognise that resilience is a much broader concept that can be affected by wider geographical processes, including influences from the global economy and national political power. Future research, therefore, could expand our analysis by investigating resilience as part of these higher-level socio-economic environments in which it is also embedded. Moreover, although the social and economic context influences individuals’ resilience, it must be acknowledged that the ability to adapt to adversity and endure job demands stems from and requires consideration of aspects (traits, capacity, and processes) at the individual worker level, which given the central interest of our study, have been taken as a given. But as far as the still fragmented conceptualisation of the concept of resilience, particularly within the management literature (see, e.g. Kossek and Perrigino, 2016), a profitable avenue for future research might include the exploration of how individual resilience influences, and is influenced by, the changing nature of work across heterogeneous occupational regional contexts, particularly in its capacity to act as a buffer against changing job demands.
Footnotes
Declaration of conflicting interests
The author(s) declared no potential conflicts of interest with respect to the research, authorship, and/or publication of this article.
Funding
The author(s) received no financial support for the research, authorship, and/or publication of this article.