
Abstract
While investment in social housing is mentioned in the Government’s white paper on levelling up, it does not receive the emphasis extended to infrastructure investment. Traditionally, the case for affordable housing was based on merit goods arguments. While the economic effects of housing have been explored, this has mainly been through traditional economic impact studies whose perceived weakness has led to a degree of policy scepticism around the findings of such studies. Recently, however, a strong case has been made for treating investment in housing on a comparable basis to infrastructure on the basis of its potentially important impacts on the supply side, stimulating labour supply and productivity. The purpose of this paper is to evaluate the potential economic impacts of meeting the projections of affordable housing needed in Scotland to combat homelessness using a framework that overcomes the weaknesses of conventional impact analyses.
Introduction and background
The recent white paper (HM Government, 2022) has set out the Government’s levelling up agenda. While social housing is mentioned it does not receive the central emphasis that is afforded transport and other infrastructure. 1 Indeed, traditionally, the case for investment in social housing has been based around social and merit good arguments. This does not, however, imply that the economic impact of social housing has been entirely neglected; many ‘impact studies’ have been conducted in an attempt to identify the effects of housing-related expenditures on economic activity. However, assessments of the economic effects of such investments have typically been based on conventional economic impact analyses that focus exclusively on the effect of housing investment expenditures on demand. The best of these studies have been based on input–output (IO) models. (see e.g. National Housebuilding Federation, 2015.)
The results of such impact studies tend, however, to be met with a degree of ‘policy scepticism’ on the part of the wider policy community. 2 First, they are based on the limiting assumption of an entirely passive supply side, which is known, in effect, to maximise the estimated expenditure impacts and so may be regarded as generally exaggerating the economic benefits. Second, the government expenditures that normally account for a major share of the impacts could generate similar effects if used to stimulate demand elsewhere. So, the economic impacts are not uniquely associated with spending on social housing. Third, the impacts relate primarily to new construction expenditures that are themselves transitory. While the effects of these expenditures could extend beyond the period over which such spending persists (although the conventional approach does not typically allow for this), they are also ultimately transitory. Consequently, the case for a positive contribution to levelling up based solely on the results of conventional impact analysis may be regarded as less than compelling.
However, McLennan et al. (2018), McLennan (2018), McLennan et al. (2019) argues persuasively that housing should be regarded as a type of infrastructure investment that is likely (in effect) to have potentially important beneficial supply-side impacts, in a similar manner to transport investments. These may include, for example, labour productivity effects and savings in transport costs that impact labour supply. Neglecting such supply side impacts, as conventional analyses do, risks underestimating the economic contribution of housing, particularly since these effects may be permanent – in contrast to the demand (construction-oriented) impacts. 3 As a consequence the potential contribution of housing in general and affordable housing, in particular, to the levelling up agenda may be seriously underestimated.
In this paper, we explore the possible contribution of new investment in affordable housing to levelling up. The white paper makes it clear that the intention is for the agenda to apply to wide range of spatial levels, including local and regional, and emphasises the scope for further devolution. Here, we focus on a single region, Scotland, for a number of reasons. First, Scotland is the only UK region that produces official input–output tables – a critically important input into the modelling approaches we employ here. Second, the emphasis of the white paper is also on the performance of individual spatial units. Third, the focus on a single region is well-motivated if the host region is relatively small, as it is in this case. Since Scotland is less than 9% of UK economy on any measure, spillover effects from Scotland to the rest-of-the UK (RUK) are likely to be modest and associated feedback effects to Scotland from RUK negligible. This allows us to focus solely on the impacts within Scotland. Finally, Scotland already has a high degree of fiscal autonomy and can, for example, choose how to allocate its funds across alternative uses (although that has been true of Scotland even prior to the establishment of the Scottish Parliament). It should be noted that Scotland is used here to illustrate the generic impacts of social housing investments that would be applicable to other regions of the UK and elsewhere. 4
The next section of the paper gives a review of the literature on the macroeconomic effects of housing in general and social/low-income housing in particular, which notes that conventional economic impact analyses dominate the literature. Following the literature review we provide an overview of the methods we use in our impact analysis. We then assess the impact of affordable housing using a conventional IO approach and a comparable computable general equilibrium (CGE) model analysis, which allows for the presence of capacity and labour market constraints (that imply likely price and wage responses to the housing expenditures) and legacy impacts.5 The section after the demand side analysis discusses possible supply-side impacts of meeting affordable housing needs. The final section is a brief conclusion, which emphasises the importance of our analysis for policy towards investment in social housing. In particular, our results suggest that, contrary to an apparently prevailing policy scepticism, investment in affordable housing can make a significant contribution to the Government’s levelling up agenda.
Review of the literature on the macroeconomic impact of affordable housing
A large literature exists on the relationship between macroeconomics and housing (Leung, 2004) with a key component being the demand-side impacts relating to the construction of housing projects. The basic idea is that substantial new expenditures on housing can be expected to exert an impact on the host economy, through its stimulus to the demand for construction materials and labour and capital inputs. 6 Giang and Sui Pheng (2011) review a large proportion of the construction industry literature from the past 40 years, finding a clear link between construction and economic activity, thus a link between housing construction and economic development.
Several studies, using a range of methodologies, aim to quantify the demand-side impacts of housing projects or policies. Using the Regional Input–Output Multiplier (RIMS) modelling framework, Zielenbach et al. (2010) investigate the economic impacts of the redevelopment and operation of the low-income housing HOPE VI program in the USA. The authors find significant direct, indirect and induced impacts in terms of employment and economic output across the program. Similar to Zielenbach et al. (2010), Campos and Guilhoto (2017) make use of an IO model for the economic impacts of the construction of a low-income housing program, this time the MCMV in Sao Paulo Brazil. For the study, an interregional IO model was employed, estimating the impacts in the Sao Paulo region as well as the rest of Brazil with different types of housing modelled.
Kotval (2001) uses a regional model, based on IO principles, to measure the potential economic impacts arising from the development of 100 affordable multifamily units in Massachusetts. Different area types (urban, suburban and rural) were investigated, and the study found that constructing the units in the suburban area would create more jobs and generate a higher level of income for residents and both the state and local governments. Economic impact analysis is a key component of the policy literature on housing reflected in, for example, the National Housebuilding Federation (2015), Shelter Scottland (2015) and.
Unlike the above literature, which uses ex-ante analysis techniques for proposed projects and policies, a range of studies carry out ex-post analysis of housing projects. Schwartz (1999), using a survey method, investigates the impact that the New York capital-building plan (between 1986 and 1997) had on the economy. The author identifies the recruitment of local contractors to be the largest direct economic impact of the program and commercial revitalisation through increased consumer spending being the significant indirect/induced impact. Munday et al. (2004), use an IO model of Wales and (input–output–based) hypothetical extraction methods, to measure the importance of the housing sector to the Welsh economy. The authors find that the housing sector (which includes construction) in 2000 accounted for 4.5% of total employment and is a key sector to assist in the development of the regional economy. Finally, Byun (2010) notes that the reduction in housing demand, due to the rapid growth seen between 1991 and 2005, was (in part) a cause of the 2008 recession.
There has recently been a recognition of the potential importance of impacts of housing on aggregate supply within the host economy. McLennan et al. (2019) explore two major supply-side mechanisms, both of which reflect the fact that their focus is on housing investments that brought occupants closer to local labour markets. One emphasises the impact of housing investment on travel to work costs and effective labour supply. The second focusses on the effect of housing investment on labour productivity through better job matching.
It is increasingly being recognised that affordable housing has important effects that extend beyond purely economic impacts. Diamond and McQuade (2019) estimate the spillover effects of affordable housing (funded by Low-Income Housing Tax credit) in the USA finding that such developments in low-income neighbourhoods increase housing prices, lower crime rates (also noted in Anderson et al. (2003)) and increase racial diversity. However, similar developments in higher income neighbourhoods have the opposite effect on local house prices and attract lower-income households. Nguyen (2005) reviews pricing impacts and finds that there is evidence overall of a small reduction in property prices, but this is smaller or even non-existent the better the quality of design and management, compatibility with host location and the less concentrated low-income households are in the locality. Gibb et al. (2020) explore several possible ways of incorporating the wider impacts of social housing into the assessment process.
While the wider effects of social housing are, of course, important and should be accommodated within the overall evaluation process, our focus here is on improving the economic impact assessment process typically applied to housing in general and to social housing, in particular. We do this by addressing the main weaknesses of typical economic impact analyses identified by Gibb et al. (2020): the assumed absence of a supply constraint. 7 We address this by adopting a CGE modelling framework that can capture supply-side constraints and allow for the supply-side impacts of social housing.
In adopting a CGE modelling approach we follow Maclennan et al. (2019), but our analysis differs in a number of respects. First, we systematically explore the impact of supply constraints on our estimates of the impact of affordable housing, contrasting the results with those obtained from a conventional analysis that is based around a Social Accounting Matrix extension of an input–output system. Second, while the Australian study focusses essentially on the impact of households changing locations, here the emphasis is on providing housing for the homeless. Accordingly, while it is clear that the planned new Scottish investment in social housing is going to be concentrated in urban areas it seems very unlikely that it would generate the same kind of improved spatial ‘access’ for both suppliers and demanders of labour. 8
This emphasis on the homeless suggests alternative plausible routes through which the expenditures could stimulate the supply side of the economy – through increases in labour supply and labour productivity. While the same variables are impacted as in the Australian case, the transmission mechanisms are rather different. Several authors (Crane et al., 2005; Morris et al., 2005) have identified the link between homelessness and unemployment (UK homeless employment is less than half the national average), indicating that a reduction in homelessness could be associated with an increase labour market participation. An additional mechanism is the increase in education outcomes (and, subsequently, productivity) of homeless children. Dworsky (2008) found that only a minority of homeless children scored at or above the national average and (Masten et al., 2014) identifies a link between homelessness in children and academic achievements.
Modelling methods 9
Whenever expenditures on social housing are substantial (relative to the scale of the host economy), we would expect there to be system-wide effects on the host region’s economy. As we have seen, until now the literature has focussed primarily on the effects on aggregate demand within the region, initially through the stimulus to construction activity, but spreading to other sectors through indirect and induced effects. IO modelling is the best method of tracking these effects wherever the supply side of the economy is passive because of existing spare capacity/unemployed resources. In Section 3.1, we outline this modelling approach.
Recent literature has, as our review notes, emphasised the potential importance of supply-side influences (as evidenced recently, for example, by supply chain issues and labour shortages), which imply that some part of any demand stimulus may be reflected in price rises and correspondingly smaller increases in economic activity. However, it has also emphasised the potential for direct stimulus to the supply side of the host economy through, for example, increases in labour supply and productivity. IO analyses are unable to capture such effects, but CGE models are capable of doing so. In Section 3.2 we outline the CGE modelling approach. Adopting both IO and CGE approaches to analysing a common dataset, as we do in Section 4, allows us to provide a meaningful comparison of their results.
Input–output modelling (conventional impact analysis)
Input–Output (IO) models are multisectoral in nature, calibrated on an IO table. 10 The models are based on a number of key assumptions. The first of these is that the supply side is entirely passive; supply can always adjust to meet any changes in final demand. The model is driven entirely by changes in demand. Also, the assumption is made that both commodity prices and ratios of inputs are fixed – there is no substitution among inputs.
Fundamentally, IO models are a set of linear simultaneous equations representing the linkages within an economy, illustrated in equations (1) and (2)

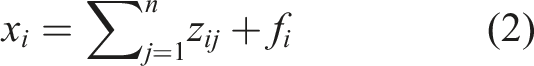


For the model used in this paper,
There are two fundamental variants of the demand driven IO model (Type 1 and Type 2), which differ in their treatment of households within the model. For Type 1, the household sector is treated as exogenous to the model and not included in the A matrix. A Type 1 multiplier captures the direct and indirect change resulting from a unit change in final demand for the output of a sector. Direct effects are the simplest – if there is an increase in demand for a sector then the output of that sector will increase by at least that amount.
However, as is apparent from the IO tables, each sector in the economy is linked to other sectors, so that an increase in output in one sector will also require an increase in the output of the linked input sectors; these are the indirect effects.
Type 2 demand driven models also include the direct and indirect effects along with a third effect, the ‘induced effect’. An increase in final demand requires some degree of increased labour input, reflected in the increased payment to compensation of employees. This in turn will generate additional increases – due the work force having an increased level of disposable income to spend – in final demand and thus output. This is known as the induced effect and is calculated by ‘closing’ the IO modelling to endogenise household consumption, by expanding the A matrix to add a row and column representing household labour input and consumption (Miller and Blair, 2009). The Social Accounting Matrix (SAM) model that we use here incorporates a fuller treatment of the sources of (endogenous) household income (which does not arise solely from employment as Type 2 IO models typically assume) but maintains the assumption of fixed coefficients.
Overview of CGE models
While input–output tables and SAMs are also essential databases for the calibration of CGE models, the latter are much more flexible than IO and SAM models, allowing for the presence of supply-side constraints, wage and price endogeneity and substitution among inputs. The uses of CGE models vary greatly and there is no ‘one size fits all’ for the model structure, which is often driven by the questions to be addressed. However according to, Shoven and Whalley (1992), the fundamental principle of all CGE models is the same in that there is a set of simultaneous equations with a range of variables characterising the whole economy along with a real database on the inter-industrial flows of the economy. In the modelling setup, CGE models are generally based on neoclassical economic theory whereby by consumers maximise their utility subject to budget constraints while producers maximise profit/minimise cost
Along with the SAM database, the choice of utility and production functions is of considerable importance within CGE modelling, depending on the purpose of the model application. Commonly used production and aggregation functions within CGE models are constant elasticity of substitution (CES), Cobb Douglas (CD) or Leontief (fixed proportions). The model also has a number of key exogenous parameters specified such as the elasticity of substitution between domestic and external goods and services, often based on the Armington function (Armington, 1969), and elasticities of substitution among factors of production. 11 The common practice for CGE models is for production to be nested with, for example, the gross output of any sector being determined by a combination of intermediate inputs and value added at the top of the production hierarchy. At the next level of the hierarchy value added is produced by a combination of capital and labour services and an intermediate composite by a combination of sector-level intermediates.
In IO models, the fundamental assumption is that the supply side is entirely passive so that changes in demand automatically generate equal changes in supply and prices do not change. For CGE models prices are flexible and, in general, both demand and supply matter for the determination of both prices and quantities. The key strength of CGE models over IO models is that they incorporate an active supply-side, including the possibility of constraints on factors of production and of substitution among those factors. Within IO models an increase in demand is always met by an increase in industrial output in fixed proportions (since production functions are all Leontief). However, within CGEs this is not typically the case, since, as noted above, there is the possibility of substitution between, for example, labour and capital and between imported and domestically produced goods, in response to relative price changes. Any given CGE encompasses a corresponding IO system of the same aggregative structure; the latter can be obtained from the former by, in effect, ‘switching off’ the supply side.
For this paper, we use the single region AMOS CGE framework calibrated to the 2013 Scottish IO table; a full model listing can be found in Figus et al. (2018).
Economic impacts of Scottish affordable housing
The two outcome-oriented ‘missions’ in the levelling up White Paper (HM Government, 2022) involve increasing living standards (productivity, pay, employment) and wellbeing in all areas by 2030 (with some narrowing of the gap between the best performing areas and others). While we have seen in Section 2 that affordable housing may have significant effects on wellbeing other than through economic activity (e.g. reduced crime rates, greater diversity), our focus here is exclusively on economic prosperity, since that is the contribution of social housing that is subject to a degree of policy scepticism.
While the demand and supply effects of housing occur simultaneously, it is instructive to consider them separately initially to: enable comparison of conventional impact analyses with our alternative approach (using a common database); facilitate transparency and ease of interpretation of modelling results; reflect the fact that we generally have better information on the expenditure than the supply-side impacts of housing. Furthermore, we are here dealing with impacts on demand that are predominantly transitory in nature, namely the capital spending on new social housing, while supply-side impacts are likely to be ‘permanent’ (in the sense that they last over the lifetime of the stock of new housing).
The scale of the demand-side stimulus
There are two elements of new expenditure associated with the planned increase in social housing. The estimated capital expenditure is derived in part from the report by Dunning et al. (2020, Table 7.3, p. 70). They estimate that the overall requirement would be for 10,600 units per year in each of the 5 years 2021–22 to 2025-26. Of these, 66% would be ‘RSL Social Rent’ (i.e. the favoured scenario is as per the heading of the penultimate column of Table 7.3). That implies (approximately) 7,000 new social rent homes per year, which are the focus of our analysis. The estimated cost of construction is £150,000 per unit in 2020 prices 12 so that total capital expenditure is £1.05 billion per annum over the 5 years (7000*150,000). In 2021 prices the annual capital spend estimate is £1083.2 million.
The new capital spending also generates continuing management and maintenance expenditure. We take adopt the £2.08k estimate reported by Scottish Government (2019) for Local Authority housing expenditure. In 2021 prices this is equivalent to £2.15k per unit of housing. Here we have 7,000 units per annum of new spending, so begins in year 2 with 7,000, and rises with the new stock of housing until it reaches 35,000.
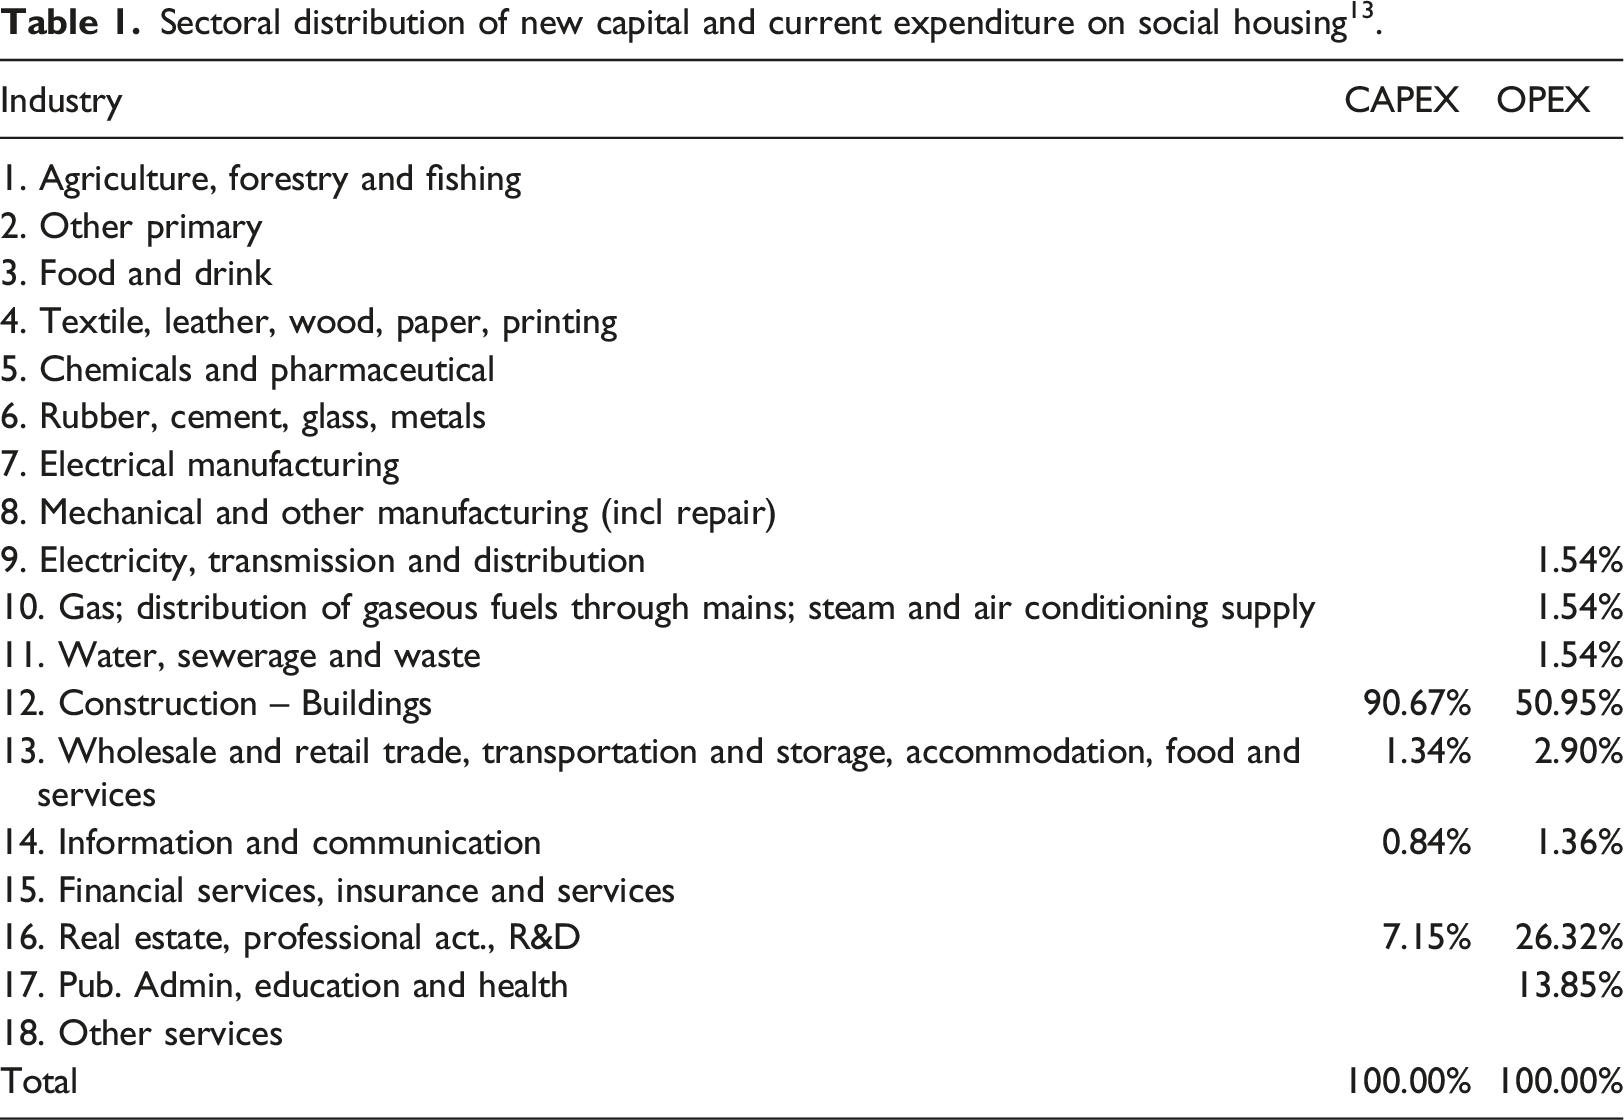
Sectoral distribution of new capital and current expenditure on social housing 13 .
Comparison of model results
Comparison of total economic impacts across different models (Present value of GDP; employment in FTE years or averaged over 5 years (CAPEX) or life of project (OPEX)) 14 .
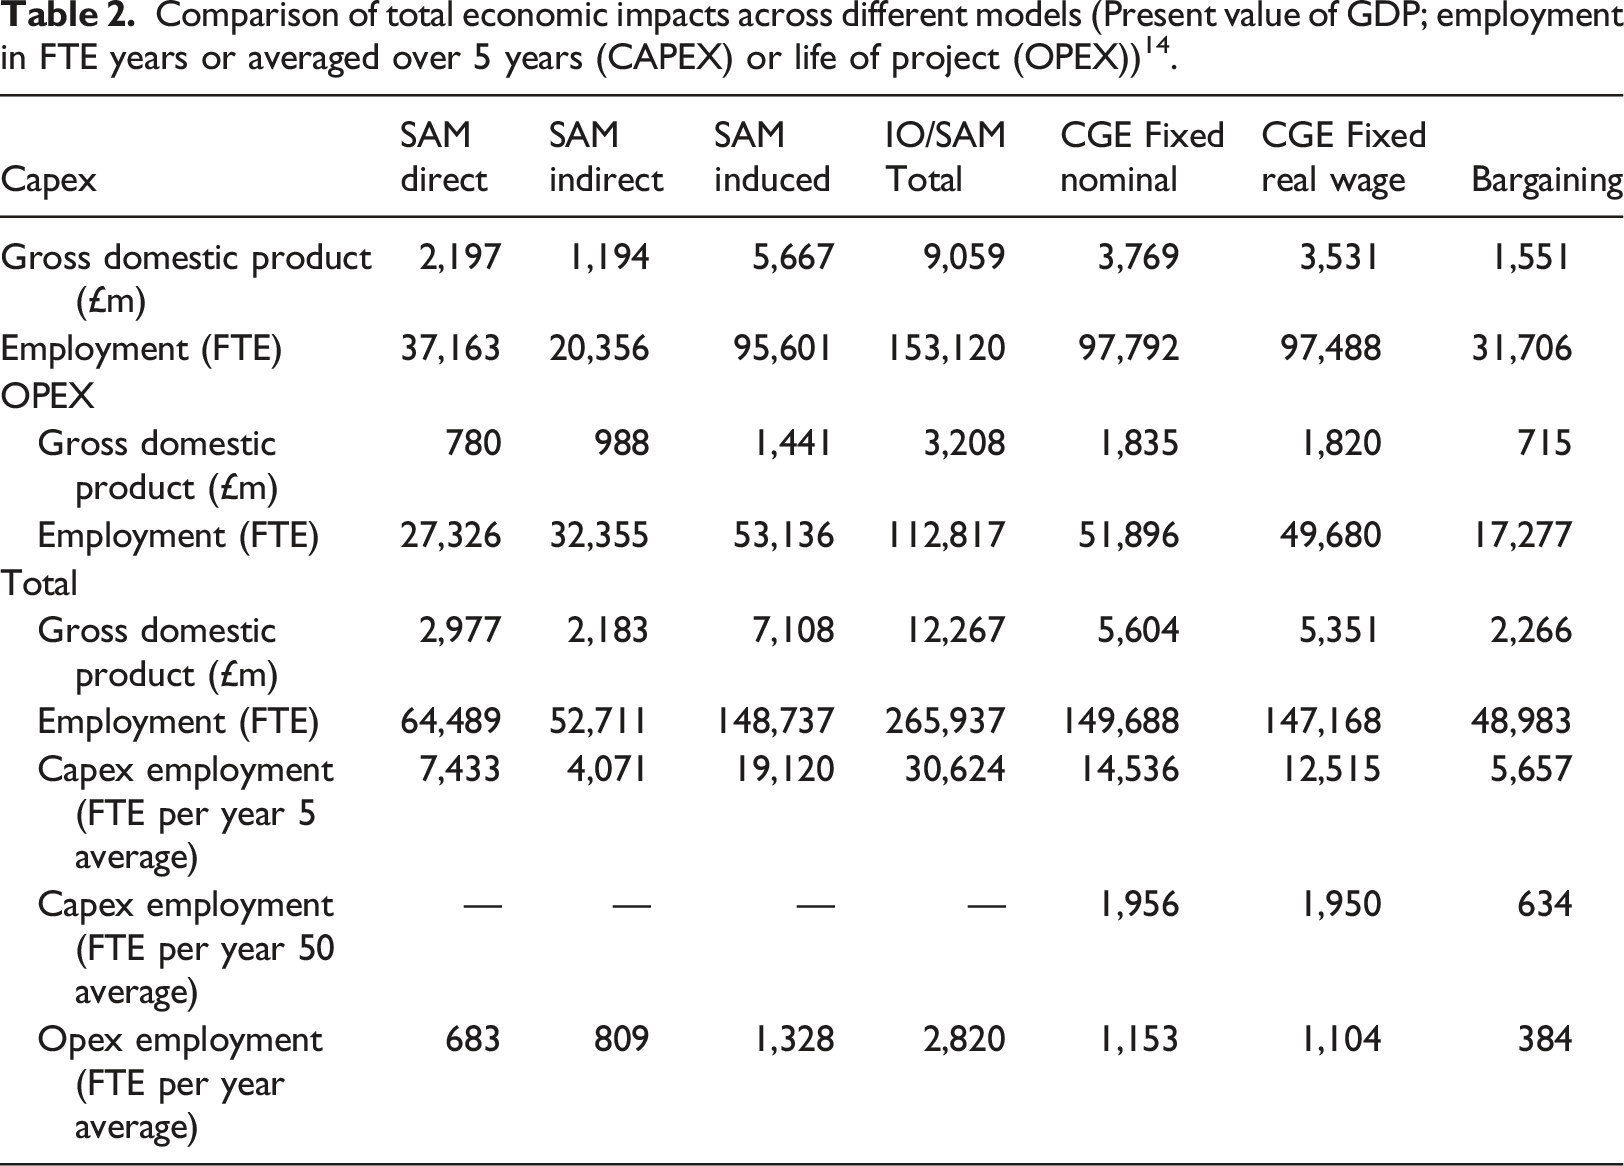
Table 2 separately identifies the direct, indirect and induced impacts (discussed in Section 3.1) with the SAM model, while using three different labour market representations within the CGE model. The ‘Fixed nominal (wage)’ model assumes that wage bargaining is conducted at the national level in the UK, and Scotland acts as a nominal wage taker, while the ‘fixed real wage’ model assumes the wages only rise at the same rate as inflation. In the ‘wage bargaining’ closure workers’ take-home pay is determined by the bargaining power of workers with the wage rate inversely related to the unemployment rate. These models capture ever-tightening supply-side constraints. For example, in the wage bargaining model the stimulus to demand reduces the unemployment rate, strengthening workers’ bargaining power, which leads to an increase in real wages that limits the extent of the expansion.
Note that the last three columns relate to the CGE simulations, which incorporate all indirect and induced effects, but do not separately identify them. Accordingly, these results should be compared to the IO/SAM Total in the fourth column.
The main message of Table 2 is that the estimated cumulative economic impacts of the expenditure on social housing depend importantly on what is assumed about the supply side. Across all models there is a significant increase in (the PV of) GDP, but the estimated effects are substantially greater under the IO/SAM assumptions of a totally passive supply side. Furthermore, the tighter the supply-side restrictions, the smaller the impact of the demand stimulus on the real economy. In the IO/SAM model, the PV of GDP is estimated to be £12.3 billion, which is 2.3 times the estimate from the fixed nominal wage model and 5.6 times that of the bargaining model. The differences in cumulative FTE employment years are not as dramatic, but the IO/SAM results are 5.4 and 1.8 times the estimates of the corresponding CGE models. The average employment impact over the 5 years of capital spending is 265.9 thousand according to the IO/SAM model, an estimate which is 1.6 times the estimate of the fixed nominal wage model and 4.9 times that of the bargaining model. For operating expenditures the IO/SAM estimate of the associated average annual employment impact is 2,820 FTEs, which is 2.4 times the corresponding estimate for the fixed nominal wage case, but over 7 times the bargaining case. 15
It may well be the case that the assumptions about wage responses could vary through time with excess capacity in the initial years, which gradually diminishes with a return to a situation in which supply constraints begin to bite. However, such a process would be difficult to capture within the CGE (at least for transitory expenditure changes), and so the outcomes would likely reflect some weighted average of the cases explored above. The degree of uncertainty surrounding the appropriate treatment of labour availability and existing capacity, in a post-pandemic, post-Brexit world, motivates the adoption of a range of possibilities here. At least until very recently, prevailing circumstances provided a more compelling motivation for favouring results towards the IO/SAM end of the spectrum. However, the combination of Brexit-induced supply chain issues in the construction sector and energy price rises serve to emphasise the potential importance of supply-side constraints.
Supply-side impacts of new social housing
The demand-induced, supply-side responses are adverse in that they act to moderate the effects of new expenditure of social housing on economic activity; there may also be positive supply-side effects associated with such investment. We discuss these effects and their possible scale next. We then present the results of the supply side simulations
McLennan et al. (2019) explore two major supply-side mechanisms, both of which reflect the fact their focus is on housing investments that brought occupants closer to local labour markets. One emphasises the impact of housing investment on travel to work costs and effective labour supply. The second focusses on the effect of housing investment on labour productivity through better job matching. While it is clear that the planned new Scottish investment in social housing is going to be concentrated in urban areas it is not clear that the same kind of improved spatial ‘access’ for both suppliers and demanders of labour will be a key feature. Furthermore, we do not have the data to facilitate Scottish-specific estimates of these effects. It is also worth noting that while the Australian study focusses essentially on the impact of households changing locations, here the emphasis is on providing housing for the homeless. 16
This emphasis on the homeless suggests alternative plausible routes through which the expenditures could stimulate the supply side of the economy – through increases in labour supply and labour productivity. While the same variables are impacted as in the Australian case, the transmission mechanisms are rather different.
The increase in labour supply
First, consider the possible impact on labour supply that would result from targeting the new social housing exclusively at the homeless. 17 The employment rate among homeless people is around 30% (Bramley et al., 2019), while among the general population it is around 75%. We know that moving from homelessness to being housed results in people being more likely to secure and to sustain employment (e.g. Bridge et al., 2003; Whelan and Ong, 2008). Thus, there is a plausible argument that building the houses and moving people into homes will lead to a rise in labour supply and in employment. There were 43,206 people in Scotland who were homeless (in 2018–19), of whom 14,043 were children. Assume the remaining 29,163 were of working age. Currently, around 8,750 of them are working. If we assume that when people are housed the employment rate among the previously homeless increases from ∼30% to 53% (i.e. halfway between 30% and 75%), this would add 6,708 to Scottish labour supply.
The impact of the new social housing on total labour supply.
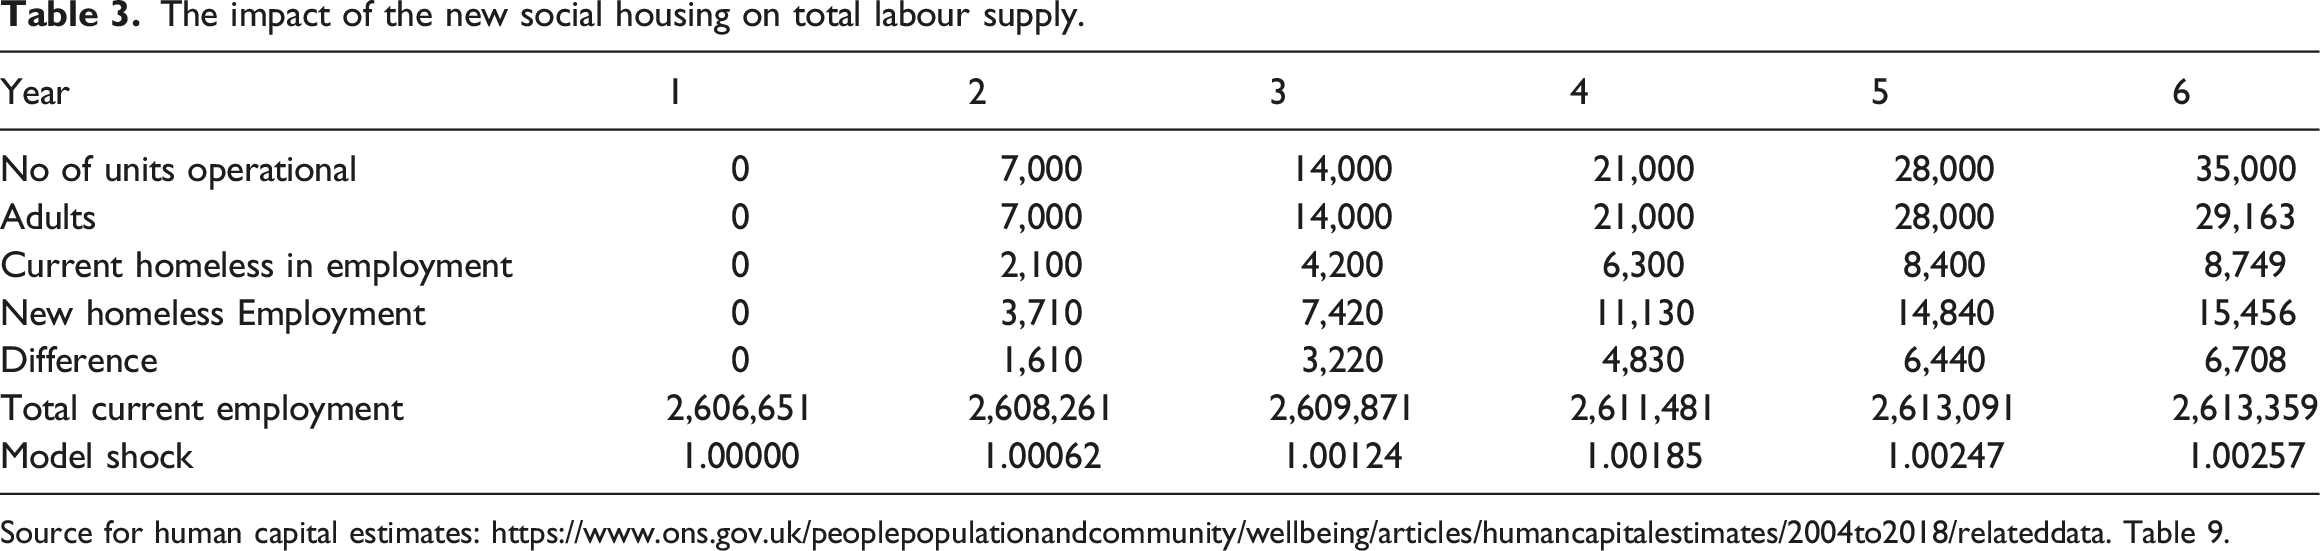
Source for human capital estimates: https://www.ons.gov.uk/peoplepopulationandcommunity/wellbeing/articles/humancapitalestimates/2004to2018/relateddata. Table 9.
As noted above, the impact on labour supply builds up to 6,708 FTE equivalents by year 6 (a 0.257% increase) and remains at that level for the lifetime of the new increment to the social housing stock. The time pattern of the shock applied to the CGE model is the percentage increased in labour supply implied by the final row of Table 3.
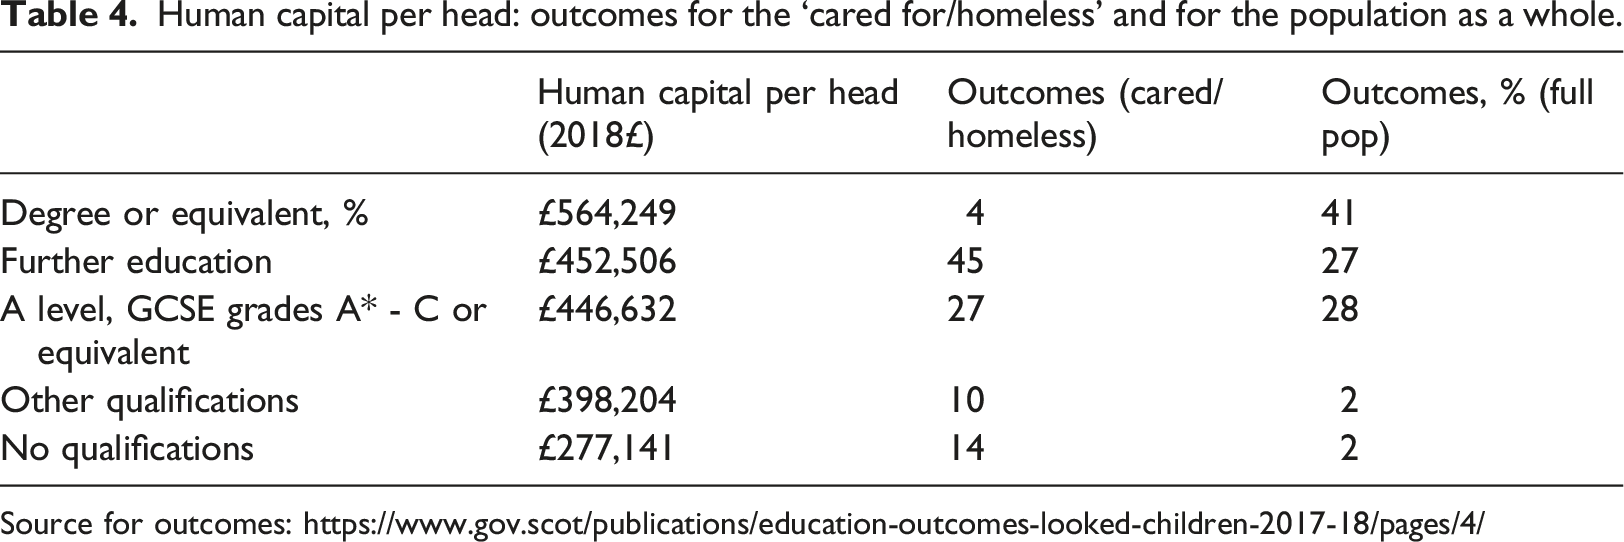
A rather widespread literature (albeit much of it based on US evidence) provides reason to believe that homelessness in childhood leads to adverse labour market outcomes in adulthood and that the main transmission mechanisms are through education and health. Furthermore, Scottish data on human capital, summarised in Table 3 are wholly consistent with this view (although do not, of course, establish causality).
Human capital per head: outcomes for the ‘cared for/homeless’ and for the population as a whole.
The stock of human capital: outcomes for the ‘cared for/homeless’, for the population as a whole and for the previously homeless (now in new social housing).
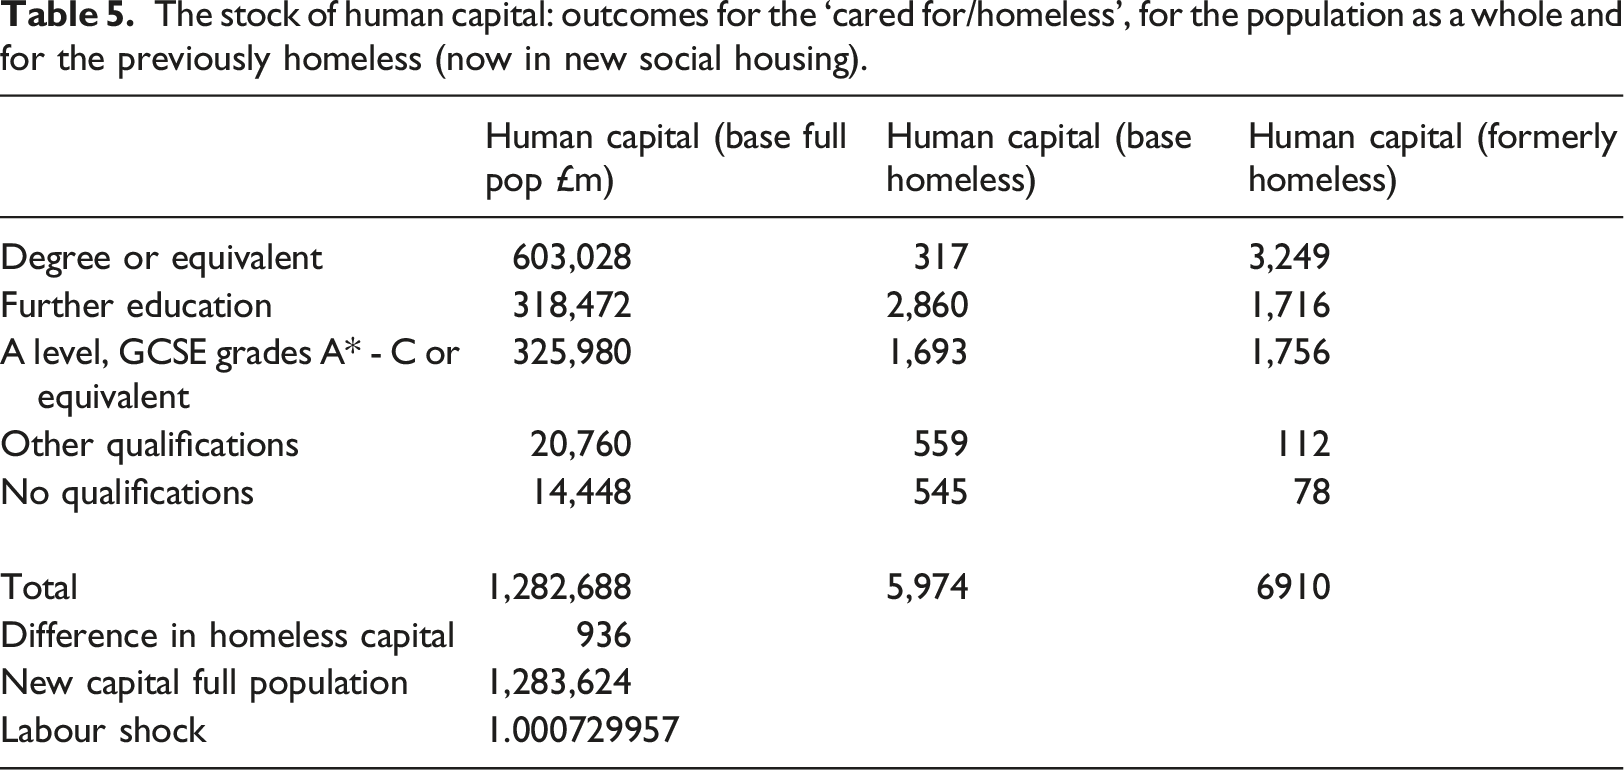
Our simulation results should be regarded as illustrative for a number of reasons. First, it should be noted that we are assuming quite a radical change in behaviour given that the homeless are often associated with multiple deprivation characteristics. The previously homeless are being assumed to exhibit a 15.6% increase in productivity. However, the fact that the impact on labour productivity in Scotland as a whole is very small simply reflects the small numbers of homeless relative to total employment. Second, we focus only on the steady state impacts, which would apply only when all the children were old enough to enter the workforce with the assumed distribution of qualifications
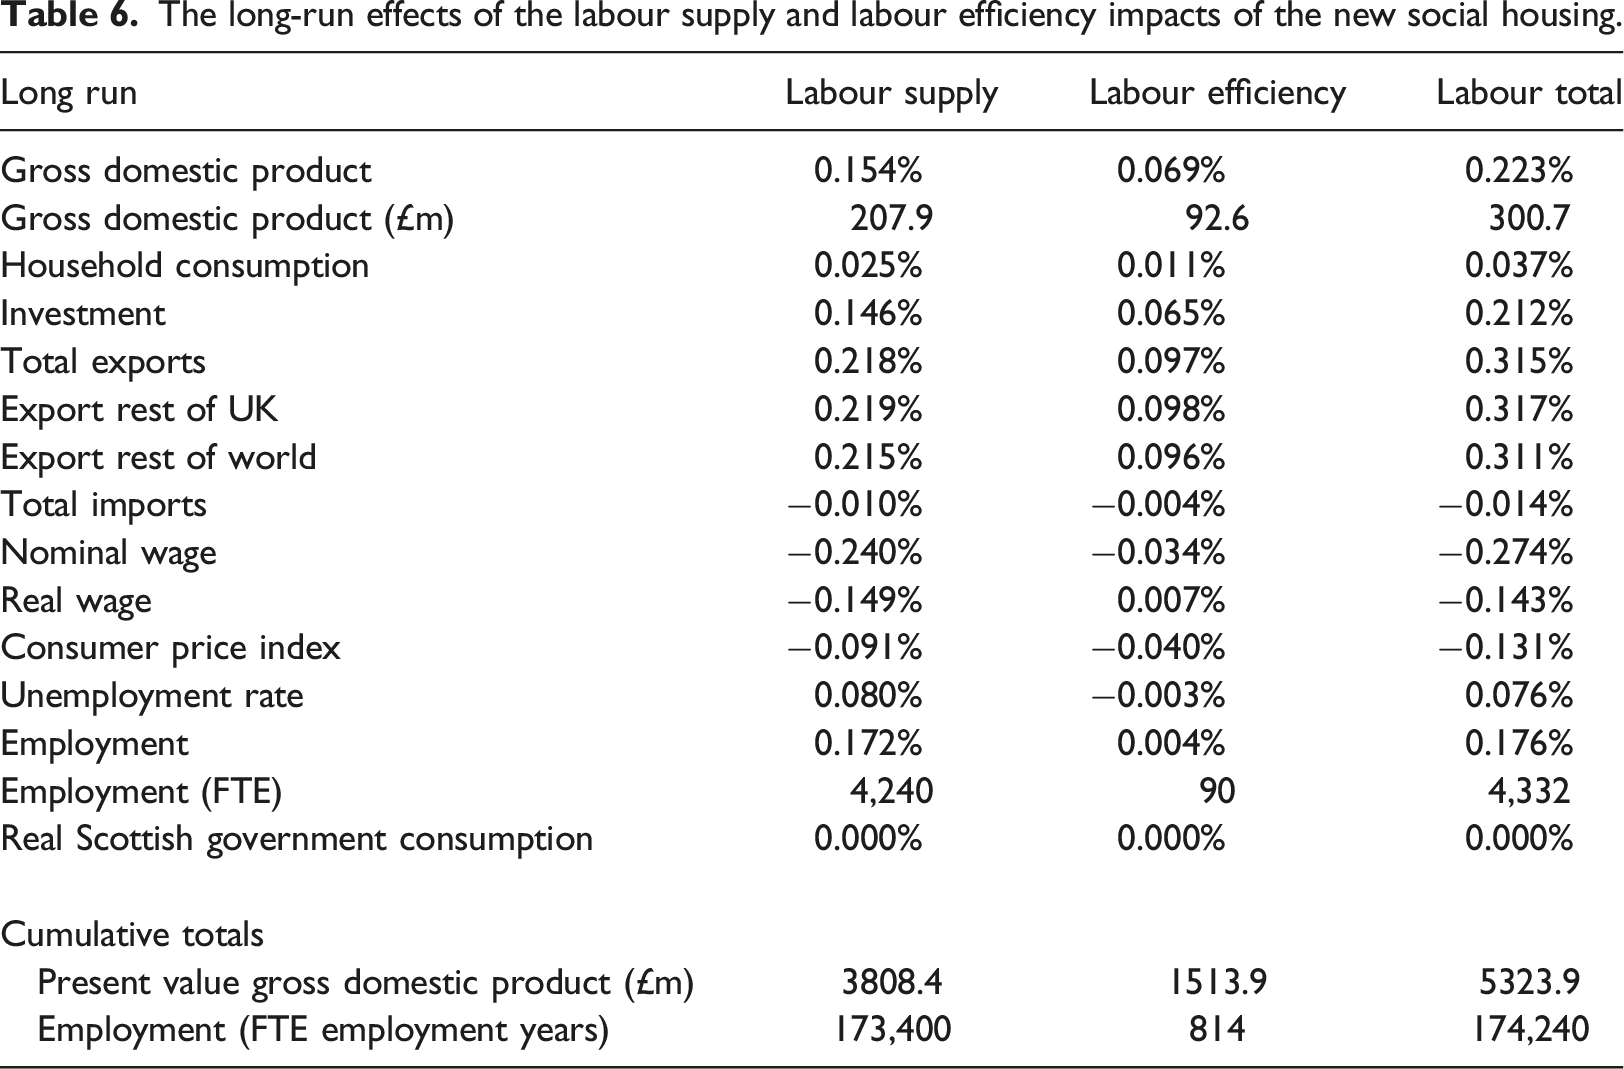
The long-run effects of the labour supply and labour efficiency impacts of the new social housing.
Of course, as is apparent from the final row of Table 3 the stimulus to labour supply builds up gradually and reaches a maximum during the fifth year of the programme and is then sustained. Naturally this pattern is reflected in the timing of the GDP and employment effects as is clear from Figure 1. Note, however, that the economic impacts of the increase in labour supply do not level off in year 6, when the shock reaches 0.26% (and is maintained at that level thereafter). At this point GDP is, at £135.3 million, some 65% of its long-run level of £207.9 million and employment is at 83% of its long-run level. It takes some time for the economy fully to respond to the labour supply stimulus. In particular, the stimulus leads to new investment and capital accumulation especially in those sectors impacted by improved competitiveness, and this adjustment process is protracted. GDP (£ million) and employment (full time equivalent) time path related to labour supply changes.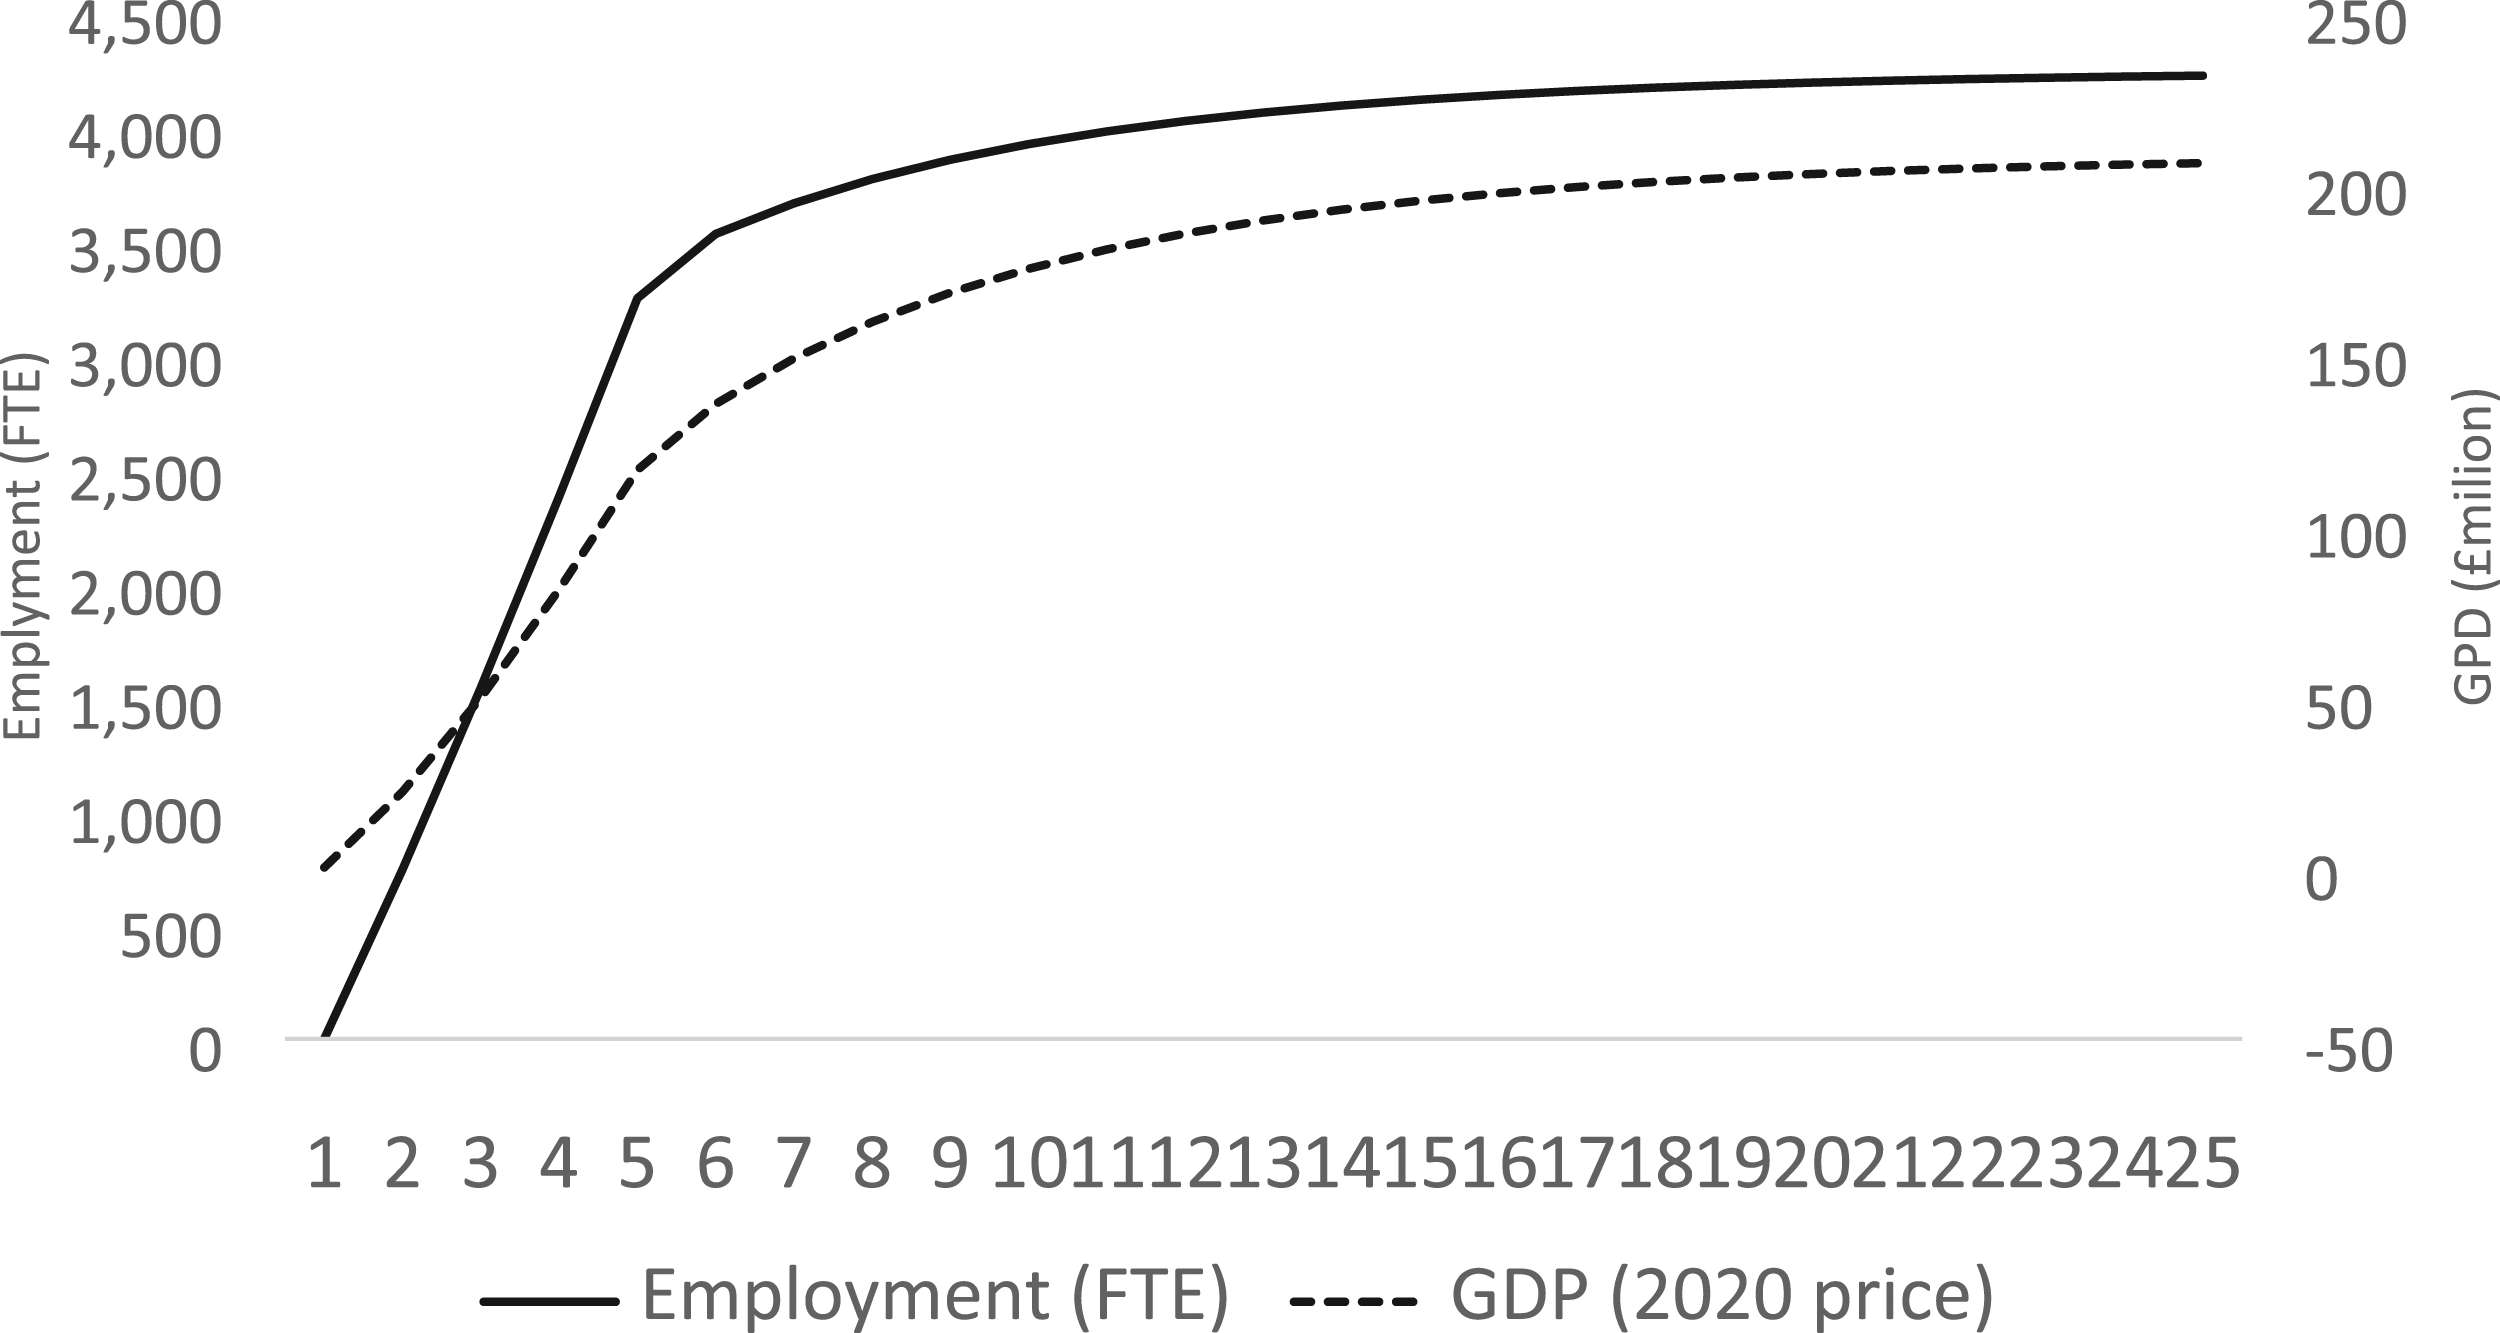
The ultimate impact of the productivity stimulus generated by providing housing for homeless children is summarised in the second column of Table 6. In effect the stimulus to labour productivity reduces the price of an efficiency unit of labour and so increases the demand for labour in efficiency units. This reduces production costs and prices, so that the CPI here falls by 0.04%, and the improvement in competitiveness boosts exports by 0.10% and reduces imports. GDP ultimately increases by 0.07% or £92.6 million, and employment by 0.004% or 90 FTEs.
Figure 2 shows the time path of the response to a permanent 0.07% increase in productivity, which starts once the new capital stock is in place. Of course, this is not an attempt to capture the timing of the impacts of the productivity stimulus accurately but is presented here simply to emphasise the nature of the employment response. Initially, employment actually falls in response to the productivity stimulus, reflecting that fact that less labour is now required to produce the same output. However, over time the competitiveness effects tend to stimulate employment and, as we have seen, this eventually increases. This reflects the fact that the responsiveness of labour demand to the real wage increases through time as capacity constraints relax and output (and employment) are able to expand further. In practice the adjustment paths are likely to be significantly more complex and subject to a much more gradual build up reflecting the age distribution of the initially homeless children and the extent of their investment in human capital. GDP and employment time path related to productivity changes.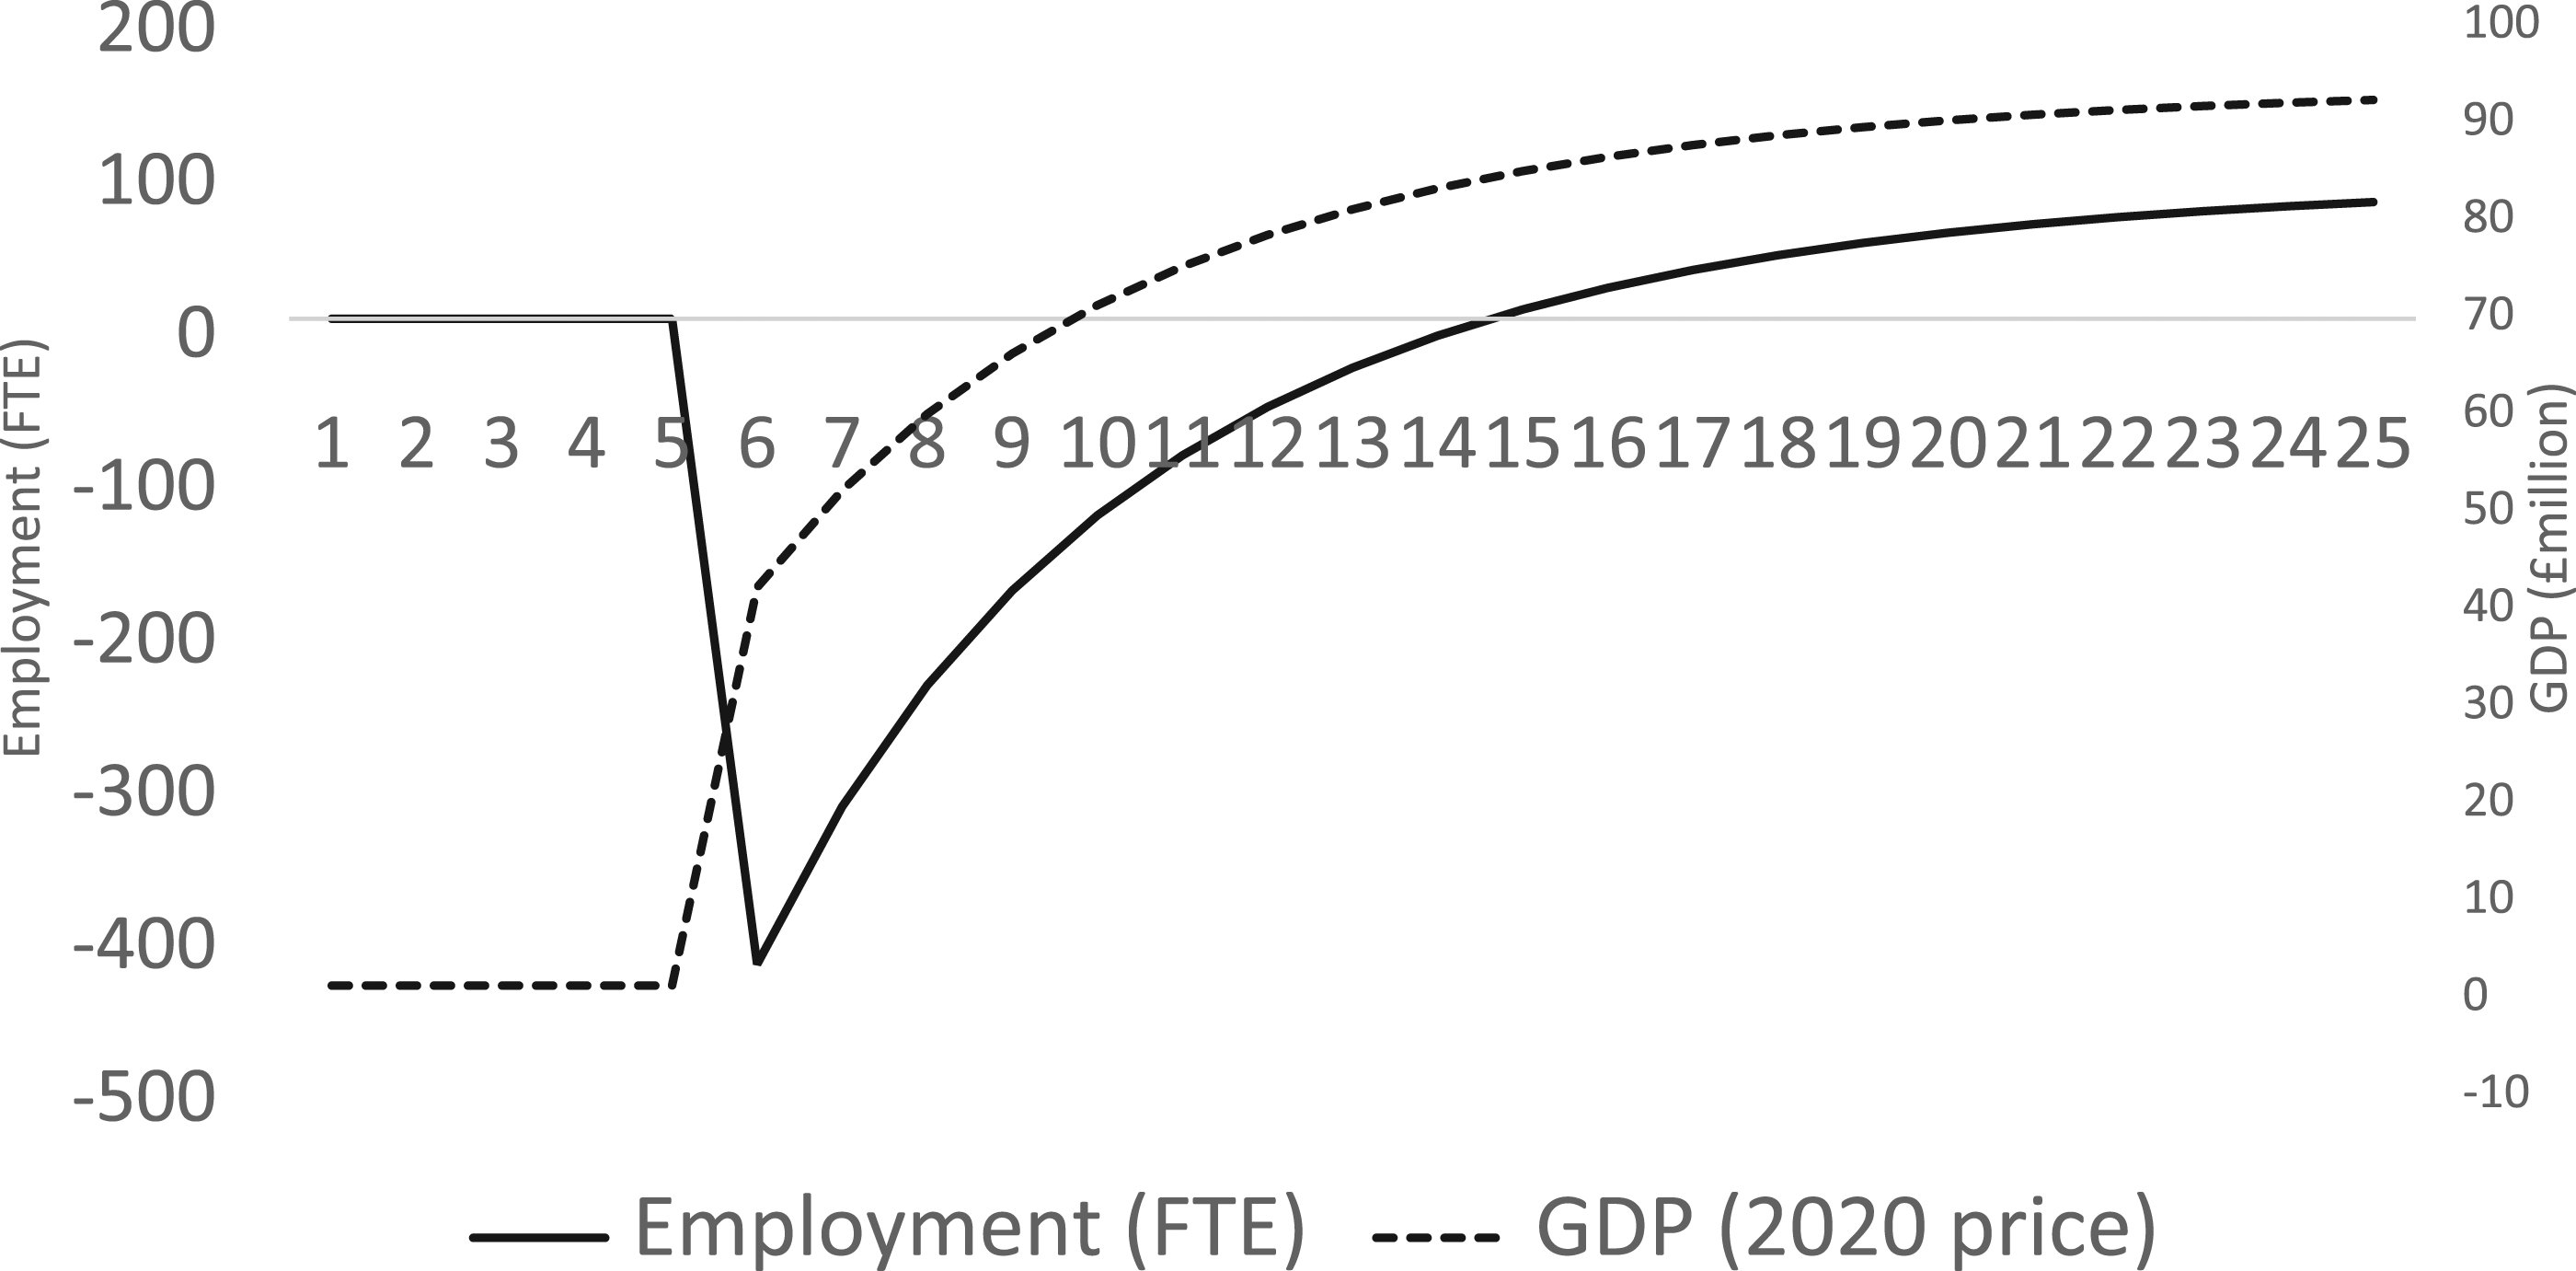
The final column of Table 6 aggregates the long-run impacts of the labour supply and labour productivity stimuli. Of course, since the increase in labour supply has an impact on GDP and employment, for example, that is more than double that of productivity, the pattern of the aggregate results reflects that. For example, the unemployment rate increases. Overall, GDP increases by 0.22% (£300.7 million) and employment by 0.18% (4,332 FTEs).
Note that the final row of Table 6 reports the Present Value (PV) of GDP for each of the simulations and for their combined effect. The PV of GDP associated with the labour supply stimulus is over 2.5 times that generated by the productivity stimulus, on the assumption that the time path was the hypothetical one depicted in Figure 2. Since in practice many of the productivity effects would not arise until later, in some cases much later, than is assumed in Figure 2, the gap between the PV of GDP in the two cases is in fact likely to be significantly greater still.
Conclusions
The policy case for investment in social housing, and housing generally, has typically been based around social and merit good arguments. Where assessments of the economic effects have been carried out they have typically been based on conventional economic impact analyses that focus solely on the effect of housing investment expenditures on demand. The best of these studies have been based on input–output (IO) models. However, such assessments are known to be subject to limitations including the assumption of an entirely passive supply side and the neglect of the opportunity cost of such projects. 18 The concern is that these limitations may be seen as weakening the policy case for expenditure on housing, giving rise to ‘policy scepticism’ around the likely economic impacts of housing investments and their capacity to contribute to levelling up.
However, the economic case for investment in housing is by no means limited to its demand-side impacts. As Maclennan et al. (e.g. 2019) argue there is a compelling case for viewing housing projects in a similar way to investment in infrastructure: there may be important supply-side stimuli resulting, for example, from improving the spatial matching of workers and firms, increasing both the supply of labour and its productivity. Clearly, neglecting such impacts may lead to serious underestimation of the benefits of housing investment.
We provide a systematic analysis of both demand and potential supply-side impacts using the example of a proposed investment in social housing in Scotland. We provide a thorough conventional impact study of social housing but seek to address its weaknesses by explicitly incorporating supply-side responses and impacts and by tackling the opportunity cost issue directly. Not surprisingly, we find that accommodating opportunity costs reduces estimates of the demand-side stimulus arising from investment in social housing. Furthermore, as expected, the presence of supply-side constraints further weakens the impact of any given stimulus to demand on output and employment. However, we also find that even modest – and plausible – links from social housing to labour supply and labour productivity can have important overall economic impacts over the long-term that may outweigh any demand effects in large part due to the persistence of the former and the transitory nature of much of the latter.
Overall, while a degree of scepticism around the scale of the expenditure impacts of affordable housing may be merited, it would be inappropriate to assume these are negligible in general. Furthermore, the supply-side impacts of social housing expenditure really do matter, both in governing the likely responses to the associated demand stimulus, and in providing lasting stimuli through labour supply and productivity enhancements. Furthermore, recognition and measurement of such effects is potentially critical for policy in that this frees the economic case for social housing from dependence upon the credibility of conventional impact assessments. Investment in affordable housing should be regarded as an important element of the levelling up agenda, comparable to the Government’s emphasis on infrastructure.
While our analysis represents a significant extension of previous impact studies, more remains to be done to improve our understanding of the impact of social housing on the key levelling up objectives of economic prosperity and wellbeing. First, it would be useful to incorporate more explicit modelling of housing markets within the modelling frameworks. Second, there is considerable scope for improving both the identification and measurement of potential supply-side impacts. Third, the approach could be extended to the multi-region case, which would allow the modelling of cities and their host regional economies to capture explicitly the spatial dimension emphasised by McLennan et al. (2019). Finally, there is a need to explore the wider impacts of affordable housing, including spillover effects on the price of other housing, equity, crime and racial diversity.
Footnotes
Acknowledgements
The authors gratefully acknowledge the helpful comments of two anonymous Referees on an earlier draft. This is an independent study conducted by the Fraser of Allander Institute, funded by Shelter Scotland.
Declaration of Conflicting Interests
The author(s) declared no potential conflicts of interest with respect to the research, authorship, and/or publication of this article.
Funding
The author(s) disclosed receipt of the following financial support for the research, authorship, and/or publication of this article: This work was supported by Shelter Scotland.