
Abstract
Objective
To comparatively evaluate performances of tablet-based versus paper-based Venous Insufficiency Epidemiologic and Economic Study-Quality of Life/Symptom (VEINES-QOL/Sym) questionnaire.
Methods
We prospectively evaluated 78 consecutive patients who completed tablet-based and paper-based VEINES-QOL/Sym questionnaires and compared their scores, completion time, data entry time, and ease of use. We used Student’s t-test and Wilcoxon test for quantitative variables, Bland–Altman test and kappa coefficient for agreement between questionnaires and patients, respectively. Spearman’s correlation coefficient was used to assess correlations.
Results
Most participants (83.3%) found it easier to use the tablet device. Less time was needed to complete the tablet-based (median, 4.75; IQR, 3–7 min) than the paper-based (median, 8.3; IQR, 6.3–11.3 min) questionnaire (p < .001). Better educated patients took less time to complete paper-based (p = .003) and tablet-based (p = .001) questionnaires and considered the latter easier to use (p = .010).
Conclusions
The tablet-based VEINES-QOL/Sym proved to be an easy-to-use and time-saving tool.
Introduction
Chronic venous disease (CVD), encompassing the full spectrum represented by the clinical, etiologic, anatomical, and pathophysiological (CEAP) classification of signs and symptoms, 1 is one of the most prevalent disorders worldwide. In the United States, about 23% of adults have varicose veins, with 6% presenting more advanced disease that includes skin changes and healed or active venous ulcers.2,3 Around the world, studies have reported an overall prevalence of CVD as high as 61.3% (C1–C6) in Belgium and Luxembourg, 4 69% in Russia, 5 and over 80% worldwide. 6
Recent advances have focused on prophylactic and therapeutic strategies in phlebology leading to the development of several guidelines.2,7,8 However, the actual contribution of these advances can only be established if their outcomes are measured. Regardless of the clinical spectrum of CVD, outcomes can be measured by either the physician or the patient. In the first case, the patient is classified according to predetermined criteria, such as those proposed in the Comprehensive Classification System for Chronic Venous Disorders, 9 or assigned a venous clinical severity score. 10 To that end, physicians answer questions based on their clinical observation and interpretation. In the second case, without physician involvement, the patient is asked to report the impact of treatment or any other intervention received by completing a quality of life (QOL) questionnaire. In both cases, variations in scores measured before and after a given intervention reflect the impact of the intervention from the respondent’s perspective.
The ultimate goal of any intervention should be to improve a patient’s function, symptoms, QOL, or survival. 11 In this context, the ability to accurately measure QOL is an area of particular interest for both public and private health care providers because this is needed to more comprehensively evaluate patient outcomes and burden of illness.12–15 Traditional methods of QOL assessment include data collection through self-completion of paper-based questionnaires, 16 which requires additional time and effort to manually enter data into digital spreadsheets—being highly impractical and difficult to implement in the clinical setting. 15 Therefore, the introduction of digital questionnaires has been an important improvement.
Using an online Aberdeen Varicose Vein Questionnaire (AVVQ), Ward et al. 17 considered it to be a valid and reliable method for assessing patients’ varicose veins and an acceptable and easy tool for patients to use. For QOL assessment, a disease-specific instrument should be used to evaluate patient-reported outcomes. Among the questionnaires that have been proposed to evaluate severity of CVD is the Venous Insufficiency Epidemiologic and Economic Study-Quality of Life/Symptom (VEINES-QOL/Sym), 18 which has been validated in many languages, including Brazilian Portuguese. 19
The VEINES-QOL/Sym questionnaire is usually administered in paper format. It consists of 26 items covering CVD symptoms (10 items), CVD-related limitations in daily activities (9 items), and psychological impact (5 items). The 2 remaining questions address changes in leg problems over 1 year (1 item) and time of day when leg problem is most intense (1 item).18,20 Although simple to administer, paper-based questionnaires entail several disadvantages, including the need for storage and to reenter data into digital files for analysis. 21 Their use also limits the knowledge regarding CVD-related QOL around the world as well as the inclusion of data in much needed CVD patient registries,12,13,22 which have become available in recent years. Tablet computers have become increasingly popular due to their convenience and mobility. These devices are generally intuitive to use even for individuals less familiar with computer technology, 21 thus providing a smooth migration path from paper-based to digital questionnaires.
The aim of the present study was to comparatively evaluate the performance of tablet-based versus paper-based VEINES-QOL/Sym questionnaires in a private practice setting.
Methods
This prospective, multi-center study included 4 private phlebology clinics from different Brazilian regions. At each study site, all consecutive patients who attended consultations were approached by the investigators, informed of the purpose of the study and invited to participate, being assured that participation was voluntary. Eligible participants were all adults aged ≥18 years and ≤75 years with varicose disease of the legs who were able to read and understand Brazilian Portuguese. Written informed consent was obtained from all individual participants prior to inclusion in the study and the study was approved by the appropriate ethics committee (HU-NH). Those who agreed to participate completed 2 versions (tablet-based and paper-based) of the VEINES-QOL/Sym questionnaire. Alternately, the first included patient would first complete the paper-based and then the tablet-based questionnaire; then the second patient would first complete the tablet-based and then the paper-based questionnaire, and so forth.
Sample size was calculated to detect a 35% difference in standard deviation (SD) between the mean scores obtained using tablet-based versus paper-based questionnaires and between the 4 participating centers, considering an alpha of 0.05 and 90% power. Based on these parameters, 54 patients would be required. Considering a rate of 10% of questionnaires excluded because of missing data, the sample size was defined as 60 patients.
Tablet-based VEINES–QOL/Sym questionnaire
The VEINES/QOL-Sym PRO (BR) application (IOS 1.0.2, version 2016) was developed for use on tablet computers. The general layout and content of the questionnaire was the same as that of the print version. For all questions, participants were instructed to touch their answer, which highlighted in response. At each item, participants were given the option to answer the question or skip it if they were unable to provide an answer. User input was validated with JavaScript upon submission of the questionnaire. The final score was automatically calculated by the tablet application.
Administration of questionnaires
Upon inclusion, data were collected from all participants on age, sex, and level of education. Both versions of the questionnaire were self-administered. At each clinic, a previously trained receptionist remained available for any necessary clarification while the participants were completing the questionnaires. The time taken by each participant to complete the paper-based questionnaire was recorded in minutes by the receptionist, and automatically upon submission of the tablet-based questionnaire.
During completion of the tablet-based questionnaire, patients were assisted by the receptionist if necessary. Basic assistance was limited to verbal instructions (e.g., explanation on how to use the tablet device), while technical assistance required physical intervention (e.g., demonstration of how to manage the tablet device). Clinimetric data and perceived ease of use were assessed by the investigators at the end of the task. Ease of use was measured by asking participants to rate their overall experience with the tablet-based questionnaire as easy, moderate, or difficult. Investigators also rated their perceptions of the users’ experience as easy, moderate, or difficult.
Data obtained from paper-based questionnaires were entered into a Microsoft Excel® spreadsheet, while data obtained from tablet-based questionnaires were exported to Microsoft Excel® format. The databases from all participating centers were combined and analyzed at the coordinating center (LFA).
Statistical analysis
All data were entered into Microsoft Excel® spreadsheets, which were exported to SPSS version 18.0 (SPSS Inc., Chicago, IL, USA) for statistical analysis. Categorical variables were described as frequencies and percentages. Quantitative variables were expressed as mean and SD if symmetrically distributed, or as median and interquartile range (IQR) if asymmetrically distributed. Quantitative variables were compared using a paired Student’s t-test if symmetric or a Wilcoxon signed-rank test if asymmetric. Bland–Altman analysis was used to assess agreement between VEINES-QOL and VEINES-Sym scores obtained from tablet-based and paper-based questionnaires. To assess agreement between patients and investigators regarding ease of use, a kappa coefficient was calculated. Spearman’s correlation coefficient was used to assess correlations. Statistical significance level was set at 5%.
Results
The questionnaires were completed by 78 patients, 70% female and 30% male. Mean patient age was 46 (SD, 15) years. Of the 53 patients who reported educational data, 8 (15.1%) completed primary school, 26 (49.1%) completed high school, 17 (32.1%) had a college degree, and 2 (3.8%) had a graduate degree.
The median time to complete the paper-based questionnaire was 8.3 (IQR, 6.3 to 11.3) minutes, and the median time to complete the tablet-based questionnaire was 4.75 (IQR, 3 to 7) minutes. Therefore, tablet time was lower than paper time, and the difference was statistically significant (p < .001).
Twenty-seven (34.6%) patients needed assistance. Of these, 21 (77.8%) needed basic assistance, 5 (18.5%) needed technical assistance, and 1 (3.7%) needed both.
Regarding ease of use, 65 (83.3%) patients perceived it as easy, 10 (12.8%) as moderate, and 3 (3.8%) as difficult. The investigators, in turn, reported that for 56 (71.8%) patients they perceived it was easy, for 17 (21.8%) it was moderate, and for 5 (6.4%) it was difficult. In 64 (82.1%) cases, there was agreement between patient and investigator (k = 0.52; p < .001), demonstrating a moderate agreement (Figure 1). Patients’ and investigators’ perceptions of the degree of difficulty in answering the questionnaire using the tablet. Dark gray = easy; medium gray = moderate; light gray = difficult.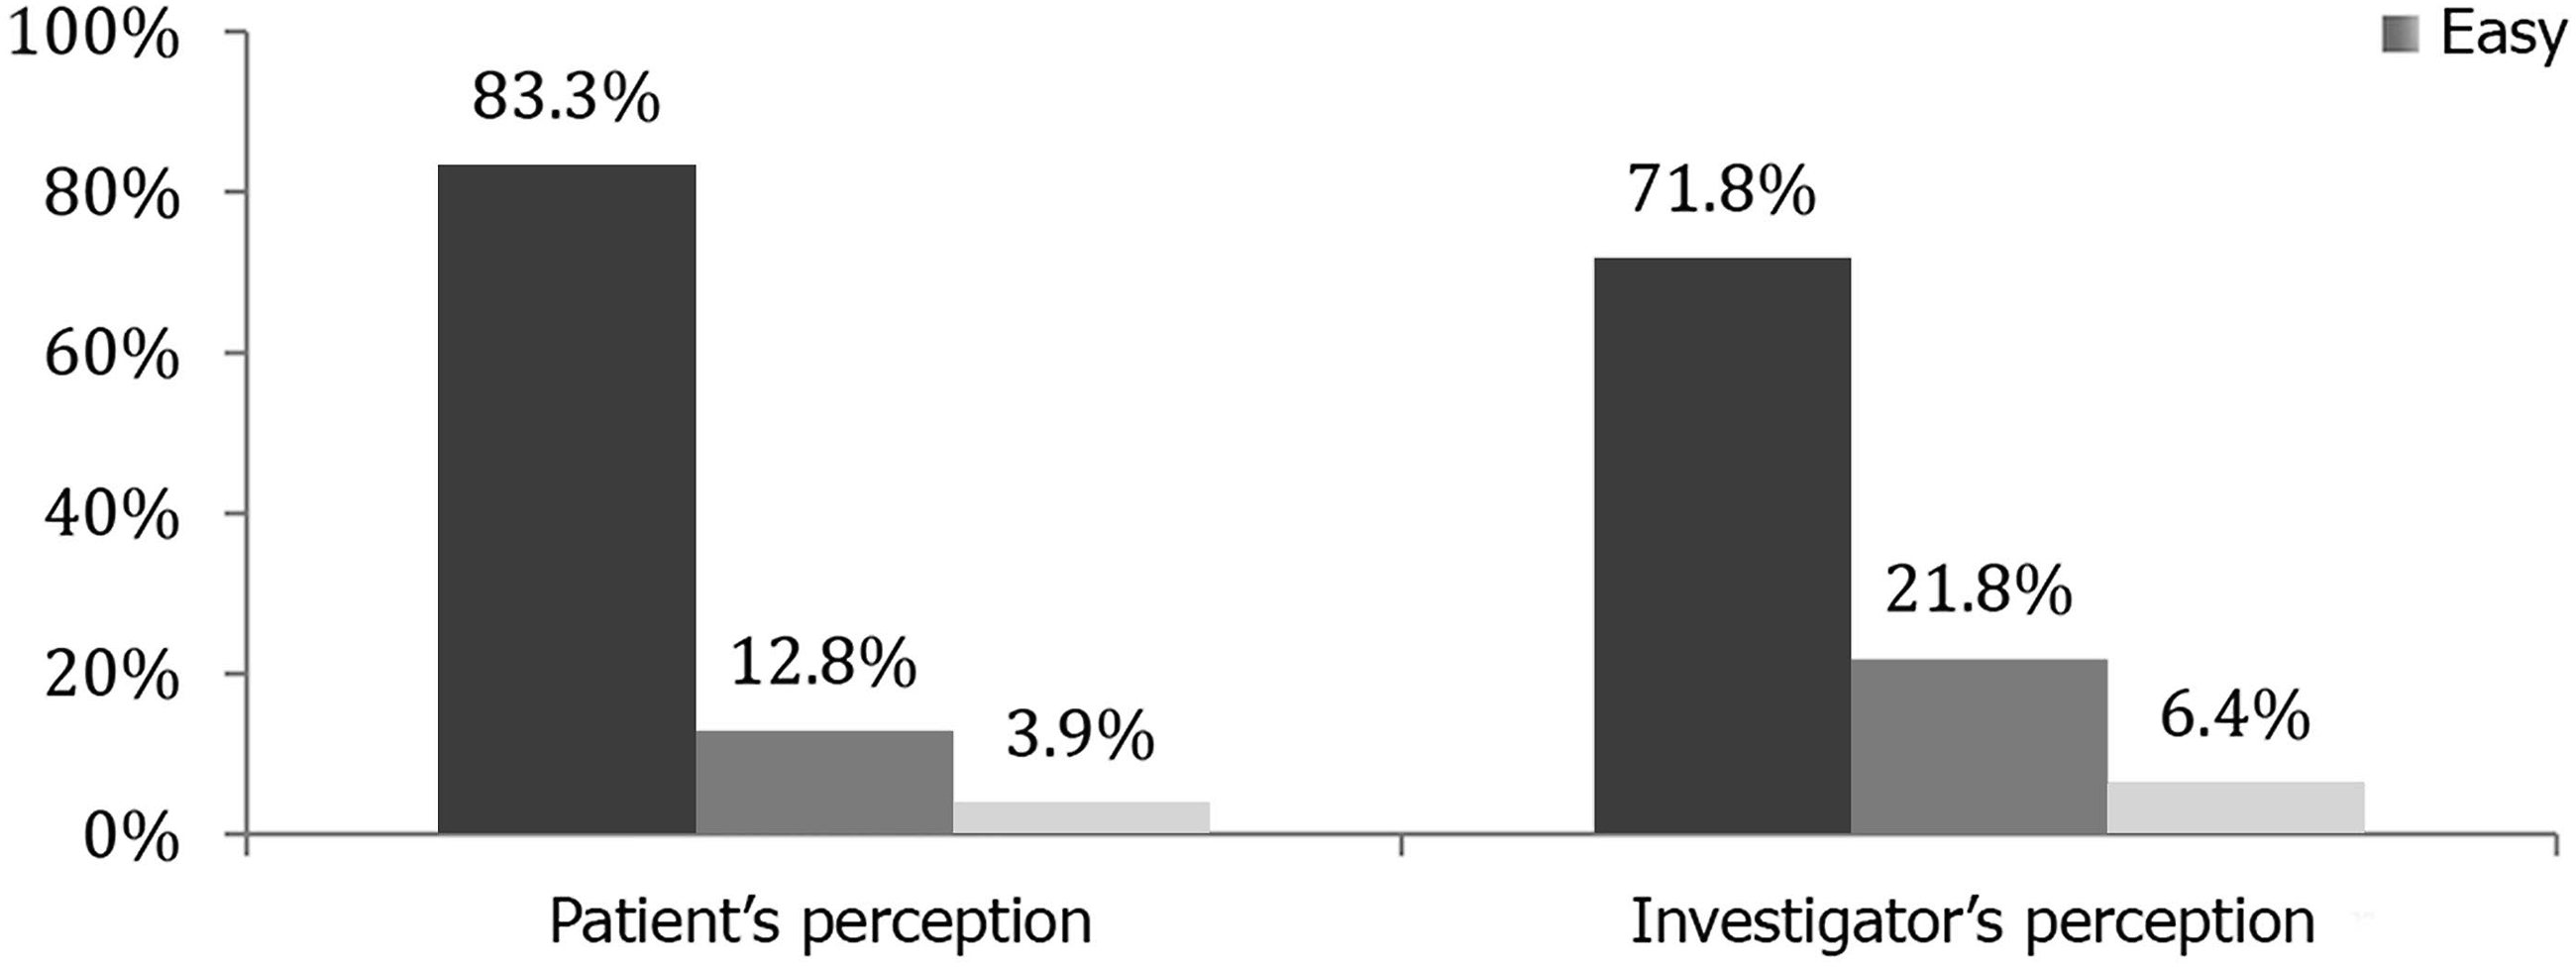
There were moderate, inverse, statistically significant correlations between education and time to complete both paper-based and tablet-based questionnaires. Spearman’s correlation coefficient between education and time was −0.41 (p = .003) in the paper instrument and −0.46 (p = .001) in the tablet device. Better educated participants took less time to complete the questionnaires, and the relationship between these variables was moderate. There was also a moderate, inverse, statistically significant correlation between education and patient's perceived ease of use; better educated patients considered it easier to use the tablet device while less educated patients found it more difficult (rs: −0.35, p = .010).
Comparison of scores obtained in tablet-based versus paper-based venous insufficiency epidemiologic and economic study-quality of life/symptom (VEINES-QOL/Sym) questionnaires.

Data are reported as mean ± standard deviation and were compared using a paired Student’s t-test.
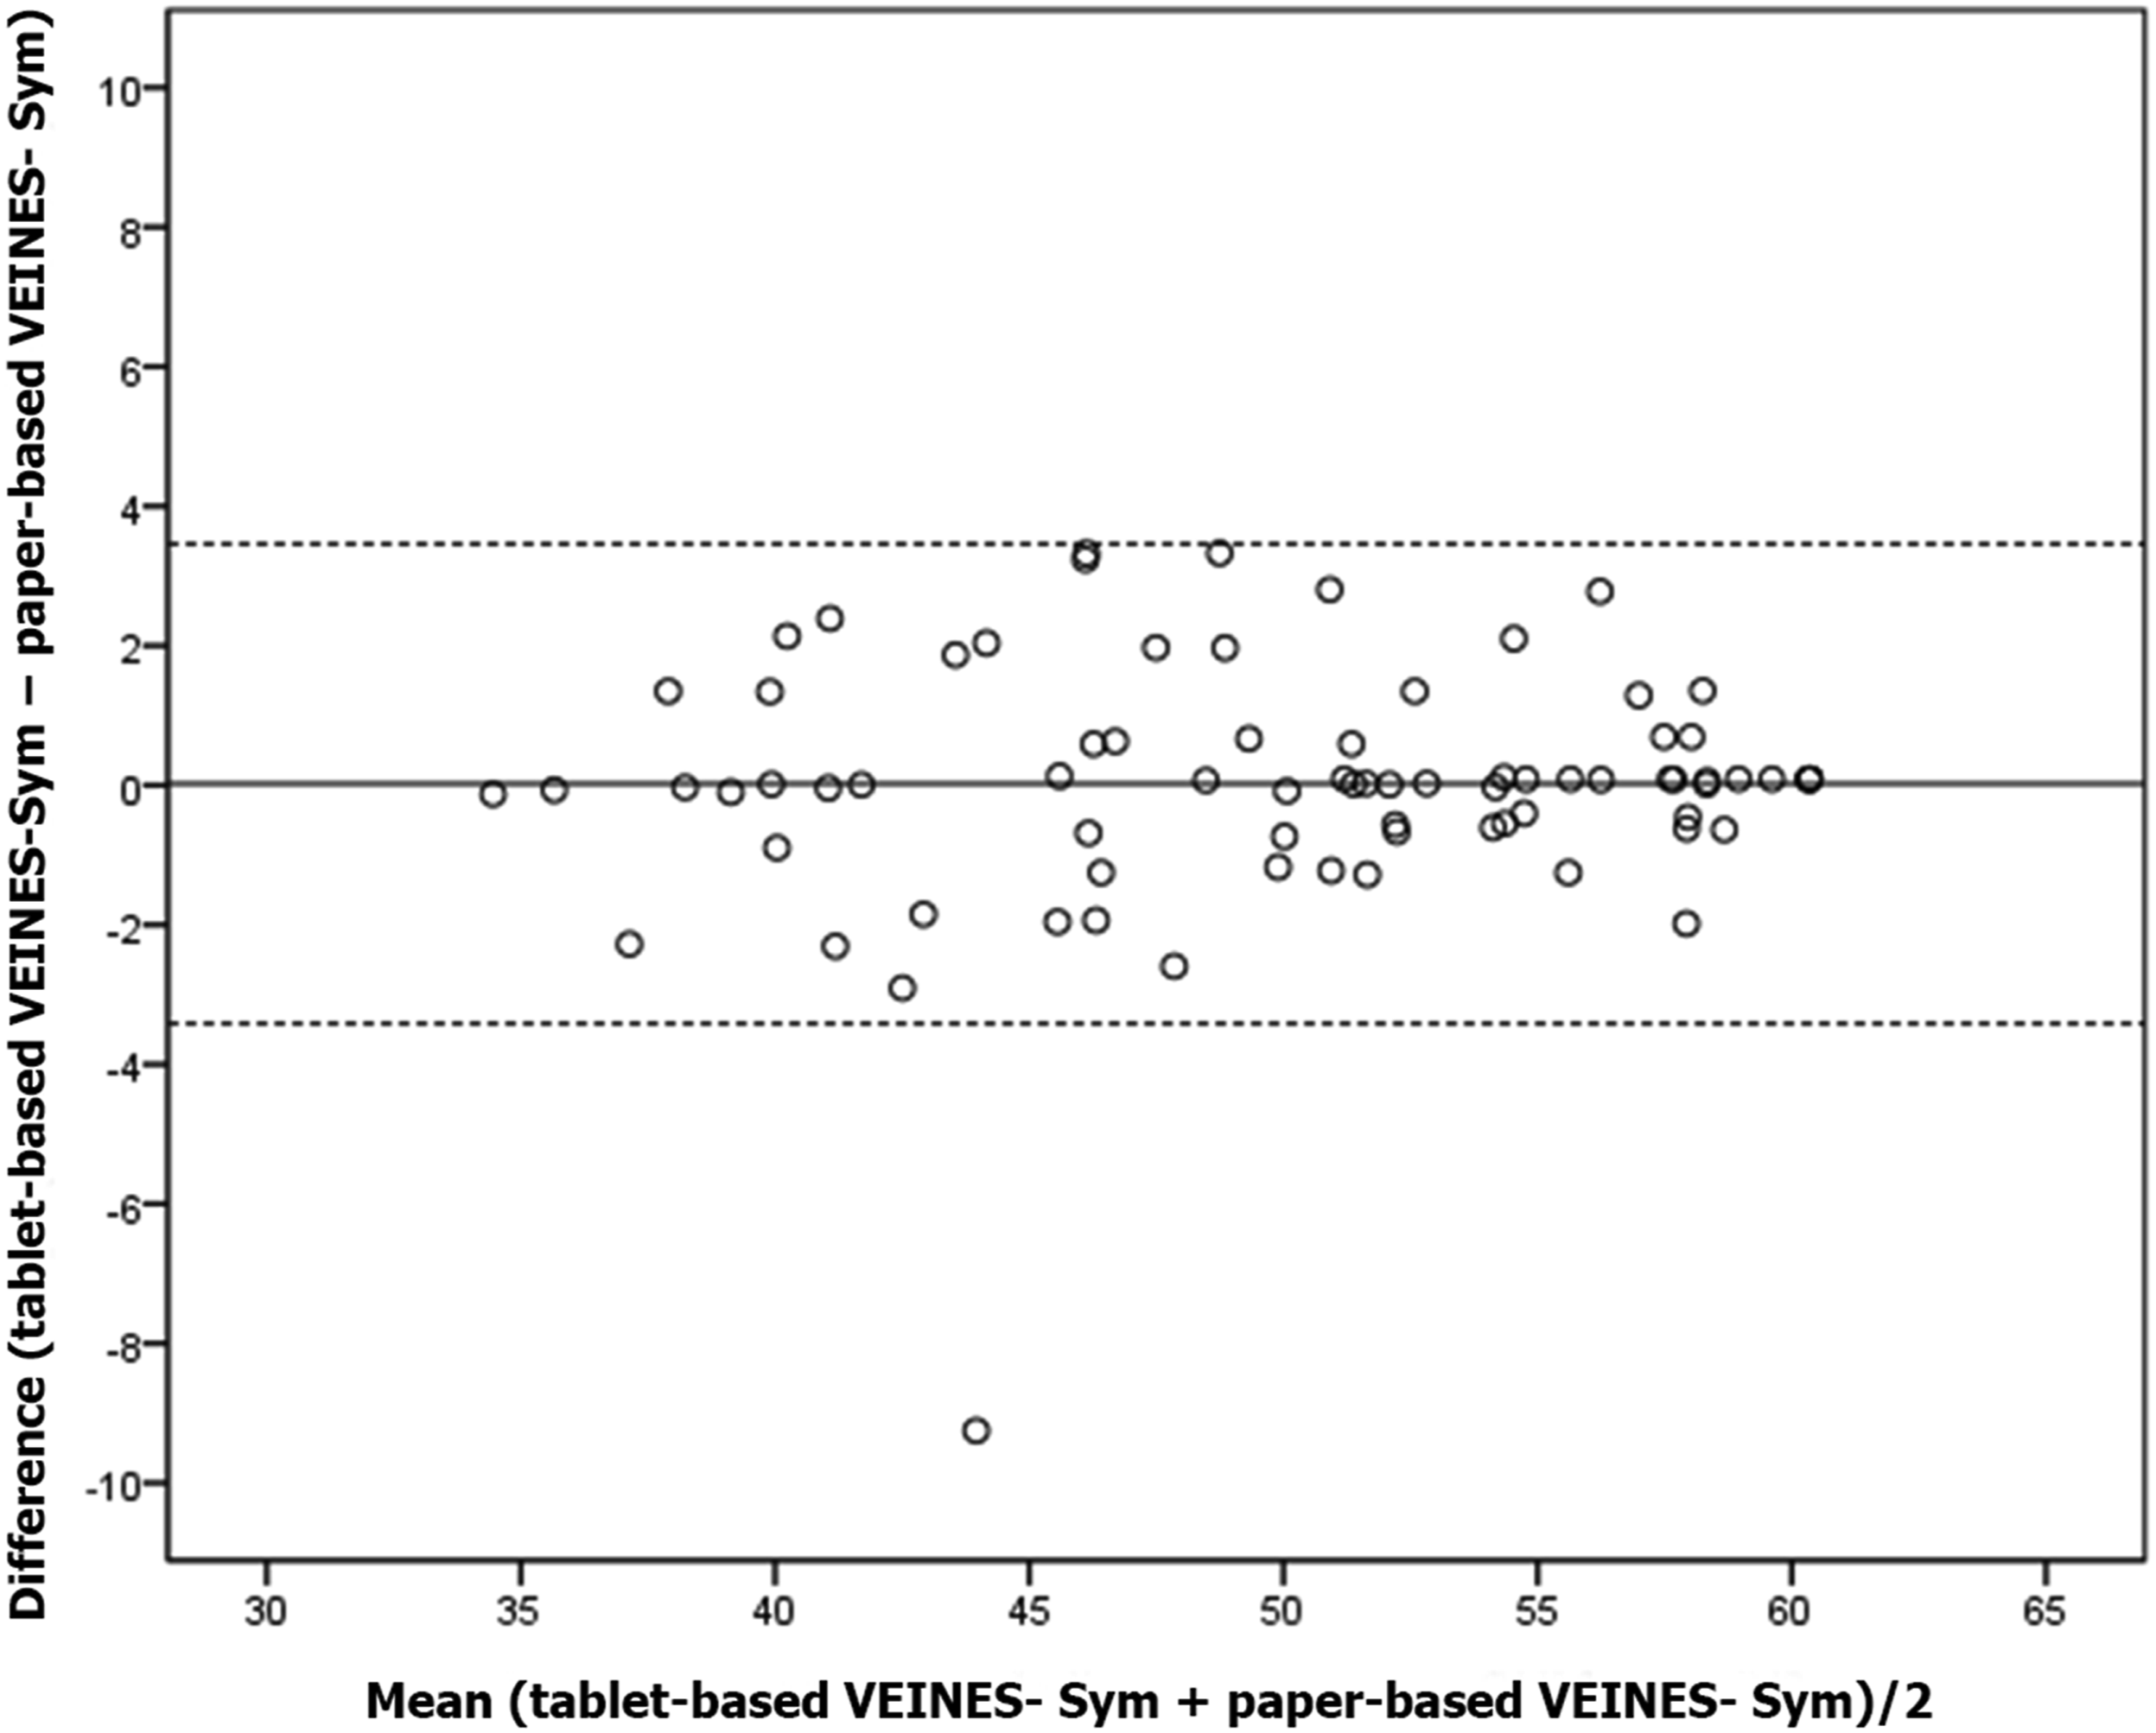
Regarding the 95% agreement interval for VEINES-QOL, in 95% of times tablet and paper scores disagreed from −2.82 (lower limit) to 3.06 (upper limit) (Figure 2). For VEINES-Sym scores, agreement ranged from −3.42 (lower limit) to 3.46 (upper limit) in 95% of times (Figure 3). 95% agreement interval for VEINES-QOL scores. 95% agreement interval for VEINES-Sym scores.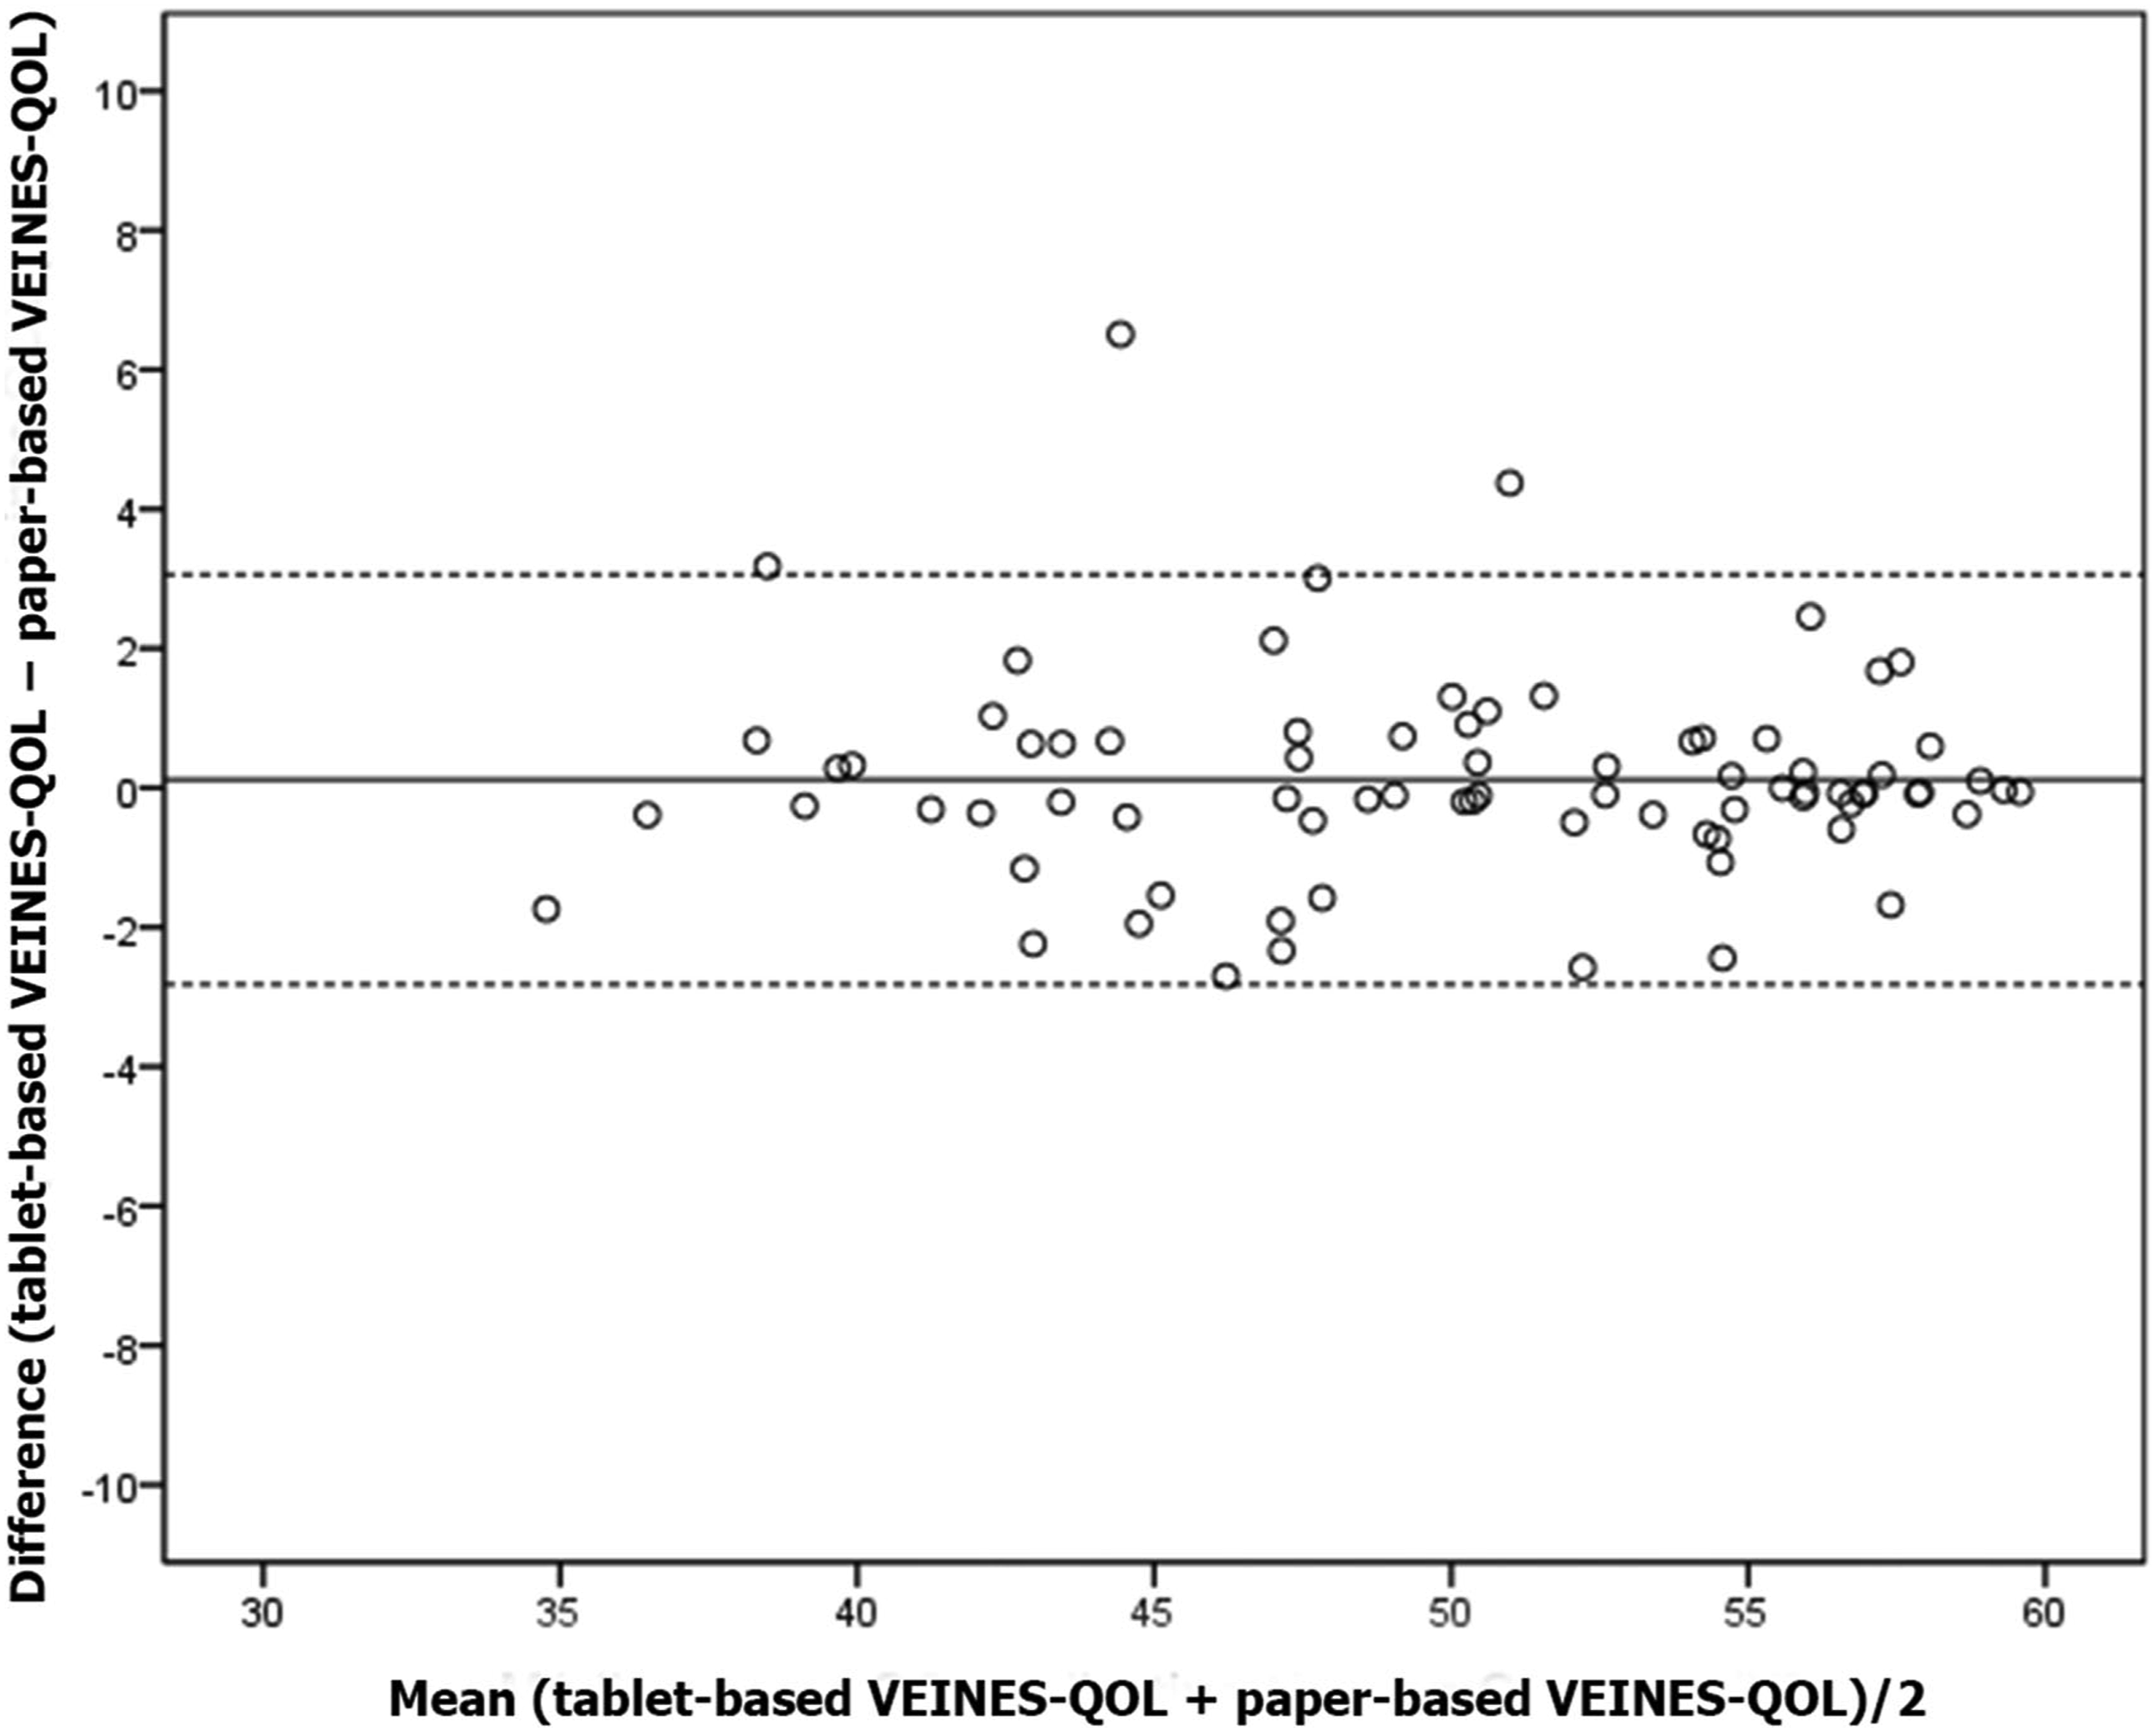
Discussion
Measurement of health outcomes has become a requirement in modern times. The small steps of science contrast with the fast speed of development of new interventions for CVD, including drugs, technologies, and guidelines. As the variety of treatments and technologies grows, there is a need to compare outcomes and, therefore, to measure them. The idea of obtaining a score based on patient-reported outcomes provides reliability to the measurement tool because the opinion of the physician is not required to calculate the score. Our results indicated that the tablet-based VEINES-QOL/Sym questionnaire was considered faster and easier to use by patients than the paper-based questionnaire, with similar scale scores for digital and print versions.
There are several generic and disease-specific questionnaires available in the literature; however, 2 questions deserve special attention: (1) which questionnaire to use? and (2) what is the limit of its applicability? The decision about which questionnaire to use should be based on the investigator's needs. Whether the aim is to evaluate a population with a given disease at a specific time or to follow a population over time, this will influence the decision. Also, some questionnaires have been developed for evaluating specific diseases such as ulcers or deep vein thrombosis,23,24 while others encompass a higher spectrum of diseases.25–27
The VEINES-QOL/Sym focuses on following a patient population with a given CVD, such as post-thrombotic syndrome. The questionnaire is divided into VEINES-QOL and VEINES-Sym. The former consists of 25 items and provides an estimate of impact of the chronic disease on QOL. The latter consists of 10 items and measures severity of symptoms. This includes 9 venous symptoms (heavy legs, aching legs, swelling, night cramps, heat or burning sensation, restless legs, throbbing, itching, tingling sensation), rated on a 5-point Likert scale of frequency (every day, several times a week, about once a week, less than once a week, never), and leg pain rated on a 6-point scale of intensity (very severe, severe, moderate, mild, very mild, none). Score calculation is not based on a simple sum that would measure patient-reported outcomes over time, but rather on mean z-scores, which statistically measure patients' QOL considering their specific group. Raw scores are first converted to z-score equivalents (mean, 0; SD, 1), which are then converted to T-scores (mean, 50; SD, 10) to provide an easily understood range of scores. Scores for missing data are imputed using the same algorithm recommended for scoring the SF-36.18,26,28 A person-specific estimate is imputed for any missing item in cases where the patient answered >50% of the items in the scale. An advantage of the tablet version of the questionnaire is that the application automatically calculates the final score. In summary, VEINES-QOL/Sym is a practical, reliable, valid, and responsive measure of QOL and symptoms in patients with CVD. Clinical trials and epidemiological studies of patients with CVD now use this measure to conduct a more comprehensive evaluation of patient outcomes and burden of illness. 24
The second question addresses the limitations of using questionnaires as measurement tools. Despite the usefulness of these tools in medical practice, their application has been mostly limited to the field of research. There are initial reports of their use as population-based epidemiological measures 13 as well as population monitoring tools in health care systems. 29 However, there are few studies reporting the use of these questionnaires to measure and compare treatment outcomes or therapeutic choices in private practice. 15 The study of patient populations with chronic diseases in private settings would allow, for instance, retesting and measuring symptoms by the VEINES-Sym, which could become not only a simple clinical measure, but actually a private outcome management tool.
Paper-based instruments have been considered a complicating factor because both questionnaire completion and data entry are slow processes. Recently, there have been attempts to promote the use of digital devices,17,18,21 which could maximize the potential of questionnaires as time-saving and practical tools.
The present study found statistically significant differences in time for completion/data entry between tablet-based and paper-based questionnaires. Regarding 95% agreement intervals, the results obtained were expected in this sample and are no limiting factor for the use of tablet devices. Patients were asked to complete the questionnaires while they were in the waiting room at the study centers. Physicians were intentionally absent at this moment, and any tablet-related question was addressed by a receptionist. Simple verbal answers were considered basic assistance, whereas a physical intervention by the receptionist was defined as technical assistance. Assistance provided by accompanying persons was dismissed. The need for assistance observed in 34% of patients contrasts with the evaluation of ease of use, as 83% considered it easy. Physical intervention was required by a small number of patients and was not a limiting factor in relation to answers. Education was inversely related to questionnaire completion time and perceived ease of use; therefore, considering that 15% of patients had only primary education, the degree of difficulty was low. The maximum time of 7 min for completing the tablet-based questionnaire led to the conclusion that time spent on technical assistance was not a limiting factor for the practical purpose of the study.
The results of the present study indicated that the tablet-based VEINES-QOL/Sym proved to be an easy-to-use tool, which offered practical advantages in terms of time saving to both researcher and participant and more efficient data collection. In addition, the quantitative results could be added to the constant search for evidence in both private and public clinical practice.
Footnotes
Acknowledgements
Daniela Benzano provided support with statistical analysis, Veridiana Fraga and Claudia Buchweitz and her team at Scientific Linguagem provided editorial support.
Declaration of conflicting interests
The author(s) declared the following potential conflicts of interest with respect to the research, authorship, and/or publication of this article: The first author is the developer of the Veines application. The application is not available for purchase, but it may be made available from the author upon request.
Funding
The author(s) received no financial support for the research, authorship, and/or publication of this article.
Ethical statement
Guarantor
LFA.
Contributorship
LFA researched literature and conceived the study. LFA, FS, DA, and FZ was involved in protocol development, gaining ethical approval. LFA, FS,DA,FZ, ARS, and GB patient recruitment and data analysis. LFA wrote the first draft of the manuscript. RMFM and FS reviewed and edited the manuscript and WYC approved the final version of the manuscript. All authors have read and approved the final version of the article.