
Abstract
Monitoring the patient receiving veno-venous extracorporeal membrane oxygenation (VV ECMO) is challenging due to the complex physiological interplay between native and membrane lung. Understanding these interactions is essential to understand the utility and limitations of different approaches to respiratory monitoring during ECMO. We present a summary of the underlying physiology of native and membrane lung gas exchange and describe different tools for titrating and monitoring gas exchange during ECMO. However, the most important role of VV ECMO in severe respiratory failure is as a means of avoiding further ergotrauma. Although optimal respiratory management during ECMO has not been defined, over the last decade there have been advances in multimodal respiratory assessment which have the potential to guide care. We describe a combination of imaging, ventilator-derived or invasive lung mechanic assessments as a means to individualise management during ECMO.
Keywords
Introduction
The use of veno-venous extracorporeal membrane oxygenation (VV ECMO) has increased exponentially over the last decades 1 and is now recommended in selected patients by international guidelines. 2 Although landmark randomised controlled trials support a reduction in mortality with ECMO in a group of patients with acute severe and potentially reversible respiratory failure,3–5 respiratory management, patient monitoring, and outcomes all vary between centres 1 and optimal management of the native lung is not yet defined. Monitoring enables underlying physiological principles to be used to develop strategies to individualise care.
The profound physiological changes induced by extracorporeal support affect the result and interpretation of many monitoring techniques. Furthermore, understanding the interplay between the membrane and native lungs is essential to personalising native lung management during ECMO. Over the last decade, there has been significant progress in both invasive and non-invasive tools to assess and personalise care in severe respiratory failure. In this review, we will outline current concepts in monitoring of the respiratory system during VV ECMO, including a practical, multimodal approach to individualising respiratory support to enhance recovery.
Gas exchange of the native and membrane lung
O2 consumption and CO2 clearance requirements
Understanding the overall gas exchange requirements of the body are essential to optimise respiratory support. Total oxygen consumption (VO2tot) at rest in health is around 250 mL/min (∼3 mL/kg/min). To provide for this oxygen ‘delivery’ (DO2, usually around 1000 mL/min) is 3–4 times higher, resulting in a VO2:DO2 of around 25–30%.6–8 Consumption of oxygen generates CO2 with the volume of CO2 required to be cleared per minute (VCO2) in a proportion – the respiratory quotient (RQ) which varies with the type of nutritional substrate. A normal RQ is generally considered to be 0.8 and results in a VCO2 of around 200 mL/min with a VO2 of 250 mL/min. 6 Metabolic demands however are not static, but vary according to activity and change significantly during critical illness.9–11 For example, neuromuscular blockade can reduce VO2 by up to 15% 12 whilst hyperthermia increases VCO2 approximately 5–10% per degree Celsius of body temperature change.12,13 Critical illness can result in ketosis, reducing the RQ (even to <0.7 14 ) whilst administration of intravenous dextrose, parenteral nutrition or propofol will all change the RQ and hence, VCO2. Finally, the measurement of VCO2 and RQ are affected by the extracorporeal support: the higher the CO2 clearance from ECMO support the lower the VCO2 of the native lung, leading to a decrease in RQ, according to the alveolar gas equation. 15
Although in the literature the oxygen transfer from the membrane lung is commonly described as the VO2ML, conceptually it is more akin to O2 delivery than O2 consumption. In real world practice, the average O2 transfer (VO2ML) from the membrane lung has been found to be 25–50 mL per litre of ECBF.16,17 Therefore, when there is no native lung function (e.g. a shunt fraction of 1.0- see below) and patients are fully dependent on VV ECMO, high extracorporeal blood flows (ECBF) are required. For example. to supply a normal resting VO2 of 250 mL/min in fully dependent patients an ECBF of ≥5 L/min may be needed. This necessitates the use of large bore cannula for VV ECMO (21-29Fr in adults), an adequate haemoglobin level 18 and often measures to reduce tissue oxygen consumption early after initiation.
Gas partial pressures and their relation to the content of blood
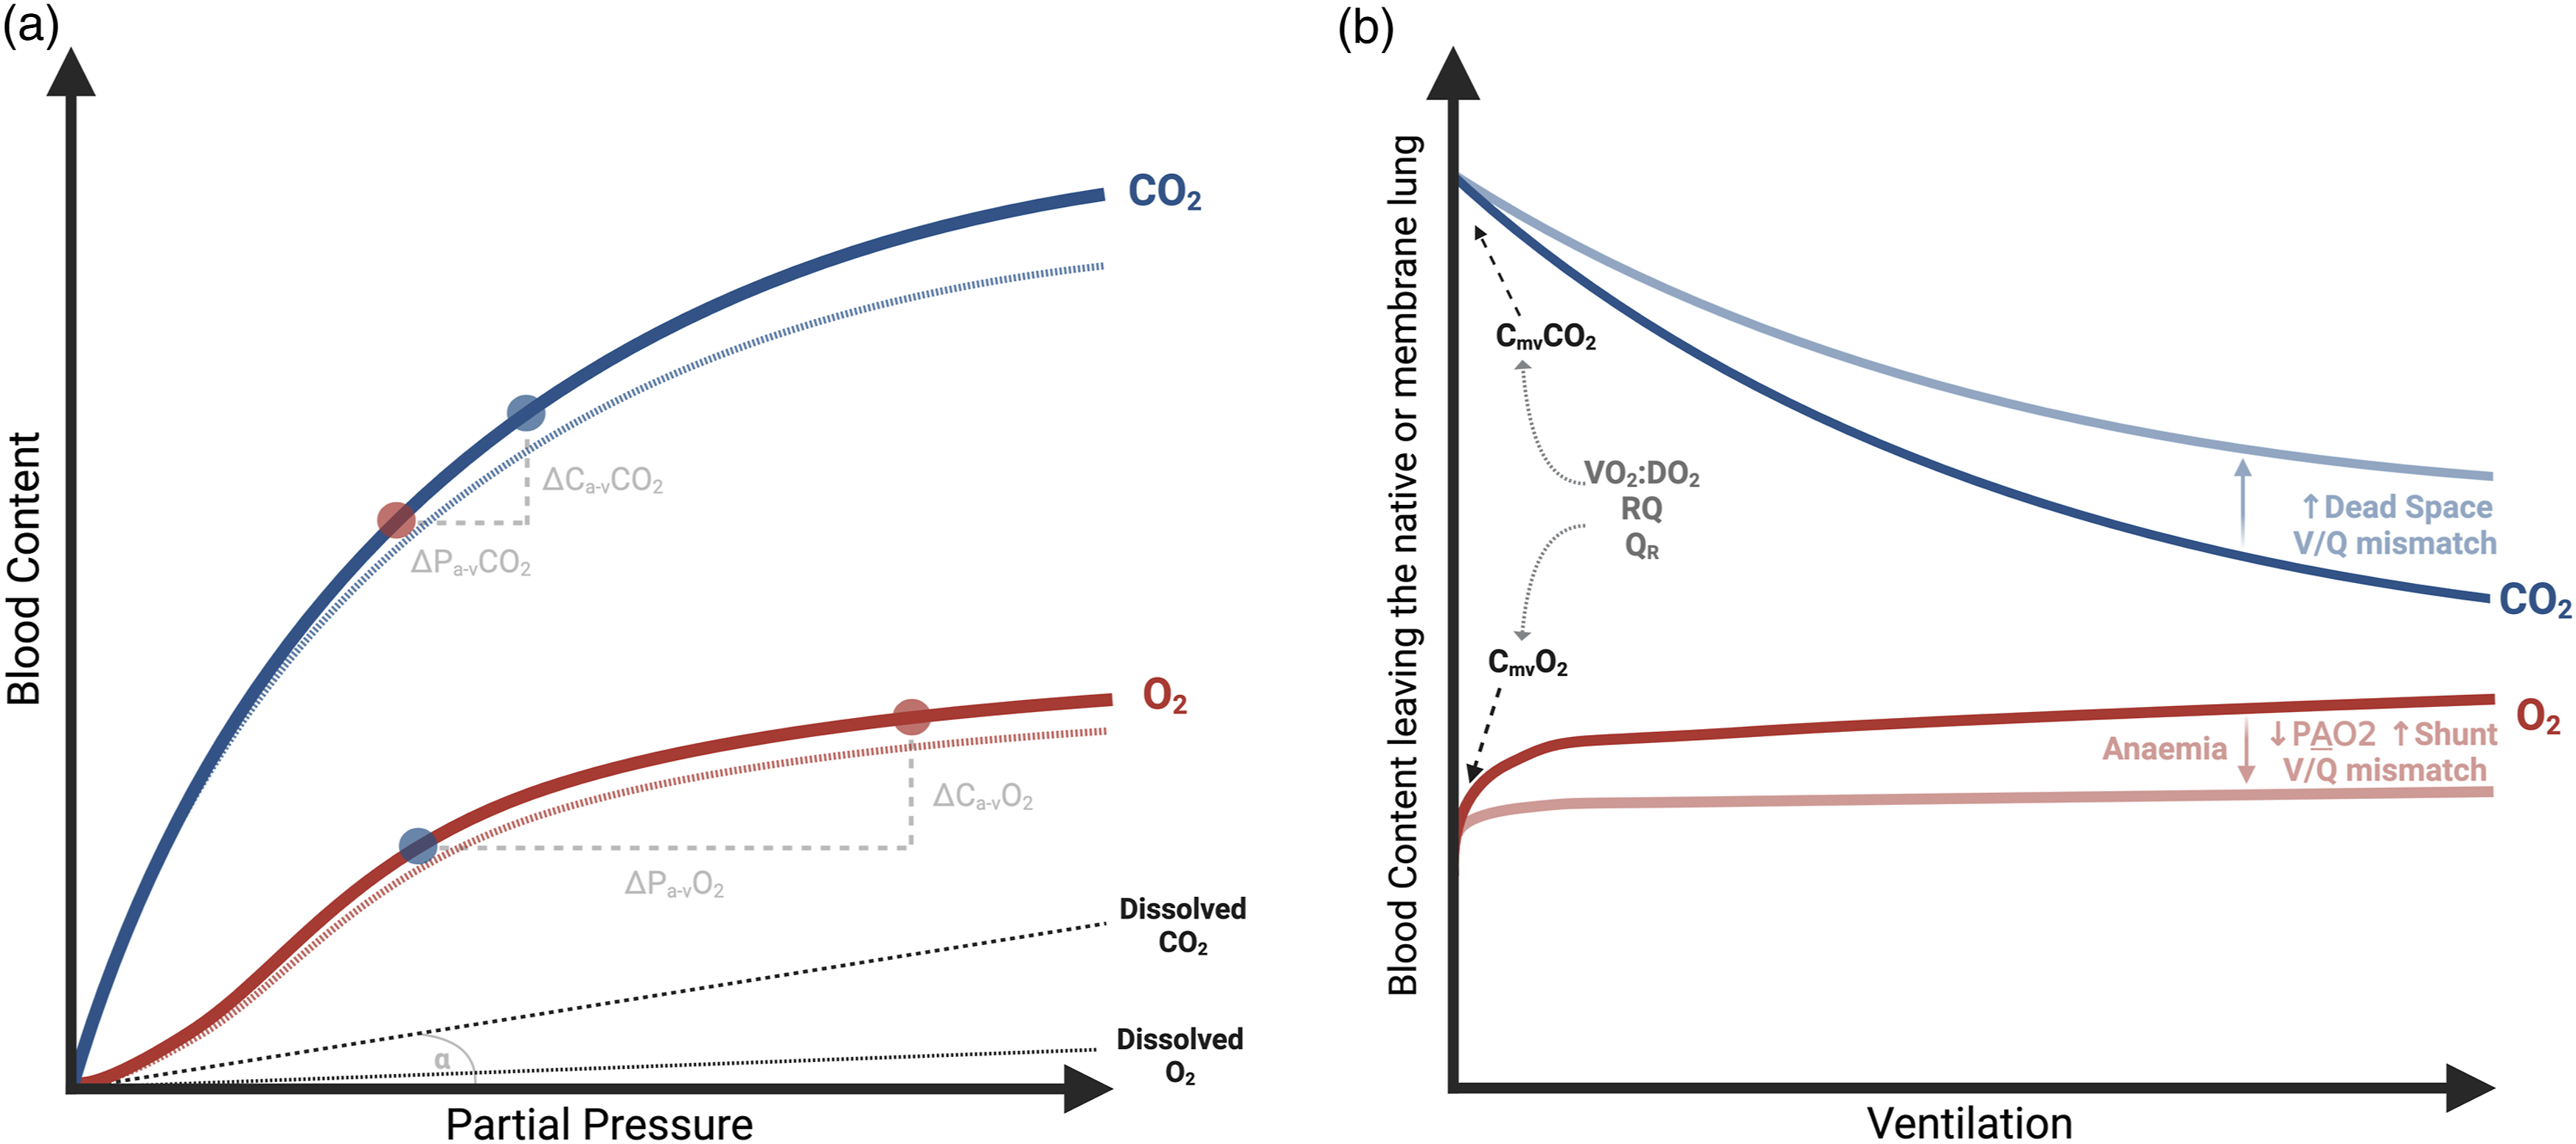
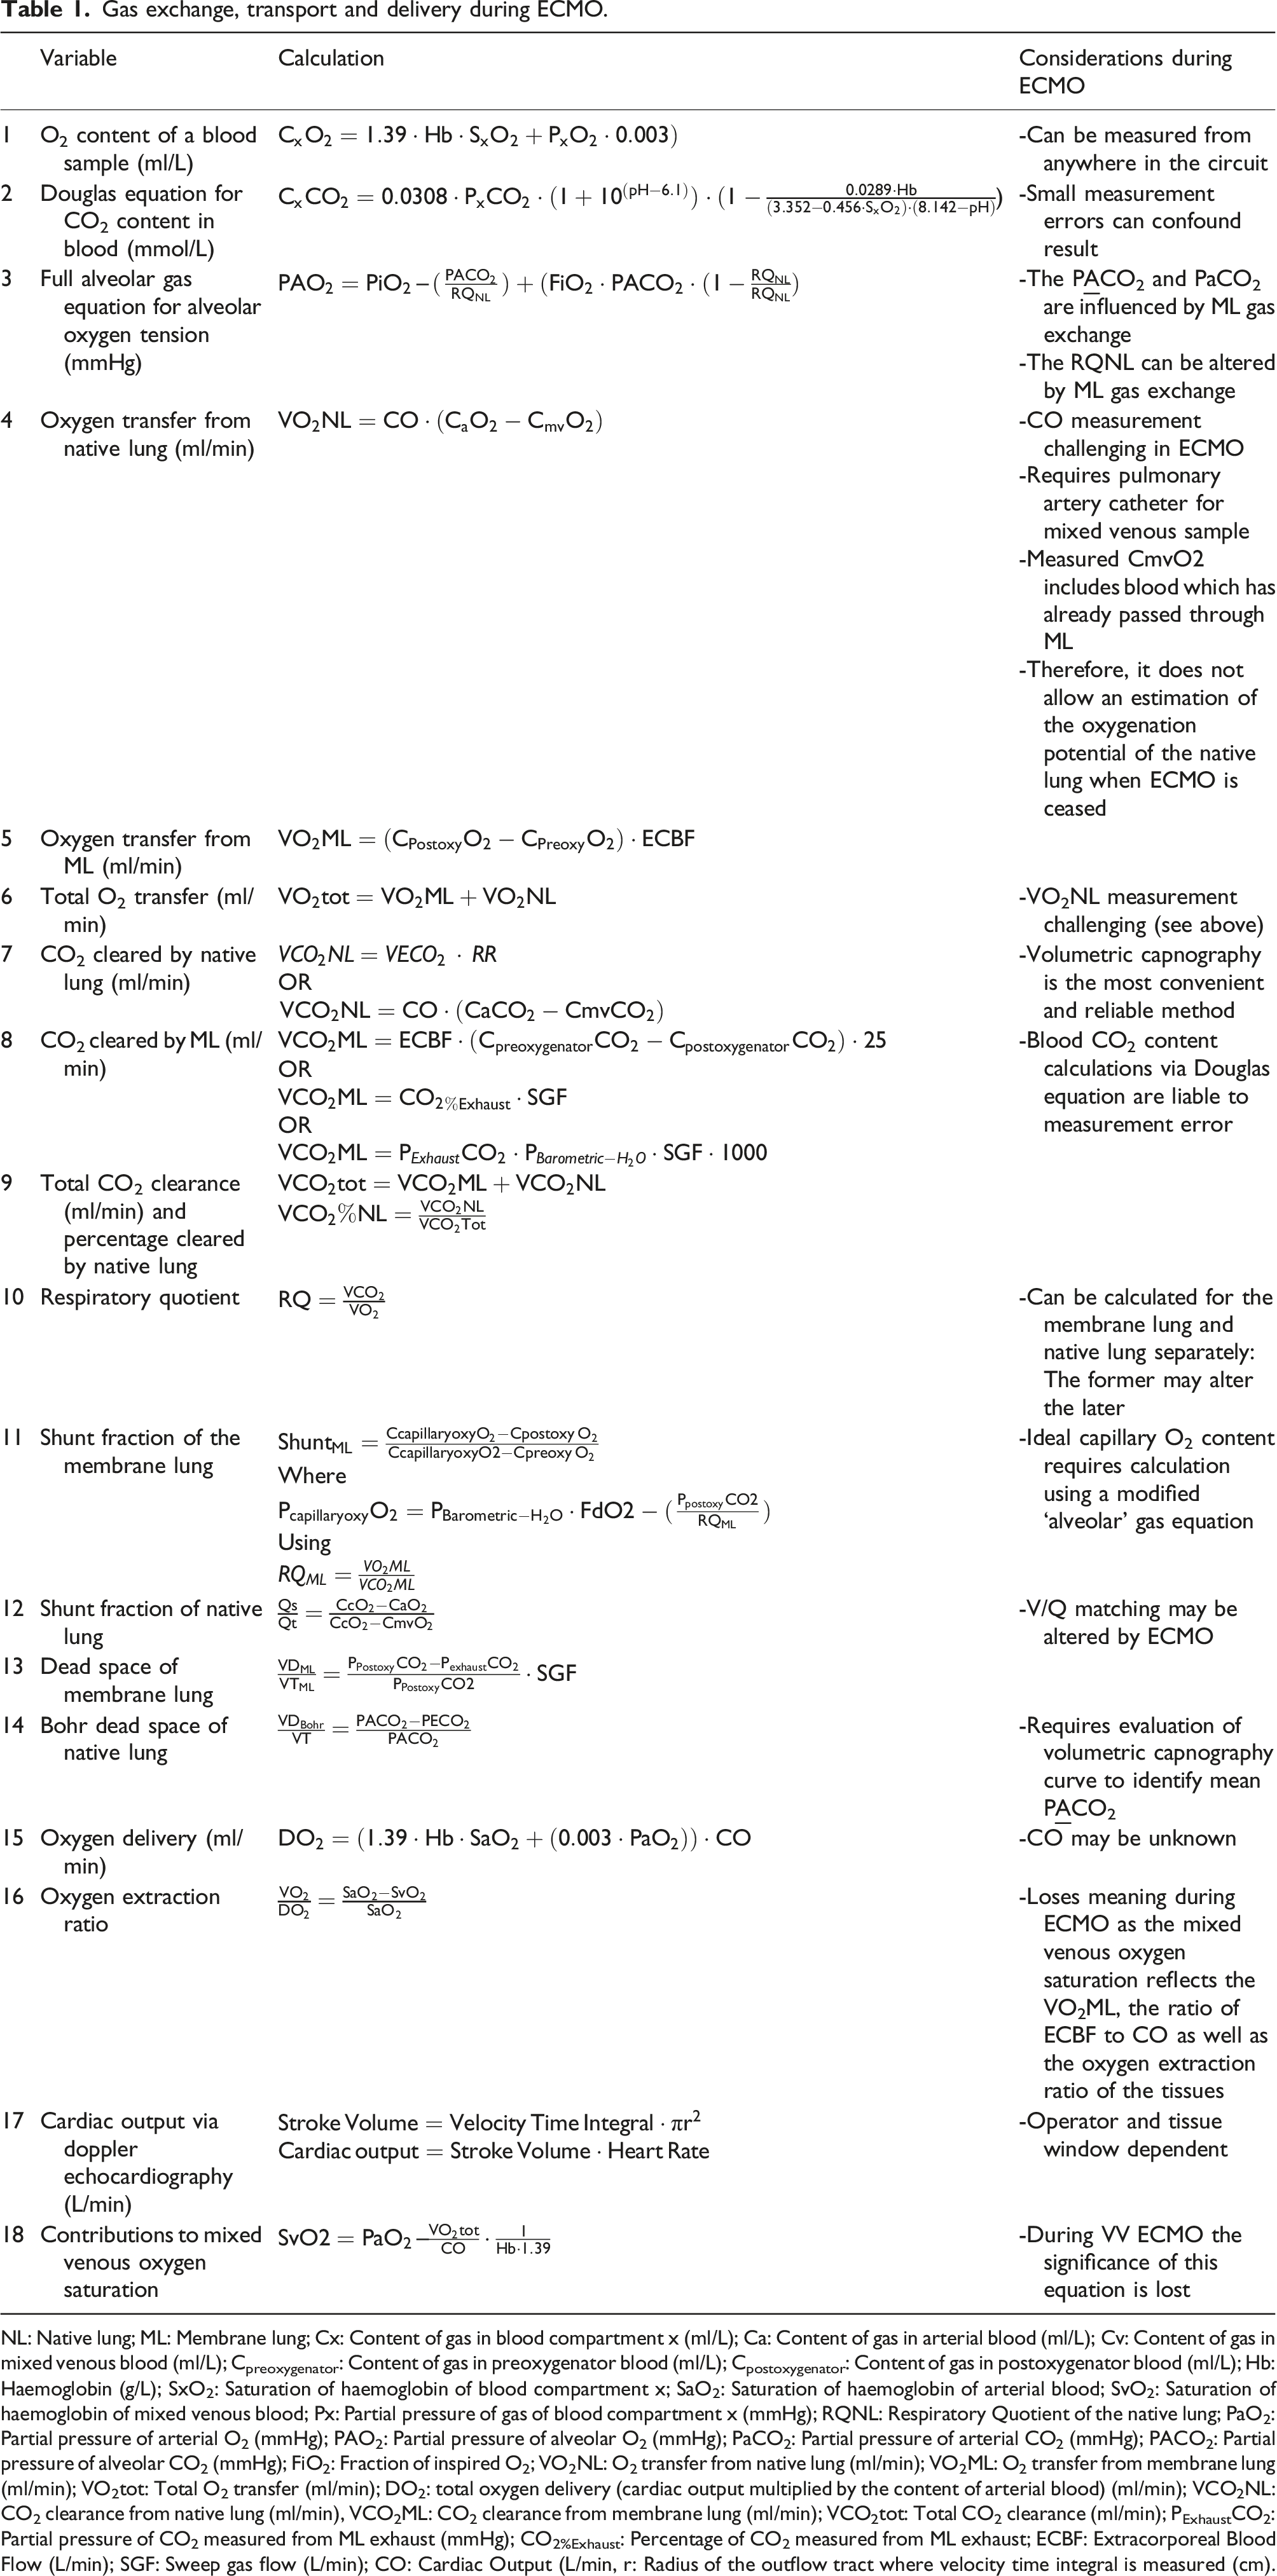
To understand and titrate gas exchange during ECMO, it is important to distinguish between the gas tension (partial pressure), blood content (mL/L) and the overall gas transfer (mL/min) of respiratory gases. Figure 1 depicts the relationship between the partial pressure and content in blood for oxygen and CO2: (1) The dissolved content of gases in blood is very limited (grey line), and its linearly related to their partial pressure through their solubility constant (which is around 20x higher for CO2 than O2). (2) The O2 content of a blood sample is largely determined by the O2 saturation and quantity of haemoglobin (equation 1 in Table 1).6,7,19–22 Therefore, the O2 content of blood plateaus as haemoglobin becomes fully saturated. (3) Unlike O2, CO2 reacts with water to form bicarbonate which is its largest component in blood and does not plateau until extreme PCO2 values are reached. This means that the relationship between the partial pressure and blood content is more linear for CO2 than O2 and changes in PCO2 are more reflective of changes in blood content. (4) For the same change in partial pressure there is a much greater change in blood content for CO2 compared to O2. Blood content and gas exchange. Gas exchange, transport and delivery during ECMO. NL: Native lung; ML: Membrane lung; Cx: Content of gas in blood compartment x (ml/L); Ca: Content of gas in arterial blood (ml/L); Cv: Content of gas in mixed venous blood (ml/L); Cpreoxygenator: Content of gas in preoxygenator blood (ml/L); Cpostoxygenator: Content of gas in postoxygenator blood (ml/L); Hb: Haemoglobin (g/L); SxO2: Saturation of haemoglobin of blood compartment x; SaO2: Saturation of haemoglobin of arterial blood; SvO2: Saturation of haemoglobin of mixed venous blood; Px: Partial pressure of gas of blood compartment x (mmHg); RQNL: Respiratory Quotient of the native lung; PaO2: Partial pressure of arterial O2 (mmHg); PAO2: Partial pressure of alveolar O2 (mmHg); PaCO2: Partial pressure of arterial CO2 (mmHg); PACO2: Partial pressure of alveolar CO2 (mmHg); FiO2: Fraction of inspired O2; VO2NL: O2 transfer from native lung (ml/min); VO2ML: O2 transfer from membrane lung (ml/min); VO2tot: Total O2 transfer (ml/min); DO2: total oxygen delivery (cardiac output multiplied by the content of arterial blood) (ml/min); VCO2NL: CO2 clearance from native lung (ml/min), VCO2ML: CO2 clearance from membrane lung (ml/min); VCO2tot: Total CO2 clearance (ml/min); PExhaustCO2: Partial pressure of CO2 measured from ML exhaust (mmHg); CO2%Exhaust: Percentage of CO2 measured from ML exhaust; ECBF: Extracorporeal Blood Flow (L/min); SGF: Sweep gas flow (L/min); CO: Cardiac Output (L/min, r: Radius of the outflow tract where velocity time integral is measured (cm).
The haemoglobin saturation and haemoglobin level of a sample can be directly measured, hence calculating blood O2 content is relatively straightforward (equation 1). Conversely, the CO2 content of blood requires calculation using complex equations, for example the Douglas equation (equation 2, Table 1).7,19
Gas transfer across the native lung (without ECMO)
Gases cross the alveolar-capillary membrane according to the partial pressure gradients between alveolar gas and capillary blood. The partial pressure of alveolar oxygen (P
Gas exchange indexes evaluating the native lung.
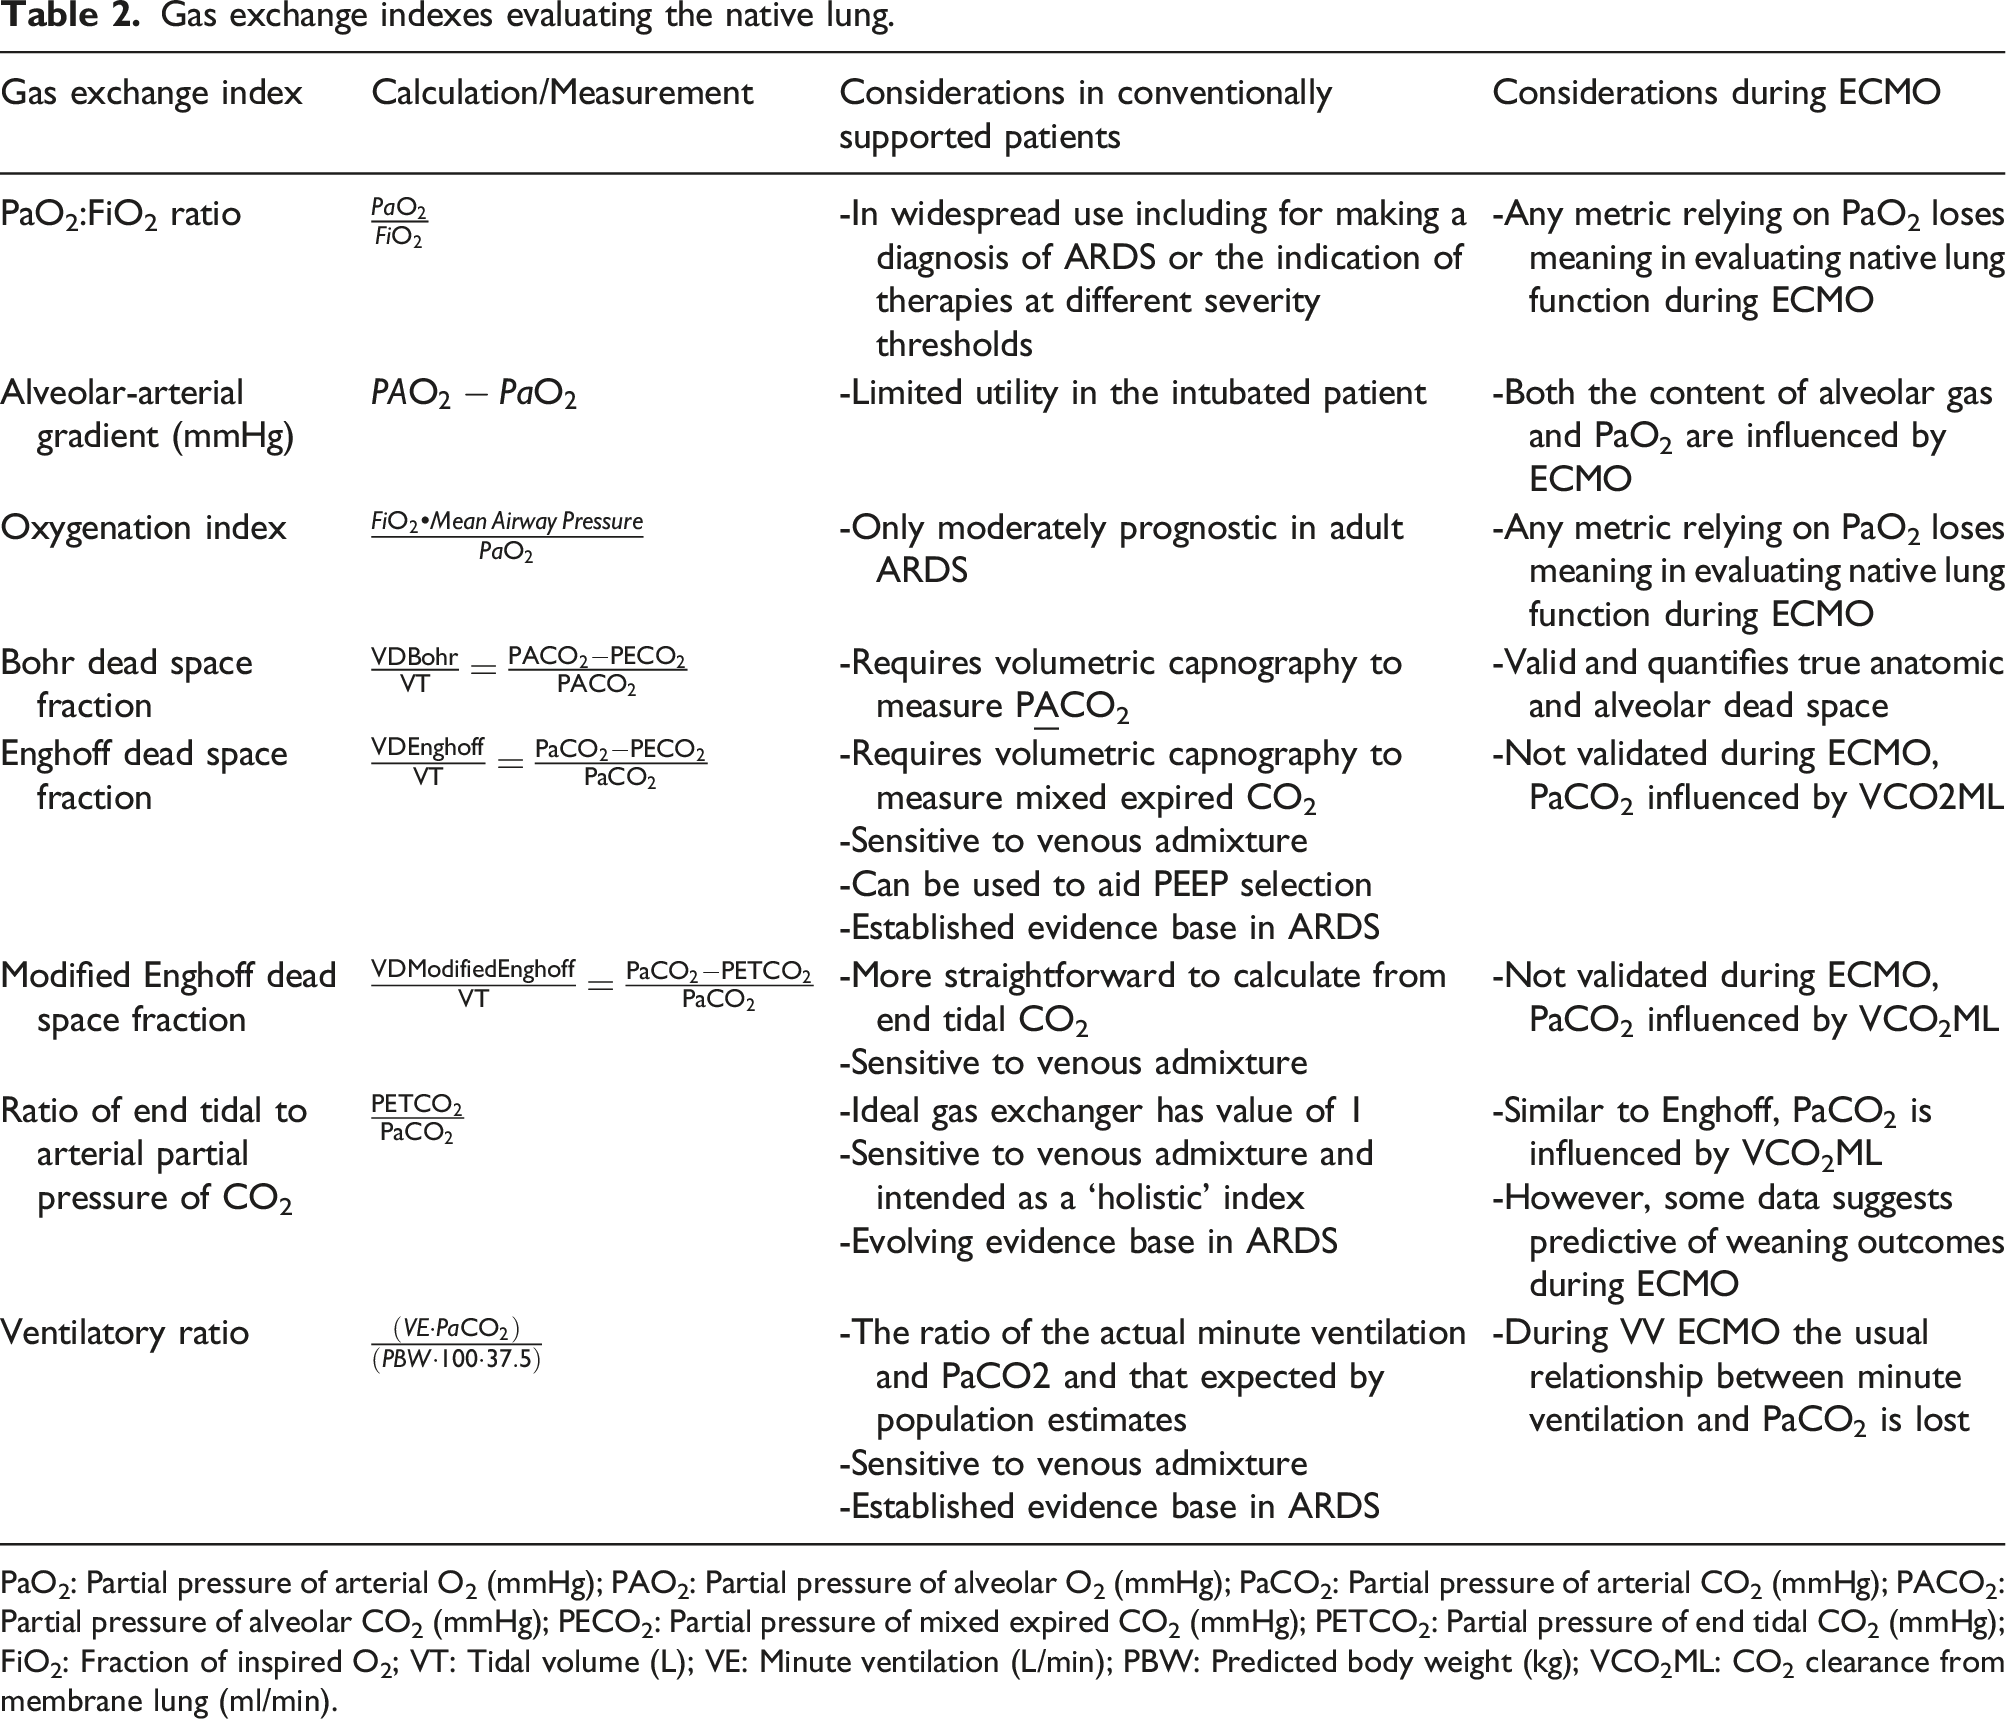
PaO2: Partial pressure of arterial O2 (mmHg); PAO2: Partial pressure of alveolar O2 (mmHg); PaCO2: Partial pressure of arterial CO2 (mmHg); PACO2: Partial pressure of alveolar CO2 (mmHg); PECO2: Partial pressure of mixed expired CO2 (mmHg); PETCO2: Partial pressure of end tidal CO2 (mmHg); FiO2: Fraction of inspired O2; VT: Tidal volume (L); VE: Minute ventilation (L/min); PBW: Predicted body weight (kg); VCO2ML: CO2 clearance from membrane lung (ml/min).
Gas transfer across the membrane lung (ML)
During ECMO, extracorporeal blood flow (ECBF) is drained from the IVC, SVC or right atrium and passed through a ML before being returned ‘arterialised’ (O2 added, CO2 partially removed) to the right atrium. Within the artificial lung, hollow fibres carry fresh sweep gas flow (SGF), of titratable oxygen fraction (FdO2) and rate. Similar to the native lung, gas exchange occurs passively across membranes down pressure gradients for each gas. However, the membrane fibres are thicker, have less total volume and are much less efficient than the alveolar membranes in the native lung.
For the membrane lung the ‘alveolar’ gas is the sweep gas and the fraction of device O2 (FdO2) can be directly manipulated which will affect the O2 transfer across the membrane lung (VO2ML). The other determinants of VO2ML are the blood flow and pre-membrane oxygen saturation. Similar to increasing alveolar ventilation in the native lung, the sweep flow rate rather than FdO2 predominantly alters the CO2 clearance (VCO2ML) (although the FdO2 may have some influence due to the Haldane effect). Gas diffusion for a given partial pressure gradient is largely fixed by the mechanical properties of the hollow fibres within the membrane lung (most commonly made from polymethylpentene) but may worsen with pseudomembrane formation. Further, similarly to in the native lung, high ECBF flow rates may limit CO2 transfer by creating diffusion impairments for a given SGF when the ‘transit time’ of blood is shortened. V/Q mismatch also applies to the membrane lung.6,20,21,24,25 As the SGF is increased for a given ECBF, the VCO2ML plateaus due to a diminishing gradient for CO2 removal. Oxygenator function tends to worsen over time due to the accumulation of thrombus, pseudomembrane formation and gas condensation. This may lead to increased dead space (occluded blood channels) or shunt (occluded gas channels).
Monitoring gas exchange during VV ECMO
During VV ECMO gas exchange in the ML and native lung occurs ‘in series’. A proportion of the venous return passes through the extracorporeal circuit before it enters the pulmonary circulation. Figure 2 displays the interactions between the ML and native lung during VV ECMO. The interdependence of membrane lung and native lung gas exchange during V-V ECMO.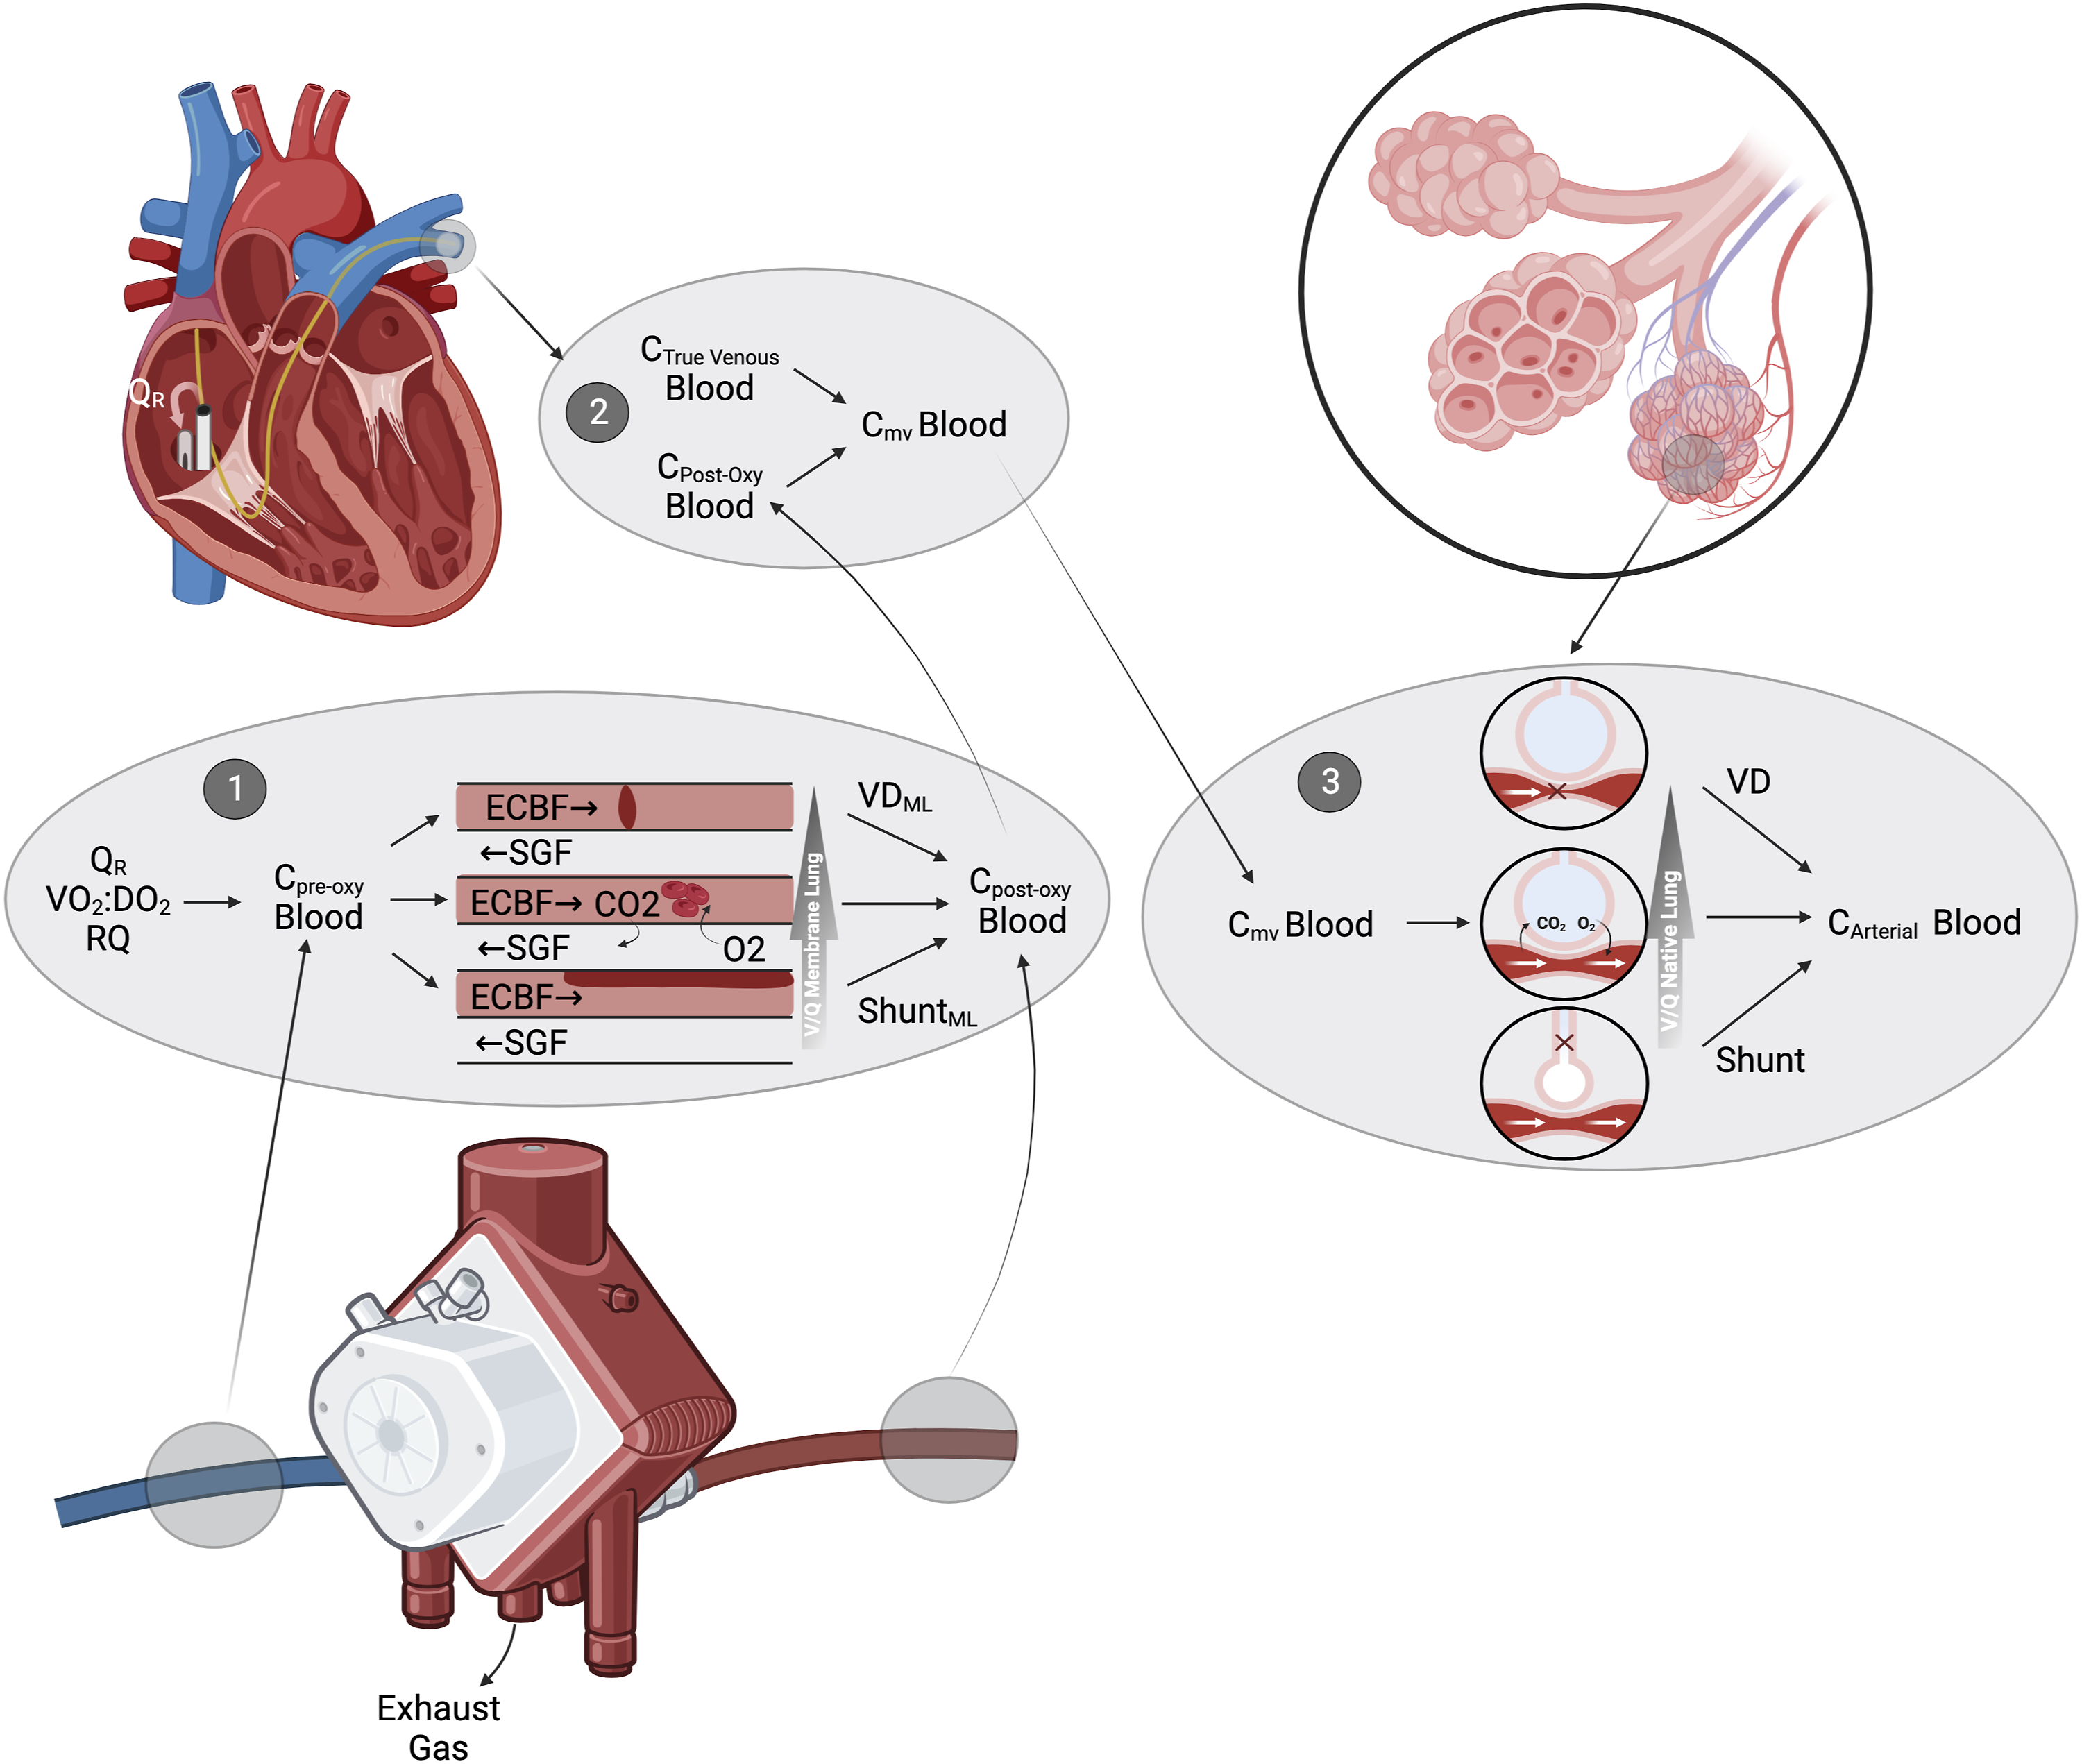
Monitoring the membrane lung
Evaluating the VO2ML
The volume of oxygen added to blood extracorporeally (VO2ML) can be calculated using equation 5 (Table 1). This can be understood as the difference between the oxygen content of blood entering and exiting the membrane lung multiplied by the ECBF to give the oxygen transfer per minute. 26
The saturation of preoxygenator blood is a critical determinant of the VO2ML. The preoxygenator SO2 is influenced by both the overall VO2:DO2 and recirculation (QR) - blood which has already undergone extracorporeal gas exchange being re-aspirated into the circuit. This will ‘dilute’ the true venous blood leading to a higher preoxygenator SO2 and reducing the VO2ML at any given ECBF. Although QR varies with cannula positioning and at different ECBF rates, techniques used experimentally to directly quantify it27,28 are currently research tools and in general it is best to qualitatively assess the degree of QR by monitoring the preoxygenator and peripheral SO2 when changing the ECBF. The preoxygenator SO2 is usually an overestimate of the true venous SO2 because of QR, hence a very low preoxygenator SO2 (<50%) should prompt concern about the overall VO2:DO2. Finally, if all other factors are held constant, a change in the preoxygenator SO2 (e.g. due to altered VO2:DO2 of the patient) will alter the VO2ML, even if oxygenator function is static.
Importantly, measuring the postoxygenator PO2 alone is not a reliable indicator of oxygenator failure. 17 Indeed, in a recent study a low post-oxygenator PO2 was the sole or contributory reason for an ECMO circuit change in around one third of cases, but a circuit change could have been avoided or delayed in some cases had formal calculation of VO2ML occurred. 17 An aging membrane can decrease the functional units of gas exchange within the membrane lung analogously to the concept of shunt in the native lung. The shunt fraction of the membrane lung can be formally calculated (equation 12), similar to that of the native lung. 24
Evaluating the VCO2ML
Similar to the VO2ML, the VCO2ML can be calculated by the use of pre- and post-oxygenator blood gas analysis using the Douglas equation (equation 2). From this, the VCO2ML can be calculated as the difference in CO2 content across the membrane multiplied by blood flow6,20,21,25 (equation 8). The complexity of this equation means that there is a potential for error by magnifying small variations in measurements between samples. 29
Capnometry can be used to calculate the VCO2ML by measuring the CO2 content of the exhaust gas from the ML (Figure 1).20,21,24,30–32 Specific devices have been developed which warm the exhaust gas to avoid condensation and the influence of temperature as well as directly measuring the flow rate of gas from the exhaust.31,33 However, providing that there is no resistance to exhaust flow, substituting a standard portable capnometer provides acceptable performance (equation 8)30,31 Some authors suggest increasing the SGF to at least 10L per minute for 30s (a ‘sigh’) prior to measuring the exhaust CO2 after a period of equilibration in order to remove any condensation from the gas channels. 34
Monitoring native lung function during VV ECMO
Classical assessments of native lung gas exchange (Table 2) are challenging during VV ECMO. True venous blood is mixed with post-oxygenator blood in the right ventricle before being distributed to the alveolar capillaries (Figure 2). The mixed venous blood therefore has a higher oxygen saturation than that of true venous blood and no longer reflects the VO2:DO2. As hypoxic pulmonary vasoconstriction is sensitive to arteriolar as well as alveolar tensions of oxygen,35,36 VV ECMO will alter native lung VQ matching.6,22 Further, the VO2 and VCO2 of the native lung are influenced by extracorporeal gas exchange: for example, if the mixed venous oxygen saturation of O2 is >90% due to ECMO, regardless of native lung function minimal further oxygen can be added. As the arterial content of O2 and CO2 is a combination of ML and native lung gas exchange occurring in series, many indices to assess native lung gas exchange are no longer truly reflective of lung function (Table 2). Understanding the limitations of monitoring native lung gas exchange is therefore crucial during VV ECMO.
Challenges in measuring cardiac output
Although the cardiac output (CO) is a key variable to assess native lung function, this is difficult to measure during VV ECMO. The ‘gold standard’ direct Fick method 37 is invalidated by the presence of extracorporeal gas exchange. All thermodilution techniques are unreliable during ECMO as the indicator is partially aspirated into the ECMO circuit, leading to a systematic overestimation of CO. 38 Echocardiographic measurement of CO from the left or right ventricular outflow tract using the doppler effect38–41 (equation 17) is reliable during VV ECMO. However, this offers only a single time point measurement and is resource intensive, dependent upon tissue windows and suffers from inter- and intra-operator variability.
Monitoring native lung oxygenation capacity and the VO2NL
The most common indices aiming to assess native lung capacity for oxygenation used in critical care are no longer helpful during ECMO, including the P:F ratio, oxygenation index and alveolar-arterial gradient (Table 2).
The transfer from the native lung (VO2NL) can be estimated in VV ECMO using the arterio-mixed venous content difference if the true cardiac output is known (equation 4). The difference between the inspired and expired oxygen from the native lung can be monitored and is be considered to be a marker of O2 uptake by the lung in steady state42,43 and used as a means of estimating the VO2NL over time. However, unlike CO2, the difference between inspired and expired oxygen is generally low during mechanical ventilation, especially with high FiO2, introducing a potential source of error. 44 The proportion of venous admixture (true shunt plus V/Q <1) can be calculated if a pulmonary artery catheter is in situ during VV ECMO, but this measurement may not be representative of conditions when extracorporeal support is stopped, due to the influence of post-oxygenator blood on the mixed venous saturation and therefore V/Q.6,22
One useful metric for native lung oxygenation capacity is the ‘oxygen challenge test’. In this test the ventilator FiO2 is increased to 1.0 whilst other mechanical ventilation and ECMO settings are left unchanged. Then an arterial blood gas is measured after 30 min to assess the change in PaO2. This change equates to changes in the native lung’s capacity for oxygenation over time. The utility of the oxygen challenge test to define readiness to wean ECMO is unproven.45,46
Monitoring VCO2NL, assessing the dead space and ventilatory efficiency of the native lung
Metrics sensitive to dead space tend to be more prognostic than oxygenation indices in acute lung injury.47–49 Although VV ECMO invalidates Riley’s assumptions, 29 waveform and volumetric capnography mean indices related to dead space and measurement of the VCO2ML are much easier to apply and have a greater evidence base during ECMO.
Volumetric capnography enables calculation of the anatomical and instrumental dead space, the mean alveolar CO2 concentration (the midpoint of ‘phase III’, for the Bohr dead space) and the mixed expired PECO2 (the mean pressure of expired CO2, for the Bohr and Enghoff dead space) as well as the ETCO2. 50 From this, ventilators can calculate the total expired CO2 per breath (the VECO2) and per minute (the VCO2NL). From this, the total VCO2 (VCO2tot) can be calculated (equation 9). 6 The percentage of the VCO2tot which is achieved by the native lung (equation 9) can be tracked over time in response to changes. In a perfect gas exchange system, the terminal alveolar gas would have an identical pressure of CO2 as arterial blood. However, due to dead space, V/Q mismatch and shunt, this is never the case. Volumetric capnography enables the calculation of several metrics related to dead space, some influenced by the venous admixture, which are useful tools during VV ECMO (Table 2)22,47,50,51 such as the ETCO2:PaCO2 ratio. Although these are influenced by extracorporeal gas exchange, they can track native lung function over time with static ECMO support, as ECMO support is weaned, or used to titrate mechanical ventilation. Finally, akin to cardiopulmonary exercise testing, monitoring the ventilatory efficiency (ratio of minute ventilation to VCO2NL) over time may be useful as a measure of improving respiratory function (including during weaning).22,29
Additional benefits of VO2 and VCO2 measurement during ECMO
Indirect calorimetry can be used to individualise nutrition through measuring the VO2, VCO2 and RQ of the patient to infer their caloric requirements.44,52 The VO2 and VCO2 of the native and ML should be summed to generate values to estimate resting energy expenditure via the Weir equation. 53 It is important to note that this calculation is less accurate with increasing recirculation. 53
Targets for gas exchange
The oxygen target for critically ill patients is debated with competing concerns of tissue hypoxia versus pulmonary and systemic oxygen toxicity. Although several recent high-quality randomised control trials have been published, these have not demonstrated a consistent benefit or harm of targeting oxygen saturation levels close to the ranges usually adopted in clinical practice (SaO2 at least >88% and <100%).54–57 Reports have demonstrated there is no difference in neurocognitive outcomes in VV ECMO survivors even with prolonged hypoxaemia unless cerebral blood flow has been compromised.58,59
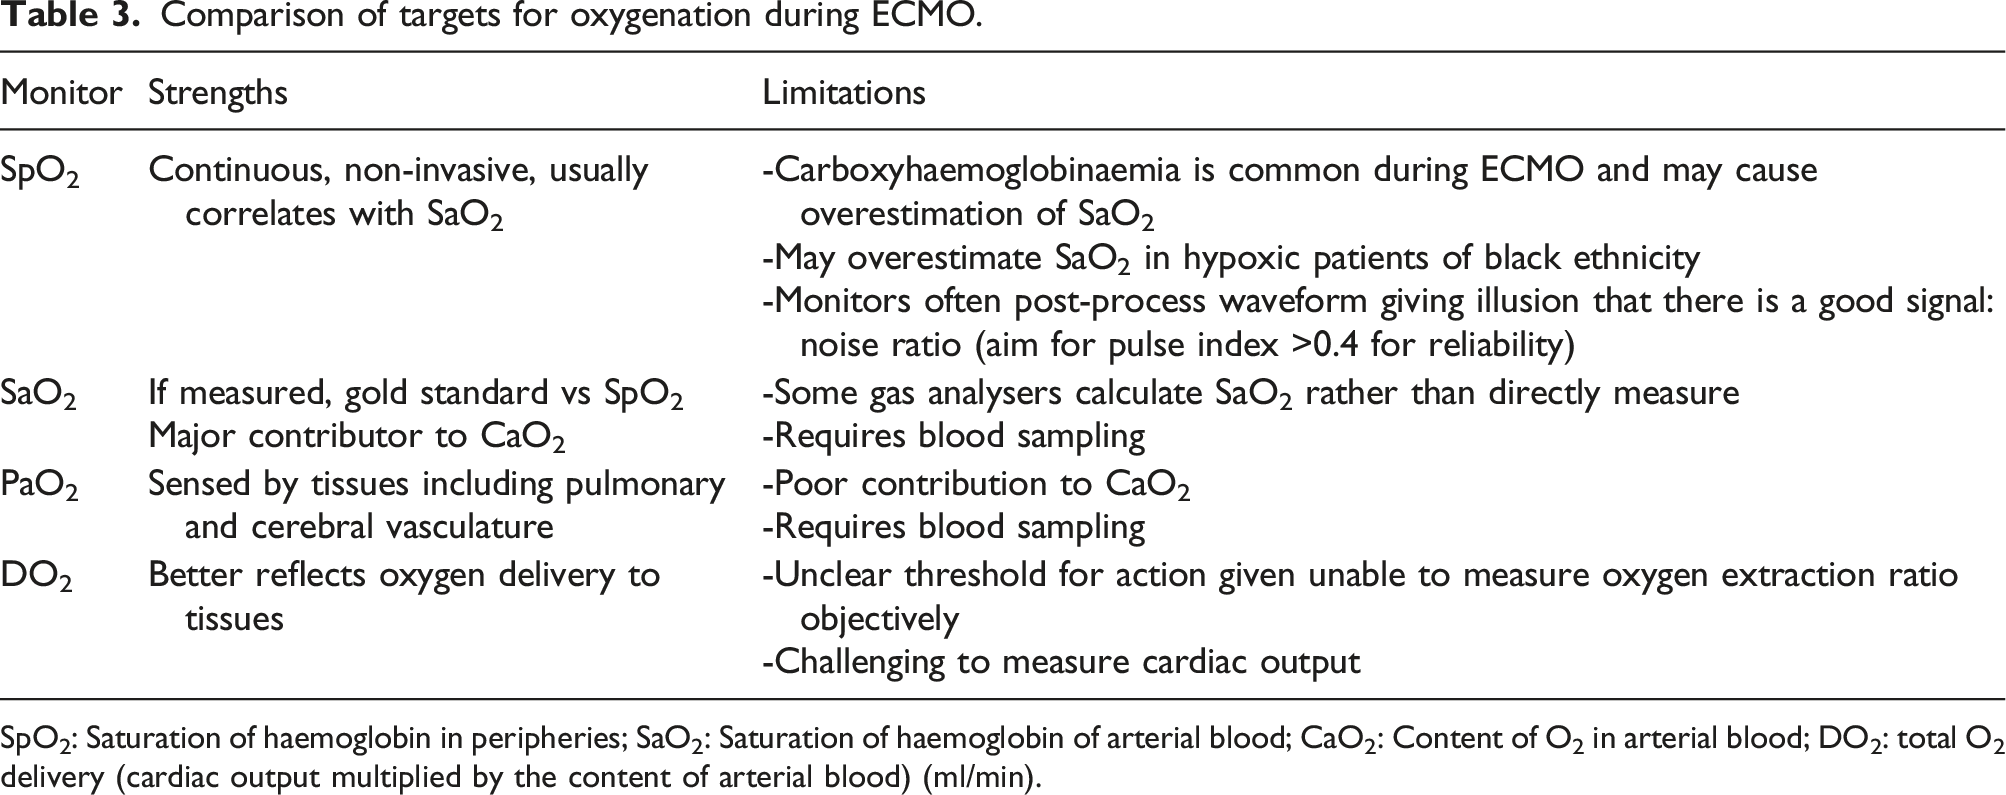
Technical considerations are relevant to the setting of targets for oxygenation during ECMO. Firstly, the question of whether to set a peripheral oxygen saturation (SpO2) target, SaO2 target, PaO2 target or DO2 target (Table 3). A few specific points merit highlighting: (1) A systematic overestimation of SpO2 in hypoxic patients of black skin pigmentation occurs with many SpO2 monitors60,61 (although at least one device has been demonstrated to be accurate regardless of skin tone).
62
(2) Haemolysis, which inevitably occurs on ECMO, can generate endogenous carbon monoxide release leading to carboxyhaemoglobinaemia. Indeed, it has been demonstrated that SpO2 may become less accurate over time during prolonged ECMO runs due to a high prevalence of mild (>3%) carboxyhaemoglobinaemia which should be measured on serial blood gases.
63
(3) As certain tissues including the cerebral and pulmonary vasculature sense oxygen tensions rather than DO2 or saturations,
64
targeting PaO2 may be more appropriate than SaO2 in patients with brain injury or right heart failure. Comparison of targets for oxygenation during ECMO. SpO2: Saturation of haemoglobin in peripheries; SaO2: Saturation of haemoglobin of arterial blood; CaO2: Content of O2 in arterial blood; DO2: total O2 delivery (cardiac output multiplied by the content of arterial blood) (ml/min).
Directly assessing the adequacy of tissue oxygen delivery and oxygen extraction is challenging on ECMO as the mixed venous oxygen saturation is no longer truly representative of VO2:DO2. An alternative technique which is not confounded by ECMO is nearfield infrared spectroscopy (NIRS). Similar to pulse oximetry, this uses the absorption of infrared light to infer the relative concentration of oxy- and deoxy-haemoglobin. 65 As most of the signal is derived from venous blood, desaturation can detect increasing oxygen extraction as well as arterial desaturation. NIRS is influenced by pH, blood flow, PaCO2 and haemoglobin concentration and so may represent a non-specific but integrative measure for local tissue perfusion. 66 An important limitation is that the sensor can only detect changes 2-3cm deep. However, if there is no regional intracranial pathology this is a means of assessing the adequacy of cerebral perfusion and oxygenation. NIRS defined desaturations are related to cerebral outcomes during ECMO67,68 (although case series largely relate to VA modes), where a relative decrease of 10–20% from baseline or acutely may be more meaningful rather than the absolute value, although values below 50% are concerning. 69
Avoiding respiratory acidosis (pH <7.3) with VCO2ML is a reasonable target, however as ECMO is initiated it is important to correct hypercapnia slowly to avoid reactive cerebral vasoconstriction. An association between rapid changes in PaCO2 after ECMO initiation and cerebral complications such as intracranial haemorrhage has been demonstrated. 70 Changes in PaCO2 should be limited to <5–10 mmHg (<0.6-1.3 kPa) per hour.
Daily measurements to assess the native and membrane lungs
Although there is no guidance, it seems reasonable to perform daily measurement of the VO2ML, VCO2ML, VCO2NL and an oxygen challenge test. This allows basic assessment of the gas transfer capability of both the membrane and native lungs. The assessment is supplemented using dead space indices including the ETCO2:PaCO2 ratio and monitoring the ventilatory efficiency and the percentage of total VCO2 carried out by the native lung over time.
Monitoring to minimise native lung injury and respiratory distress
Importantly, we believe that the mortality benefit from VV ECMO is driven by the facilitation of lung protective ventilation rather than changes in gas exchange per se. Although optimal mechanical ventilation has not been defined for VV ECMO, it is reasonable to minimise the risk of further lung injury. Hence multimodal respiratory assessment is especially relevant during VV ECMO.
Mechanical power and ventilation
Calculating mechanical power at the bedside
Formulas and definitions related to ergotrauma, recruitability and respiratory effort.
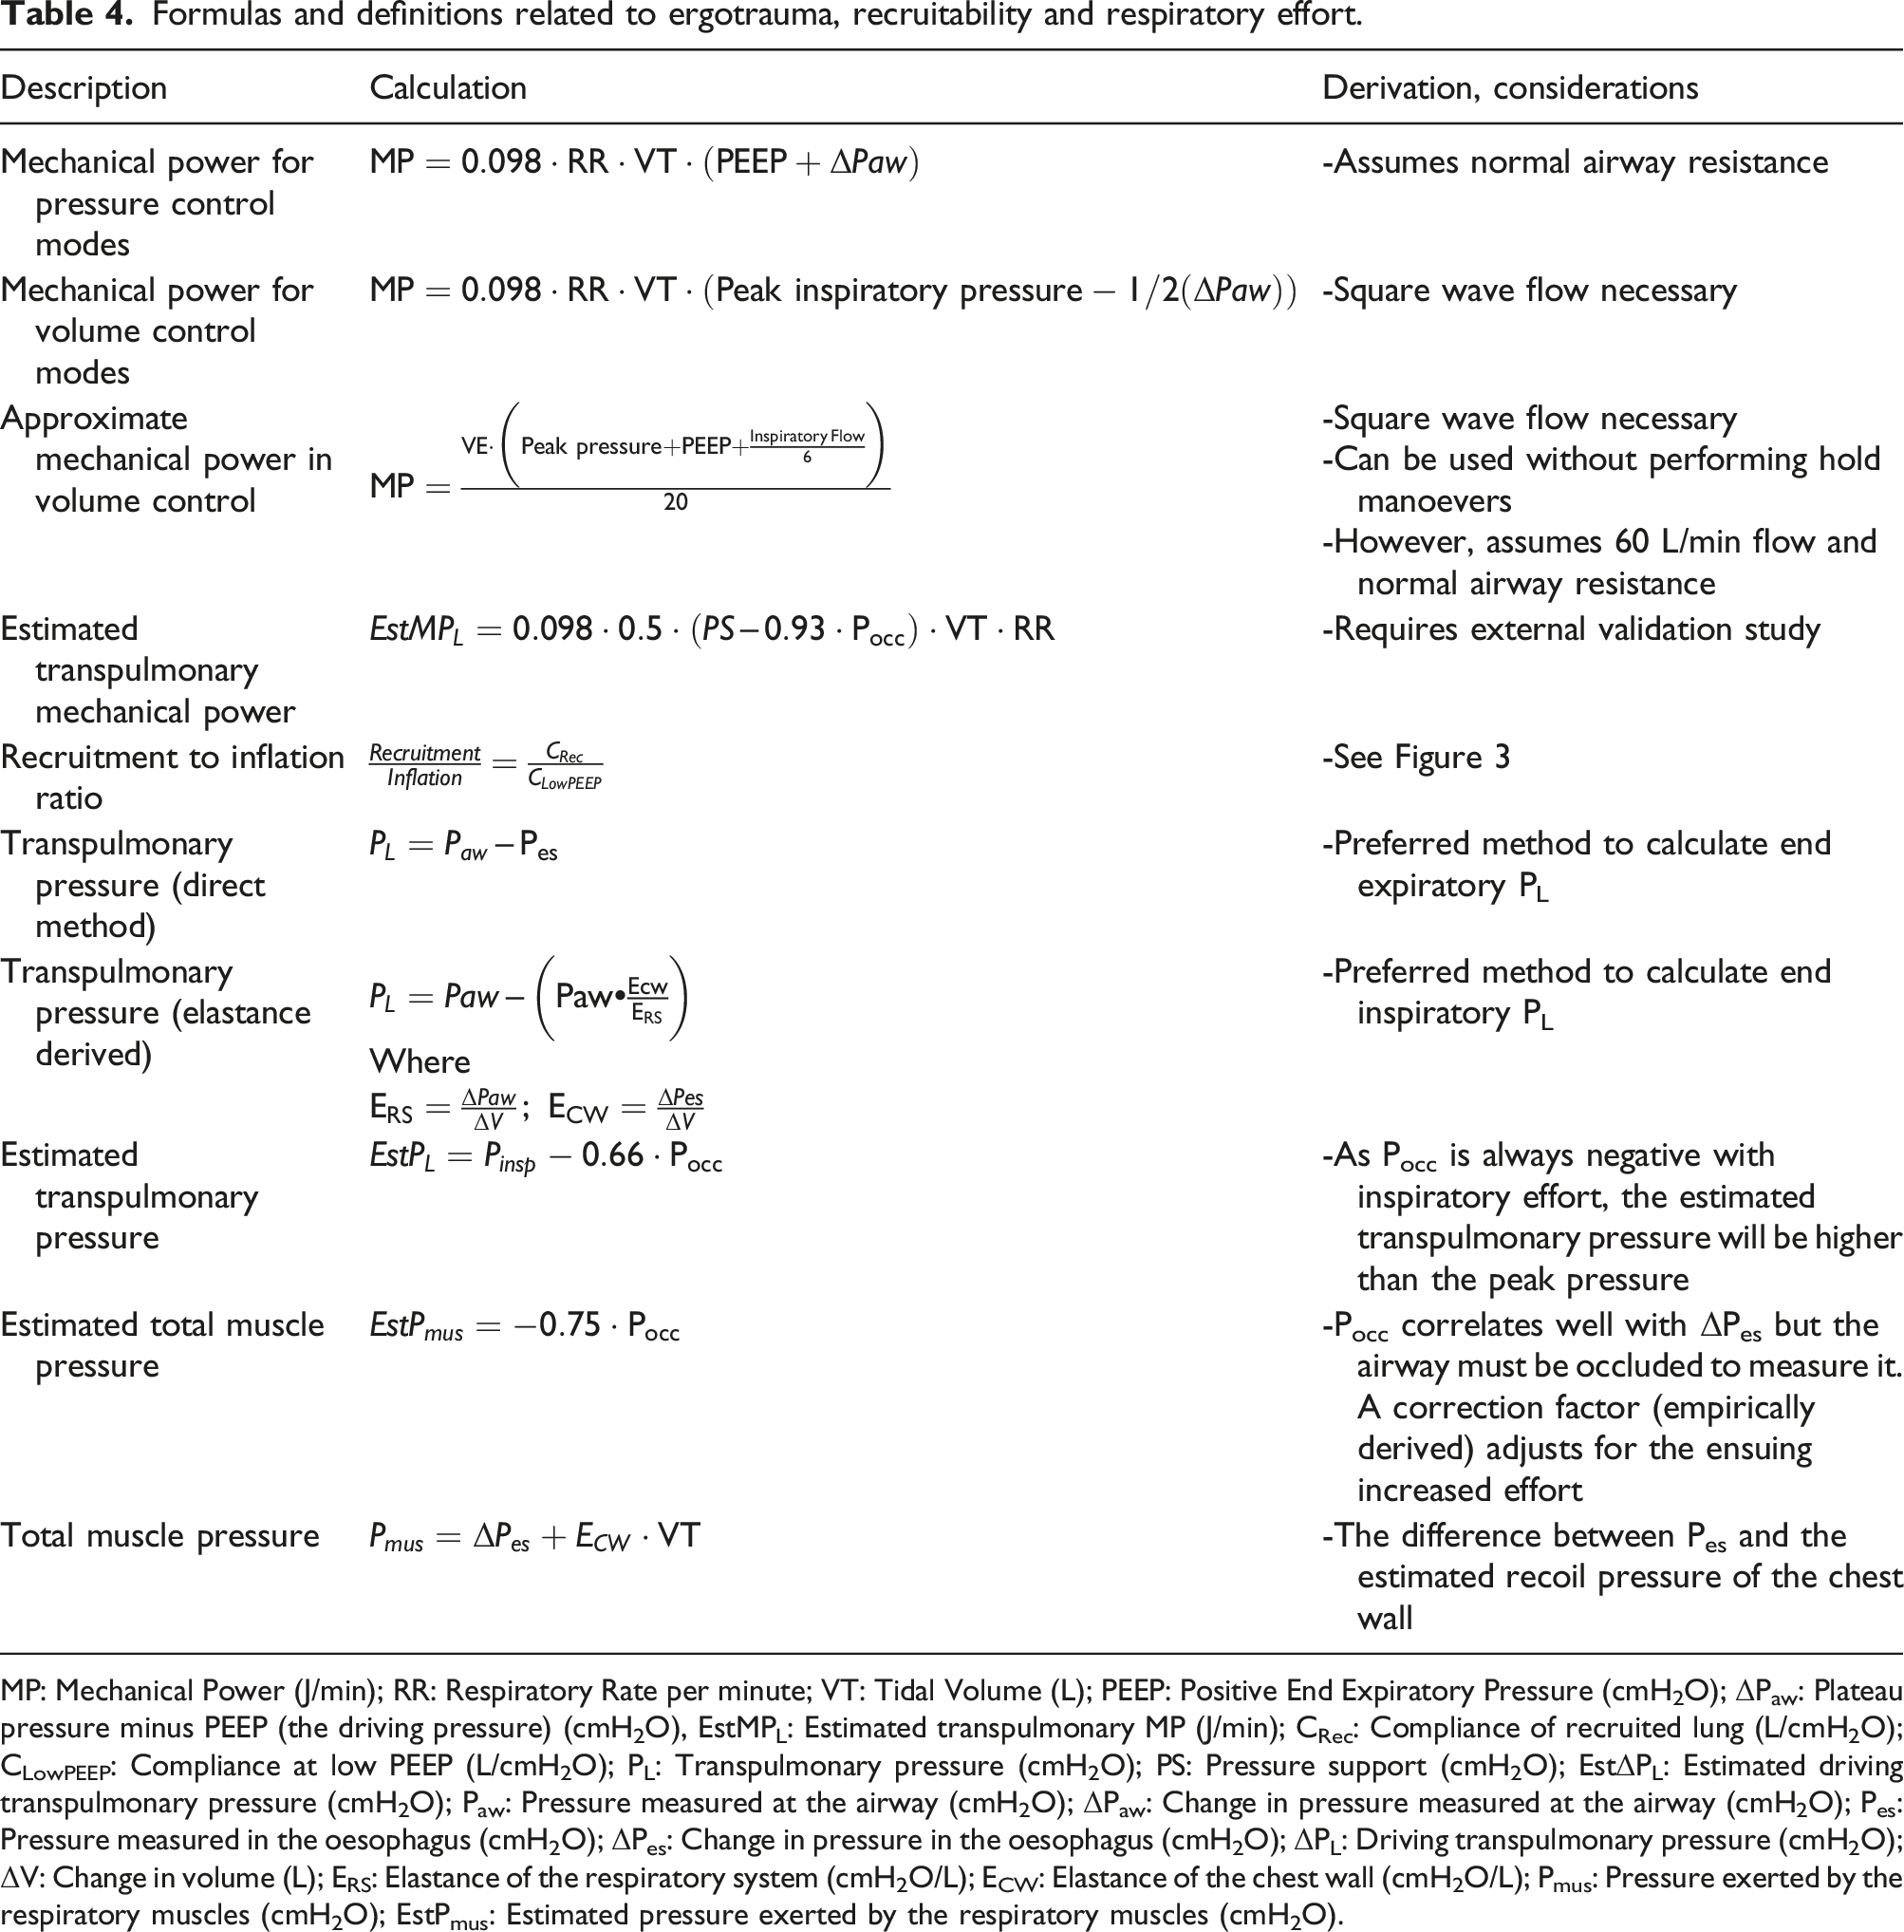
MP: Mechanical Power (J/min); RR: Respiratory Rate per minute; VT: Tidal Volume (L); PEEP: Positive End Expiratory Pressure (cmH2O); ΔPaw: Plateau pressure minus PEEP (the driving pressure) (cmH2O), EstMPL: Estimated transpulmonary MP (J/min); CRec: Compliance of recruited lung (L/cmH2O); CLowPEEP: Compliance at low PEEP (L/cmH2O); PL: Transpulmonary pressure (cmH2O); PS: Pressure support (cmH2O); EstΔPL: Estimated driving transpulmonary pressure (cmH2O); Paw: Pressure measured at the airway (cmH2O); ΔPaw: Change in pressure measured at the airway (cmH2O); Pes: Pressure measured in the oesophagus (cmH2O); ΔPes: Change in pressure in the oesophagus (cmH2O); ΔPL: Driving transpulmonary pressure (cmH2O); ΔV: Change in volume (L); ERS: Elastance of the respiratory system (cmH2O/L); ECW: Elastance of the chest wall (cmH2O/L); Pmus: Pressure exerted by the respiratory muscles (cmH2O); EstPmus: Estimated pressure exerted by the respiratory muscles (cmH2O).
The importance of the MP concept is that it integrates all the contributors to lung injury. In animal experiments where the delivered MP remained constant but applied in different manners (RR, VT, PEEP), the resulting degree of lung injury was equivalent,
74
with profound VILI experienced in piglets with healthy lungs ventilated to a MP of >12 J/min.
75
The most important implications are that: (1) Low tidal volume ventilation (<6 mL/kg IBW) may still be injurious if it is associated with high driving pressures (e.g., >15 cmH2O).
76
(2) Respiratory rate is an important modifier of the risk of MP and mortality in ARDS. (3) PEEP contributes to MP and therefore may also contribute to lung injury, however appropriately set PEEP may reduce the driving pressure and distribute the applied MP more homogenously thereby reducing its impact.
76
A ‘safe’ threshold for mechanical power is unclear, 77 but higher MP correlates with mortality during invasive ventilation, 78 ARDS 79 and during ECMO. 80 It is likely that the same mechanical power is more injurious when applied to a smaller functional lung volume and for a longer duration.81–84 Conversely, an excessively cautious approach to mechanical ventilation during ECMO (for example, a MP of 0) will quickly result in total lung collapse. Although unproven, given that severe lung injury is the primary indication for VV ECMO, our practice is to target a MP 6–10 J/min (around 2–3 times that of normal breathing). For example, our usual baseline setting on the ventilator is 10 cmH2O PEEP, a driving pressure of 10 cmH2O and a respiratory rate of 10 prior to assessment. Even if there is minimal minute ventilation with such an approach, the priority in the early phase is in protecting the lung by managing gas exchange extracorporeally.
Ventilator assessments of recruitability and overdistension
During tidal ventilation, lung units may open in inspiration and then close in expiration. This is referred to as intratidal recruitment and may be harmful (‘atelectotrauma’).85,86 Higher PEEP or mean airway pressure may provide sustained recruitment of previously closed lung units. Optimal PEEP may be assessed by finding the point at which compliance is optimal, however as compliance is normally measured at end inspiration, it may increase with both intratidal and sustained recruitment. Assessing optimal PEEP using oxygenation may also be undertaken, however this can also be misleading as PaO2 may rise due to the haemodynamic effects of PEEP as well as its effects on recruitment.
Given the potential harm from aggressive recruitment
87
or excessive PEEP,
74
alternative methods to assess lung ‘recruitability’ are required. Multiple parameters from a PV loop can be used to evaluate recruitability (panel C, Figure 3). The difference in volume between the inspiratory and expiratory limbs of a PV loop is referred to as hysteresis and reflects the static properties of the lung at low flow. Hysteresis represents the energy transfer during inspiration which is not recovered from elastic recoil-energy and is tidally dissipated into the lung tissue.
88
In general, a large hysteresis level is predictive of recruitability with higher PEEP.
86
This can also be quantitatively assessed at the bedside-for example the normalised maximal distance (NMD). This quantifies the maximal hysteresis volume between inspiration and expiration divided by the total volume insufflated during the loop (e.g. from 5 to 45 cmH2O) (Figure 2). An NMD >41% is predictive for recruitment86,89 and suggests consideration of a higher PEEP or mean airway pressure strategy. Up to ∼25% of patients with ARDS have complete airway closure below a certain airway pressure.
90
This can be assessed during a low flow PV Loop (Figure 3) and setting PEEP above this level will minimise intratidal recruitment. Ventilator assessments to personalise ventilation during ECMO.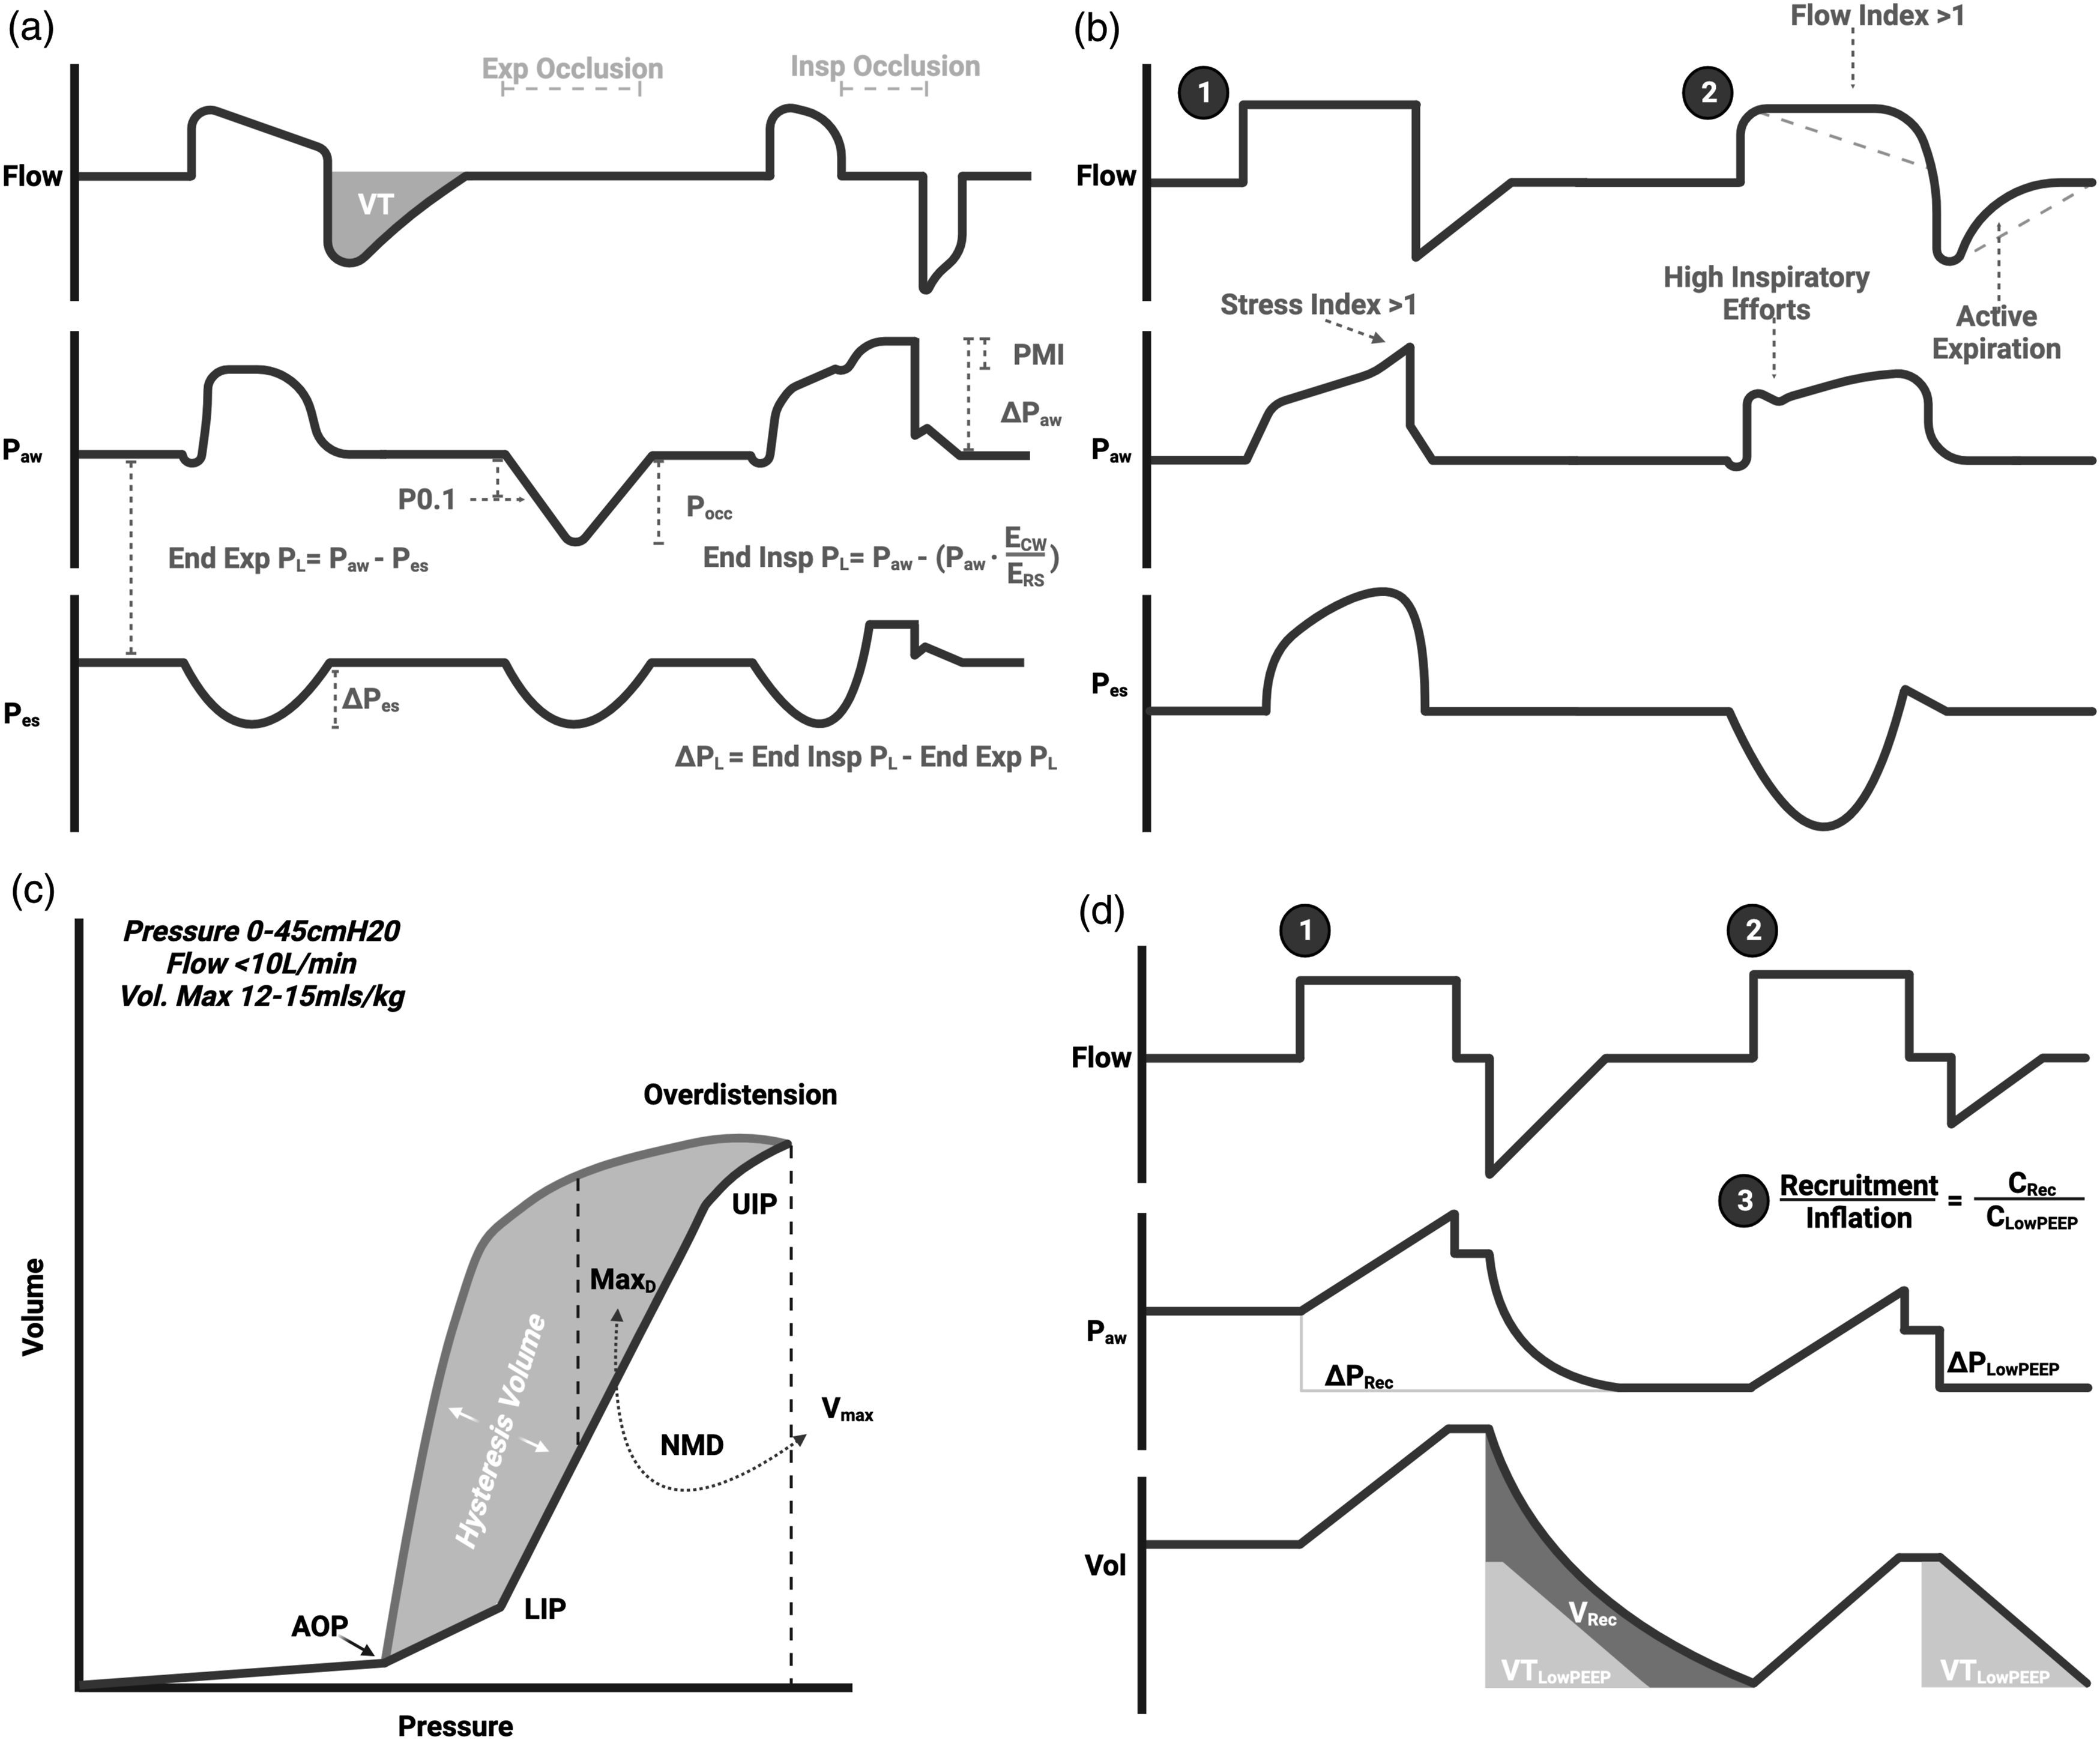
The ‘recruitment to inflation ratio’ (R:I) has been validated as a marker of recruitability by CT and the low flow PV loop.89,91 The principle is that if a change in PEEP leads to recruitment of previously closed lung units the compliance of the recruited volume will be higher than if the added ‘PEEP volume’ is distributed across the same lung units which are already open at low PEEP (potentially causing overdistension). In a passively ventilated patient, the R:I is measured by dividing the compliance of the volume recruited by PEEP (measured as the expired volume when PEEP is reduced) by the compliance at low PEEP (Table 4 and Panel D Figure 3). An R:I >0.5 is suggestive of recruitability. This simple manoeuvre can be applied with any ICU ventilator. 91
When using volume control with constant inspiratory flow, visualisation of the pressure curve can identify a positive concavity at end inspiration suggestive of overdistension (an elevated ‘stress index’ (panel B Figure 3). 92 Conversely, a negative concavity suggests the presence of intratidal recruitment (an increase in PEEP may prevent this). The stress index is only measurable with constant inspiratory flow and experimental studies suggest it is sensitive to changing chest wall elastance as well as mechanical ventilation settings.93,94 Frank overdistension can also be seen with ‘beaking’ on a PV loop but its absence does not exclude regional overdistension as overdistension can co-exist with recruitment at a given pressure level.
These tools are extremely useful in optimising PEEP at the bedside and can be carried out over time as lung mechanics change.
Invasive assessment of transpulmonary pressure
Lung stress is generated by the ‘transpulmonary pressure’, not the airway pressure. 95 The transpulmonary pressure (PL) is defined as the pressure applied from the airway, across the alveoli to the pleural space (e.g. PL=Paw – Ppleura). This is particularly pertinent at extremes of chest wall elastance (e.g. obesity). The gold standard to assess the transpulmonary pressure at the bedside is the use of an oesophageal balloon catheter to measure oesophageal pressure (Pes). Pes is a useful surrogate for the Ppleura which can quantify the transpulmonary pressure and guide ventilation.
The transpulmonary pressure at end inspiration can be measured in two complementary ways95,96 (Table 4): a. The direct method b. The elastance derived method
The direct PL best approximates the Ppleura in basal lung segments close to the horizontal plane of the catheter and is helpful for determining optimal PEEP. The elastance derived PL better approximates the Ppleura in non-dependent regions and is helpful to assess the risk of overdistension. 97 A maximal inspiratory PL of 20–25 cmH2O, ideally measured using the elastance derived method, has been suggested and limiting transpulmonary driving pressure (ΔPL) to maximum 10–12 cmH2O in patients with lung injury is prudent.95–99 Similar to the targeting of MP, a more conservative approach may be appropriate during ECMO. The transpulmonary pressure can also be used to develop a transpulmonary low-flow PV loop in a similar manner to that described above.
Imaging to assess recruitability, overdistension and heterogeneity
The most important consideration when using MP or PL to guide ventilation is to place the measurements in context. The applied MP is distributed only to the smaller functional lung volume-the ‘baby lung’- in ARDS and it is in these regions where intense inflammatory activity can be detected with CT positron emission tomography. 100 Knowing the functional residual capacity for individual patients would be extremely useful as a means of quantifying the ‘baby lung’. Unfortunately, the classical tools to assess FRC (or most commonly, End Expiratory Lung Volume (EELV) when patients are receiving PEEP) such as nitrogen wash-out/wash-in (EELV) or helium dilution (true FRC) have their assumptions violated- or are impractical-during extracorporeal gas exchange. 101 Furthermore, regional collapse distorts the normal extracellular architecture and acts as a local ‘stress raiser’ which magnifies the forces to surrounding alveoli. Therefore, although the PL is reflective of the functional lung volume as both are dependent on the elastance of the lung and chest wall, understanding the heterogeneity of lung injury is crucial to judge the regional risks of using a ‘global’ PL.
CT represents the clinical gold standard lung anatomical assessment and for measuring EELV in mechanically ventilated patients. 102 Hounsfield unit filters can be used to identify voxels of complete collapse, partial aeration, normal aeration and hyperinflation in a quantitative manner.103,104 However, this requires post-processing and filtering to achieve accurate results. Quantitative CT can be acquired at different airway pressure levels to assess the recruitability of lung and guide early ventilation strategies during ECMO. 105 There is emerging literature to suggest that AI-derived automated quantitative CT analysis is feasible. 106 CT scanning requires patient transfer, radiation exposure and, as lung mechanics and pathology evolve over time, can only provide an impression at the time of image acquisition. Nevertheless, our practice is to acquire thoracic CT at 5 and 45 cmH2O following cannulation for ECMO to evaluate the underlying parenchyma, assess the functional lung volume and estimate recruitability.
Electrical impedance tomography (EIT) is a non-ionising, continuous, semi-quantitative approach to imaging the lung which can be applied at the bedside. 107 During EIT changes in impedance provide a real time assessment of regional ventilation and heterogeneity. Hyperinflated and collapsed regions can be identified and PEEP titrated to reduce heterogeneity, which is not necessarily the PEEP providing the optimal compliance.108–111 EIT derived optimal PEEP varies significantly across patients supported with ECMO. 110 Changes in EELV can be estimated by evaluating changes in end-expiratory lung impedance in response to interventions. Although changes in impedance correlate with changes in EELV, other interventions including the administration of a fluid bolus can also be also change impedance.112,113 Limitations of EIT are its spatial resolution (restricted to one 10–18 cm horizontal plane band) and for many more advanced techniques, offline post-processing of imaging is required.
Lung ultrasound (LUS) approaches CT for diagnostic accuracy in categorising acute respiratory failure. 114 The regional extent of peripheral consolidation can be assessed and pleural effusions identified easily. The number of regions with 2 or more B lines (vertical linear artefacts reflecting transmission of the signal from the pleural line abnormally through parenchyma with increased fluid/air ratio) correlates well with the extravascular lung water (EVLW) measurements obtained through transpulmonary thermodilution in conventionally supported patients.115–117 A LUS score can be generated from 6 regions in each hemithorax (a score of 1 for normal findings, 2 for >2 B lines, 3 for coalesced B lines and 4 for complete loss of aeration ‘hepatisation’). 118 This is a particularly useful technique during ECMO as measuring EVLW through thermodilution is inaccurate. 119 LUS can be repeated over time at the bedside to obtain prognostic information and provide a therapeutic target. LUS can be used to assess regional ventilation and aeration after ventilatory changes. For example, an improvement in the LUS score in response to PEEP correlates well with changes in PaO2 and recruitment measured by a P/V Loop. 120 At present LUS requires experience and is limited to assessing peripheral lung, however artificial intelligence is being explored and automated B line quantification at the bedside is already possible.121–123 LUS and EIT give different, complimentary information and their use in combination may add value at the bedside. 124
Monitoring spontaneous breathing during VV ECMO
There are benefits to allowing spontaneous efforts in severe lung injury – to prevent respiratory muscle weakness and reduce the requirements for sedation and neuromuscular blockade. However, spontaneous breathing brings a new set of challenges during ECMO. Respiratory drive, the intensity of the output of the respiratory centres, adjusts the output of the respiratory muscles and hence, minute ventilation to achieve a certain PaCO2 ‘target’, the so-called set point.125,126 For example, during exercise, respiratory drive and minute ventilation increase, leading to a VO2 and VCO2 rise whilst PaCO2 remains stable leading to isocapnic hyperpnea. 127 The set point of the respiratory system is influenced by many factors including inflammation, hypoxia, lung mechanoceptor stimulation, pain or sedation,125,126 and not solely on pH. In the ECMO supported patient making spontaneous efforts, the pH/PaCO2 alone is not a reliable target as changes in the VCO2ML and VCO2NL interact. If for example the VCO2ML is inappropriately decreased, respiratory drive and hence spontaneous effort will increase to maintain the PaCO2 set point, which may occur at the cost of enormous transpulmonary pressures and risk of further lung injury. 128 Conversely, if VCO2ML is excessive, respiratory drive decreases resulting in low respiratory effort which may predispose to muscle atrophy or intermittent apnoea.129,130 Avoiding excessive or extremely low respiratory drive or effort is therefore increasingly proposed as a goal in acute respiratory failure. 131
Monitoring respiratory drive
The simplest clinical assessment of respiratory drive is to ask the patient. The 11-point modified Borg dyspnoea scale functions similarly to a visual analogue scale 132 and is well validated in conventional ventilation133,134 and ECMO135–137 The Borg score is also readily repeated allowing changes in native lung and membrane function to be tracked. Most ECMO-supported patients are not able to self-report dyspnoea and so this must be inferred by other means. Although there is emerging interest in techniques such as surface EMG of the intercostal muscles,138,139 these are not widely available and can be affected by electrical noise. Using a gastro-oesophageal catheter, the electrical activity of the diaphragm can be measured which correlates with respiratory drive.130,140
All ICU ventilators record the P0.1 (pressure reached during a transient valve occlusion at 100ms following the onset of inspiration), which is an acceptable surrogate of respiratory drive during mechanical ventilation. 141 At rest, in health a value of −0.5 to −1.5 cmH2O is obtained and an increasingly negative P0.1 (especially less than -5cmH2O) correlates with increased drive. 131 However, not all ventilators derive the value in the same manner which reduces the ability to provide absolute limits.142,143
Monitoring respiratory effort
There is increasing interest how to manage patient self-induced lung injury (P-SILI)131,144 whereby large spontaneous transpulmonary pressures in injured lungs with regional heterogeneities and high inspiratory effort worsens lung injury, especially as high spontaneous efforts generate a strong dorsal-ventral pressure. 145
Measuring oesophageal pressure (Pes) is the gold standard to quantify inspiratory efforts: changes in Pes reflect changes in the Ppleura, which are proportional to the effort of the respiratory muscles (Pmus). Studies suggests that in patients receiving respiratory support, including ECMO, sustained ΔPes of around >15 cmH2O are associated with exhaustion and treatment failure.29,146–149 Further, the total ΔPL will include both the patient and ventilator contributions and means that potentially injurious pressure swings can be identified.95,96,145 The Pmus can be calculated using the ΔPes and calculation of the elastic recoil pressure of the chest wall-if chest wall elastance has been measured during passive conditions (or alternatively estimated from population data). An oesophageal catheter can also be coupled with gastric manometry to detect and quantify expiratory efforts. We recommend insertion of an oesophageal catheter to measure the ΔPes,, PL and Pmus in patients making inspiratory efforts, either routinely or targeted according to non-invasive assessments of effort.
Several non-invasive manoeuvres on any ventilator (panel A Figure 3) can be used intermittently to provide similar information to oesophageal manometry. Although these estimates of Pmus and ΔPL are imprecise, there is increasing evidence that they are very effective in identifying patients at extremes of effort (high or low). (1) The pressure muscle index (PMI) is the difference between plateau pressure and peak pressure obtained during an inspiratory hold during spontaneous breathing and correlates with inspiratory effort.
150
A rise of at least 6 cmH2O correlates with high inspiratory efforts or active expiration. A PMI of <1 cmH2O correlates with minimal spontaneous efforts and suggests that mechanical support, including ECMO can be weaned. (2) The occlusion pressure (Pocc) is the maximal negative pressure generated at zero flow during inspiratory efforts against a closed valve (during an expiratory hold). This negative pressure should be inclusive of the change from total PEEP and can be used to estimate Pmus and ΔPL associated with inspiratory efforts (Table 4).151–153 The P0.1 can also be used to estimate Pmus and ΔPL but it is less accurate than the Pocc.
153
Estimated ΔPL using Pocc has been validated for a very high ‘excessive’ threshold of ΔPL >20 in the literature.151–153 In practice, for patients supported with ECMO we generally target a lower ΔPL of <10–12 cmH2O, although the accuracy of Pocc has not yet been validated for this lower target range. (3) Careful visual assessment of flow curves during assisted ventilation can also be helpful in assessing high inspiratory effort (panel B Figure 3).
154
The benefit of undertaking these measurements is that high or low work can be managed by changing the ECMO and mechanical ventilation to optimally support patients and hopefully reduce the risk of P-SILI.
Patients with respiratory muscle weakness may have dissociated respiratory drive and effort if they are unable to generate the forces demanded by their respiratory centres. Measuring the maximal negative inspiratory force (NIF) the patient can generate either by asking the patient to make maximal effort during an expiratory hold, or in sedated patients maintaining an expiratory hold until the largest swing in Pes or Paw is obtained can be useful. 155 A NIF of <−15 to −25 cmH2O has been shown to correlate with successful weaning from mechanical ventilation. 156 However, once a maximal NIF is known, changes in effort can be indexed against their maximum achievable effort to help judge the impact of changes in ECMO or mechanical ventilatory support.
The above tools can help characterise the magnitude of forces that are being generated by spontaneous effort. High spontaneous effort can result in dorsal hyperinflation which can be detected with EIT.107,145 Pendelluft, intra-tidal gas movement between lung units with different time constants, is much more likely with high inspiratory efforts and can be qualitatively detected with EIT as temporally distinct changes in regional ventilation.157–160 EIT can be repeated following changes to ECMO or ventilatory support to assess the impact of any changes.
As well as generating regional lung strain, P-SILI can result in accumulation of EVLW due to a transvascular pressure gradient generated by high inspiratory efforts. 144 Acute changes in EVLW lead to small but detectable changes in plasma proteins and cardiac enzymes after a change in respiratory support including changes in the haematocrit and brain natriuretic peptide.161,162 Dynamic changes in EVLW can also be monitored with serial LUS. 116
Multimodal monitoring during VV ECMO
In Figure 4 we outline an approach to multimodal monitoring during VV ECMO. In our practice, this includes a routine recruitment thoracic CT following cannulation, use of low flow PV loops and R:I to decide upon a higher or lower PEEP/mean airway pressure. We target an MP <6–10 J/min with a lower limit where the functional lung volumes are especially low or the lung injury is very heterogenous. During ECMO we advise routinely quantifying the VO2ML, VCO2ML, the VCO2NL and the oxygen challenge test daily. In selected patients, LUS and EIT can be used to optimise and monitor the response to mechanical ventilation settings. Especially at extremes of chest wall elastance, we consider invasive measurement of the PL very helpful as an ongoing guide to monitoring. As patients improve we consider relaxing sedation and transitioning to an assisted mode of ventilation in order to prevent muscle weakness and hasten recovery. During the spontaneous phase, we routinely monitor the P0.1, Pocc and PMI in all patients and consider oesophageal manometry where persistent high efforts are suspected. The Pocc and P0.1 can be used to estimate the ΔPL as has been recently described and validated although the Pocc is more accurate.151,153 In awake patients, self-reported dyspnoea is a helpful adjunct to these measures. Depending on the individual assessment, we use these tools to guide interventions to correct high or low efforts, aiming for a balance of low MP (<6–10 J/min), low PL (End inspiratory PL <20 cmH2O or EstΔPL <22 cmH2O, measured ΔPL <10–12 cmH2O and certainly <20 cmH2O) and moderate, sustainable inspiratory efforts. During a weaning trial which may lead to risks of P-SILI in the assisted patient, we undertake a careful assessment of these factors at each step of a standardised approach to weaning which we have previously described.163,164 An approach to monitoring the native lung during VV ECMO.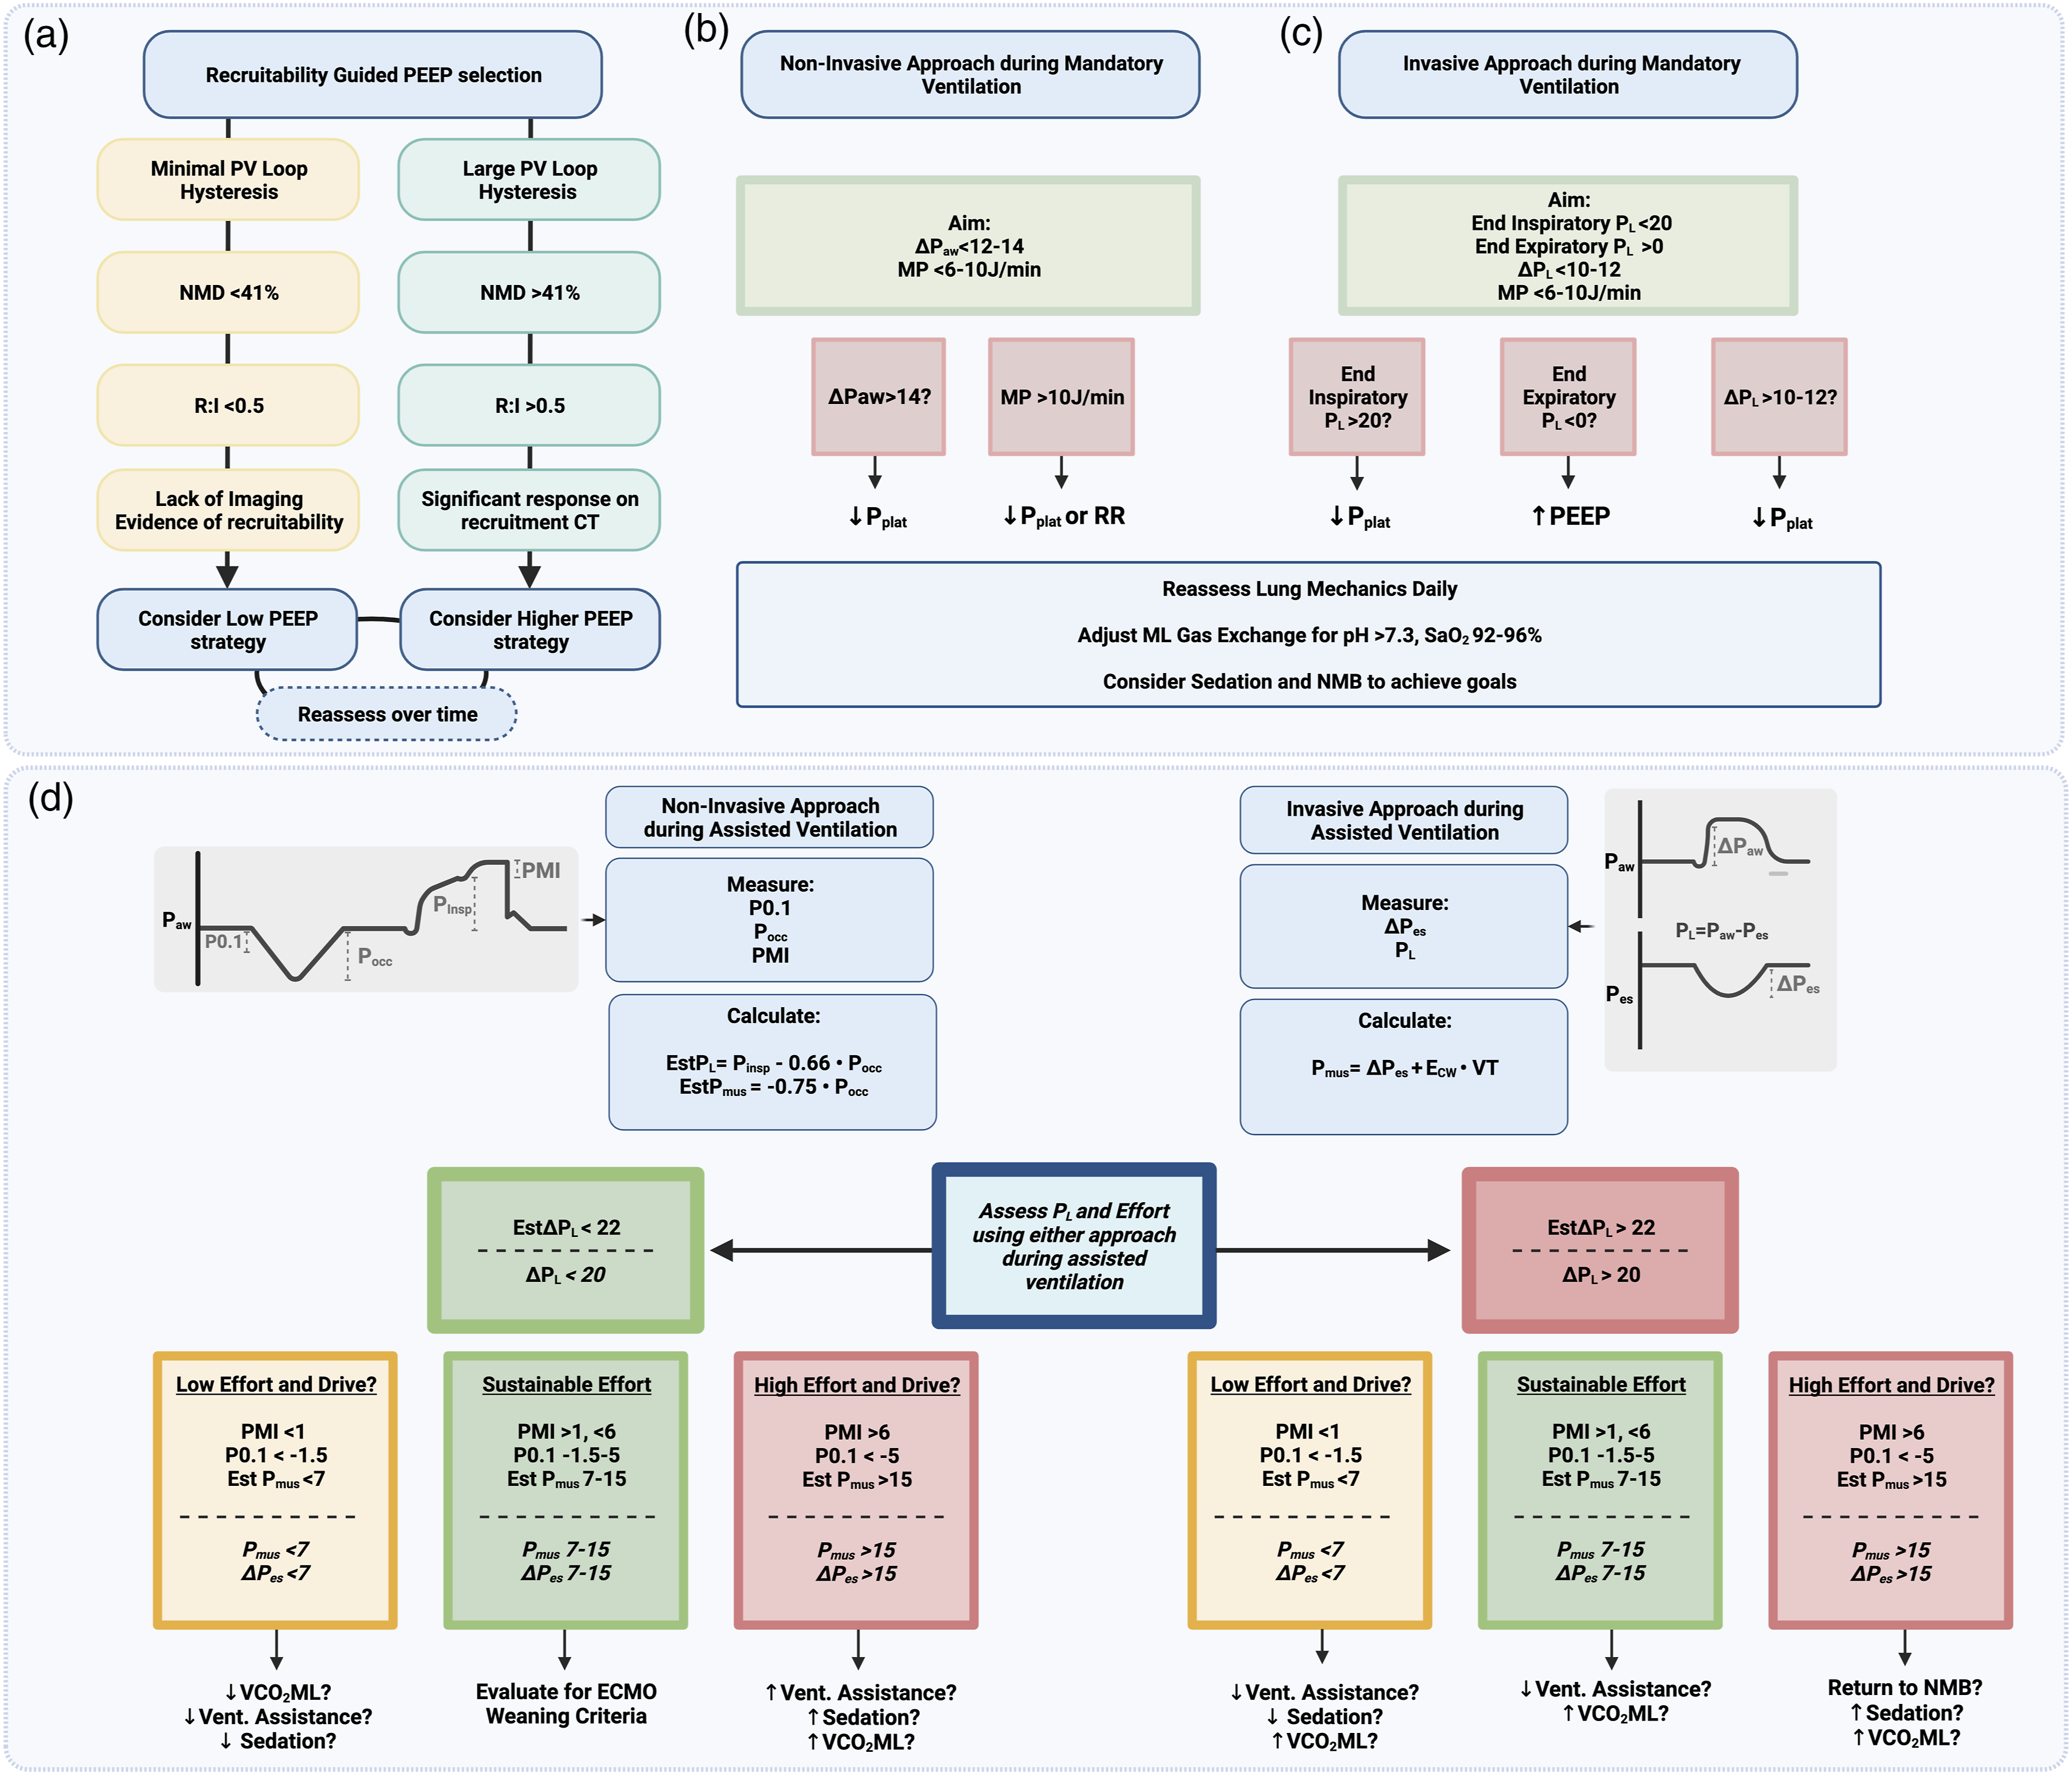
Future steps
The increasing interest in personalising ventilation is likely to lead to more complex automated assessments derived from the ventilator being integrated with non-invasive imaging at the bedside over time. New devices under development can aid the assessment of recruitability 165 and overdistension 166 at the bedside by measuring intratidal fluctuations in PaO2. Other studies have used electroencephalography to directly measure oscillatory neural activity in response to inspiratory loading or deliberate induction of asynchrony.167–170 Short-term changes in ventilation which increase or decrease mechanical power during ECMO are associated with dynamic variations in blood or broncho-alveolar lavage derived inflammatory cytokines and metabolites including interleukins 1, 6, tissue necrosis factor alpha and soluble receptor for advanced glycation end products.171–173 This raises the prospect that in the future individual biological signals of harm, rather than epidemiologically based indices of risk could be monitored as respiratory support is changed.
Conclusions
Extracorporeal membrane oxygenation is lifesaving but adds to the complexity of monitoring the critically ill patient with a dual physiology-that of the native and MLs. Understanding pertinent aspects of O2 and CO2 carriage and transfer are essential to interpret the information which can be derived from blood gas analysis of different blood compartments and clinical monitoring of different tissues. Assessing the adequacy of overall gas exchange for these patients may be challenging and is best judged by a clinician holistically integrating a range of different inputs. The most important therapeutic effect of VV ECMO is in enabling a reduction in the MP delivered to the injured lung. It is crucial to assess the implications of a change in ventilation for the individual patient’s MP, placing this in the context of their lung mechanics, transpulmonary pressure, functional lung volumes and lung heterogeneity. Spontaneous breathing of patients as they recover has advantages, but it is important to understand that blood gases, tidal volumes and respiratory rates are not sufficient to monitor high efforts, distress and P-SILI. With an understanding of the underlying physiology and the limitations of different tools, multimodal monitoring is key to personalising respiratory support during ECMO.
Footnotes
Acknowledgements
All diagrams were prepared with Biorender
Declaration of conflicting interests
The author(s) declared no potential conflicts of interest with respect to the research, authorship, and/or publication of this article.
Funding
The author(s) received no financial support for the research, authorship, and/or publication of this article.
Ethical statement
Guarantor
NB.
Contributorship
PDC wrote the first manuscript draft and prepared all of the figures. All authors reviewed and edited the final manuscript.