
Abstract
Introduction
The performance of an oxygenator, as found in literature, is evaluated according to protocols that define standard values of the gas content in the inlet blood. However, when dealing with simulations of lung insufficiency, a more extensive evaluation is needed. This work aims to investigate and assess the gas exchange performance of an oxygenator for different input values of gas content in blood.
Methods
Three commercially available oxygenators with different membrane surfaces were investigated in a mock loop for three blood flow rates (0.5l/min, 1l/min, and 5l/min) and two gas-to-blood ratios (1:1, and 15:1). The initial CO2 and O2 partial pressures (pCO2 and pO2) in blood were set to ≥ 100 mmHg and ≤10 mmHg, respectively. For each ratio, the efficiency, defined as the ratio between the difference of pressure inlet and outlet and the inlet pCO2 (pCO2(i)), was calculated.
Results
The CO2 elimination in an oxygenator was higher for higher pCO2(i). While for a pCO2(i) of 100 mmHg, an oxygenator eliminated 80 mmHg, the same oxygenator at the same conditions eliminated 5 mmHg CO2 when pCO2(i) was 10 mmHg. The efficiency of the oxygenator decreased from 76,9% to 49,5%. For simulation reasons, the relation between the pCO2(i) and outlet (pCO2(o)) for each oxygenator at different blood and gas flows, was described as an exponential formula.
Conclusion
The performance of an oxygenator in terms of CO2 elimination depends not only on the blood and gas flow, but also on the initial pCO2 value. This dependence is crucial for simulation studies in the future.
Introduction
Pulmonary diseases are the third cause of death worldwide. 1 Until now, only short-term solutions have been used to help patients affected by pulmonary diseases.2–4 Artificial long-term support for the lungs could ensure the survival of patients and improve their quality of life.5,6 However, not only the characteristics of such a solution are not defined yet but also the perfusion route is still unclear. 7 As different connections of lung support show different performances in terms of gas exchange, it is necessary to conduct mathematical simulations to evaluate each of them individually.
In order to better understand the properties concerning the gas exchange along the membrane in possible connections, our team has been working on in vitro and mathematical simulations of the oxygenator support of an insufficient lung for three different configurations. 8 However, in order to simulate such support, it is necessary to know and understand the performance of a simple oxygenator, especially regarding carbon dioxide (CO2) elimination.
The performance of an oxygenator, as found in literature or datasheet, is evaluated according to protocols that define standard values of the gas content in the inlet blood. 9 However, the inlet values of the gas content are rarely standard, especially when dealing with simulations of lung insufficiency. Therefore, a more extensive evaluation is needed.
Considering these limitations, this work aims to investigate, assess and document the performance of three commercially available oxygenators in terms of gas exchange for different input values of oxygen (O2) and CO2 content in blood. Furthermore, this work aims to define the dependency of the CO2 elimination from the CO2 content value of the inlet blood as a mathematical function for future numerical simulations.
Materials and methods
The performance of three commercially available oxygenators was evaluated in a mock loop with fully heparinised porcine blood. The oxygenators used were Euroset (Eurosets/Fresenius, Germany), Terumo (Terumo, Tokyo) and Hemovent (Hemovent, Germany) and they had a surface area of 1.65 m2, 2.5 m2, and 1.6 m2 respectively. The measurement circuit was subdivided into two sub-circuits as shown in Figure 1. In the left sub-circuit, the blood is pumped into the oxygenator to be tested and returns to the reservoir while in the right sub-circuit, the blood reaches a heat exchanger via roller pump 1 (S3, Stoeckert, Germany) before going back to the reservoir. The right sub-circuit is necessary in order to maintain the temperature of the blood at a physiological value of approx. 37°. The blood flow generated by the roller pump is monitored by a T110 Laboratory Tubing Research flowmeter (Transonic Systems Inc., Ithaca, USA) in the left sub-circuit. Sensors for monitoring the system pressure and three-way taps for taking blood samples are located upstream and downstream of the test oxygenator. However, due to practicability, the schematic illustration differs from the taken photo in terms of the positions of the subcircuits. Graphical representation and image of the mock loop used for the measurements. The open circuit was used to obtain the initial values of pO2 and pCO2. Once the initial conditions were reached, the oxygenator was inflated with air and the blood was circulated in the closed circuit back to the reservoir.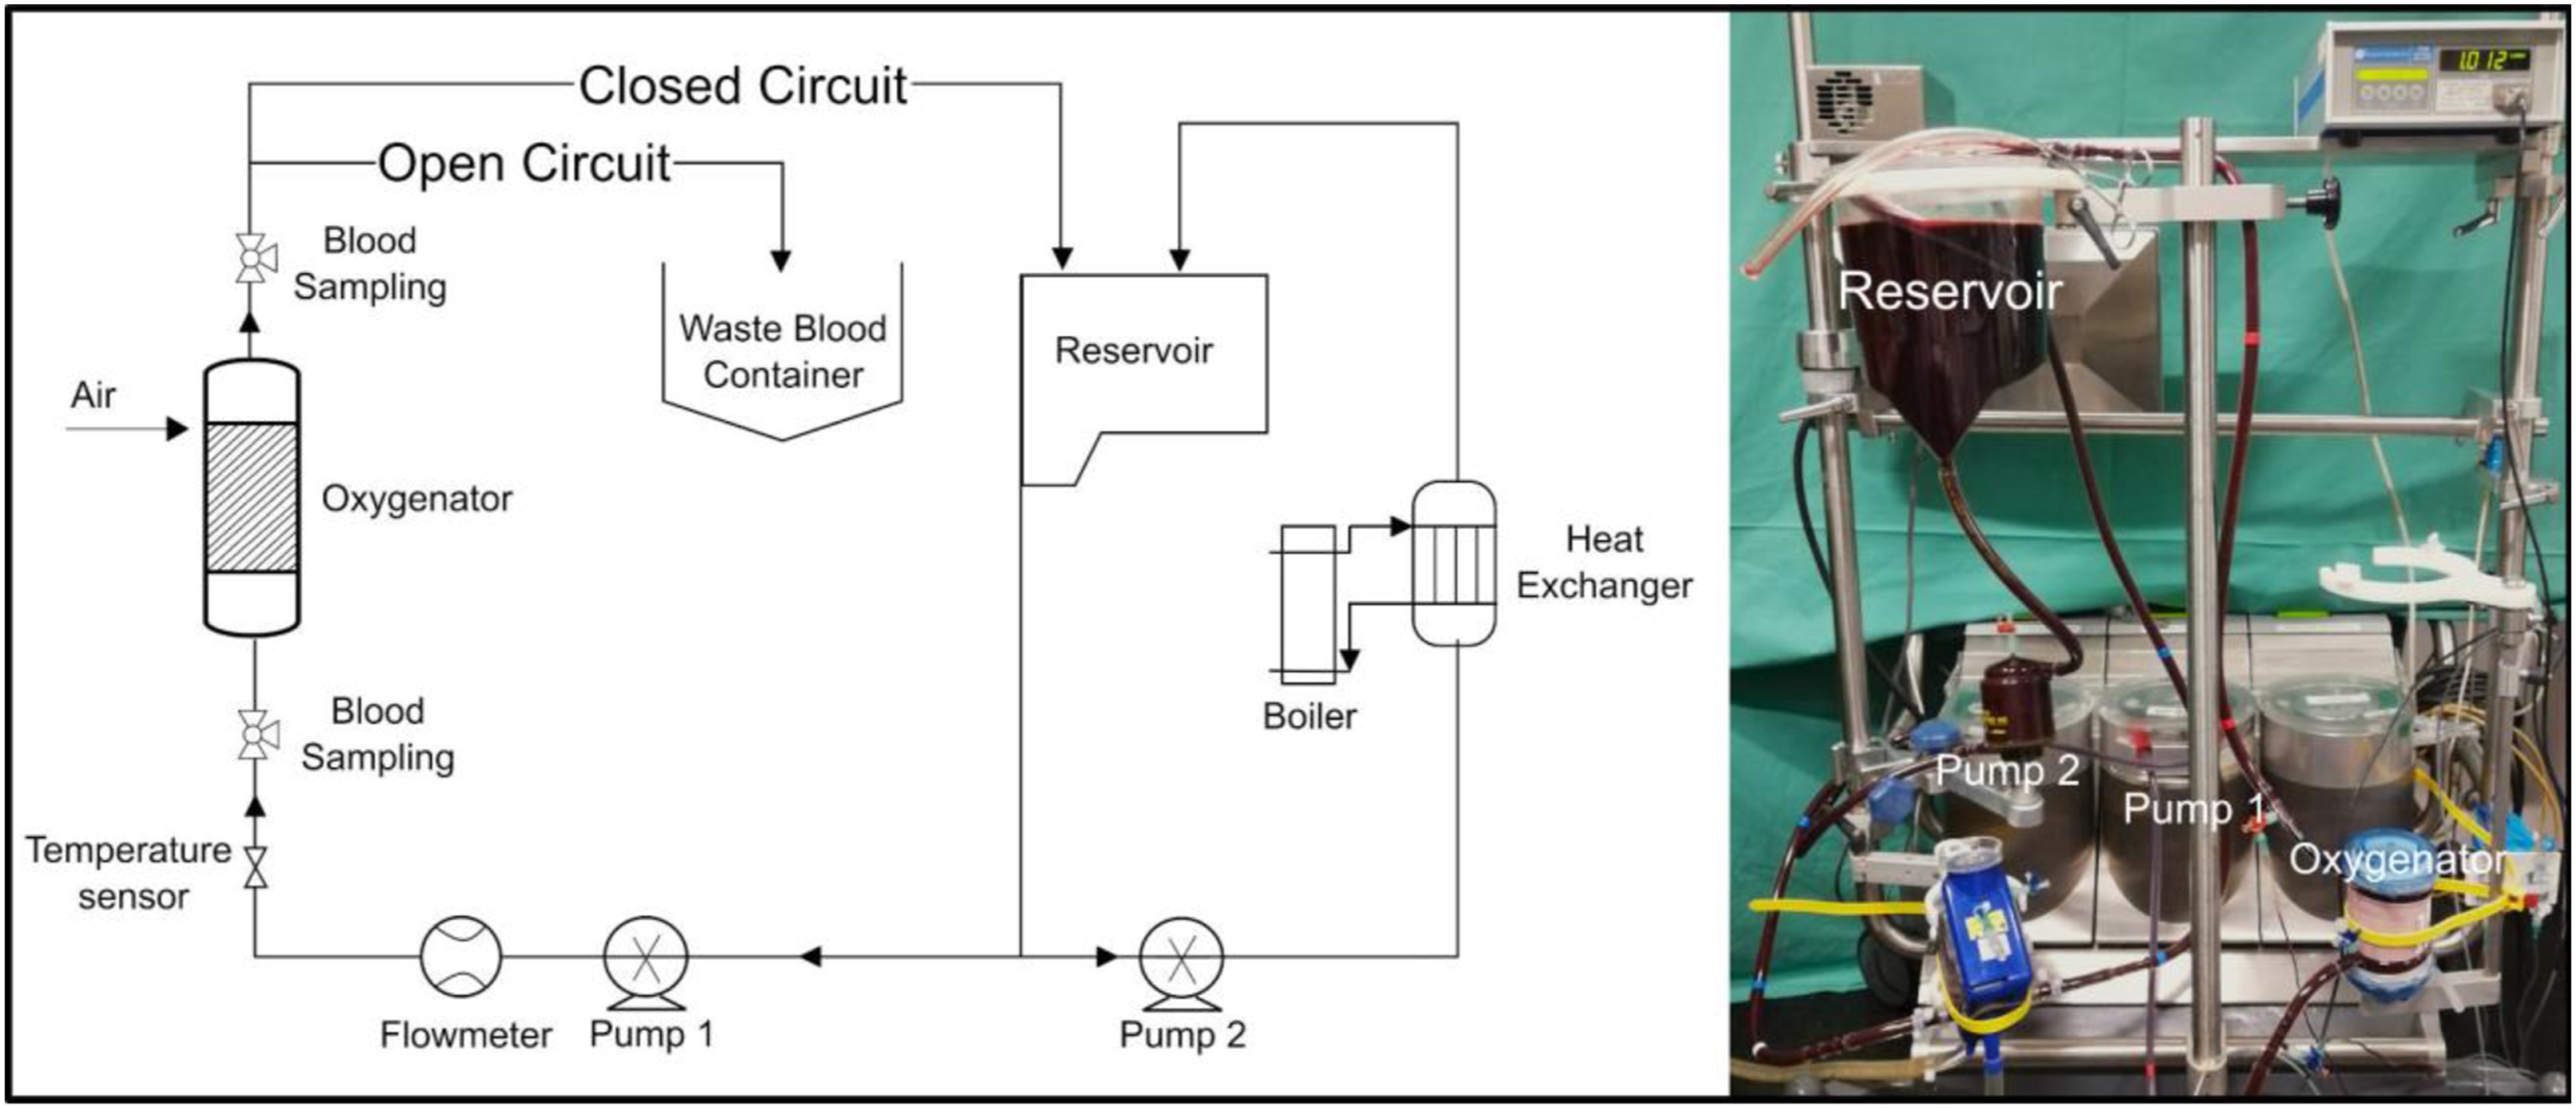
The performance of the oxygenator was measured at three different blood flows (0.5 L/min, 1 L/min and 5 L/min) and two blood-gas ratios (1:1 and 15:1). For the blood flow rate of 5 L/min, a 15:1 blood-gas ratio would have required a high gas flow rate of 75 L/min. For this reason, the blood-gas ratio investigated was reduced to 5:1. The measurements of the oxygenator performance were carried out for the decreasing values of CO2 and O2 partial pressure (pCO2 and pO2) in the inlet blood starting from a pCO2 ≥ 100 mmHg and pO2 ≤ 10 mmHg in the blood circuit. The initial pCO2 and pO2 values were reached by applying a mixture of nitrogen (N2) and CO2 (3000 mL/min and 600 mL/min, respectively) into the oxygenator. All other parameters were set in the physiological reference level according to EN DIN ISO 7199:2016. After the initial values of pCO2 and pO2 were reached, air was applied according to the chosen blood-gas ratio and samples before and after the oxygenator were taken at predefined intervals. The measurements were carried out once each with two identical models of one oxygenator type using a blood gas analyser (ABL800 Flex, Radiometer Medical ApS, 2700 Brønshøj, Denmark).
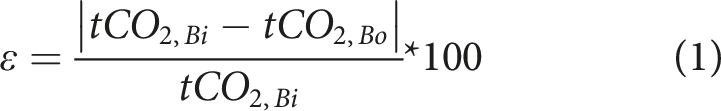
The difference between the gas partial pressures of the inlet and outlet blood was plotted as a function of the inlet partial pressure for each blood flow and each ratio. For the CO2 elimination, a corresponding function was derived, which will be used for future simulative approaches. Additionally, the efficiency of the oxygenator (ε) was calculated as the ratio between the CO2 content (tCO2) eliminated by the oxygenator and the inlet tCO2 (tCO2,Bi) (Equation (1)). The CO2 content eliminated is calculated as the difference between tCO2,Bi and outlet tCO2 (tCO2,Bo).
Statistics
The data analysis and graphical presentations were performed using MATLAB (The MathWorks Inc., Natick, MA, USA).
Results
The oxygen transfer rate (OTR) and CO2 transfer rate (CTR) were calculated for all three oxygenators and the mean value of the three, as well as the standard deviation, were plotted over time for different blood flows and blood gas ratios (Figures 2 and 3). The performance of the oxygenators, both for O2 and CO2, as shown by the magnitude of the standard deviation, is similar for low blood flows. However, the higher the blood flow through the oxygenator, the bigger the difference of the performance. Mean and standard deviation of the oxygen transfer rate of the three commercially available oxygenators at three blood flow rates and two blood gas ratios. Mean and standard deviation of the CO2 transfer rate of the three commercially available oxygenators at three blood flow rates and two blood gas ratios.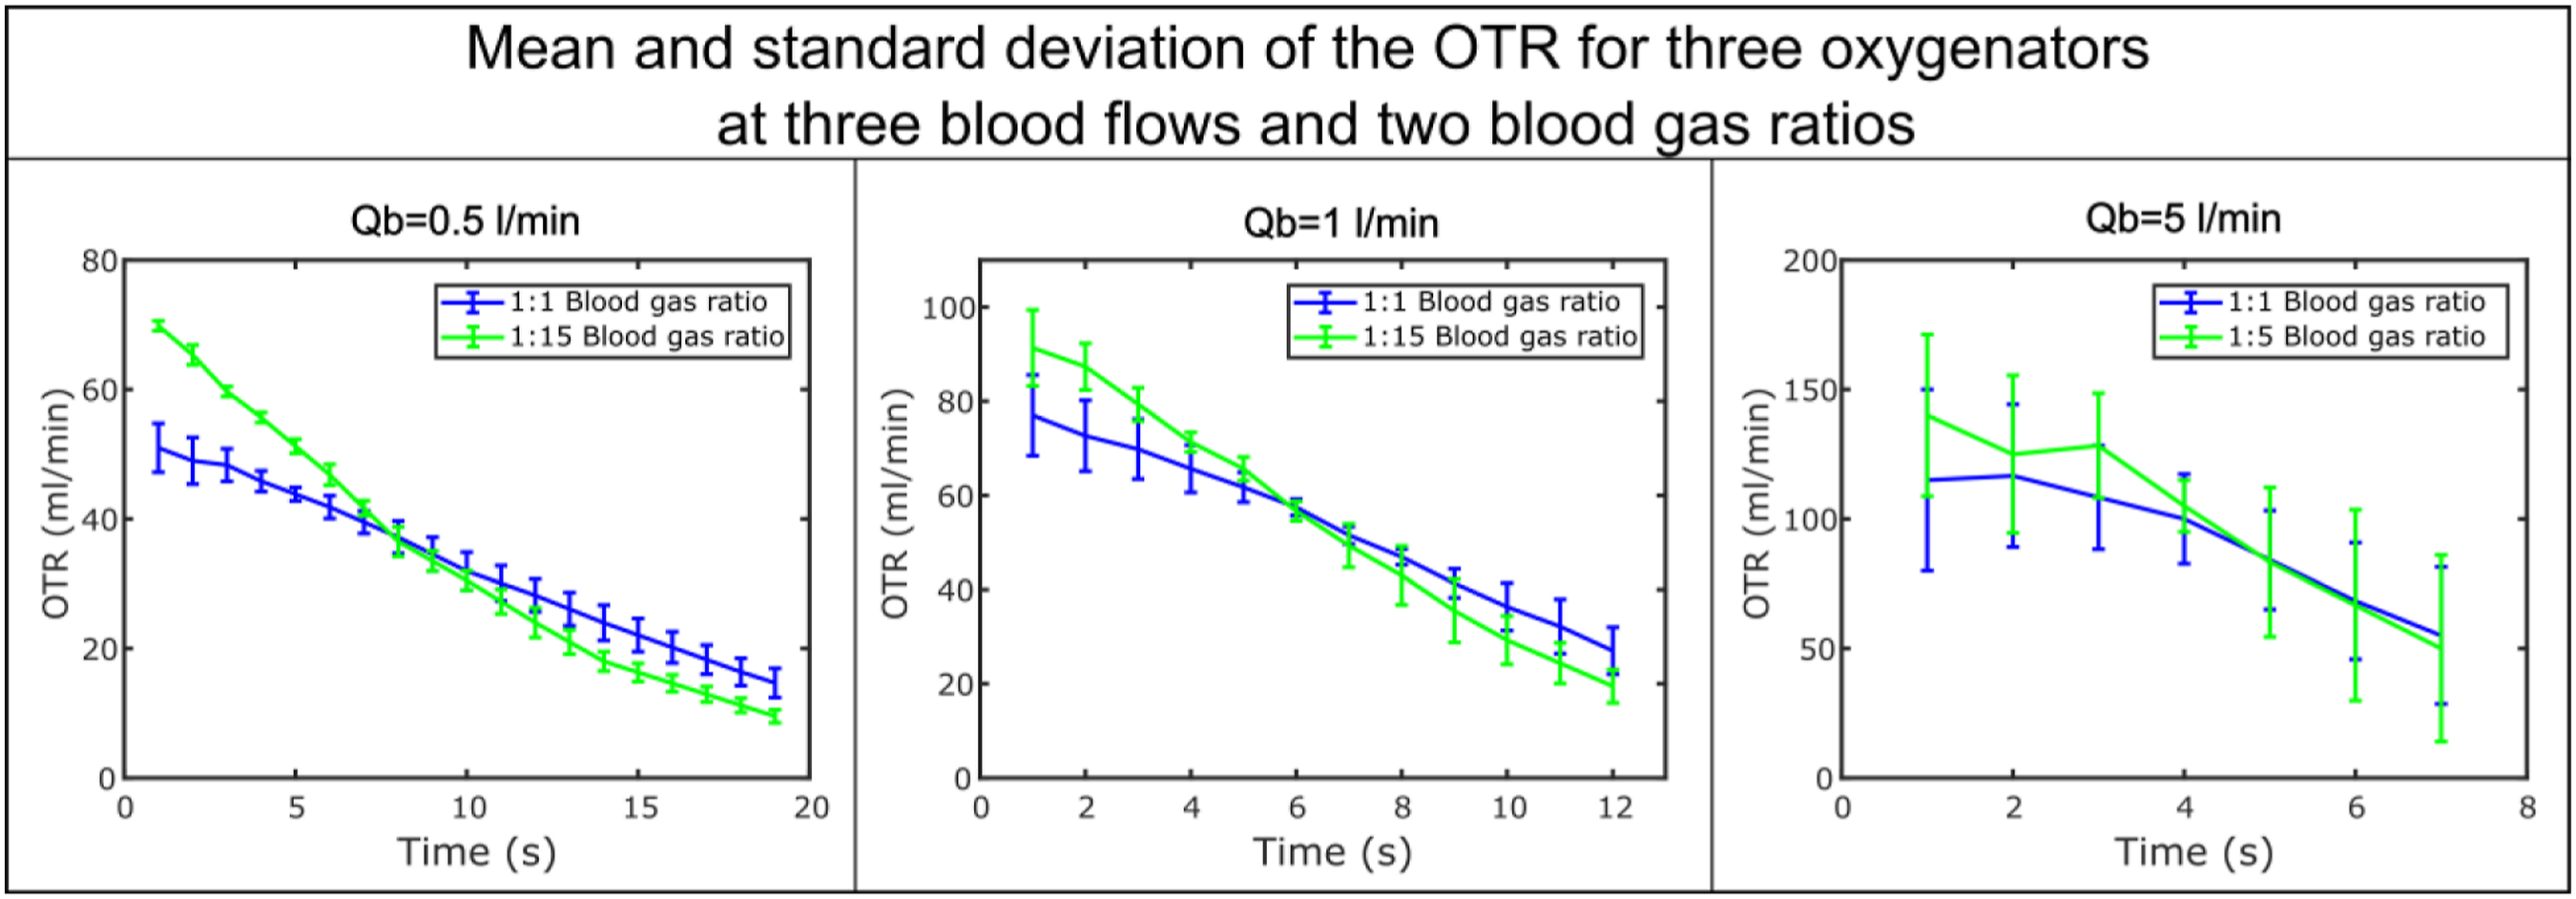
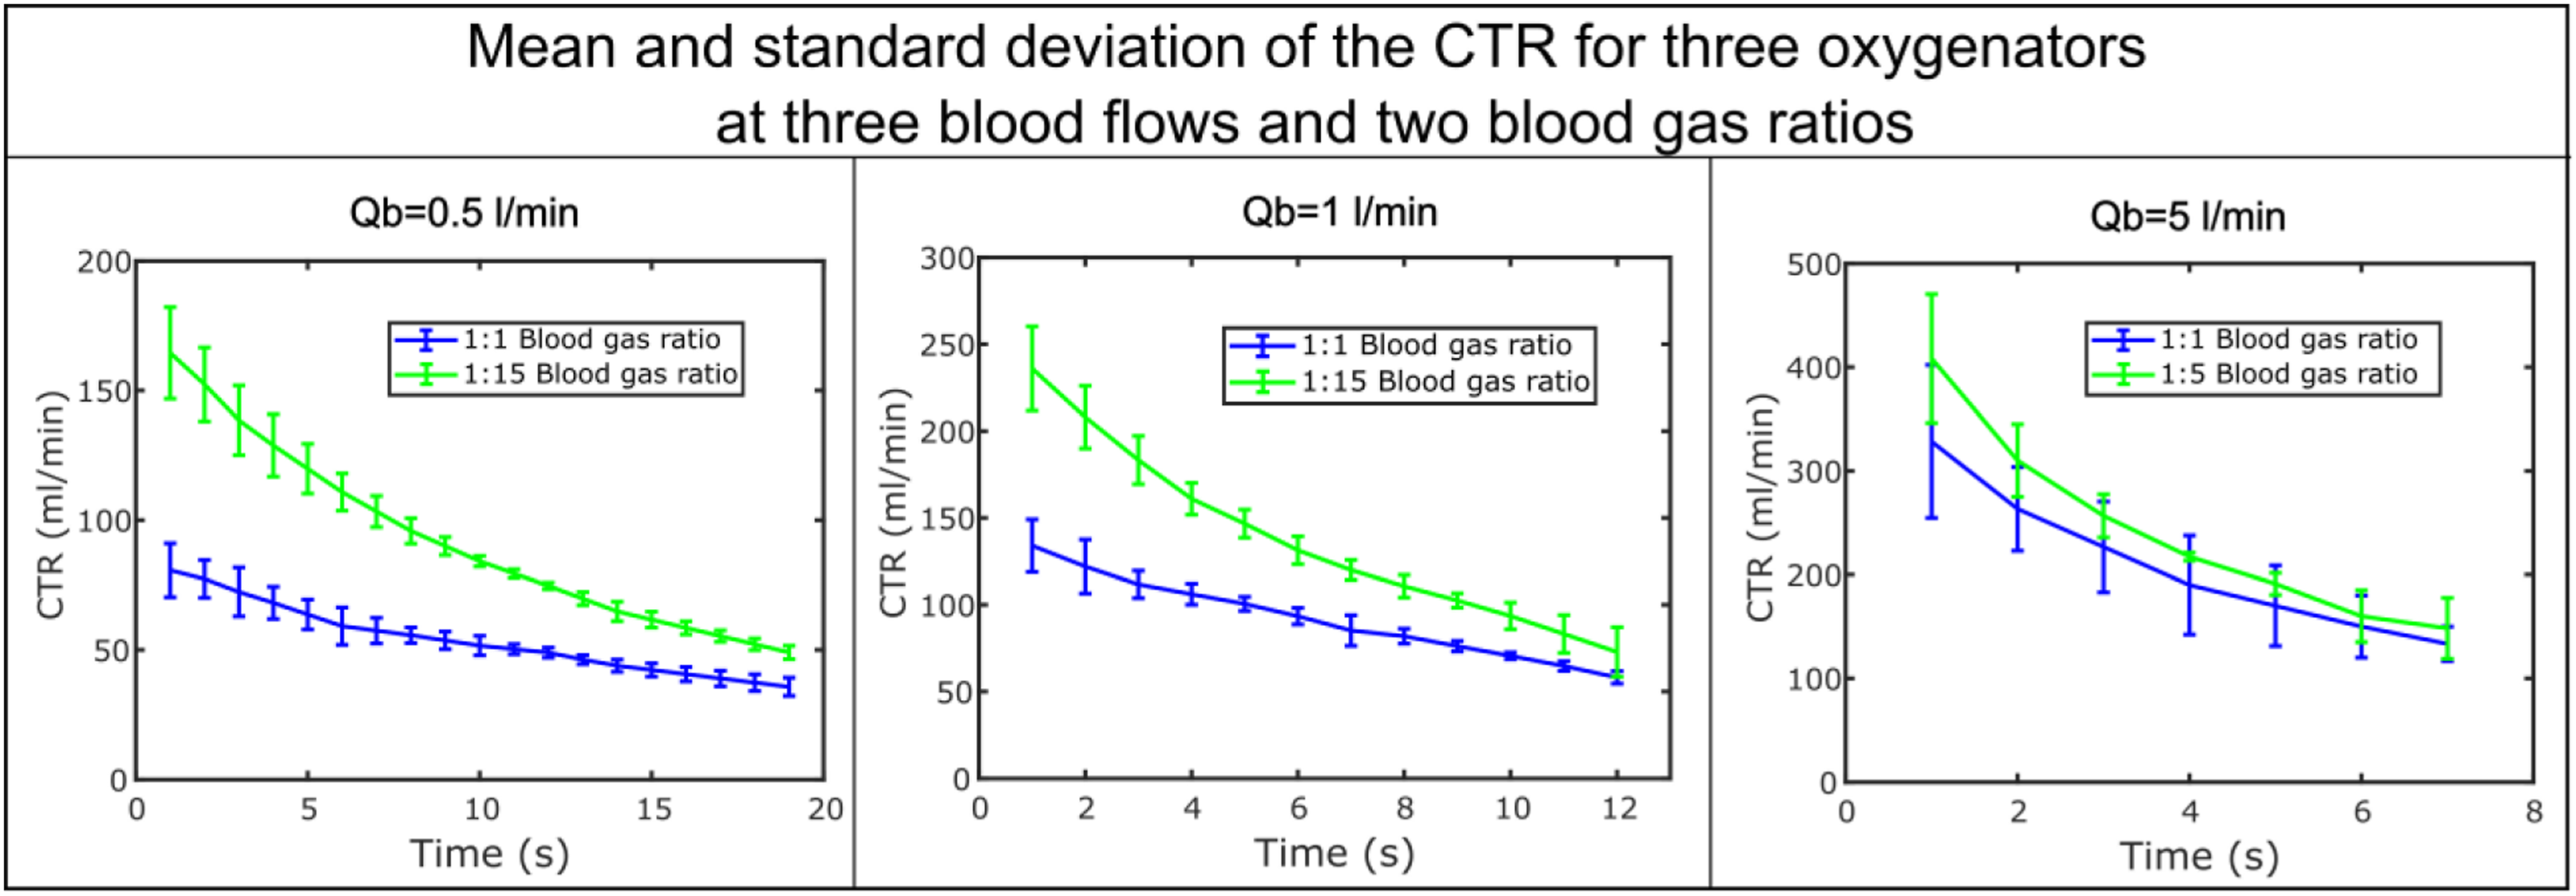
Both OTR and CTR are not constant over time. The highest performance is reached at the beginning of the experiment when the pCO2 is at the maximum and pO2 at the minimum.
In order to better understand the performance of the oxygenator in terms of CO2 elimination, the pCO2 of blood at the inlet and outlet of one of the three oxygenators was plotted over time (Figure 4). Terumo with a blood flow of 1 L/min and blood-gas ratio 1:1 was shown as an example. Performance of an oxygenator (Terumo) in terms of CO2 elimination in time. In figure 4(a) (left), pCO2 of the blood at the inlet and outlet of the oxygenator are plotted in time, in figure 4(b) (top right), the difference between pCO2 inlet and outlet is plotted in time while in figure 4(c) (bottom right), the difference between pCO2 inlet and outlet is plotted as a function of the pCO2 inlet.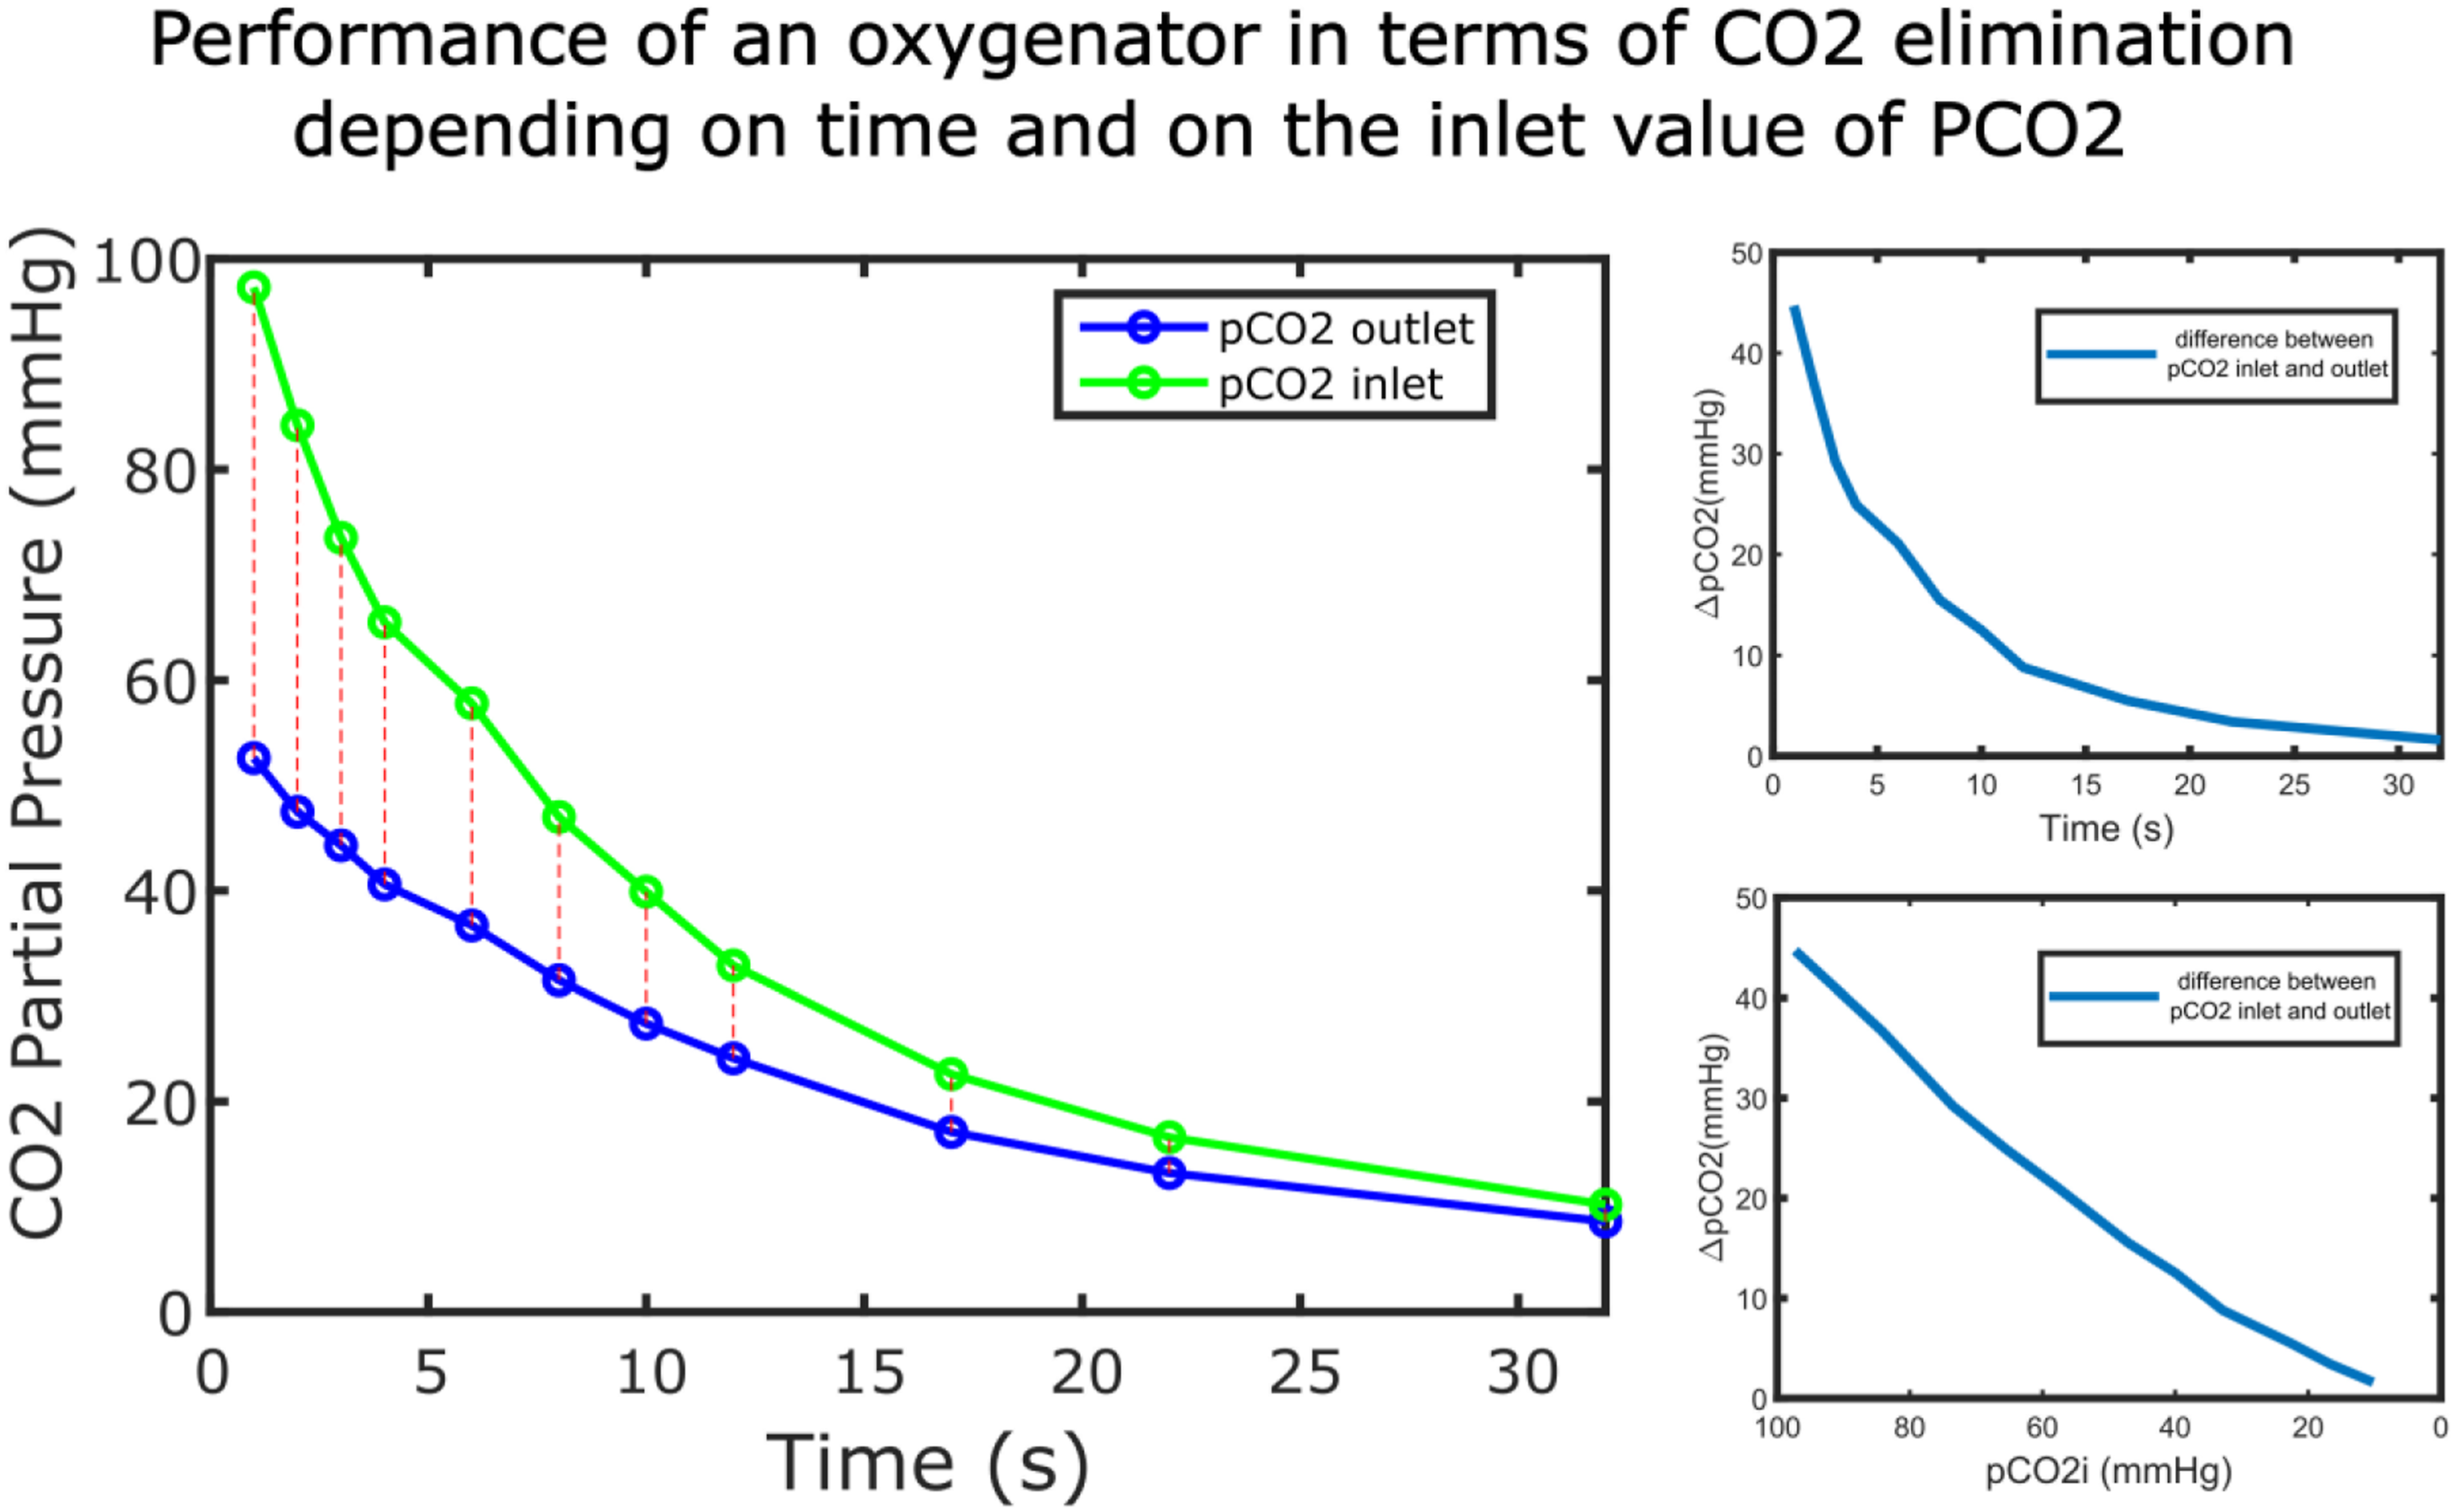
Both pCO2 inlet and outlet as well as their discrepancy (Figure 4(b)) decrease exponentially in time and as shown in Figure 4(c), there is a relation between the pCO2 of the inlet blood and CO2 elimination from the oxygenator. The higher the pCO2 inlet, the higher the CO2 elimination in the oxygenator. For each blood and gas flow setting, a function for the pCO2 of the blood outlet was plotted over the blood inlet and expressed with the help of a Matlab fit function using an exponential function. The measured values and the exponential function were plotted together for Euroset (taken as example) in Figure 5. Relation between the pCO2 of the blood at the outlet of the oxygenator (Euroset) as a function of the pCO2 of the blood at the inlet of the oxygenator. In the graph both, the measured values as well as the associated mathematical function, are shown. The measured points were represented with an ‘*’ while the associated mathematical function is represented with a continuous line. The different colours in the graph show two different blood gas ratios.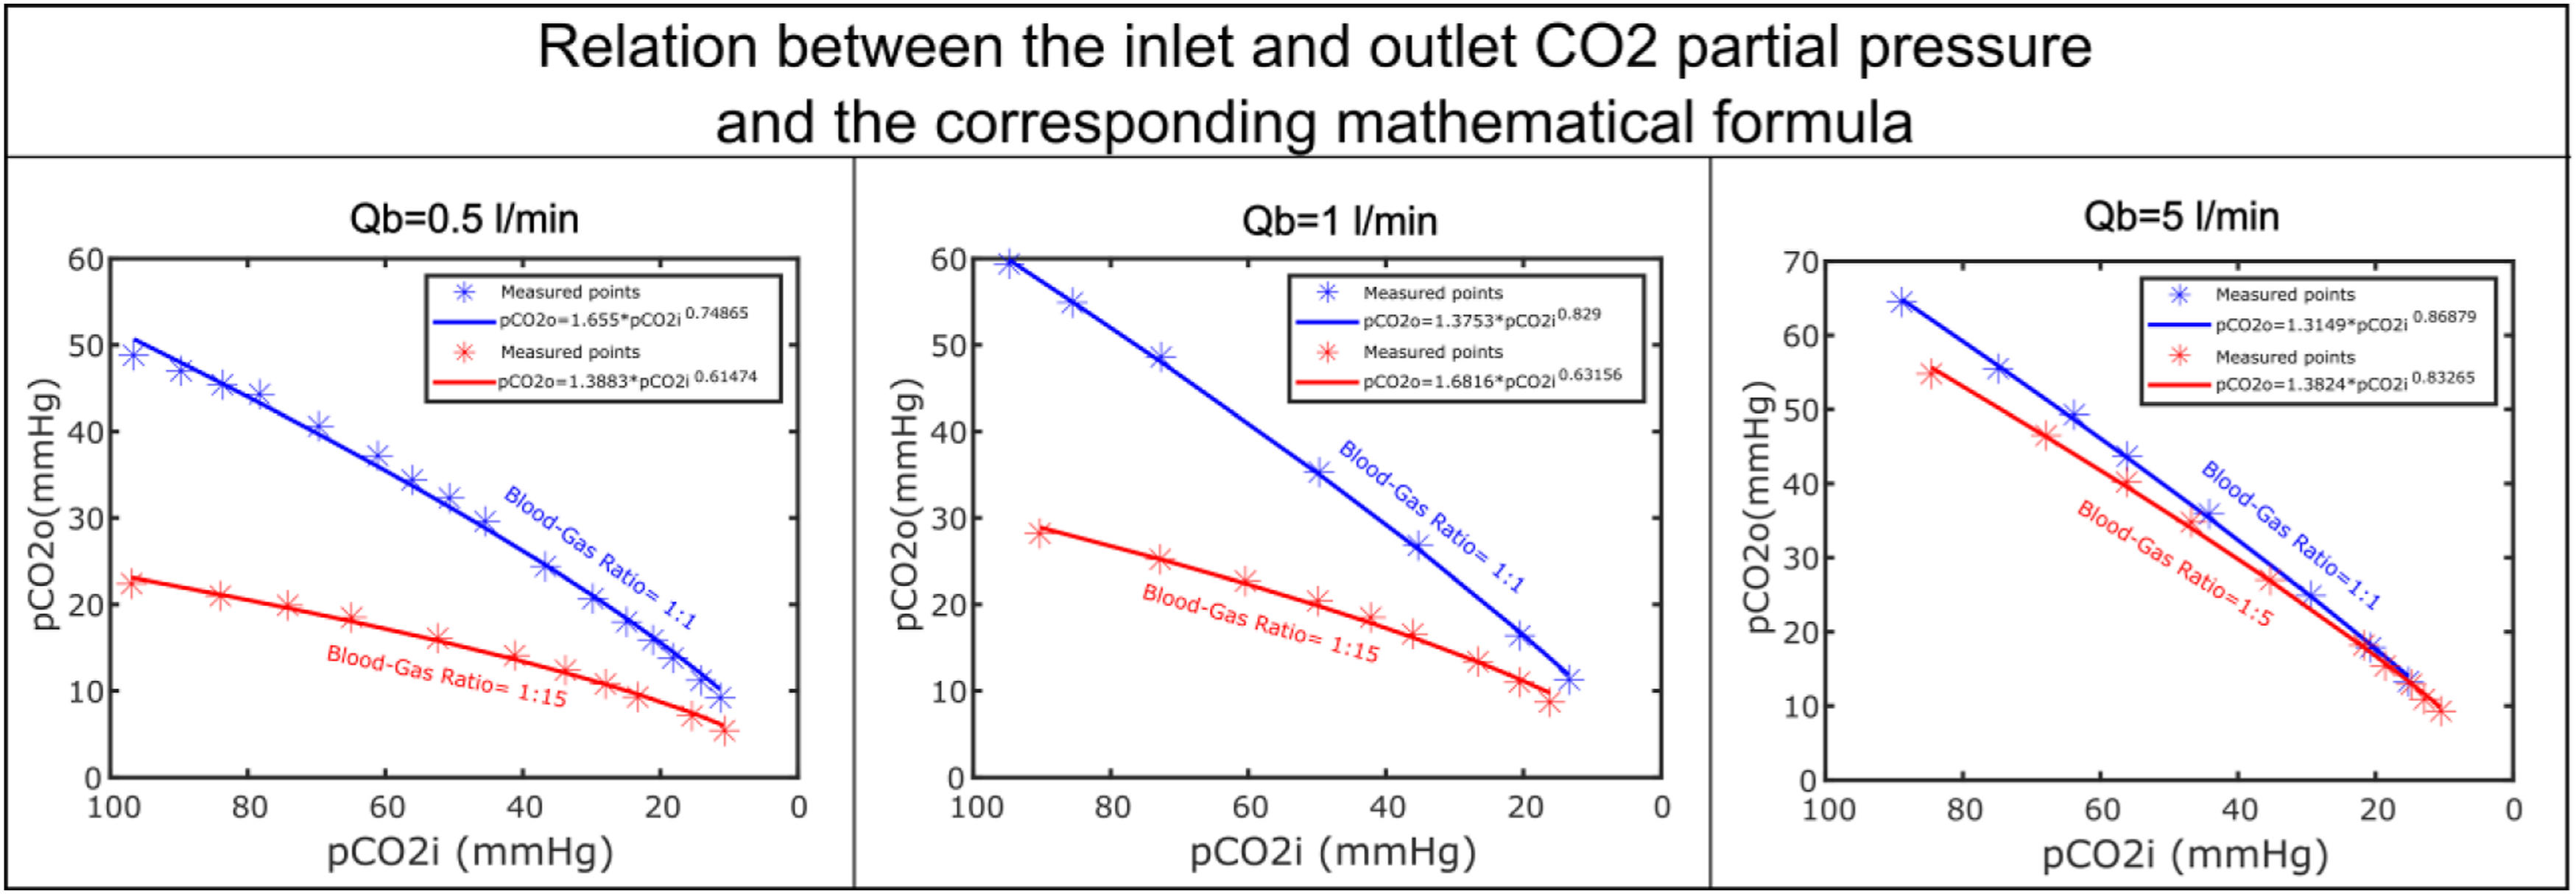
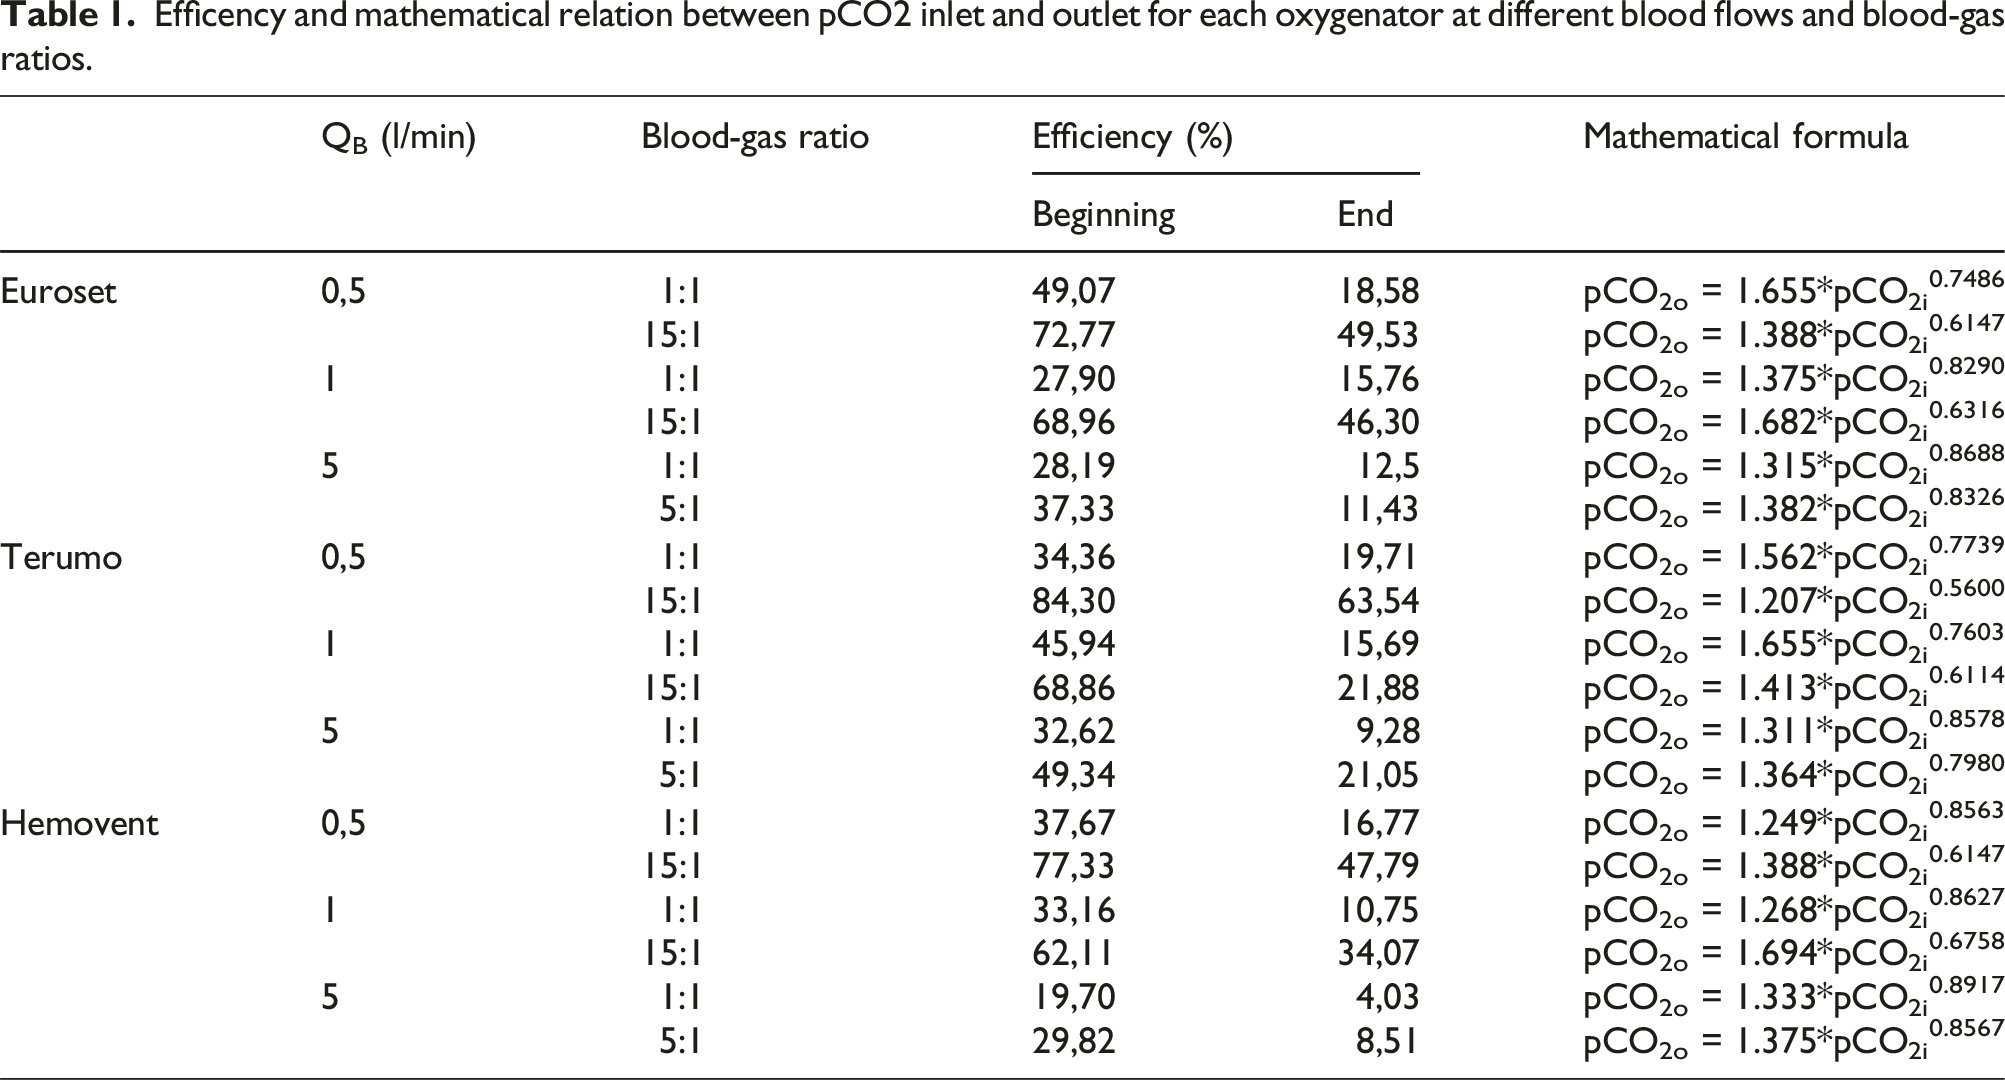
Efficency and mathematical relation between pCO2 inlet and outlet for each oxygenator at different blood flows and blood-gas ratios.
Discussion
In this work, the relation between the performance of an oxygenator and the gas concentration in the blood at the input of the oxygenator was investigated. The input concentration is the driving force or potential that influences the exchange of gas between blood and the membrane of the oxygenator. A rapid reduction of the oxygenators' own potential indicates a high performance in this context. 10 Three oxygenators with different characteristics were chosen in order to avoid any bias associated with relying solely on a single oxygenator.
OTR/CTR performance
Blood and gas flow play a significant role in oxygenation and decarboxylation as shown in Figures 2 and 3 and as confirmed by different studies. 11 In both figures, the mean and standard deviation of the OTR and CTR for the three oxygenators was shown. Since the standard deviation is a measure of how much the individual values vary from their mean, it is in this study an indicator of how much the OTR and CTR differ between the three oxygenators. The gas transfer along a membrane is controlled by the geometry of the oxygenator, especially by the surface area, leading to differences in the OTR and CTR among the three oxygenator types. 12 Terumo with the highest membrane area has overall a better performance regarding CO2 elimination. Heinrich et al. associated a high surface area with a decelerated blood flow inside the oxygenators’ hollow fibres. 13 Since a blood flow decrease combined with a high gas-blood ratio increase the CTR, an oxygenator with a larger surface area shows a better CTR performance. Karagiannidis et al. as well demonstrated how much the surface area of an oxygenator influences the CO2 removal during severe respiratory acidosis. 14 Our results, especially the calculated efficiency of all three oxygenator in Table 1, are consistent with these studies. For blood flows up to 1 L/min, the standard deviation is low which means that similar patterns of OTR and CTR can be observed in all the three oxygenators. This may be due to the fact that all the three oxygenators are designed for adults and therefore their membrane area, even the smallest of the three, is more than enough to facilitate gas exchange for the investigated blood flows. The higher the blood flows through the oxygenator, the higher the influence of the oxygenator membrane area in the resulting value of OTR and CTR.
An increase in gas flow rate has a small effect in OTR especially compared to CTR. A positive effect on OTR can be obtained by increasing the blood flow rate. 15 This is due to the relation between OTR, blood flow and haemoglobin (Hb) that was quantitatively expressed and clarified in a study by Spinelli et al. 16 CTR on the other side is predominantly influenced by the gas flow rate, even though a positive association with the blood flow rate can be noticed. Figure 3 shows a strong effect of the hyperventilation on the decarboxylation, which is consistent with the studies in literature. 17
CO2 elimination depended on pCO2 inlet
The results from Figure 4 show how the CO2 elimination performance of an oxygenator depends on the input value. pCO2 in both, inlet and outlet blood, decreases exponentially in time, while the distance between the two curves (Figure 4(b)) represents the effective CO2 elimination in the oxygenator. This distance decreases over time, reducing the effectiveness of the decarboxylation proportionally to the dropping CO2 inlet values. The higher the pCO2 value at the inlet of an oxygenator, the better the CO2 elimination performance.
For simulative reasons, the dependence between the inlet and outlet pCO2 in an oxygenator is essential. The performance of an oxygenator in terms of O2 supply and CO2 removal is tested according to standard protocols EN DIN ISO 7199:2016. 9 However, when dealing with simulations of a lung insufficiency and oxygenator support, 8 the values of pCO2 and pO2 are not in the standard range considered in the protocols. Therefore the performance of an oxygenator in this cases is unknown, especially regarding CO2 elimination that highly depends on the inlet pCO2 value. Figure 5 aims to mathematically describe the relation between the pCO2 in blood at the outlet and inlet of the oxygenator. The exponential function was the better fit to the measured data.
Efficiency of the oxygenator
The efficiency of the oxygenator, defined as the percentage of the CO2 content of inlet blood eliminated by the oxygenator, is shown in Table 1. The efficiency was calculated at the beginning of the experiment when the pCO2 inlet was the highest and at the end of the experiment when it was lowest. As expected the value decreases with the decrease of the CO2 content and pCO2 at the inlet blood. The highest efficiency was calculated for the oxygenator with the highest membrane area, for the lowest blood flow (0,5 L/min) and the highest gas-blood ratio (7,5 L/min). This confirms again the dependency of the CO2 elimination from the membrane area, blood and gas flow.15,18,19
Conclusion
The performance of three different oxygenators was evaluated for different input conditions. The dependency of the CO2 elimination performance on the pCO2 at the oxygenator inlet could be demonstrated experimentally and could be expressed mathematically by an exponential function for different blood flow rates and gas-blood ratios. Such data not only was not available from the data sheet of the oxygenator but also is of great importance in the implementation of mathematical models that simulate the oxygenator support in an insufficient lung especially in different anatomical configuations. 8 The outcomes of this study can establish a fundamental basis for constructing a numerical simulation. This simulation offers a dual advantage by assisting in the customization of individualized gas exchangers and offering clinical insights into the operation and selection of oxygenators.
Footnotes
Declaration of conflicting interests
The author(s) declared no potential conflicts of interest with respect to the research, authorship, and/or publication of this article.
Funding
The author(s) disclosed receipt of the following financial support for the research, authorship, and/or publication of this article: This project is funded by the German Research Foundation (DFG): Project-Nr. 347325614.