
Abstract
Introduction
Peripheral veno-arterial extracorporeal membrane oxygenation (VA ECMO) creates a retrograde flow along the aorta competing with the left ventricle (LV) in the so-called ‘mixing zone’ (MZ). Detecting it is essential to understand which of the LV or the ECMO flow perfuses the upper body – particularly the brain and the coronary arteries – in case of differential hypoxemia (DH).
Methods
We described a mock circulation loop (MCL) that enabled experimental research on DH. We recreated the three clinical situations relevant to clinicians: where the brain is either totally perfused by the ECMO or the LV or both. In a second step, we used this model to investigate two scenarios to diagnose DH: (i) pulse pressure and (ii) thermodilution via injection of cold saline in the ECMO circuit.
Results
The presented MCL was able to reproduce the three relevant mixing zones within the aortic arch, thus allowing to study DH. Pulse pressure was unable to detect location of the MZ. However, the thermodilution method was able to detect whether the brain was totally perfused by the ECMO or not.
Conclusion
We validated an in-vitro differential hypoxemia model of cardiogenic shock supported by VA ECMO. This MCL could be used as an alternative to animal studies for research scenarios.
Introduction
Veno-arterial extracorporeal membrane oxygenation (VA ECMO) is a therapeutic option for critically ill patients with cardiogenic shock, pulmonary embolism or septic shock who are refractory to conventional treatments.1-3 It consists of an extracorporeal life support circuit and a membrane lung with a venous drainage and an arterial return, aiming to restore adequate end-organ perfusion.
Veno-arterial extracorporeal membrane oxygenation most common configuration is through cannulation of the femoral vessels (i.e. femoro-femoral peripheral VA ECMO) as it allows for an easy percutaneous access – that is, without the need for a surgical cut-down. Nevertheless, this configuration creates a retrograde flow along the aorta that competes with the native left ventricular cardiac output (LVCO), thus overloading the left ventricle.1,2 Several publications have now reported complications due to this increase in LV afterload, and the need for LV decompression or alternative treatments.3–5 The exact spot where the LVCO and ECMO flow mix is called the ‘mixing zone’ (MZ) or ‘mixing cloud’ or ‘watershed’, and is typically located along the aortic arch, depending on the balance between the LVCO and the ECMO flow.6,7
Location of the mixing zone is of importance because a large portion of patients undergoing VA ECMO exhibit hypoxemia due to poor oxygenation in the native lungs (caused mainly by pulmonary oedema and/or pneumonia) and therefore, poorly oxygenated blood from the LV mixes with highly oxygenated blood from ECMO, causing the oxygen saturation to differ between the upper and lower part of the body – a condition called ‘differential hypoxemia’. 8 This situation is concerning for clinicians because of the potential deleterious effects for both brain and heart, which receive deoxygenated blood – cerebral and coronary arteries being in close proximity with the LV.9,10 Diagnosis of differential hypoxemia is challenging as no method has been precisely described. Clinicians rely either on a one-timepoint evaluation using arterial blood gas coming from the right brachiocephalic trunk (accessible most often through the radial artery) or on SpO2 on both hands or earlobes (reflecting the patient’s upper body oxygenation). Use of near-infrared spectrometry (NIRS) devices has also been described to address differential hypoxemia by comparing regional saturation (rSO2) in both cerebral and lower limb territory 11 or using cerebral rSO2 alone.12,13 Nevertheless, this method is costly and has not been validated to date.
So far, experimental evaluation of differential hypoxemia relies either on numerical studies14,15 which are cost-efficient and provide a repeatable platform but simplify the physical environment or on animal models 16 that are costly, complex and require animal facilities. Considering efforts made by the scientific community to avoid animal experiments, we believe mock circulation loops (MCL) can provide a physical platform to validate numerical data17,18 and may allow for a range of parameters to be measured that would not be feasible in invasive clinical investigations. To date, only one publication was published to investigate differential hypoxemia in a mock circulation loop, 19 yet this study did not use Starling cardiac response.
The aim of the present study was to present a new mock circulation loop that allows research on differential hypoxemia, and to validate that mock loop in a clinical scenario of diagnosis of differential hypoxemia without arterial blood gas.
Methods
Composition of the mock circulation loop
The MCL presented in this study is represented in Figure 1. Briefly, it consisted of three parts: 1) the MCL per se consisting of the left atrium (LA), left ventricle (LV) and right atrium (RA) that are represented by clear polyvinyl chloride pipes with lumped parameter systemic and cerebral circulations. Uni-directional flow is maintained by jellyfish valves which are used as analogues of mitral (MV) and aortic valve (AoV). Left ventricular contractility, heart rate and systolic and diastolic pressures were adjusted through a series of electropneumatic regulators (ITV2030-12BS5, SMC Pneumatics, Tokyo, Japan) and 3/2-way solenoid valves (VT325-035DLS, SMC Pneumatics) using Starling cardiac response.
20
Vascular resistance of the systemic (SVR) and cerebral (CVR) circulations was controlled pneumatically using socket valves (VMP025.03x/71, AKO, Alb Klein Ohio LLC, USA). CVR was automatically adjusted to mimic a preserved cerebral autoregulation
20
and was achieved by measuring MAP to maintain a target cerebral flow; 2) a thoracic silicon aorta model (T-S-N-001, Elastrat, Geneva, Switzerland) including the brachiocephalic trunk and the proximal segments of the subclavian, vertebral and common carotid arteries; and 3) a VA ECMO circuit consisting of a QUADROX-D and Polystan Safe Maxi Adult (Maquet Cardiopulmonary, Germany) and a centrifugal pump head connected to a Rotaflow console (Maquet Cardiopulmonary). A mix of glycerol (40%) and water (60%) solution was used in the circuit. This mixture mimics a viscosity range corresponding to a haematocrit between 29 and 42% in a temperature range of 30–42°C.
21
Schematics and 3D representation of the MCL. Black arrows indicate direction of flow whilst grey arrows indicate direction of flow depending on native heart output and/or ECMO output. The syringe represents the location for the injection of either warm (first step) or cold (second step) saline.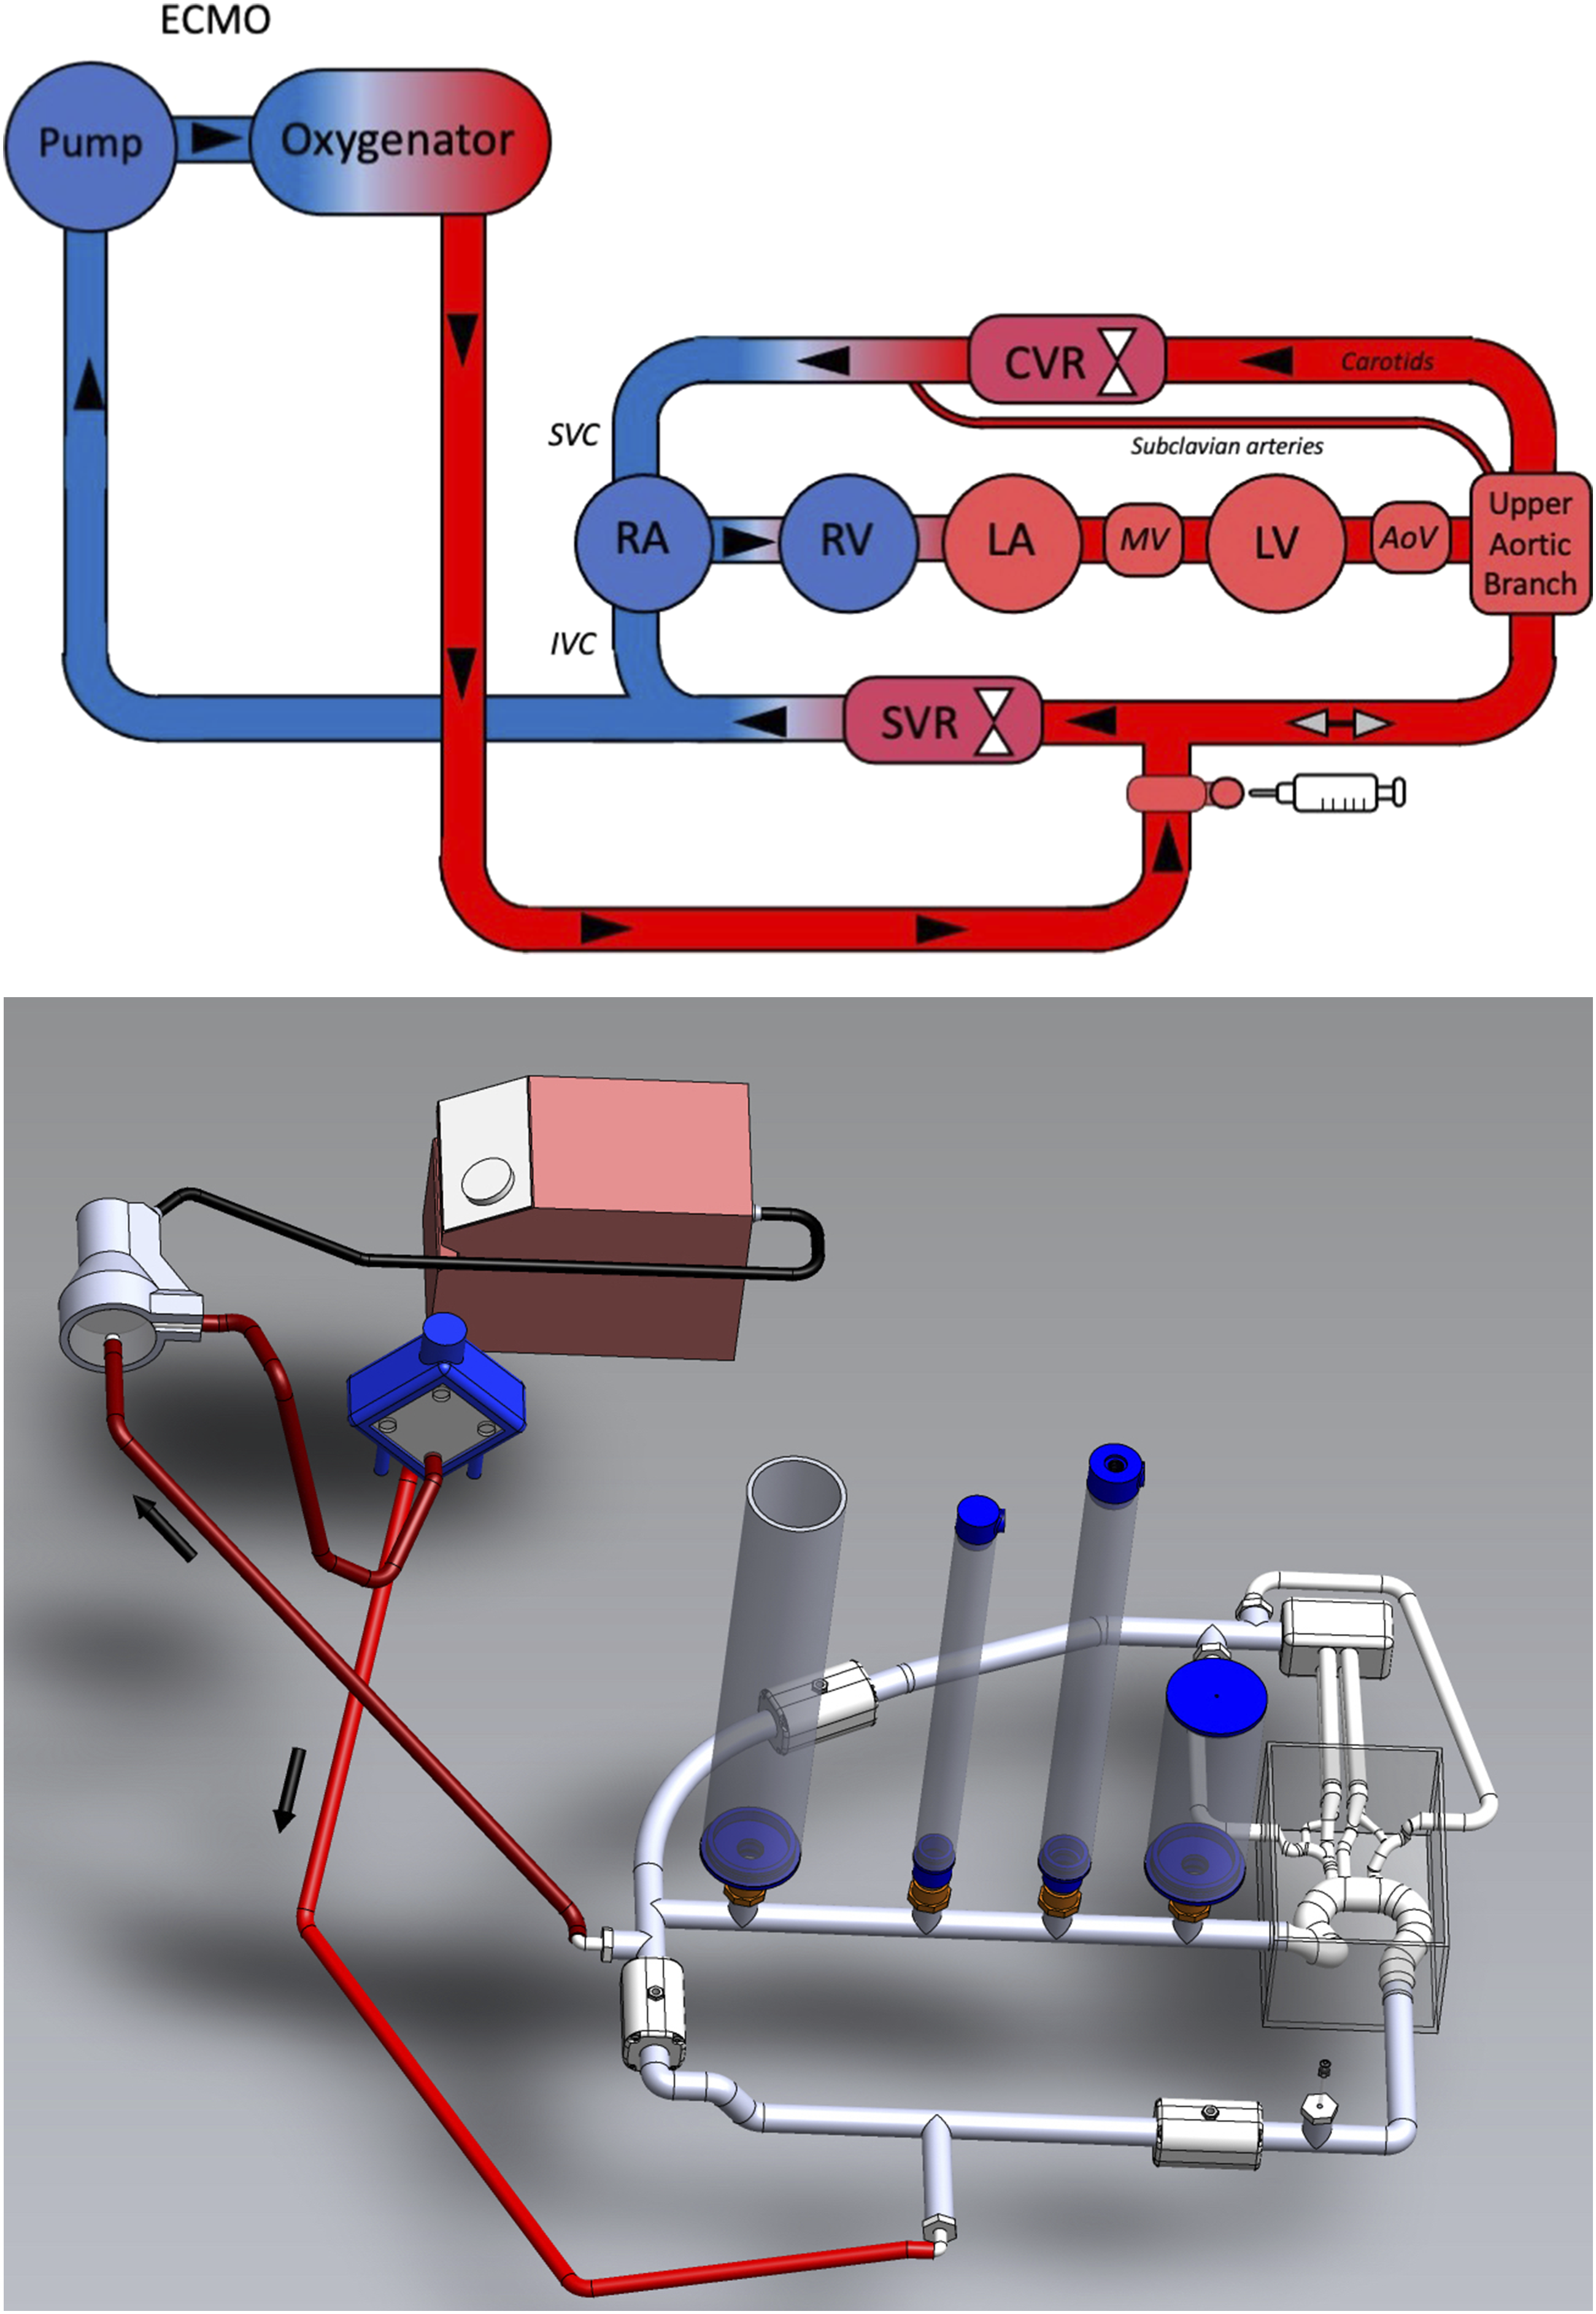
Data acquisition
Haemodynamic data was acquired using a dSPACE data acquisition system (DS1103, dSPACE, Paderborn, Germany) and was captured at 100 Hz. Cerebral and systemic flow was measured with clamp-on ultrasonic flow metres with an accuracy of 4% (TS410-10PXL and TS420-10PXL, respectively, Transonic Systems, Ithaca, NY, USA). Circulatory pressures were measured with piezoelectric transducers that had an accuracy of 0.5% (PX181B-015C5V, Omega Engineering, Stanford, CT, USA). High frequency noise of all pressure signals was removed with a low pass filter that had a cut-off frequency of 200 Hz. Left ventricular volume was measured with a magnetorestrictive level sensor that had an accuracy of 2% (IK1A, GEFRAN, Provaglio d’lseo, Italy).
Haemodynamic protocol
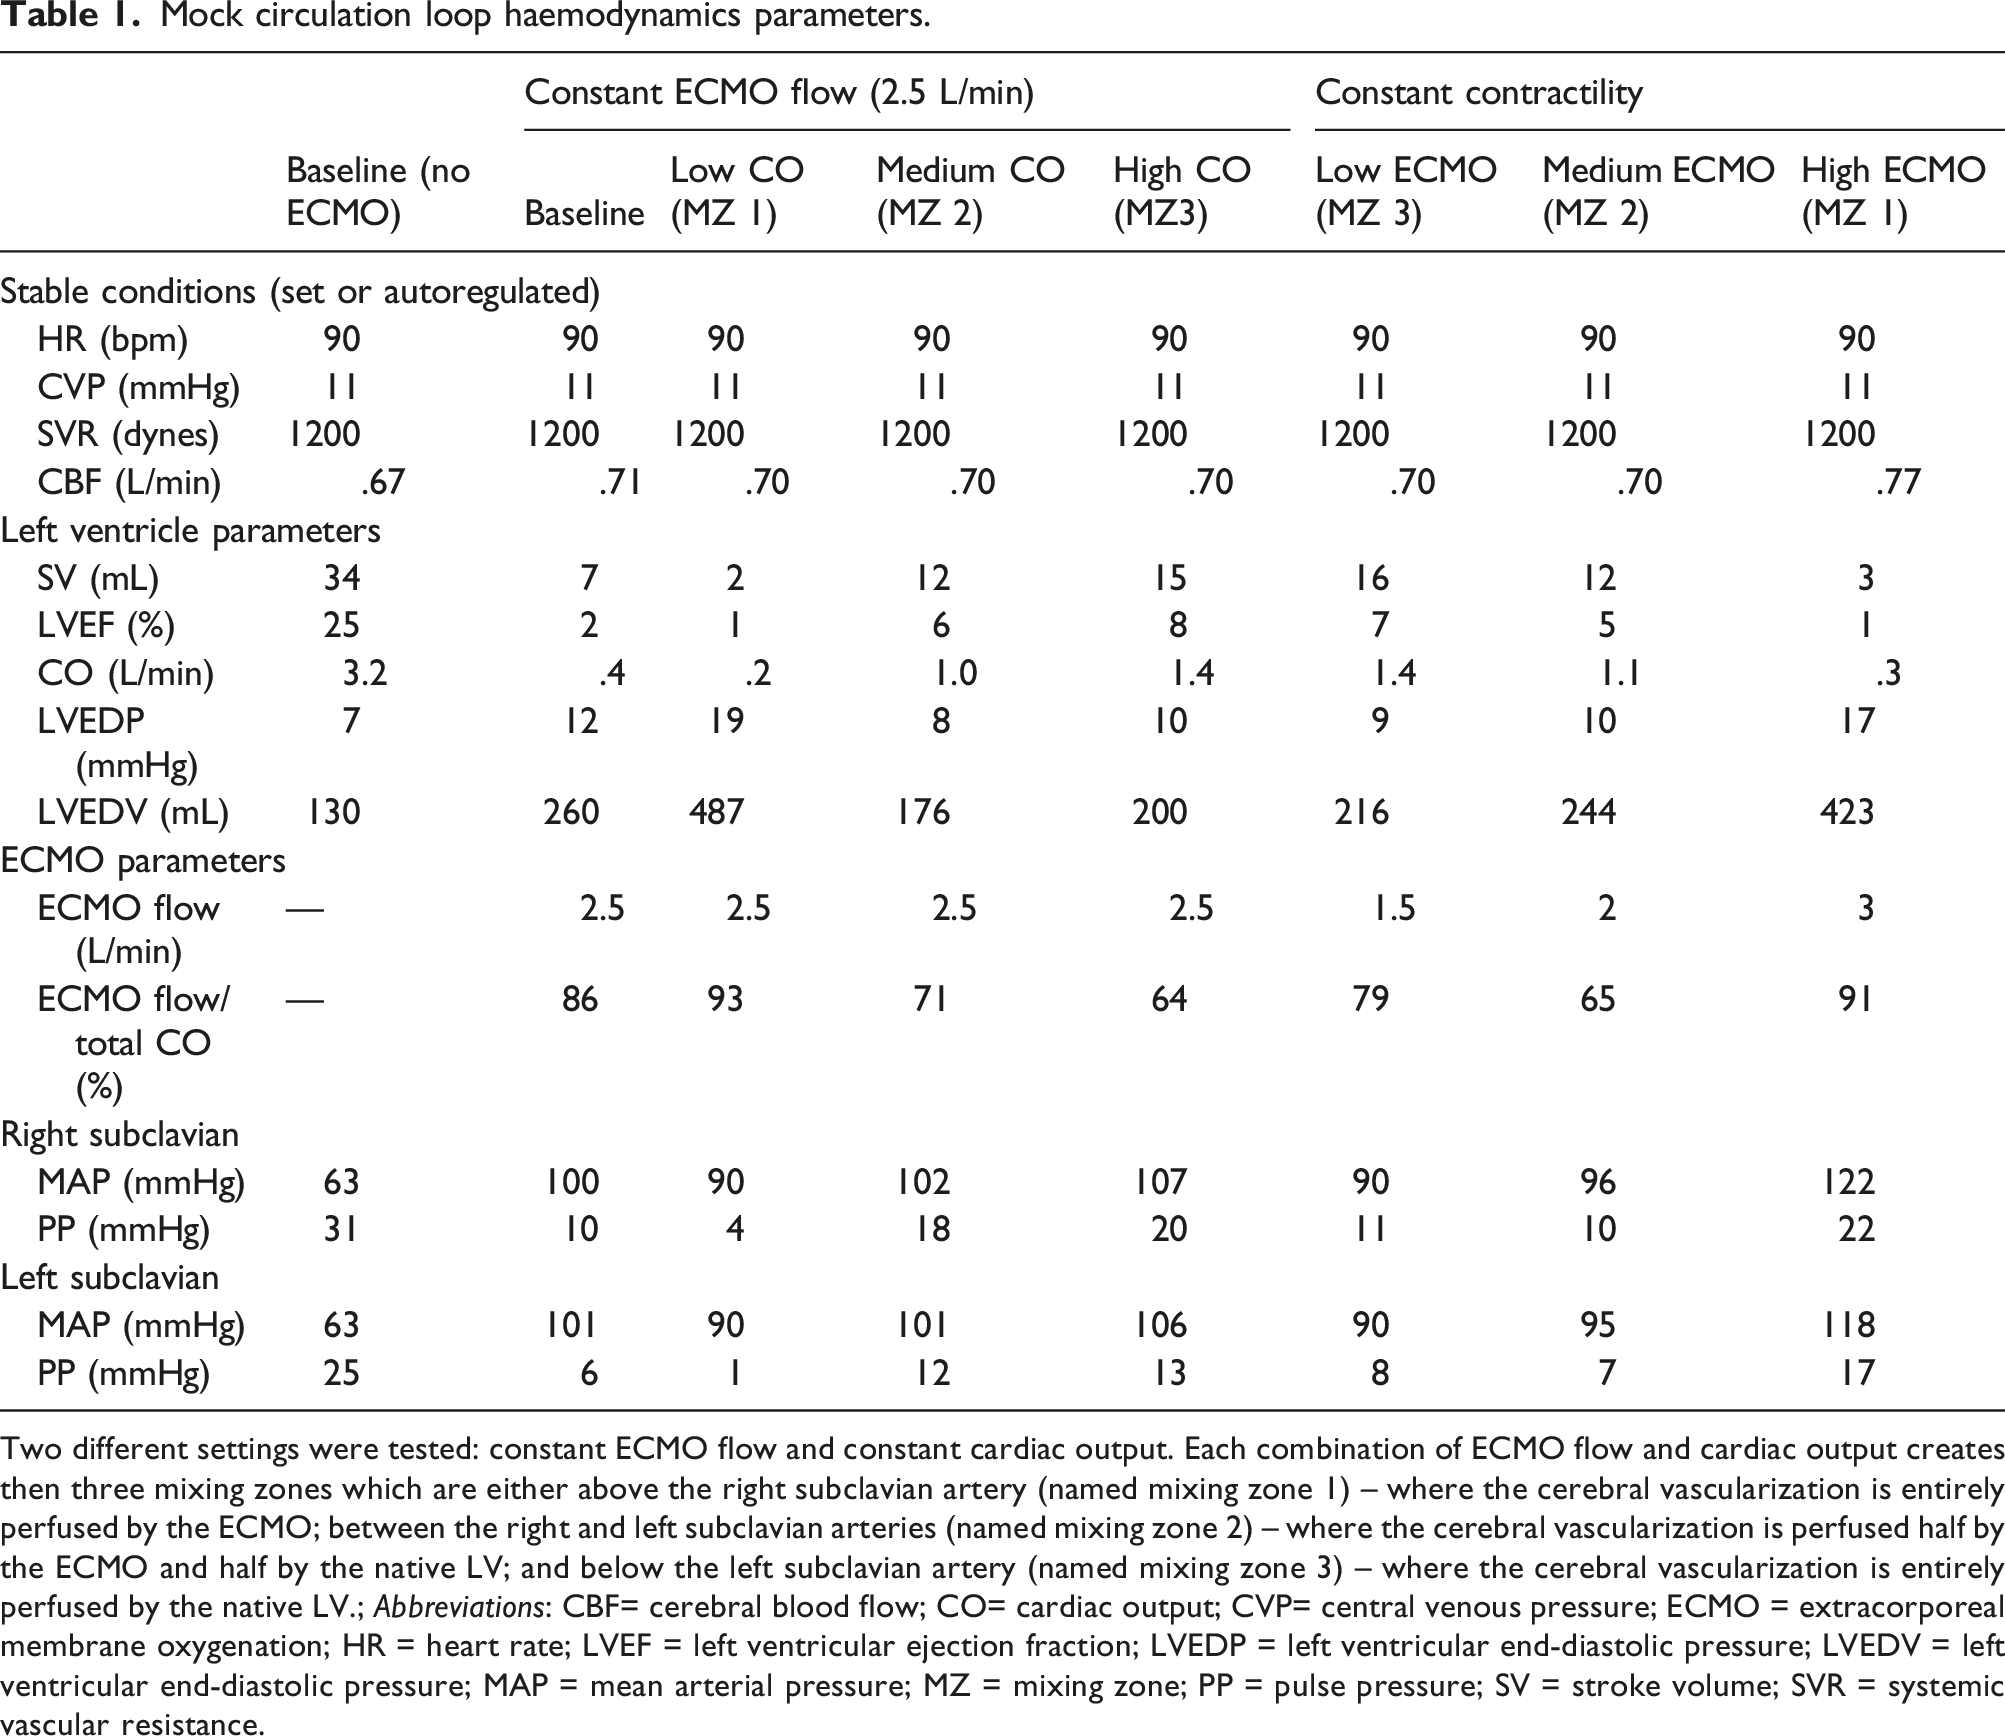
First, we determined ‘Baseline’ to mimic a cardiogenic shock with preserved/corrected SVR. Then, our objective was to obtain the three relevant locations for the mixing zone: above the right subclavian artery (named mixing zone 1 – Figure 2(a)) – where the cerebral vascularization was entirely perfused by the ECMO; between the right and left subclavian arteries (named mixing zone 2 – Figure 2(b)) – where the cerebral vascularization was perfused by both the ECMO and the native LV; and below the left subclavian artery (named mixing zone 3 – Figure 2(c)) – where the cerebral vascularization was entirely perfused by the native LV. In order to validate the differential hypoxemia model, we used both a constant ECMO flow of 2.5 L/min with three different LVCO, and a constant LV contractility (cardiac output of 3.5 L/min) with three different ECMO flows, thus resulting in six conditions (Table 1). Change in ECMO flow was induced by adjusting ECMO speed (rotation per minutes – RPMs), whilst change in LVCO were simulated by adjusting contractility (Emax: 0.41, 0.70, 0.57 and 0.2 mmHg/mL for baseline, high, medium and low, respectively). Each condition was repeated three times to ensure reproducibility. Schematic representation of the three clinically relevant mixing zone locations. The native LV flow is represented in blue, the ECMO flow in red and the mixing of the two flows in purple. Mock circulation loop haemodynamics parameters. Two different settings were tested: constant ECMO flow and constant cardiac output. Each combination of ECMO flow and cardiac output creates then three mixing zones which are either above the right subclavian artery (named mixing zone 1) – where the cerebral vascularization is entirely perfused by the ECMO; between the right and left subclavian arteries (named mixing zone 2) – where the cerebral vascularization is perfused half by the ECMO and half by the native LV; and below the left subclavian artery (named mixing zone 3) – where the cerebral vascularization is entirely perfused by the native LV.; Abbreviations: CBF= cerebral blood flow; CO= cardiac output; CVP= central venous pressure; ECMO = extracorporeal membrane oxygenation; HR = heart rate; LVEF = left ventricular ejection fraction; LVEDP = left ventricular end-diastolic pressure; LVEDV = left ventricular end-diastolic pressure; MAP = mean arterial pressure; MZ = mixing zone; PP = pulse pressure; SV = stroke volume; SVR = systemic vascular resistance.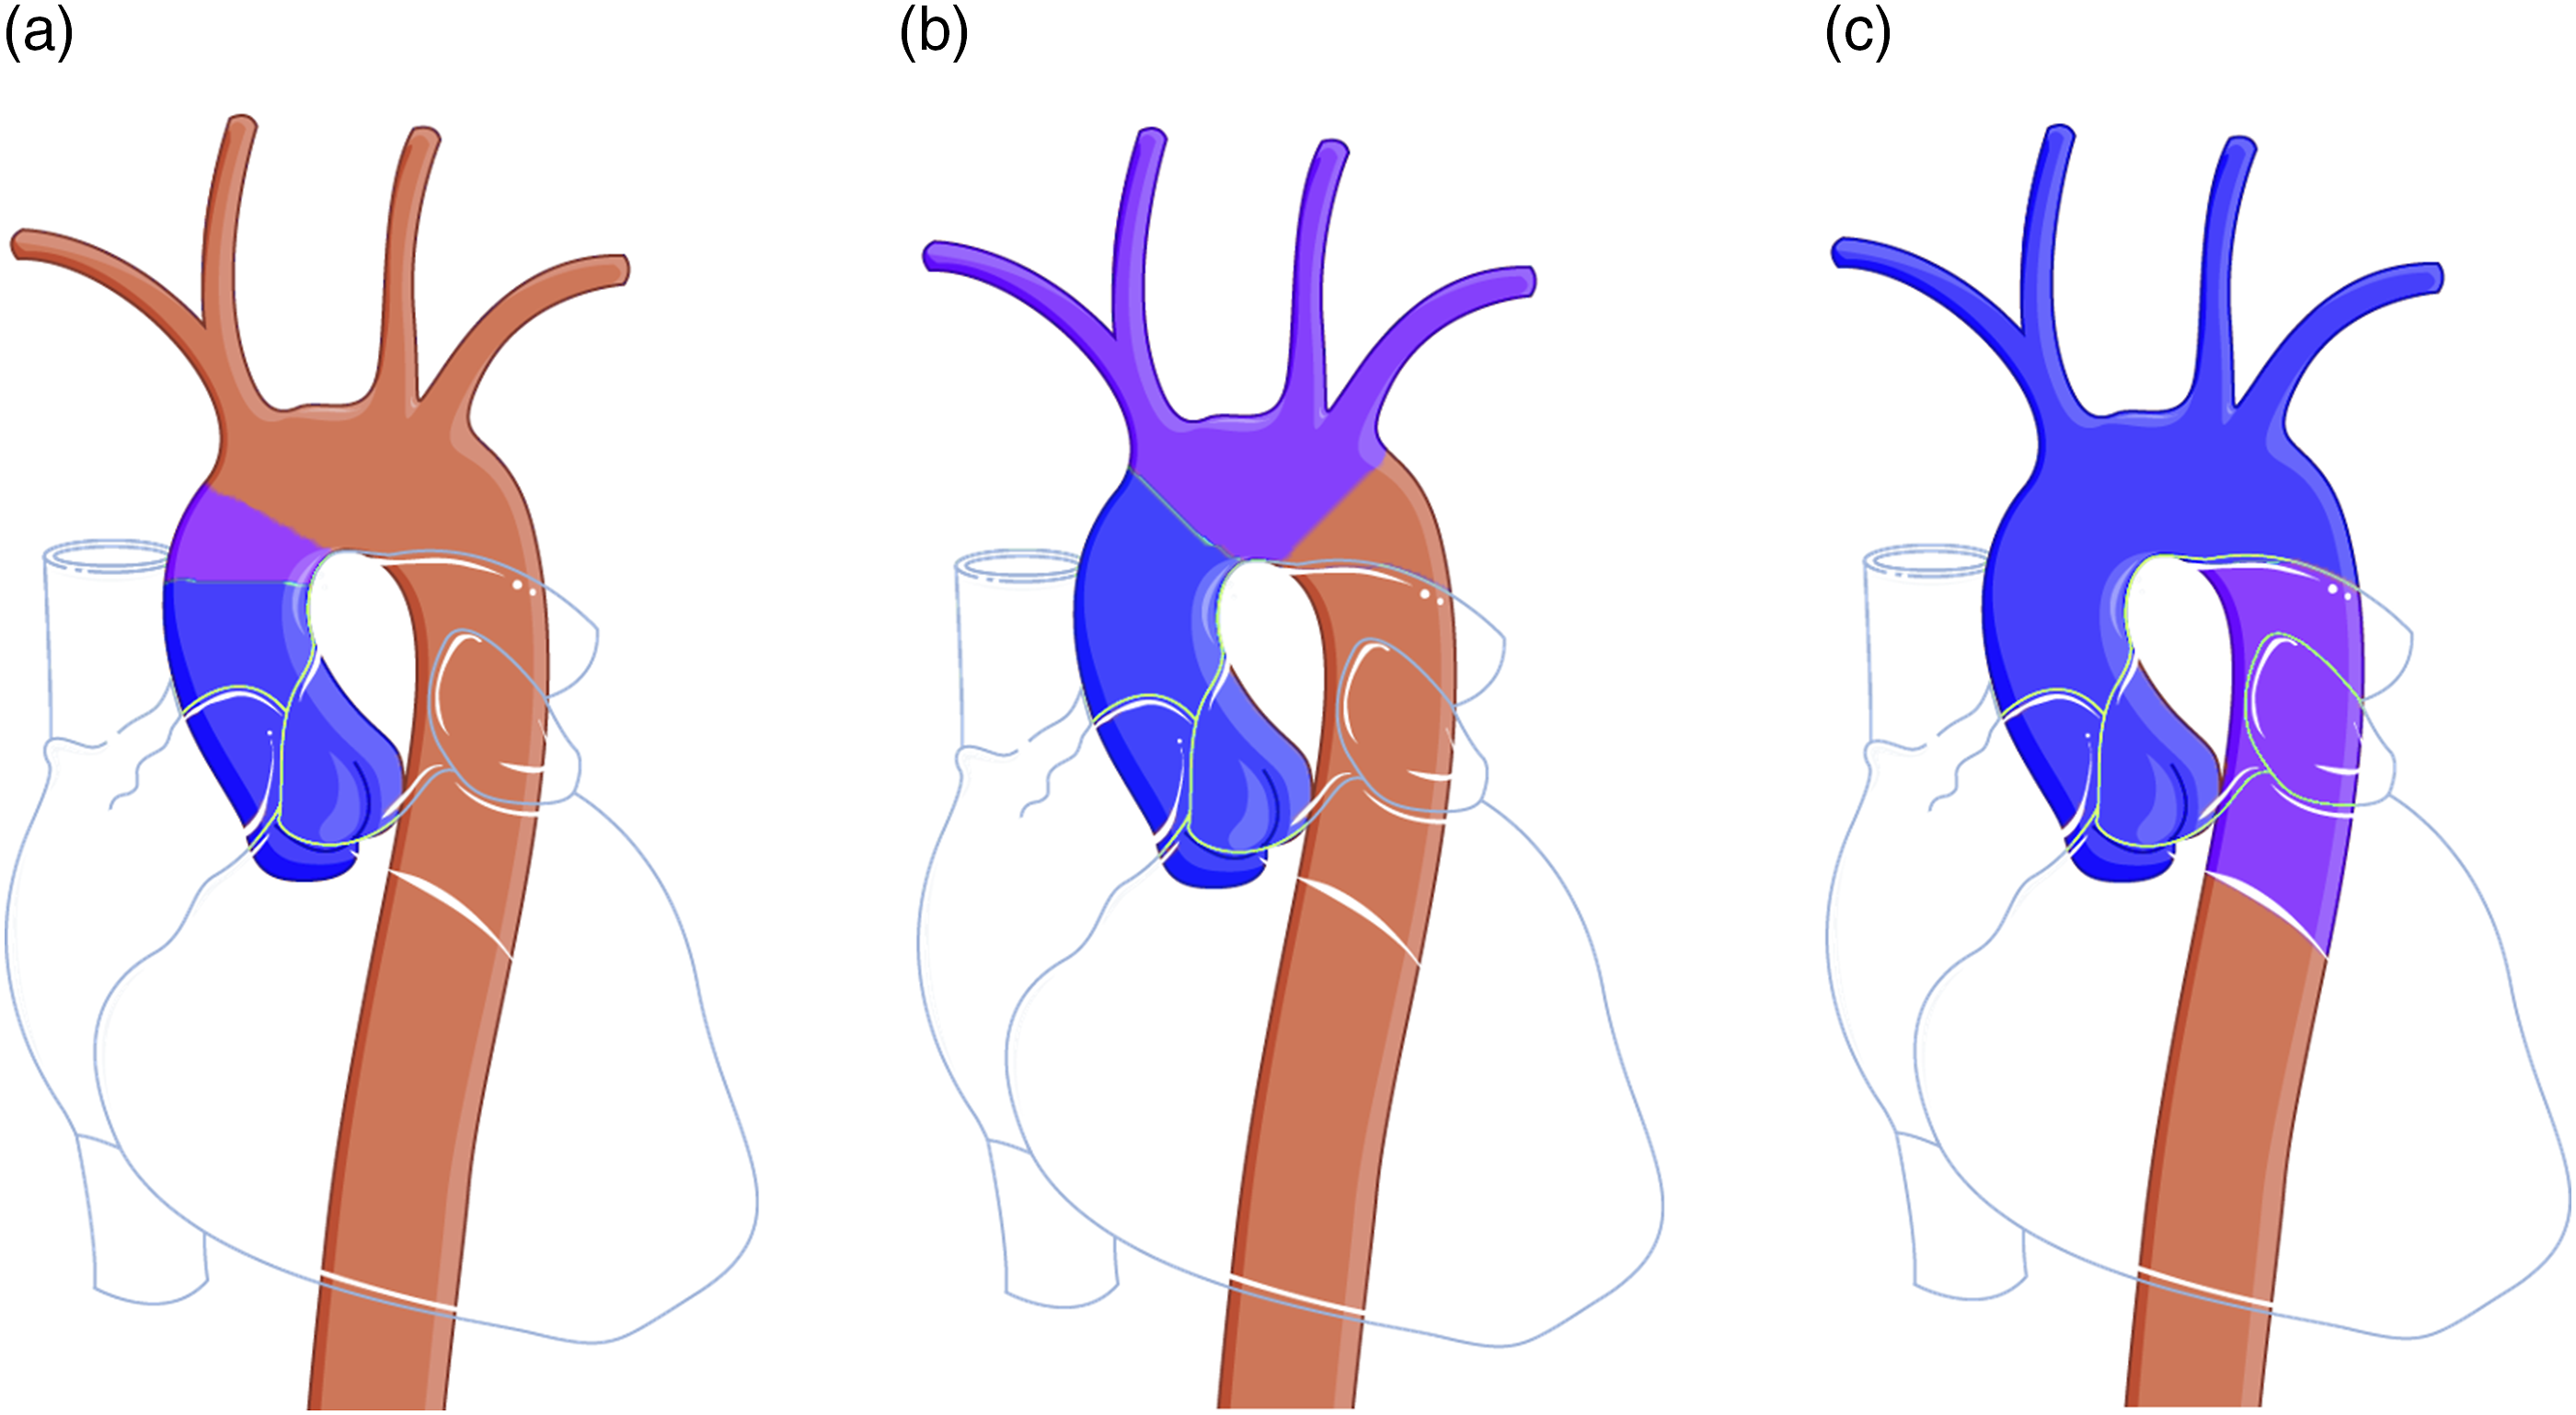
Mixing zone evaluation
To locate the mixing zone, we used thermal imaging as a surrogate for computed tomography scan with contrast. Thus, we injected 10 mL of warm saline (80°C) at constant speed through a 3-way tap located at the tip of the arterial return line of the ECMO circuit (Figure 1). We then recorded the mixing between the warm saline and the cold circuit (maintained at 4°C) with a thermal camera (FLIR T450sc, FLIR Systems AB, Sweden). A wash-out period of 30 min was observed between each condition to allow for the circuit to cool down. The 10 mL of warm saline added to the circuit were flushed away between each experiment.
Evaluation of a clinical scenario: diagnosis of differential hypoxemia without arterial blood gas
We aimed to investigate methods to diagnose differential hypoxemia based on the following criteria: 1) feasible in clinical practice, 2) reliable and reproducible, 3) easy to perform, 4) not endangering patient safety. Two methods were therefore selected: a) Haemodynamic method. We hypothesized that variations in waveforms and pulse pressure (i.e. [systolic arterial pressure – diastolic arterial pressure]) were correlated with the pulsatility variation induced by the ECMO. We analysed these parameters in the left and right subclavian arteries (SCA) – surrogates for the radial arteries. b) Thermodilution method. We hypothesized that, alike when evaluating CO with a Swan-Ganz catheter, if a cold bolus was injected in the ECMO circuit, variations in temperature would be correlated with the percentage of ECMO flow participating in total CO. We therefore heated the circuit to 37.4°C (similar to human central temperature) via the ECMO using a specific heater (Heater unit HU 35, Maquet Cardiopulmonary). We then injected a 4°C bolus through a 3-way tip connected to the ECMO circuit and analysed the thermal trend in the right and left SCAs.
Statistical analysis
A descriptive statistical analysis was conducted using GraphPad Prism Version 7 (GraphPad Software, Inc., La Jolla, CA). Results were calculated and expressed as means ± 95% confidence intervals (CI). To test the ability for pulse pressure to discriminate the location of the mixing zone, r2 correlation coefficient was calculated by plotting the pulse pressure to the mixing zone locations.
Results
Haemodynamic protocol
For an ECMO flow of 2.5 L/min, a LVCO below 1.6 L/min was needed to ensure the mixing zone was within the thoracic aorta (corresponding to a stroke volume (SV) below 23 mL). Haemodynamic conditions are reported in Table 1.
In order to get a mixing zone within the aortic arch., the ratio of VA ECMO had to be between 64% and 93% of total CO (i.e. LVCO + ECMO flow). Results did not differ between constant ECMO or constant contractility: SV ranged from 2 to 15 mL and 3 to 16 mL, respectively, LVEF ranged from 1 to 8% and 1 to 7%, respectively, and resulting LVCO ranged from 0.2 to 1.4 L/min and from 0.3 to 1.4 L/min. As expected, resulting pressure-volume (PV) loops showed that 1) an increased ECMO flow resulted in LV dilation, increase in end-diastolic volume (LVEDV) and end-systolic pressure (LVESP), and 2) an increased contractility resulted in a reduction in LVEDV and an increase in LVESP (data are available in the Supplementary figure
Mixing zone evaluation
With a delay of 10–15 s, thermal imaging was able to detect with a relatively high precision the location of the MZ along the aortic arch., and haemodynamic conditions produced stable results throughout the study. Main MZ locations obtained with the thermal imaging, corresponding to the three different MZ described above, are represented in Figure 3 (videos are available in the Supplementary materials). Thermal imaging of the different mixing zone locations within the aortic arch. The purple colour represents the cold circuit (4°C), the light blue or the junction between purple and blue represent where the mixing zone is, the dark blue represents where the ECMO flow extends. 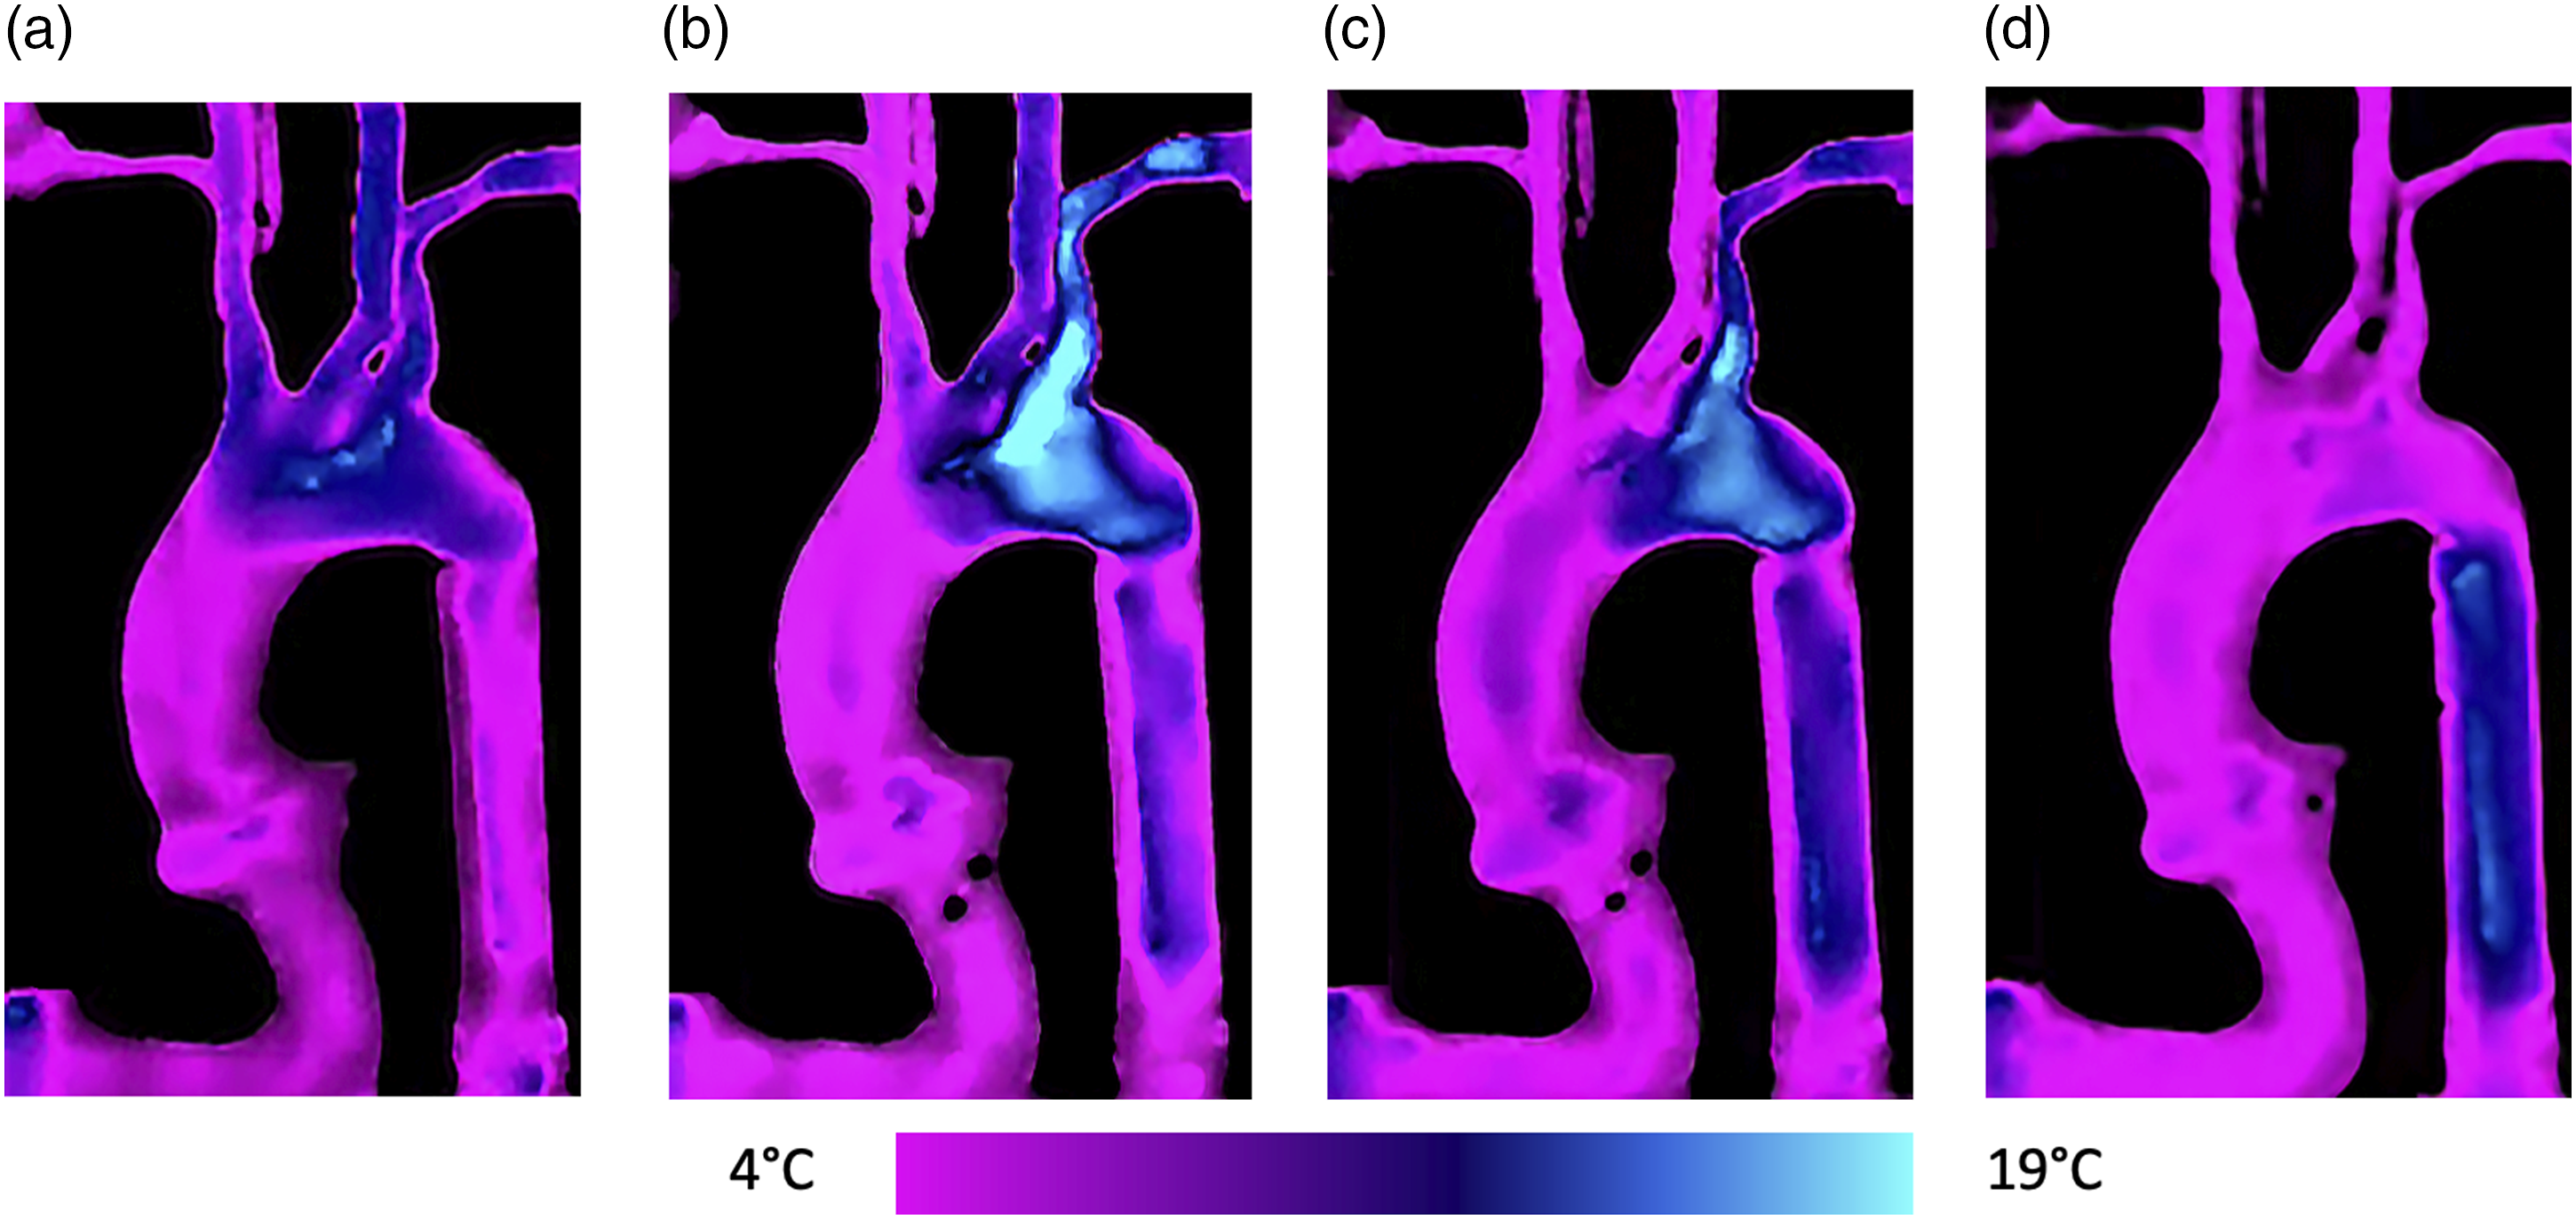
Diagnosis of differential hypoxemia without arterial blood gas
a) Haemodynamic method
There was no correlation between pulse pressure and the location of the mixing zone along the aortic arch, whether the pulse pressure was measured in the RSCA or the LSCA (r2 = 0.02 and 0.01, respectively). No cut-off could be found to determine if the mixing zone was located beneath the LSCA nor below the RBCT. b) Thermodilution method
At 120 s, we observed a significant drop in temperature measured in the right subclavian artery (RSCA) when ECMO flow was reaching the RSCA (corresponding to mixing zone 1) and not during other haemodynamic conditions (Figure 4). This temperature drop was observed wherever the cold saline was injected in the ECMO circuit (post-membrane, pre-membrane or pre-pump) but was maximal when the injection was the closest to the aorta. Temperature variation measured in the right subclavian artery during cold saline injection. All red lines represent the injection of cold saline in the post-membrane (full), pre-membrane (doted) or pre-pump (hyphened) when ECMO flow reached the RSCA (mixing zone 1). The purple and blue lines represent the temperature variations during mixing zone 2 and mixing zone 3, respectively.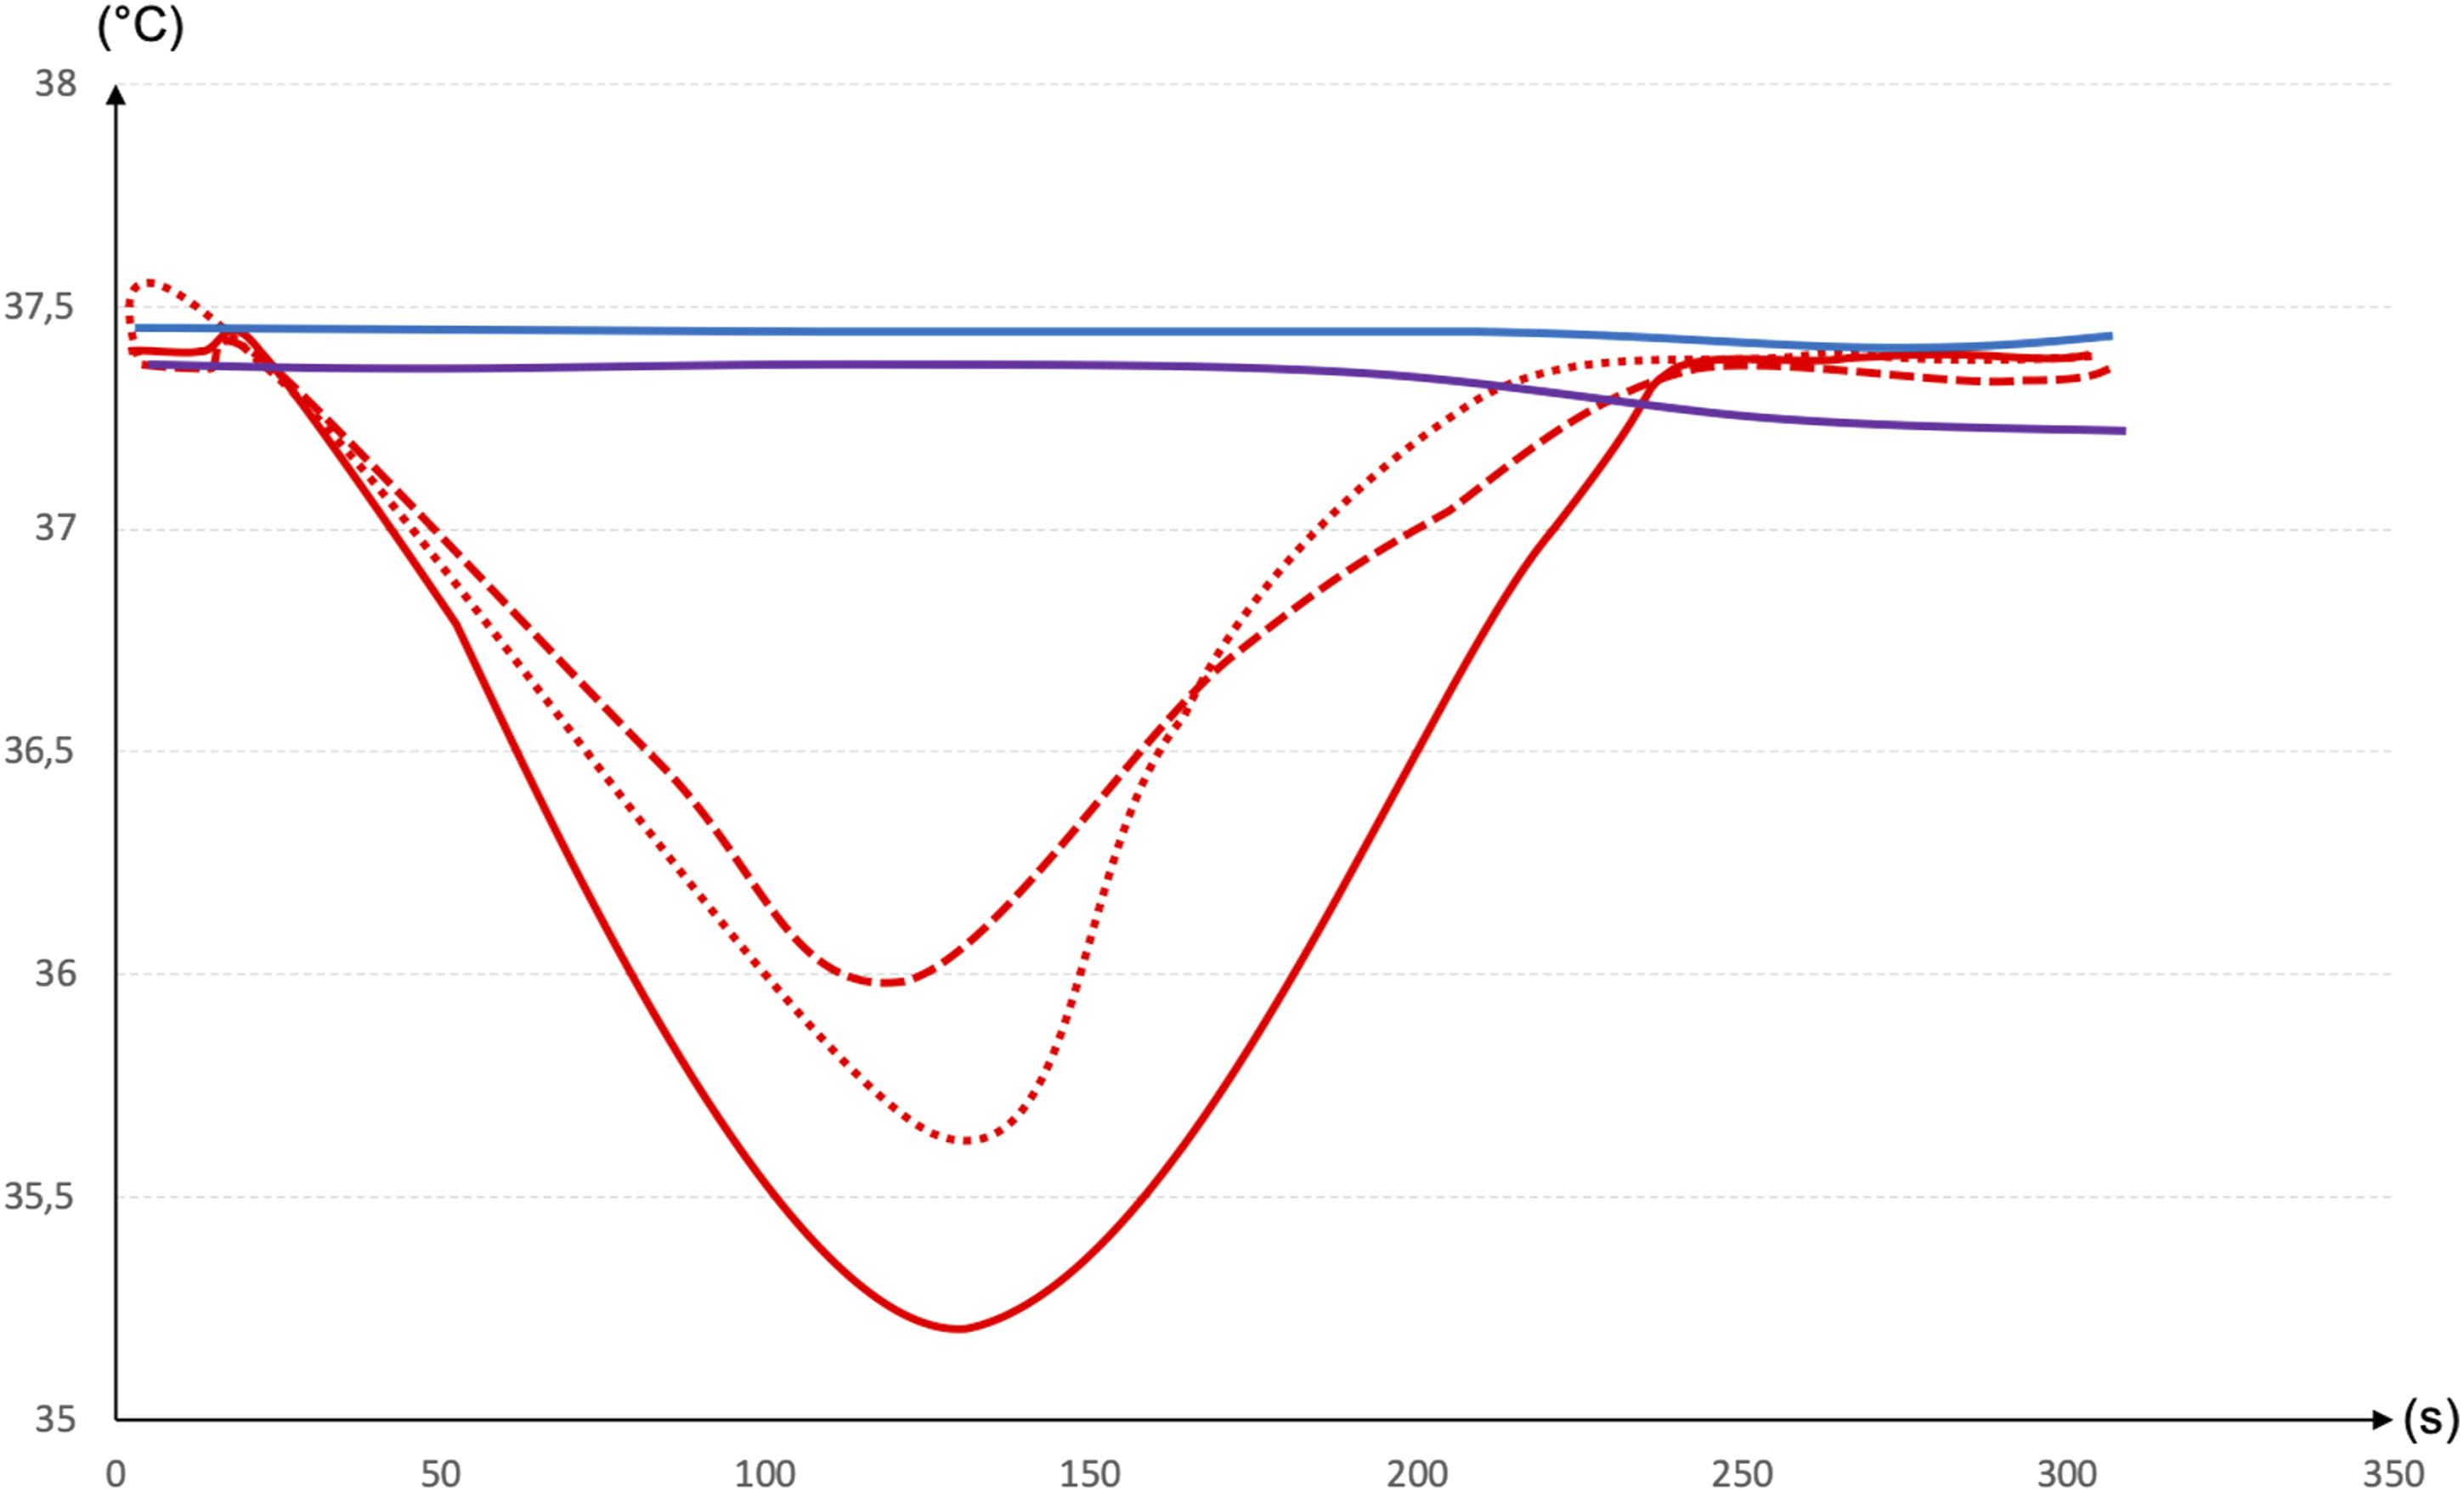
Discussion
Our results can be summarized as follows: 1) the mock circulatory loop described in this study shows a reasonable alternative method to explore differential hypoxemia; 2) pulse pressure was unable to detect the mixing zone location within the aortic arch.; and 3) temperature variation within the right subclavian artery was correlated with a total cerebral perfusion by the VA ECMO.
Cerebral complications during ECMO are essentially caused by cerebrovascular accidents (ischaemic and/or haemorrhagic) as well as microbleeds, 22 reported between 13 and 20%, respectively, according to the publications.23,24 With the exception of complications attributable to systemic anticoagulation problems or sudden changes in partial pressure of carbon dioxide, 25 the mechanisms of cerebral complications are unknown or based on analogies. Indeed, the high continuous retrograde flow generated by the VA ECMO has been suggested to impair cerebral autoregulation as in cardiopulmonary bypass studies, 26 and differential hypoxemia has been suggested to cause cerebral hypoxia. Several groups such as the recent EMPACS (Exploration of the mixing phenomena during interaction of internal and external circulations) have started enquiring about this particular phenomenon for these reasons. 27
Two factors can explain the lack of knowledge in this situation: (i) human studies reporting brain histology are difficult to perform due to obvious ethical reasons and (ii) animal studies are costly and difficult to perform. Therefore, numerical and mock circulation loop studies are expanding in the field of VA ECMO.
We present here a specific evaluation of differential hypoxemia using an MCL.
Regarding clinical application brought by this MCL, the inability for pulse pressure to detect the location of the mixing zone is disappointing as it would have provided a continuous method of assessment. Indeed, the main issue with differential hypoxemia is its variation in time depending on the level of cardiac support from the VA ECMO, which varies constantly. Unless using a continuous measure of cardiac output (which very few patients benefit from), hence knowing the constant percentage of support by the ECMO, continuous method of differential hypoxemia assessment is not possible. The second method we used, temperature variation, was well correlated with the presence of the MZ above the cerebral circulation and warrants further investigation. Indeed, right radial artery is the only clinically relevant parameter easily obtainable in current practice, but we did not wish to assume the drop in temperature would be equivalent. Further validation of this parameter is needed even though temperature variation in clinical practice would probably not be feasible unless using infrared thermometry or thermistor-tipped radial artery lines.
Strengths and limitations
Our results are consistent with previous literature. As expected, the modified MCL reproduced LV overload and distension which is consistent with physiology. 28 Also, haemodynamic data reported in this study are in line with the previous numerical studies in which Stevens et al. reported that ECMO flow had to be between 70 and 92% of total cardiac output in order to perfuse at least one of the cerebral arteries.14,29
Mock circulation loops have numerous benefits, as they provide a controlled environment where multiple parameters – such as ventricular contractility, systemic vascular resistance, cerebral autoregulation or ECMO flow – can be easily adjusted and where several ‘invasive’ measurements – such as arterial pressure, ventricular volume and pressure – can be measured. All the conditions or measurements cited above are either difficult (obtaining a ‘stable’ refractory cardiogenic shock) or impossible to obtain in animal or clinical settings (such as pressure-volume loops).
Our study suffers several limitations. First, our MCL cannot, for obvious reasons, perfectly mimic the physiology of blood flow occurring within the upper thoracic aorta. In particular, three main conditions are worth mentioning: 1) the difference in compliance with human aorta, 2) the inability for the mechanical aortic valve to leak when an increase in the LV afterload happens, and 3) the inability for the mitral valve to regurgitate when LV was overloaded. Second, we decided to adjust the global cerebral blood flow (and not each cerebral vessel) and could not quantify the percentage of blood mixed between the ECMO and native LV that perfused the left or right cerebral circulation. Third, we neglected the perfusion to the coronary circulation, which may have implications on ventricular function. Finally, we did not examine the fluid dynamics
Also, more than the cannulation site itself, the tip position of the venous drainage has shown a major impact on the consequences of differential hypoxemia. In Hou et al. study, 16 drainage from the superior vena cava achieved a better oxygenation than that of the inferior vena cava even though canulation site was not changed. Nevertheless, our MCL could not mimic those different venous tip position strategies.
Perspectives and future work
1) Use of the MCL
We intend to use our modified MCL with fresh blood (human or animal) and a second membrane oxygenator in order to adjust oxygen content of the left ventricle, and ultimately determine oxygenation consequences of the location of the MZ.
Also, our MCL will be used to evaluate different strategies to treat differential hypoxemia (5) or unload the left ventricle.3,30,31 These strategies mainly rely either on ‘hybrid ECMO’
32
which corresponds to the addition of a venous return cannula (VVA mode), or on combining ECMO with other devices such intra-aortic balloon pump, Impella® or pulsatile cannulas. 2) In-vivo validation
Understanding the consequences of the different mixing zones on brain and coronary arteries requires an in-vivo model of clinically relevant differential hypoxemia. Our group is currently working on an ovine model of differential hypoxemia that might answer these questions.
Conclusion
Our mock circulation loop represents a novel method to investigate differential hypoxemia occurring during cardiogenic shock supported by VA ECMO and generate data prior to costly animal experiences. Data obtained from arterial waveforms (i.e. pulse pressure) was not correlated with the mixing zone location. On the other hand, temperature variation within the right subclavian artery was correlated with a mixing zone location beneath the right subclavian artery, corresponding to a total brain perfusion by VA ECMO.
Supplemental Material
sj-pdf-1-prf-10.1177_02676591211056567 – Supplemental Material for A mock circulation loop to evaluate differential hypoxemia during peripheral venoarterial extracorporeal membrane oxygenation
Supplemental Material, sj-pdf-1-prf-10.1177_02676591211056567 for A mock circulation loop to evaluate differential hypoxemia during peripheral venoarterial extracorporeal membrane oxygenation by Sacha Rozencwajg, Eric L Wu, Silver Heinsar, Josh Chinchilla, John F Fraser and Jo P Pauls in Perfusion
Footnotes
Acknowledgements
The authors would like to acknowledge Mr Johannes Lorenz for the illustrations.
Authors’ contributions
SR, EW, JP and JFF conceived the study. SR and EW wrote the first draft of the manuscript. All authors participated in the final edit and in review of the manuscript. All authors read and approved the final manuscript.
Declaration of conflicting interests
The author(s) declared no potential conflicts of interest with respect to the research, authorship, and/or publication of this article.
Funding
Publication of this article was funded by the Australian National Health and Medical Research Council (NHRMC) Centre for Research Excellence in Advanced Cardio-respiratory Therapies Improving OrgaN Support (CREACTIONS). The contents are solely the responsibility of the authors and do not reflect the views of the NHMRC. We acknowledge the funding of The Prince Charles Hospital Foundation Team (TM2017-04) for the laboratory equipment.SH received a scholarship from the University of Queensland and The Prince Charles Foundation (Australia) for his PhD. JP received fundings through the Foundation Fellowship (RF2018-06).
Supplemental material
Supplemental material for this article is available online.
Appendix
References
Supplementary Material
Please find the following supplemental material available below.
For Open Access articles published under a Creative Commons License, all supplemental material carries the same license as the article it is associated with.
For non-Open Access articles published, all supplemental material carries a non-exclusive license, and permission requests for re-use of supplemental material or any part of supplemental material shall be sent directly to the copyright owner as specified in the copyright notice associated with the article.