
Abstract
Applied linguistics may benefit from a morphological complexity measure to get a better grip on language learning problems and to better understand what kind of typological differences between languages are more important than others in facilitating or impeding adult learning of an additional language. Using speaking proficiency scores of 9,000 adult learners of Dutch as an additional language, we reproduced the findings of the Schepens et al. (2013a) study, using a reduced morphological complexity measure. We wanted to define a reduced measure to reveal which morphological features constitute the really important learning problems. Adult language learners whose first language (L1) has a less complex morphological feature configuration than Dutch turned out to have more learning difficulties in acquiring Dutch the less complex their L1 is in relation to Dutch. The reduced measure contains eight features only. In addition, we found cognitive aging effects that corroborate the construct validity of the morphological measure we used. Generally, adult language learners’ speaking skills in Dutch improve when residing longer in the host country. However, this conclusion is only warranted when their L1 morphological complexity is at least comparable to Dutch morphological complexity. If the morphological complexity of their L1 is lower as compared to Dutch, the effect of length of residence may even reverse and have a negative impact on speaking skills in Dutch. It was observed that the negative effect of age of arrival is mitigated when adult language learners have a command of a second language (L2) with higher morphological complexity. We give morphological information for five additional target languages: Afrikaans, Chinese, English, German, and Spanish.
Keywords
I Introduction
In acquiring an additional language (La), adult second language learners experience a variety of problems among which acquiring the vocabulary is the most obvious one. Learning the morphological rules of an La is another well-known problem (Housen, De Clercq, Kuiken and Vedder, 2019). It is often a painstaking process marked by transfer issues, i.e. the influences of the first language (L1) on learning an La, that can either be beneficial or hindering, depending on the presence or absence of L1 and La morphological features (De Clercq and Housen, 2019; Ehret and Szmrecsanyi, 2019; Kellerman and Sharwood Smith, 1986; Lado, 1957; O’Grady, 2006; Odlin, 1989; Paquot, 2019; Weinreich, 1963). Schepens et al. (2013b) found that the lower the morphological complexity of the L1 is, in comparison to Dutch, the lower the speaking proficiency scores of adult learners of La Dutch are. This is nicely illustrated by the outcomes of the present study as well. It will turn out that adult L1 German learners of La Dutch had better results than adult L1 Afrikaans learners of La Dutch on an official exam of Dutch as a second language. While the three languages are West Germanic Languages, Afrikaans is a daughter language historically closer to Dutch. Its morphology and grammar became more analytic than Dutch in the course of time (van Rensburg, 1983; van Sluijs, 2013), but their lexicons are still quite similar. German with its extended case system is morphologically more complex than Dutch. L1 German learners have to cope with less morphological complexity; L1 Afrikaans learners have to learn new, additional morphology, like the use of agreement between subject and verb. The observed differences in learning success between the two language groups, both groups performing highly, but the L1 Afrikaans learners performing worse than the L1 German learners, clearly demonstrate the conceivable role morphological complexity may have in adult second language acquisition processes. Linguistic complexity can be defined in many ways (Ehret and Szmrecsanyi, 2019; Szmrecsanyi and Kortmann, 2012). Schepens et al. (2013a) made use of a relative measure of morphological complexity (see Arends, 2001; De Clercq and Housen, 2019; Kusters, 2008; Miestamo, 2008) relating the properties of Lx to the properties of Ly. The present study will also make use of such a relative morphological complexity measure.
How can we measure the morphological complexity of languages? Lupyan and Dale (2010) selected 28 morphological features from the WALS (world atlas of language structures) database (Dryer and Haspelmath, 2011). One of these features, for instance, is the encoding of past tense through verb inflection versus its expression in an analytic way by explicit lexical means on the sentence level. Other features relate to the complexity of conjugations and case systems and to the use of lexical means to encode, for instance, evidentiality, negation, aspect, and possession versus synthetic, morphological inflections. Lupyan and Dale (2010) applied these 28 features to more than 2,000 languages. Their Linguistic Niche Hypothesis makes a distinction between languages spoken in esoteric niches (smaller populations, smaller areas, fewer linguistic neighbours), and exoteric niches with large numbers of speakers. Population size came out as a proper predictor for complexity-related patterns of 23 out of these 28 features, which is in accordance with the Linguistic Niche Hypothesis. Feature values that express lexical coding were found more predominantly among languages spoken in exoteric niches, while values expressing morphological coding were found more often among languages spoken in esoteric niches. By adding up the number of features for which each language relies on either lexical or morphological coding, Lupyan and Dale (2010) constructed a more general morphological complexity measure. It turned out that languages spoken by large groups are more likely to have lexical strategies instead of morphological procedures. Lupyan and Dale (2010) explain the relationship between morphological complexity and population size by the assumption that larger languages are often acquired by adult second language learners who fail to learn the complex features of their additional language, and, therefore, will not pass them on to subsequent learners. L1 speakers probably take their share as well, as suggested by Wray and Grace (2007), by expressing themselves in more analytical ways (see the concept of foreigner talk), to facilitate communication with second language (L2) speakers. As a result, the languages involved will ultimately become more analytical, solving communicative demands of their users by providing explicit lexical means instead of morphological tools.
The link between the impact of adult language learning and decreasing complexity has been explicated in many other studies. McWhorter (2002), for example, explains the simplification of English to massive second language acquisition by Scandinavians from the eighth century onwards. Other examples are Creole languages. McWhorter (2001: 163) gives the following list of grammatical features typically levelled by creolization in the 19 Creoles he investigated ‘[…] ergativity, grammaticalized evidential marking, inalienably marking, switch-reference marking, inverse marking, obviative marking, “dummy” verbs, syntactic asymmetries between matrix and subordinative clauses, grammaticalized subjunctive marking, verb-second, clitic movement, any pragmatical neutral word order but SVO, noun class or grammatical gender marking (analytical or affixial), or lexically contrastive or morphosyntactic tone […].’ Although McWhorter refers to syntactical and morphological features as communicatively redundant baggage coming from the past, his list is also bound to answer the question why morphosyntactic simplification occurs in the first place. According to Trudgill (2001: 372) ‘[linguistic] complexity increases through time, and survives as the result of the amazing language-learning abilities of the human child, so complexity disappears as a result of the lousy language-learning abilities of the human adult.’ This conclusion may seem rather strong, given the abundant evidence that adult language learners can reach near-native levels of target language proficiency (e.g. Birdsong, 2005; Bongaerts et al., 1995, 2000), and that adult learners show steeper learning curves than children, at least in the initial stages (Krashen et al., 1982; Marinova-Todd et al., 2000; Saville-Troike, 2012; Snow and Hoefnagel-Höhle, 1977). However, the general trend to be observed is that adult language acquisition is marked in the end by lower overall levels of proficiency in the target language.
How can we investigate the role of morphological complexity in adult language learning in more detail? In a previous study (Schepens et al., 2013a), we used the morphological features selected by Lupyan and Dale (2010) to predict speaking proficiency scores of adult learners of Dutch (for a description of these features, see Lupyan and Dale, 2010: Text S6; Schepens, 2015: 81–82; see also http://wals.info/feature). We defined complexity of the L1s of the learners relative to Dutch by comparing their L1s and Dutch complexity values of the features selected by Lupyan and Dale (2010). The correlations we found between feature-specific morphological complexity differences between Dutch and the 73 L1s of the adult learners confirmed that morphological complexity poses serious learning problems and that we could compute an overall morphological complexity measure for differences between the L1s involved and Dutch. To obtain an overall measure of complexity between the L1s and Dutch, we computed the overall correlation between learnability of Dutch (based on the scores on the speaking proficiency test) and the overall set of differences in morphological complexity using weighted correlation coefficients of all features. We first address the preliminary question whether our earlier findings for La Dutch were robust enough to emerge again in analysing a more recently collected set of data (2010–14 instead of 1995–2010):
Does our new data set reveal the same correlation pattern between an overall L1 morphological complexity measure and proficiency in Dutch as found in Schepens et al. (2013a)?
However, using weighted correlation coefficients to compute overall morphological complexity is a rather opaque procedure because of intercorrelations between the features involved (the features may for instance represent comparable morphological procedures) and because weights have the disadvantage of being sample specific (they depend for instance on the distribution of the morphological features present in the L1s of the sample of learners). It is our aim in this contribution to define morphological complexity in a more transparent way by focusing on a limited set of features, in relation to La Dutch. A reduced measure may enable us to gain deeper insight in which morphological features facilitate or impede La acquisition.
Specifically, we found in Schepens et al. (2013a) that out of eight features for which there were significant effects of morphological differences across the L1s of the learners, seven were due to an increase in morphological complexity from a L1 perspective and only one was due to a decrease. When La learners have less complex values on these seven features they need to learn new morphological procedures (e.g. with respect to verbal person marking, past tense, coding of negations, or possessives). So, our next step is to dissect the morphological complexity measure in detail by focusing on individual morphological features that really seem to matter by being directly involved in shaping overall morphological thresholds adult Dutch La learners have to cope with. Our second research question therefore is:
Can we reduce the overall morphological complexity measure in an insightful way without losing power in predicting Dutch La learnability?
Next, Schepens et al. (2016) found that not only the L1s, but also the L2s morphological complexity had an impact on learning La Dutch, although considerably less than the L1 effect. We want to investigate the role of the L2 in the new data as well, because, again, a recurrent pattern would substantiate the relevance of the morphological complexity effect and underline the essential role of morphology in adult language acquisition. Moreover, taking this effect into account reflects the multilingual situation of the respondents who in the majority of the cases learned Dutch as a third or later language. This effect is comprised in our third research question:
Does L2 morphological complexity have an influence on acquiring La Dutch?
Our final research question pertains to the influence of age-bound factors. We want to provide supportive evidence in favour of our morphological complexity measure by investigating the effects of age-bound factors. Research on language acquisition consistently points out that child learners are dramatically better equipped to master morphology than adult learners, although this distinction seems to evolve gradually over age (see Bialystok and Hakuta, 1994; Birdsong, 2005; Chiswick and Miller, 2008; van der Slik, 2010), and less sharply or discontinuously than suggested in the past (Johnson and Newport, 1989). Language learning capacities seem to decline gradually over a longer period of time, putting forward the question whether cognitive aging directly relates to life-long gradual processes of decay leading to a steady, slow, but persistent decline in language learning capacities (Hakuta et al., 2003), particularly in the domain of morphology (see Birdsong and Flege, 2001). Schepens et al. (2016) found age-bound effects in adult language learners. Learning success appeared to gradually decrease with increasing age of arrival (AoA). The other age-bound variable was length of residence (LoR) in the Netherlands. The longer the LoR was the better the proficiency results were in the exams, implying that experience and practice may in fact compensate for cognitive aging. Both effects seem plausible from the viewpoint of cognitive aging processes and time spent to learn. Consequently, we expect these age-bound effects to recur in the analysis of our new data set. However, age-bound effects may perhaps deliver additional, even crucial evidence that supports the validity of the morphological complexity measure we use. When acquiring morphology is an age-bound process, morphology is not only hard for adults in general, becoming harder for them growing older, but its effect may be moderated by the degree of complexity of the La, in comparison to the complexity of their L1.
Salthouse (2004, 2009, 2010a, 2010b) presents ample evidence that age-related cognitive decline starts already around the age of 20, but also that cognitive aging does not occur in all domains equally strong and with the same speed. The capacity of learning new vocabulary, for example, remains remarkably intact. Various studies (see Salthouse, 2004) have shown that the number of words people are familiar with keep increasing until people are in their sixties. On the other hand, a measure of paired associates memory performance, which aims at linking a target word to the best associate only recently acquired, shows a monotonic decrease with age (Salthouse, 2010a). In addition, measures of speed, reasoning and memory have fairly impressive linear declines from the age of 20 onwards (e.g. Harada et al., 2013). The actual effects of cognitive decline appear to be hardly noticeable in everyday life: ‘the greater experience and knowledge associated with increased age probably reduces the need for the type of novel problem solving that declines with age’ (Salthouse, 2004: 142).
Acquiring an additional language however requires novel types of problem solving. Acquiring an additional language that is morphologically more complex than one’s first language seems to present an extra challenge that is more susceptible to cognitive aging than acquiring an additional language that is less complex. The harder the learning task, i.e. the more complex the La is in comparison to the L1, the more negative the outcome of cognitive aging is expected to be. This expectation is also sparked by the outcomes of the Birdsong and Flege (2001) study, which reported an interaction between age of arrival and morphological complexity. Keeping length of residence constant, they found a stronger negative effect of age of arrival on grammaticality judgments in morphologically more complex L2 tasks than in morphologically less complex tasks (see also Birdsong, 2005). We therefore formulated the following research question including AoA as the predictor and morphological complexity as the moderator variable:
Does morphological complexity help to explain differences in age of arrival (AoA) effects in acquiring La Dutch?
In investigating AoA effects we need to take LoR into account, as done by Birdsong and Flege (2001), because LoR is another and perhaps competing age-bound factor that affects La acquisition.
II The present study
We made use of the most recent subset of a large-scale database, gathered in the period 2010–14, containing information on 22,638 immigrants to re-examine the impact of the morphological complexity of their L1 and L2 on their speaking proficiency scores on Dutch as an additional language. This is a partial replication of a study that used a less recent subset of the same database, containing information on around 50,000 immigrants (Schepens et al., 2013a, 2016), collected in the period 1994–2010. The large-scale database that we used provides a particular strong testing ground for our research questions given the enormous amount of L1s and countries of origin and given the social-demographic and contextual characteristics we have included in the statistical analyses.
The impact of morphological complexity on the acquisition of Dutch as an additional language was examined in immigrants from 33 mother tongue backgrounds, spoken in 67 countries, 20 of which were Indo-European (IE) and 13 non-Indo-European (non-IE). In the latter group, there were three Afro-Asiatic (Arabian, Berber, Amharic), two Austronesian (Indonesian, Tagalog), and two Uralic languages (Finnish, Hungarian). There were two Altaic (Mongolic, Turkish), one Kartvelian (Georgian), one Japanese, one Sino-Tibetan (Chinese), and one Tai-Kadai (Thai) language. Examinees originated from 29 Western countries (including Canada, the USA, and former East European countries), eight African countries, 11 countries from South and Central America, five from East Asia, seven from the Middle East, and seven South Asian counties. Stable estimates of country and language level effects require a sufficient number of observations in the country-level combinations. The minimum amount of observations is open to discussion, however (see Bell et al., 2010). We opted for the requirement that countries of origin and mother tongues had to contain a minimum of 15 examinees in order to be included in this study, like we did in previous studies.
III Method
1 Sample
Currently, the State Examination of Dutch as a Second Language (STEX) is administered almost every week of the year. The examination consists of two separate exams. Program II (STEX II) is meant for immigrants who intend to enrol in higher-level education in the Netherlands, or who have a higher-level occupation. Program I (STEX I) aims at immigrants who intend to follow a lower level of (vocational) education, or who have a lower or middle-level occupation. The requirements for Dutch language proficiency are the same for both levels, but the abstraction (academic) level of Program II is higher (for detailed information, see College voor Toetsen en Examens, 2016; Schepens et al., 2013a).
The Program II exam results were available for the years 2010 up to 2014. The examination covers four language skills: speaking, writing, reading, and listening, which are tested separately. An examinee passes the entire exam when she or he has acquired 500 points or more on each of the four sub-exams. The current study focuses on the productive skill of Dutch speaking proficiency. Writing skills in La Dutch could also have been examined, but we decided to keep our focus on speaking. Writing skills not only develop at a later age, including them would also require additional knowledge on the examinees’ command of the Roman script and on the different literacy methods used worldwide. The results of a previous study also indicated that the outcomes for La Dutch writing proficiency are largely comparable to those of La Dutch speaking proficiency (van der Slik et al., 2015).
In total, 22,638 examinees took the speaking sub-exam in the period 2010–14. In case of re-exams, we only used the first available test score. Data on test scores, gender and age were available for all examinees. Only adult second language learners who arrived in the Netherland between 18 and 65 years of age were included in the study. This reduced the number of examinees by only 3% to 21,700.
As part of the electronic registering procedure, examinees are invited to fill in a brief questionnaire about various background characteristics, such as date of arrival in the Netherlands, country of birth, mother tongue, education, etc. This reduced the number of examinees with valid scores substantially to 12,540. The morphological complexity scores of examinees’ mother tongues were not available for all L1s. This reduced the number of valid scores on all the variables of interest to 11,814. Finally, restricting the data to L1s and countries of birth containing at least 15 learners reduced the number of valid scores to 8,754.
2 Variables
All variables involved are summarized in Table 1. These variables are discussed below as criterion variable (speaking proficiency), and learner and context characteristics. Table 1 gives information on the means scores (plus standard deviations) or proportions of these variables.
Description of the sample for the dependent variable the Dutch Speaking Proficiency Test (criterion), and the explanatory variables, split out between learner and context characteristics (33 L1s, 35 L2s and 67 countries).
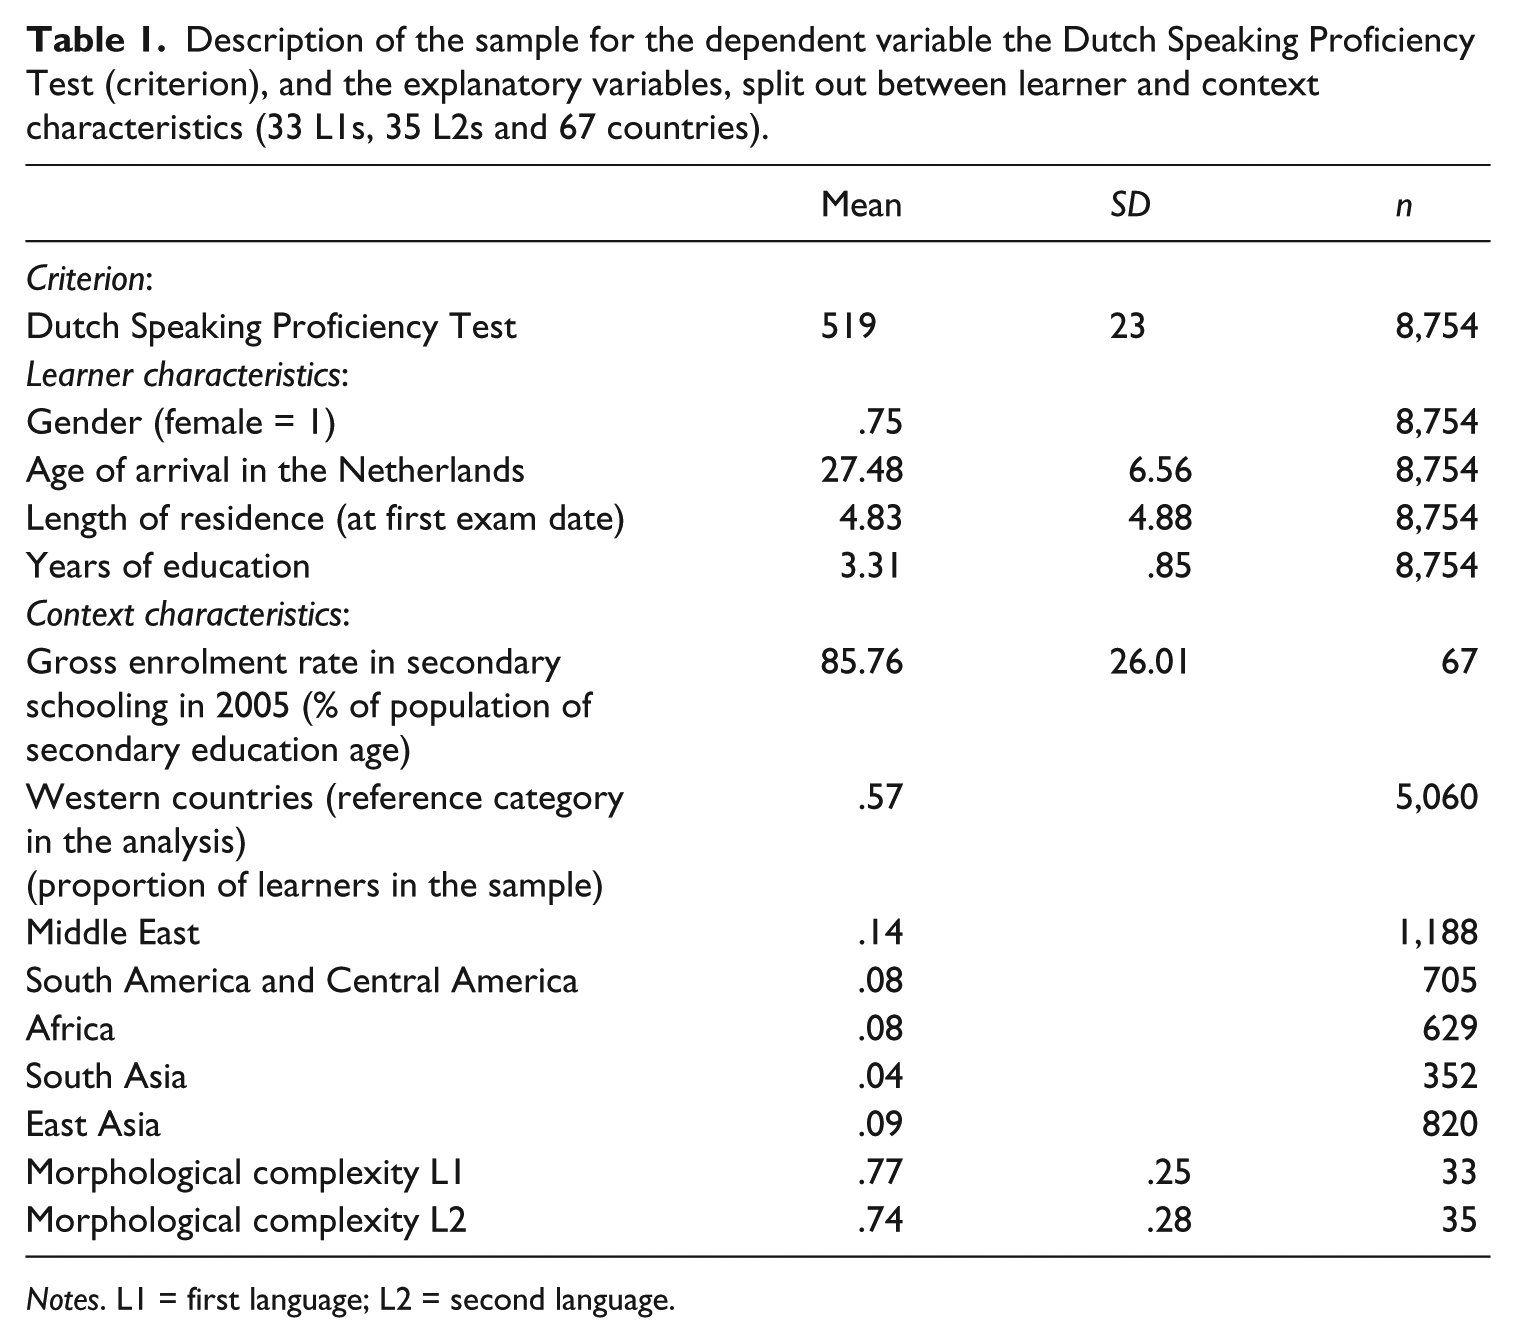
Notes. L1 = first language; L2 = second language.
The Dutch speaking proficiency test was constructed by the Centraal Instituut Toetsontwikkeling (Central Institute for Test Development) and the Bureau Interculturele Evaluatie (Bureau for Intercultural Evaluation), two large test battery constructors in the Netherlands. The typical speaking test consists of 14 assignments. Candidates are urged to respond orally to prompts like: ‘In Dutch television a lot of ads are made for all kinds of products, even in the middle of a program. What is your opinion about ads on TV?’ These spoken elicitations are recorded on tape. The examination takes 30 minutes. Two independent expert raters evaluate the oral production on content and correctness criteria. Primary content criteria are the appropriateness of the content related to the task (about 30%) and vocabulary size (around 18%). The most important linguistic criteria are word and sentence formation (about 28%), and pronunciation (about 12%). The remaining 12% refer to fluency, rate of speech, coherence, word choice and register (for detailed information, see Schepens et al., 2016).
The degree of difficulty of the examinations was held constant over time, by applying a specific Item Response Theory (IRT) model, namely the One-Parameter Logistic Model (Verhelst et al., 1995): an advanced type of Rasch model. A decisive advantage of IRT models as compared to models based on Classical Test Theory is that the test scores of candidates who took the exam on different occasions are allocated to the same ability distribution, implying that their test results can be analyzed together. In order to achieve this, parts of earlier exams were used in new exams (though the actual design was much more complex). The scores on the exam were standardized. A mark of 500 or higher means that the candidate had passed the exam and indicates that the examinee has a proficiency at the B2 level (independent user, vantage level) as defined in the Common European Framework (Council of Europe, 2001), equivalent to IELTS 5.5 (International English Language Testing System; Kuijper et al., 2004).
3 Learner characteristics
a Gender
Females were coded as 1, males as 0.
b Age of arrival in the Netherlands
On the basis of information on ‘Year of birth’ and ‘Date of arrival’, age at the time examinees arrived in the Netherlands was calculated. We excluded examinees who were younger than 18 years at the time of their arrival and examinees who were older than 65 years of age when arriving.
c Length of residence
On the basis of information on ‘Date of the exam’ and ‘Date of arrival’, length of residence in the Netherlands was calculated.
d Years of education
Examinees were asked how many years of regular daily education they had received from their sixth year onwards. Possible answers were: (1) up to 5 years; (2) between 6 and 10 years; (3) between 11 and 15 years; (4) 16 years or more.
All variables were centred around their grand mean to reduce the risks of multicollinearity in interaction and higher order terms (Kreft and de Leeuw, 1998).
4 Context characteristics
a Morphological complexity L1
In the present study, we apply an alternative, reduced way of computing morphological complexity. Previous studies (Schepens, 2015: 83–86; Schepens et al., 2013a, 2016) in fact showed that that morphological complexity only had an impact when the source language (the L1) was less complex than Dutch. Dutch has a positive complexity score on 16 of the 28 features (see Appendix 1; a score higher than 1), 8 of which had positive correlations with the measure of increasing morphological complexity of above .30 for the L1s (see Table 2). We used only these 8 features to compute a reduced measure of increasing morphological complexity; for a description of these features, see Appendix 2.
b Morphological complexity L2
Examinees were not just asked what their first language was, but also if they had command of other languages. If the answer was affirmative, they were asked to indicate which second language they spoke best. Based on this information, the morphological complexity of their second language relative to Dutch was computed.
Not all immigrants included in this study indicated to have command of an L2. The L2 complexity score of all monolingual language learners of Dutch was set at zero, signalling for this group of learners the complexity score of a language that is minimally complex compared to Dutch (for a detailed discussion, see also Schepens et al., 2016). These monolingual learners still have the complexity score of their L1.
c Educational accessibility
The World Bank (2015) reports on education data in a wide number of countries around the world on a regular basis. We took the gross enrolment rate in secondary schooling per country in 2005 as an indicator for a country’s educational accessibility.
d Geographic region
Previous research has shown that L2 learners from different geographic regions may differ in their La proficiency (Carliner, 2000). The reasons for this variation are largely unknown, but we concluded to control for this confound by including geographic region as a proxy. To capture these potential test score differences we made a distinction between the following geographic regions: Western countries, South and Central America, Africa, the Middle East, South Asia and East Asia. Western countries were used as the reference category.
5 The reduced morphological complexity measure
The eight remaining WALS features and their numbers are given in Table 2; their actual complexity values are given in Appendix 1. Based on the coding patterns found by Lupyan and Dale (2010), each feature of a given language can be categorized as less complex (0) or equal or more complex (1) than Dutch. On feature 22 (Inflectional Synthesis of the verb), for example, Afrikaans, Dutch, English, and German have 2–3 categories per word, Spanish has 4–5 categories per word, while Chinese has 0–1 categories per word. Therefore, with respect to feature 22, Chinese is morphologically less, and Spanish more complex than Dutch. Less complex returns the value 0, equal or more complex returns the value 1. The complexity score was calculated by dividing the number of equal or more complex features by the total number of features available for that particular language (the eight features were not weighted according to their importance). For Afrikaans, only three out of eight features are evaluated as equal or more complex compared to Dutch, so the complexity score of Afrikaans relative to Dutch is 3/8 = .375. German returns the maximum value of 1 (for more details, see Appendix 1). However, not all these eight morphological features are available for every language included in our study, so we decided to calculate a score only in case information on at least half of the features for a language was available.
The correlations of the selected eight morphological features (WALS number) and speaking proficiency in La Dutch (BLUPS); the number of languages is 49, 32, and 33, respectively.
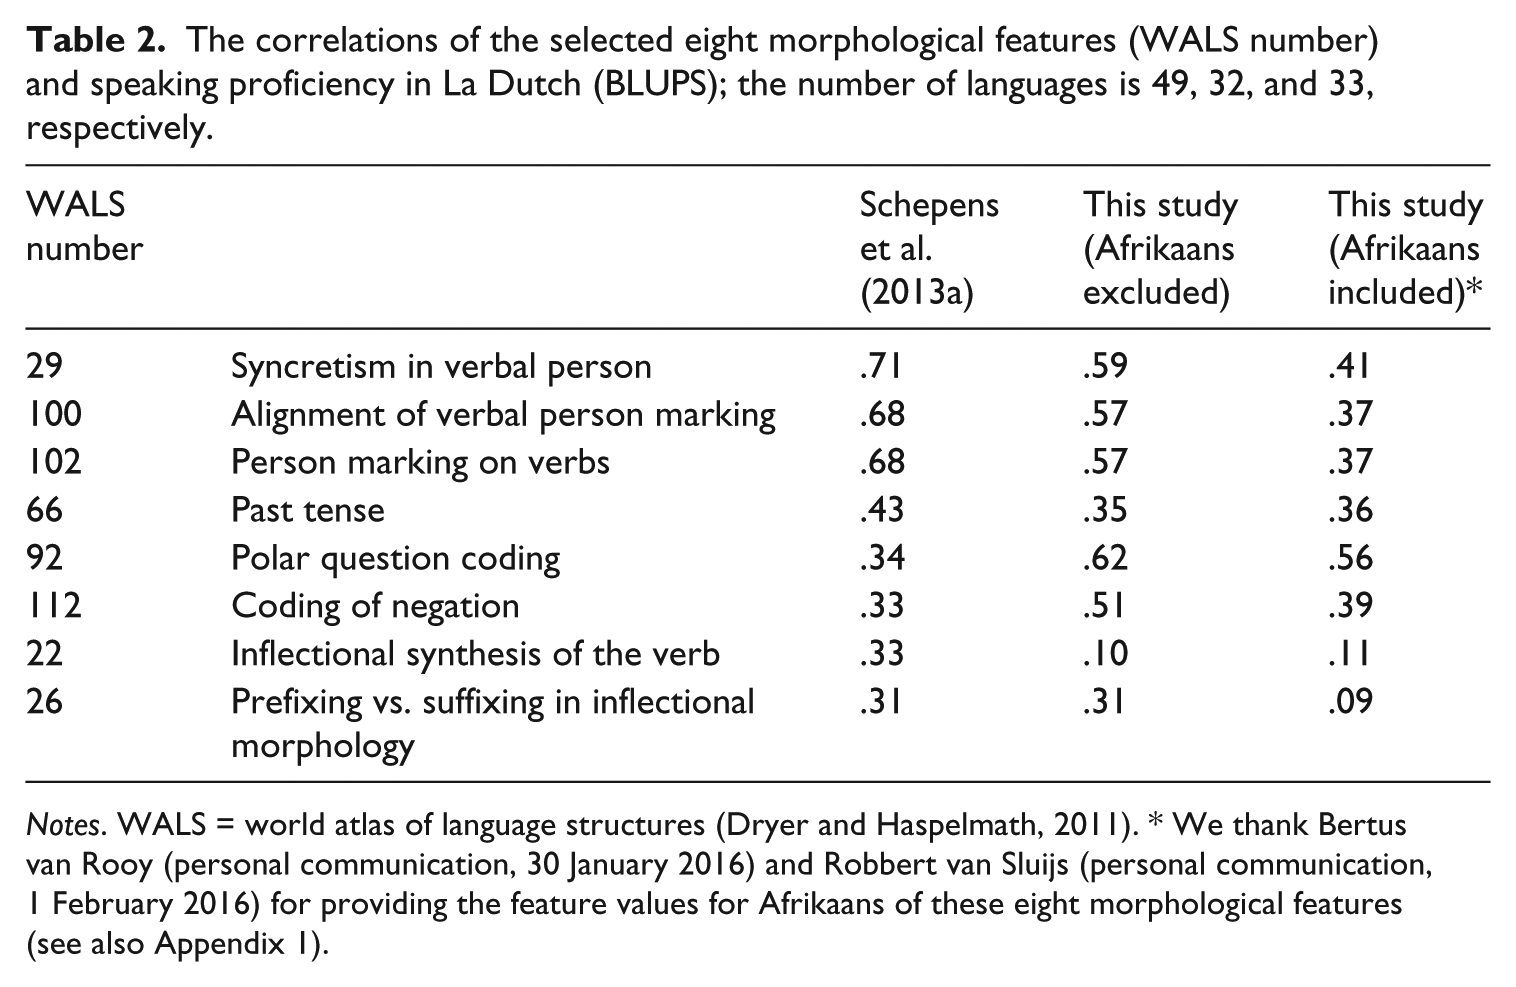
Notes. WALS = world atlas of language structures (Dryer and Haspelmath, 2011). * We thank Bertus van Rooy (personal communication, 30 January 2016) and Robbert van Sluijs (personal communication, 1 February 2016) for providing the feature values for Afrikaans of these eight morphological features (see also Appendix 1).
Cross-classified multilevel model parameter estimations for measures of the Dutch Speaking Proficiency Test (standard errors in parentheses) per mother tongue (L1), second language (L2), and country of birth.
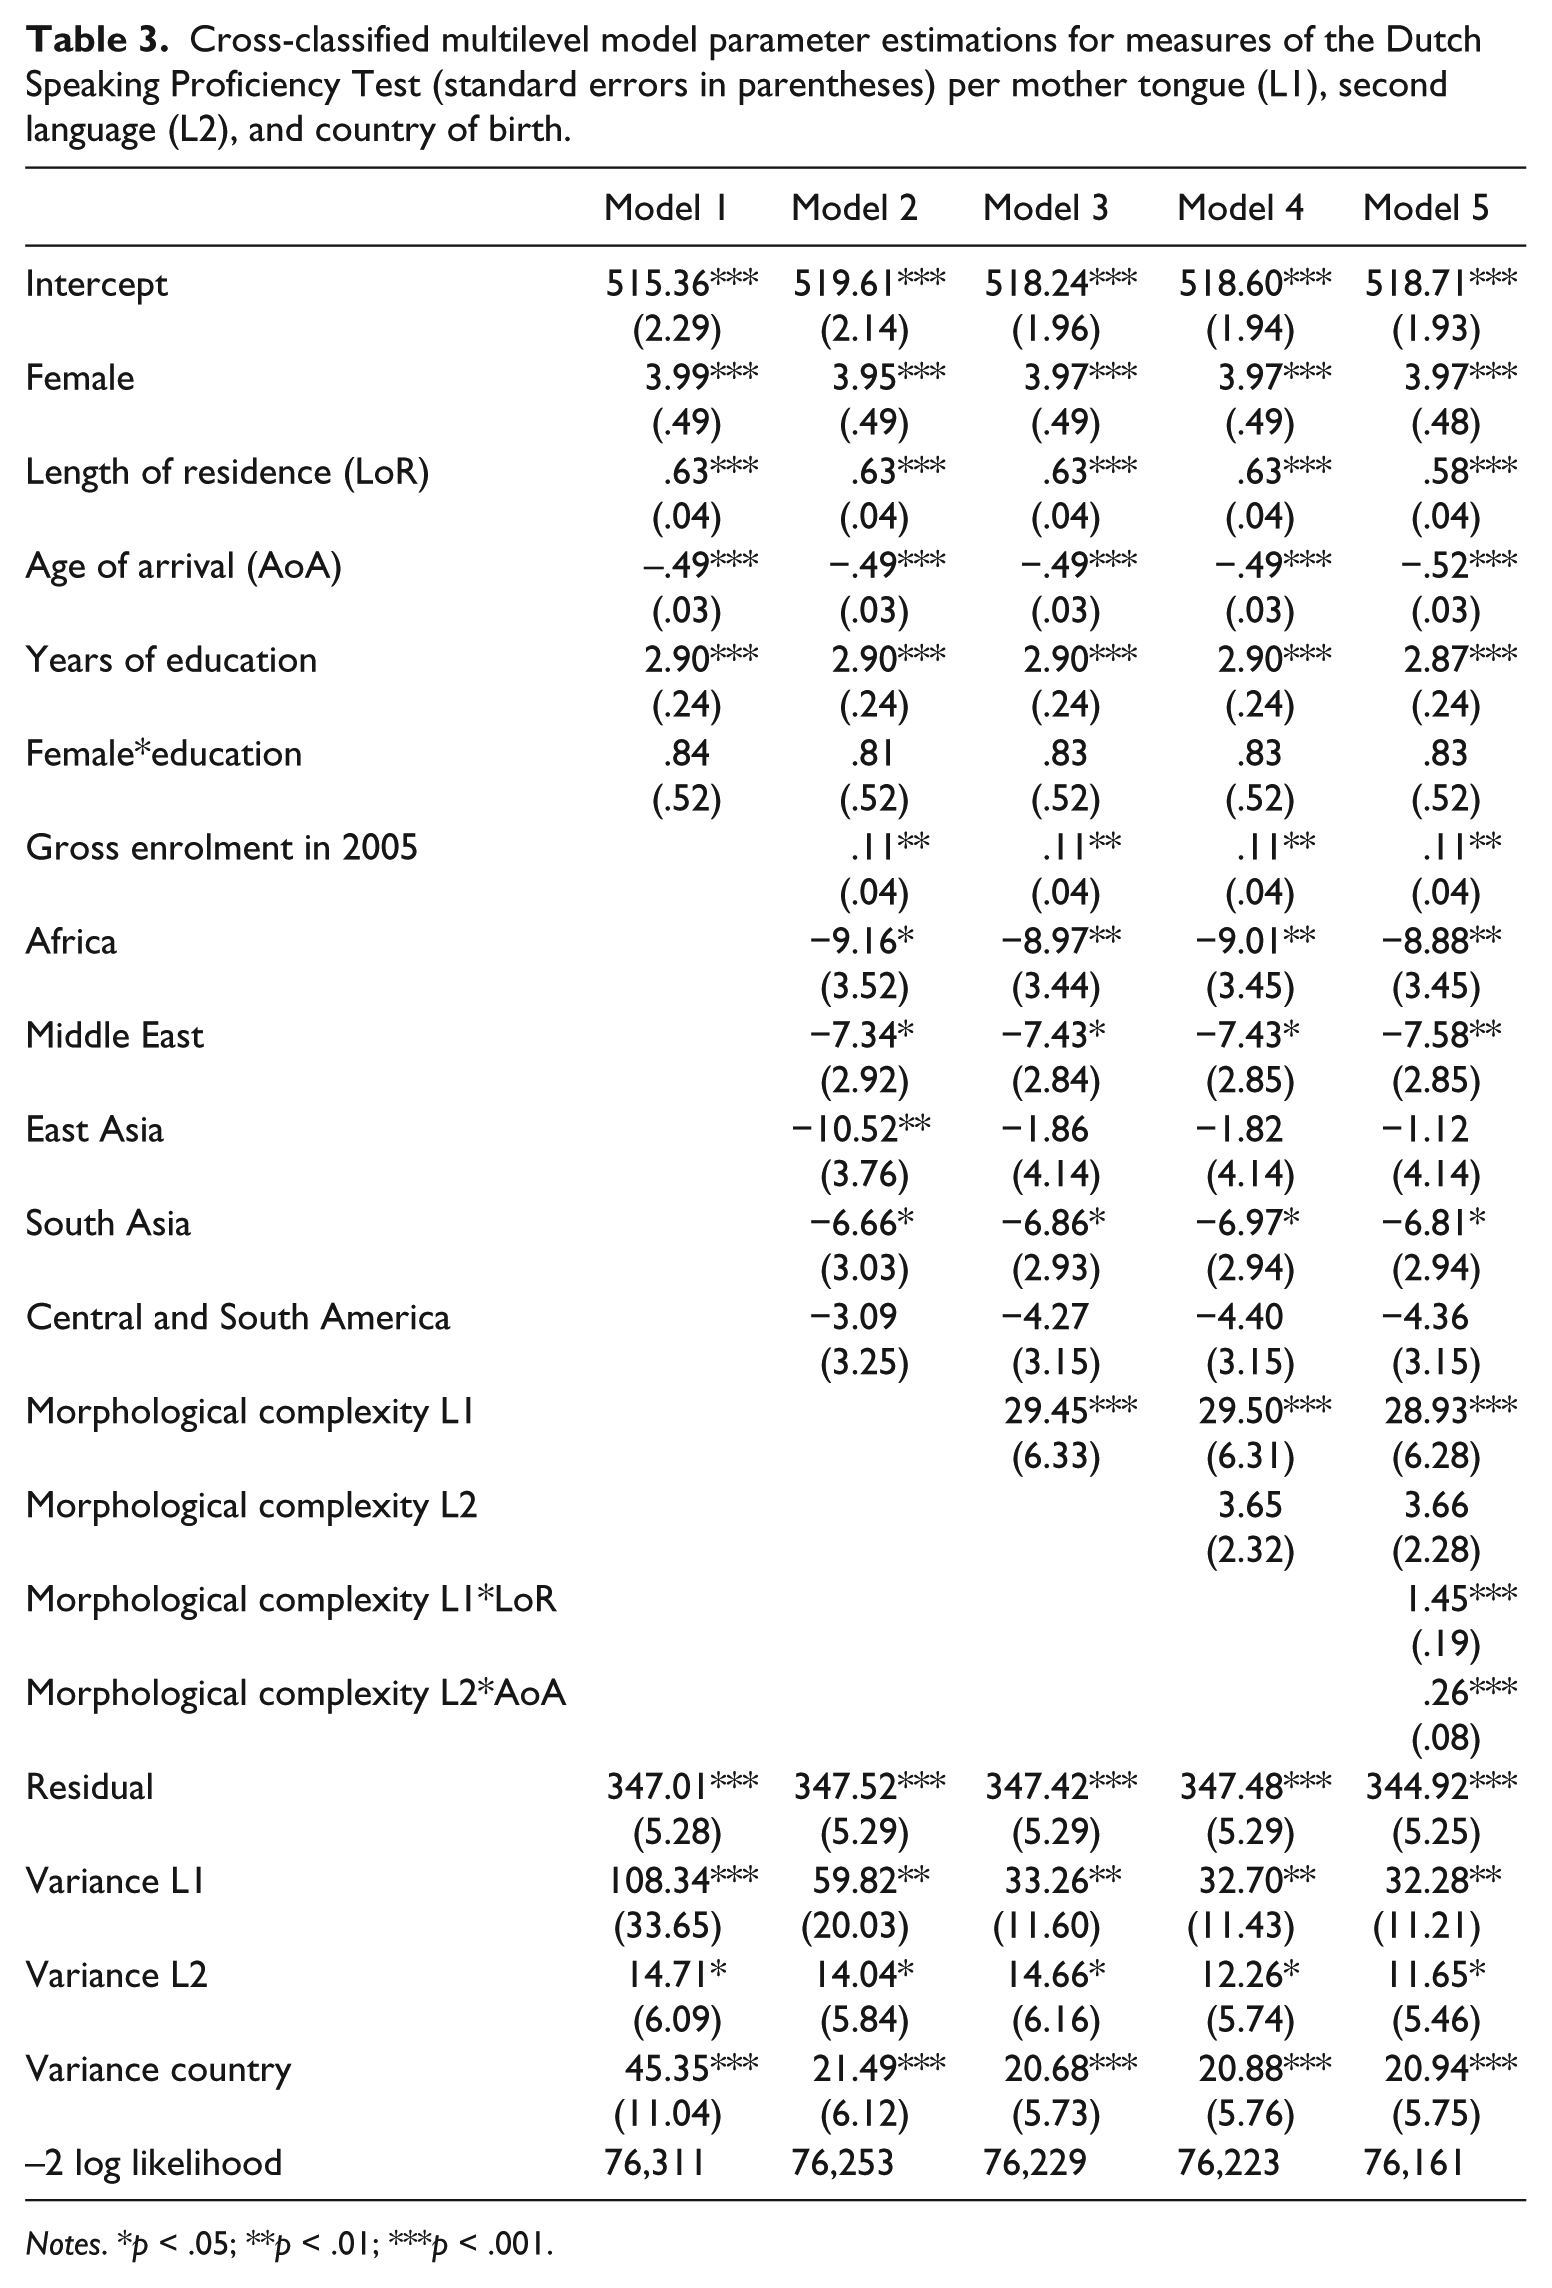
Notes. *p < .05; **p < .01; ***p < .001.
It turned out that this reduced measure of complexity covered the original complexity measure almost entirely since the correlation on the L1 level was r(33) = .973 (p < .0001). Also the correlation for the L2s is extremely high, r(35) = .968 (p < .0001). Our first research question was whether the correlations found in the Schepens et al. (2013a) study would be replicated in the present study and these extremely high correlations automatically return a positive answer.
To investigate the specific role of the eight features in the acquisition of La Dutch speaking proficiency we computed correlations between these features and speaking proficiency. We repeated the analyses from Schepens et al. (2013a), now using the 2010–14 data base. We calculated Best Linear Unbiased Predictors (or BLUP’s) for all L1s using a model with L1, L2 and country of birth as random factors, and controlling for the individual characteristics: gender, education, age of arrival, length of residence, and secondary school enrolment, using the ranef function in the statistical package R. Schepens et al. (2013a) did not include Afrikaans, as the data are not available in the WALS database.
We computed the values for the eight features in Table 2 and included the Afrikaans data in our analysis of the 2010–14 data. The changes in the first two columns do not seem substantial. The set of features remains intact regardless which data base is being used. The average correlation between feature values and BLUPS being .48 for the Schepens et al. (2013a) and .45, for this study (Afrikaans excluded). The correlations under the column with Afrikaans included clearly give lower outcomes (with an average correlation of .33) compared to the second column. It shows the special status of Afrikaans in our data analysis on morphological complexity, because its low morphological complexity is counteracted by the many lexical similarities between Dutch and Afrikaans. We return to this outcome in the discussion section.
An important issue is of course why these eight features are particularly relevant. Most of them relate to the verb, a domain where Dutch is marked by a series of inherent and derivational morphological properties (see Booij, 2002). The interpretation is complex, as the role of the particular configurations is dependent on the correlations between these properties as well. We come back to this issue in the discussion.
6 The statistical analysis
We used cross-classified multilevel models (we used SPSS 21, Heck et al., 2010), to take full account of the multilingual reality, i.e. migrants from different countries may have the same mother tongue, while migrants from the same country may speak different mother tongues, and may or may not have command of a second language. By applying cross-classification, we were able to test for effects at the learner level, the mother tongue level, the second language level, and the country of origin level. As a result, we can investigate the impact of morphological complexity of both the L1 and L2, while simultaneously controlling for confounding effects at context and individual levels.
First, we defined a null model (Model 0) for the Dutch speaking proficiency test with no predictive factors added. Learners, countries, mother tongues, and second languages were included as random factors (random intercepts). Next, we added the variables at the learner level in Model 1. In Model 2, we added the country level predictors. And finally, in Models 3 and 4, the language level predictors (morphological complexity of the L1 and L2) were included.
The model improvement is tested by means of the Log Likelihood ratio which follows a chi-square distribution. A model is considered to have a better fit than a preceding, more parsimonious model if the difference in the Log Likelihood ratio (–2LL) is at least 3.84 against one degree of freedom. When the improvement was significant, we checked the direction and size of the effect parameters.
The null model of the speaking proficiency scores contains four random variance components (so-called intra-unit correlations). They showed that 19.2% of the variation in speaking proficiency scores is across L1s, 2.6% across L2s and 7.9% across countries. Summing these up (see e.g. Goldstein, 2011), we observed that 29.7% of the total variance is to be attributed to country and language characteristics. Accordingly, the remaining variance at the learner level was estimated at 70.3% of the total variance in speaking scores (the fourth component).
In the next steps, we added fixed level 1 (learner characteristics) and level 2 (context characteristics) explanatory variables to the cross-classified design of languages by countries (see Table 2). Given the sizeable amount of data used in this study, effects were tested at the alpha = .01 level.
IV Results
1 Main effects
Initially, the learner characteristics gender, length of residence, age of arrival, and years of education were added to the null model. This reduced the likelihood ratio with 605, against 5 degrees of freedom which is highly significant. On average, women scored almost 4 points (B = 3.99, SE = .49, p < .001) higher than men did. The effects of age of arrival (–.49, SE = .03, p < .001), length of residence (.63, SE = .04, p < .001), and years of education (2.90, SE = .24, p < .001) were all highly significant, and in the predicted direction: the older language learners were at their arrival the lower their La Dutch proficiency scores; if length of residence increases La Dutch speaking proficiency increases; the more education they have received the higher their La Dutch speaking skills. Instigated by previous research (van der Slik et al., 2015) we also included the interaction term of education with sex, but we were unable to replicate the expected positive outcome since the effect is not significant (.84, SE = .52, p = .111). These outcomes corroborate the findings found in previous studies (Schepens et al., 2013a, 2016; van der Slik, 2010; van der Slik et al., 2015) using a different database to a large extent.
In Model 2 of Table 2, country of origin characteristics have been included. The improvement of fit was significant with 58 against 6 degrees of freedom, again being highly significant. The effect of educational accessibility as measured by gross enrolment in 2005 (.11, SE = .04, p = .009) was significant and indicates that immigrants from countries with secondary schooling being more accessible score higher on the Dutch speaking test than immigrants from countries with lower accessible secondary schooling. Immigrants from African countries (B = −9.16, SE = 3.52, p = .012), South Asia (B = −6.66, SE = 3.03, p = .031), South and Central America (B = −3.09, SE = 3.25, p = .344), and the Middle East (B = −7.34, SE = 2.92, p = .015) did not differ significantly from those originating from Western countries. East Asian immigrants, however, did score lower (B = −10.52, SE = 3.76, p = .009),
Next, the inclusion of the morphological complexity of the L1, Model 3, resulted in a significant reduction of the deviance with 24 against one degree of freedom. Immigrants with mother tongues that are morphologically less complex linguistically than Dutch had lower scores on speaking skills than immigrants whose first languages are equally or more complex morphologically (B = 29.45, SE = 6.33, p < .001) in the sense that learners with L1s at least as complex morphologically as Dutch score almost 30 points higher than learners with L1s that are less complex as Dutch with regard to the eight morphological features studied here. It can also observed that by including L1 morphological complexity, the relatively low La Dutch speaking scores of immigrants from East Asia (Model 2: B = −10.52, SE = 3.76) were levelled to a non-significant difference (Model 3: B = −1.86, SE = 4.14). Apparently, part of the regional differences in La Dutch speaking scores are to be ascribed to differences in L1 morphological complexity.
In model 4, we also included the measure of morphological complexity of the L2. 1 This posed a challenge however, since not all immigrants have indicated to have command of an L2. In order to overcome this issue, we, as already noted, decided to assign the value of zero for the L2 complexity scale for monolinguals (this approach defines the monolinguals as a separate group; see Schepens et al., 2016 for further explanation). The main effect of morphological complexity of the L2 did not prove to be significant, however (B = 3.65, SE = 2.32, p = .125).
2 Interaction effects of morphological complexity
We examined all first-order interaction effects of morphological complexity with learner and country characteristics. We adopted the following strategy. First, we tested all interaction effects of the morphological complexity of the L1 and L2 with learner characteristics. Only the significant interaction terms were included in Model 5 and discussed.
The outcomes of Model 5 reveal that the morphological complexity of the L1 interacts significantly with length of residence (B = 1.45, SE = .19, p < .001), while morphological complexity of the L2 interacts with age of arrival (B = .26, SE = .08, p = .001). The interaction of length of residence with morphological complexity of the L1 signifies, as has been visualized in Figure 1, 2 that the effect of length of residence can range from hampering to beneficial, depending on the morphological complexity of the L1. This interaction effect qualifies both the main effect of LoR and morphological complexity. For morphological complexity, Figure 1 makes clear that the order always goes from less to more complex. The character of LoR changes, because it turns out to be even negative for learners of less complex languages when they have a longer LoR. These learners didn’t succeed in using the Dutch context to improve their level of speaking proficiency. Fossilization effects may play an adverse role here (Higgs and Clifford, 1982; Lardiere, 1998a, 1998b; Sims, 1989). We return to this in the discussion.
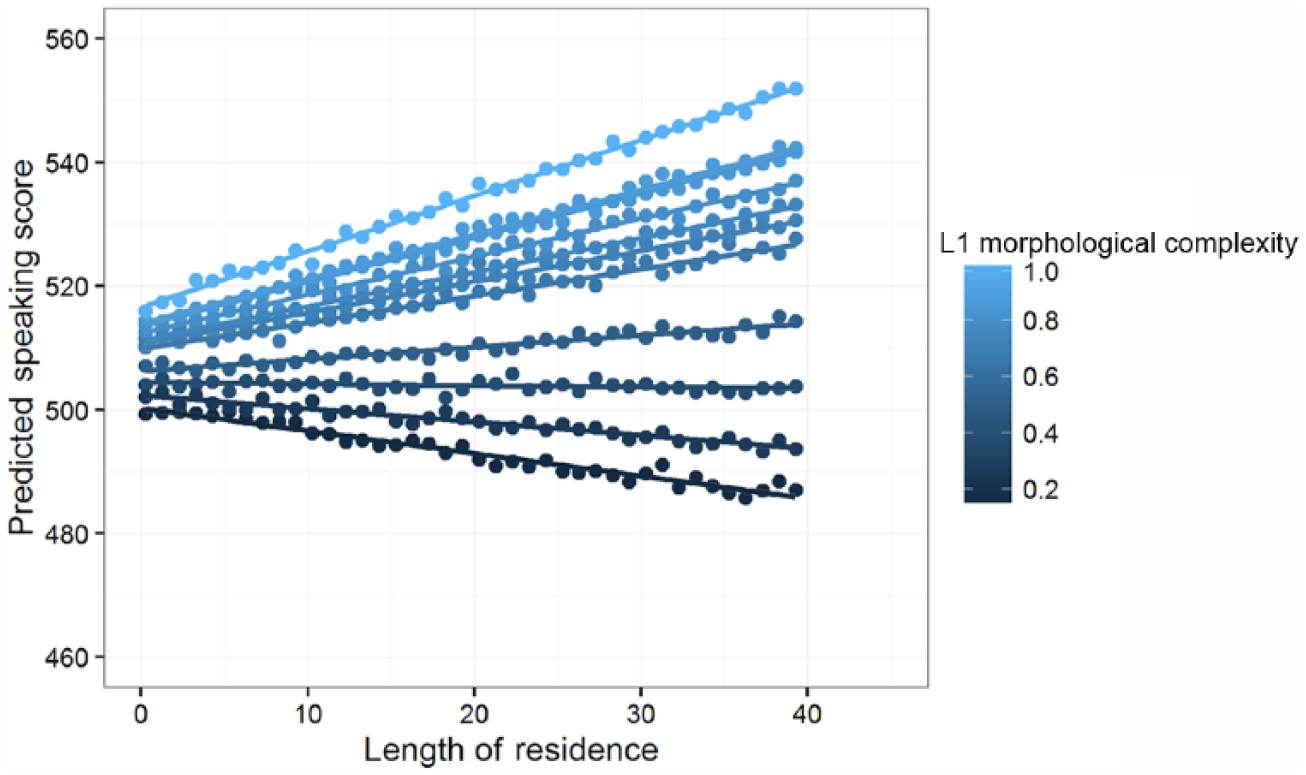
The interaction effect of length of residence and L1 morphological complexity in predicting La Dutch speaking proficiency.
Finally we found, somewhat surprisingly as no interaction was found for the L1, the morphological complexity of the L2 to interact with the age of arrival on speaking proficiency in Dutch, as is shown in Figure 2. It can be observed that the negative effect of age of arrival is mitigated when adult language learners have a command of an L2 with higher morphological complexity, although the impact of the L2 is less strong than the impact of the L1. The overall L2 effect seems to have a comparable decline as the L1 effect, but it is not outspoken enough to be significant as a main effect. In sum, morphological complexity of both the L1 and the L2 affect the learnability of Dutch as an additional language, although these effects are moderated by AoA and LoR.
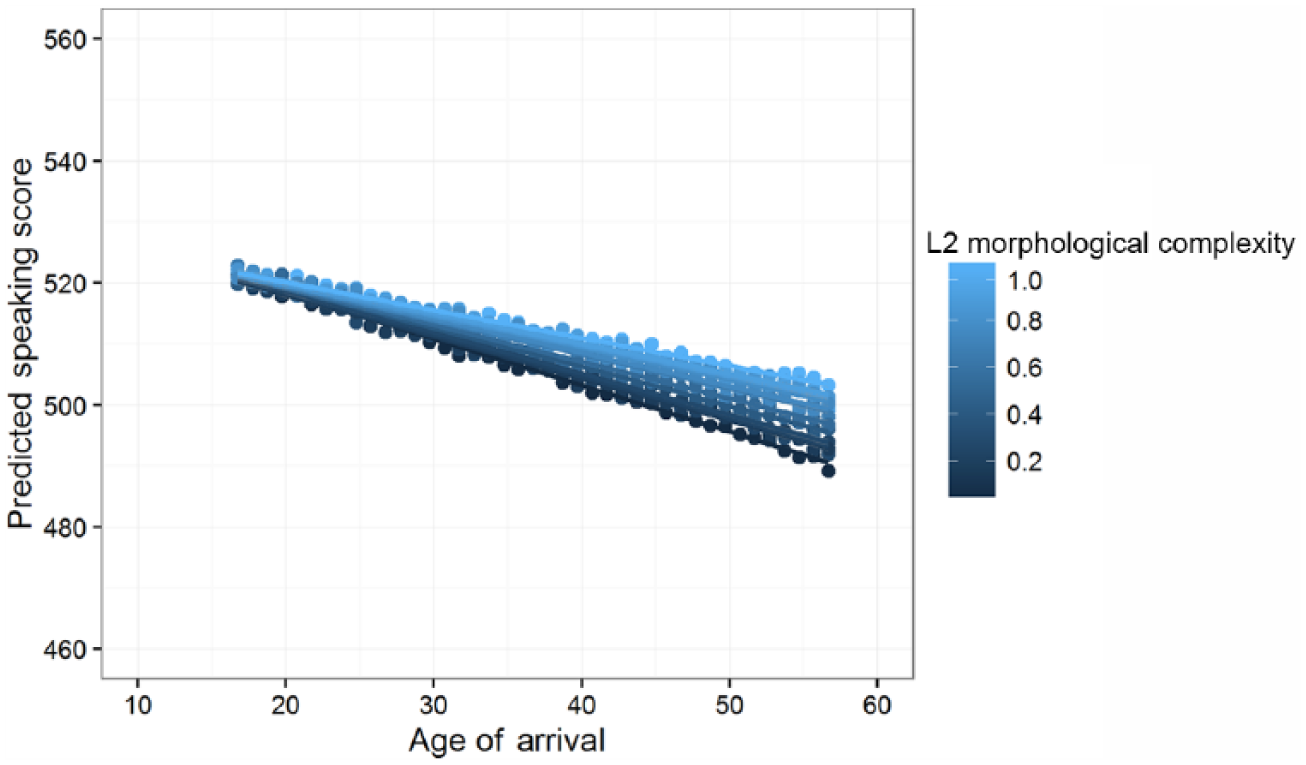
The interaction effect of age of arrival and L2 morphological complexity in predicting La Dutch speaking proficiency.
V Discussion and conclusions
Our first two research questions address the application of the morphological complexity measure we used earlier. First, we found that the WALS morphological features, studied in the Schepens et al. (2013a) study, showed similar correlations with Dutch speaking test scores, when using a new data base. Thus, adult language learners whose L1 has a less complex morphological feature configuration compared to Dutch have more learning difficulties in acquiring Dutch the less complex their L1 is. Second, we focused on a subset of eight morphological features to obtain a reduced morphological complexity measure and it turned out that this measure matches the performance of the measure that comprises and weights 16 WALS features. We did not lose predictive accuracy, as the correlation between the original measure and the reduced measure was .973 (N = 33).
We included in our study the additional group of L1 Afrikaans learners of Dutch that we could not include in our earlier study, by using newly obtained typological information (see Appendix 1); the L1 morphological complexity score of Afrikaans is .25 (only two out of the eight features are equal or more (1) complex than Dutch); German scores 1.00 in comparison to Dutch (eight out of eight are equal or more (1) complex than Dutch). Including the feature values of Afrikaans in our analyses, and correlating the feature values with the aggregated speaking scores for the 33 L1s (thus including Afrikaans) resulted in lower correlations. Additional analyses, not presented here, showed that Afrikaans is an outlier as it combines low morphological complexity scores with high speaking skill scores. This does not have to come as a surprise if one realizes that the lexical overlap between Afrikaans and Dutch is more than 90%. It also signifies that other, additional measures of linguistic distance need to be used, like, for example, lexical (van der Slik, 2010; Schepens et al., 2013b) or phonological ones (Schepens, 2015) in order to explain the variance in speaking proficiency in an additional language. The special position of Afrikaans as a daughter language in fact confirms the special role of morphology, as Afrikaans speakers score lower than German speakers, despite their lexical and phonological advantages. The remaining morphological features behaved similarly as in Schepens et al. (2013a), i.e. they had only weak correlations with Dutch speaking proficiency scores.
Apparently, the eight specific morphological features possess discriminative power, i.e. can be used to predict if adult language learners will acquire higher or lower speaking skills in Dutch as an additional language. Does this imply that the eight morphological features uncovered here for Dutch as an additional language, will also be found when the proficiency scores of adult language learners of another target language than Dutch will be studied? This is impossible to tell without further empirical research. Conceivably, other target morphological target features may be present, but it is conceivable as well that specific subsets of features appear to be quite robust. It might perhaps be assumed that for target languages with substantial lexical and morphological overlap the same morphological features will prevail. In Appendix 1, we provide information on the feature values of six potential target additional languages. When larger databases for other target languages were available, our approach might be replicated relatively easily.
In our third research question, we hypothesized a main effect of L2 morphological complexity. We found a non-significant main effect of L2 morphological complexity on La Dutch learnability (in contrast to our previous study, Schepens et al., 2016), in the same direction as the L1 morphological complexity. We return to the L2 morphology effect in discussing the age-bound factors.
In our fourth research question, we hypothesized moderating effects of age of arrival (AoA) on the way L1 and L2 morphological complexity influence La learnability. We found a significant interaction effect of age of arrival with L2 morphological complexity on La Dutch learnability, but no interaction for L1 morphological complexity. The L2 by AoA interaction effects gives a stronger linear decrease (a steeper negative slope) the less complex the L2 is. A higher L2 complexity mitigates the AoA effect. It means that cognitive aging plays a role in second language acquisition bringing about a gradual declining process. The interaction effect found supports the validity of our morphological complexity measure, although we can only speculate why there was no interaction effect of L1 complexity and AoA. The most plausible explanation might be that the L1 complexity effect remains constant because the L1 is cognitively entrenched so early in life that no additional interaction effects show up.
We took LoR into account, to have the complete set of age-bound effects (LoR + AoA = the age of the participant). Length of residence (LoR) showed an outspoken interaction effect with morphological complexity of the L1. Generally, adult language learners’ speaking skills in Dutch improve when they reside longer in the host country (there is a positive main effect for LoR). However, this conclusion is only warranted in case their L1’s morphological complexity is high in comparison to Dutch. In case their L1’s morphological complexity is low, the effect of length of residence even reverses and a higher LoR returns a negative impact on speaking skills in Dutch. We explained this by referring to fossilization effects. The weight of larger morphological differences increments when the time span between time of arrival and the actual taking of the speaking exam (defined as LoR) increases. 3 It might mean that during that period, immigrants with morphologically less complex L1s are more at risk of acquiring their own grammatically simplified or pidginized (Trudgill, 2008) version of Dutch than immigrants with morphologically more complex L1s. Although we do not have information on their target language learning experiences from the date of their arrival onwards, it seems plausible to assume that when immigrants have decided to actually take the exam, the duration of having developed their own pidginized version Dutch will function as a threshold in acquiring Dutch morphosyntactic rules (Higgs and Clifford, 1982; Sims, 1989), and that threshold is thus assumed to become stronger the longer language learners have used their own grammatically simplified version. It is important to note that this interaction effect, independent from its explanation, corroborates the validity of our morphological complexity measure as it fits a theoretical framework in which the impact of morphological complexity unfolds over age. This process of a vigorous reduction of the (morphological) complexity of the language system also matches the Basic Variety as described by Klein and Perdue (1997). Crucially, they observe the emergence of this variety, simplified along a large number of linguistic parameters, in spontaneous adult language acquisition (outside of the classroom).
Nevertheless, we want to add another scenario that might explain the observed variation in the effect of length of residence in relation to the L1 morphological effect Immigrants, once arrived, do not settle completely randomly across the host country. They typically concentrate where family and friends have migrated to earlier or near locations where migrant jobs are available (as already observed by Bartel, 1989). As a consequence, these close-knit groups of migrants perhaps feel less need to learn the language of their receiving country since they are able to continue their communication in their first language within their group to a large extent. The immigrants studied in the present study were not forced however to take the Dutch state exam; they took it voluntarily so it may safely be assumed they were well motivated to learn La Dutch. Despite their potentially strong motivation, we have detected that the effect of length of residence is moderated by the degree of morphological complexity of their L1.
The present study also contributes to what has been designated as the complexity, accuracy, fluency (CAF) literature (Housen and Kuiken, 2009). There is plethora of measures to operationalize these important concepts, but many of them are not successful (yet) (Housen et al., 2019). We prudently conclude that the way we handled the many morphological properties available through WALS gave us a concrete, restricted set of morphological features, relevant in adult learning of Dutch. We need to study in further detail how these features function in language learning, whether they signal deeper processing and performance problems or whether they fairly directly disclose direct difficulties. We have to add that we need comparative analyses on other language combinations as well. We sincerely hope that our approach is seen as promising enough to apply it to L2 English.
We conclude that our outcomes on adult La acquisition in relation to morphological complexity match the findings in the domains of Creole languages and language simplification processes through the influx of adult learners of a language. Our morphological complexity measure seems to be a tool worthwhile to be applied and tested in large-scale studies on other Las. The effects we found are too complex to be observed in small samples of learners, but narrowing down the morphological complexity of Dutch to eight features may obviously give direction to the type of morphological structures to be investigated in smaller studies on La Dutch. Our reduction of the morphological complexity measure in fact needs confirmation in fine-grained studies of actual acquisition processes. This might produce a thrilling exchange between acquisition studies based on big data and fine-grained acquisition studies on particular morphological properties. For Dutch, most of the eight morphological features were verb related, a domain with an interesting package of inflectional (contextual) and derivational (inherent) morphological devices. The other three empirical studies in Second Language Research (De Clercq and Housen, 2019; Ehret and Szmrecsanyi, 2019; Palotti and Brezina, 2019) all produce evidence for the pivotal role of the verb in studying morphological complexity.
Footnotes
Appendix 1
Appendix 2
Acknowledgements
We thank the two anonymous reviewers for their constructive comments and Theo Bongaerts for his editorial improvements of the text.
Declaration of Conflicting Interest
The author(s) declared no potential conflicts of interest with respect to the research, authorship, and/or publication of this article.
Funding
The author(s) received no financial support for the research, authorship, and/or publication of this article.