
Abstract
To research the impact of various Er2(SO4)3 additions on the TC11 alloy's micro-arc oxidation (MAO) coating, the MAO coating was tested and examined using scanning electron microscopes (SEM), X-ray diffractometers (XRD), X-ray photoelectron spectroscopy (XPS), and electrochemical workstations. The findings demonstrate that the addition of Er2(SO4)3 raises the oxidation voltage, improves the uniformity of the discharge, reduces the dimension of the discharge micropores on the surface, and increases the density and thickness of the coating. The coatings contain the Er element, which appears as Er2O3, and it helps to refine the grain size, which encourages the formation of hard phases like anatase TiO2 and rutile TiO2 and enhances the coatings’ hardness, wear resistance, and corrosion resistance. At an amount of 1.5 g L−1, the Er2(SO4)3 enhanced the overall performance of the coating.
Introduction
Titanium alloys have gradually gained popularity and applications in the sector of oil and gas development for their superior comprehensive performance.1,2 However, due to the titanium alloy's poor wear resistance, the surface oxide film is easy to break under the action of sand and gravel scouring and lose the ability to protect, so it is prone to corrosion failure in high temperature, high pressure and oil and gas wells enriched with corrosive media, such as Cl−, CO2, and H2S. Therefore, to increase the titanium alloy's ability to resist corrosion and surface wear is crucial for expanding its use in oil and gas well environment.3,4 There are methods of treatment that can increase the wear and corrosion resistance of titanium surfaces, involving plasma spraying, 5 vapor deposition, 6 and micro-arc oxidation 7 techniques. Comparing with plasma spraying, and vapor deposition, micro-arc oxidation has received many attentions due to its low cost, straightforward procedure, and advantageous film-forming features.
Micro-arc oxidation is a surface modification process that electrochemically creates a ceramic coating of lightweight or valve metal alloys (including titanium, magnesium, aluminum, etc.) to increase their corrosion and wear resistance.8–10 Electrical parameters, oxidation period, electrolyte, and additives all have an impact on the coating performance.11,12 Related research had demonstrated that adding the rare earth element Er to titanium alloys can enhance the alloy's overall performance. Y.K. Wu prepared Ti6Al4V-
However, compared to the above processes, the method of adding rare earth elements to the electrolyte before performing MAO on the alloy is more convenient and cost-effective. The effect of Er2(SO4)3 addition on the characteristics of the MAO coating of TC11 alloy has not been studied yet. Therefore, in this study, we added the Er2(SO4)3 to phosphate-silicate composite electrolyte to investigate its effects on voltage change, morphology, phase composition, thickness, and hardness of the MAO coating of the TC11 alloy, as well as to test the coating's wear resistance and corrosion resistance in 3.5% NaCl solution. The effect of Er2(SO4)3 addition on TC11 MAO coating was analyzed.
Materials and methods
The test material for MAO treatment was TC11 alloy with dimensions of 15 mm × 15 mm × 5 mm, and the mass fraction of the chemical composition is (5.8–7.0) % Al, (2.8–3.8) % Mo, (0.8–2.0) % Zr, (0.2–0.35) % Si, (≤ 0.25) % Fe, (≤ 0.1) % C, (≤ 0.05) % N, (≤ 0.012) % H, (≤ 0.15) % O, and the rest is Ti. The samples were polished by using 400 #, 800 #, 1200 # SiC sandpaper, then the samples were placed in anhydrous ethanol with ultrasonic cleaning for 10 min. The samples were eventually dried with a hairdryer after being cleaned with deionized water.
During the experiment, the oxidation process occurred with the positive and negative phase current densities of 7 A dm−2 and 2 A dm−2, the negative-phase duty cycle of 30%, the positive-phase duty cycle of 10%, and a frequency of 500 Hz. The base electrolyte composition was Na2SiO3-9H2O 7 g L−1, Na3PO4 8 g L−1, NaOH 1.5 g L−1, NaF 1 g L−1, EDTA 1.5 g L−1, and C3H8O3 2 ml L−1. The amounts of Er2(SO4)3 added were 0, 0.05, 0.1, 0.15 and 0.2 g L−1, respectively, and were stirred and dispersed by an electromagnetic stirrer and left to stand for 24 h. The oxidation time was 50 min, and the temperature was 25 ± 5°C. Meanwhile, to ensure the uniformity of the electrolyte, the electrolyte was continually and physically stirred during the micro-arc oxidation treatment.
Scanning electron microscope (SEM, ZEISS EVO MA15, Germany) was used to observe the surface and cross-section morphology of the coatings. Energy spectrometer (EDS, OXFOR20, Germany) was used to identify and analyze the sample surfaces in various groupings for the distribution of elements. The coating's phase composition was examined using an X-ray diffractometer (XRD, DX-2700B, China), in which the parameters were set as follows: scanning progression angle of 0.05°, scanning step time of 0.2 s, scanning angle 2θ of 10°∼80°, voltage of 40 kV, and current of 30 mA and a Cu-targeted Kα radiation source was used. X-ray photoelectron spectroscopy (XPS, XSAM-800, China) was used for identifying the elemental composition. The digital Vickers hardness tester (HVS-1000, China) was used to detect the hardness of the coatings: a pressure of 100 gf was used to continuously load the coatings for 15 s, and seven points were sequentially selected for testing, and the final average of the seven points was taken as the test result. An eddy current thickness gauge (TT-230, China) was used to test the coatings thickness. The coating's wear resistance was examined by using a multifunctional material surface property tester (Bruker UMT-Tribe Lab, Germany). The friction method was dry friction, the friction partner was a GCr15 ball, the loading force was 3 N, the friction length was 5 mm, and the friction time was 30 min. The average friction coefficient change curves of the samples can be produced from the friction experiment results. The morphology of the wear marks was studied with SEM.
The electrochemical workstation (Gamry Reference 3000, USA) was used to determine the coating's corrosion resistance, with a calomel electrode as the reference electrode, the platinum electrode as the auxiliary electrode, and the samples as the working electrode. To simulate the marine environment, 3.5% NaCl solution was chosen for the corrosion solution. The samples were treated with epoxy resin and exposed to a test area of 1 cm2. The electrochemical impedance profile was measured in the frequency range of 105–10−1 HZ with an open-circuit potential of ± 0.25, and the experimental results were fitted by ZSimpWin software. The potential polarization curves were measured at a scanning rate of 0.1 mV s−1, which were used for the analysis of the corrosion resistance.
Results and discussion
The voltage-time curves for various Er2(SO4)3 additions made to TC11 throughout the micro-arc oxidation are revealed in Figure 1. There are three stages of the MAO reaction including normal anodic oxidation, spark oxidation, and micro-arc oxidation. The voltage raised quickly and linearly to around 250 V during the usual anodic oxidation stage (0–50 s), causing the breakdown of the Ti substrate and the development of the TiO2 barrier layer. The spark discharge stage (50–360 s) began when the voltage exceeded 250 V and the weak TiO2 barrier layer was penetrated by the force of a strong electric field. At this point, tiny spark discharges can be seen on the samples’ surface, and the voltage increased roughly linearly before gradually slowing down. The oxidation reaction entered the MAO stage after 360 s, at which point the rate of oxidation voltage growth rapidly declined and grew linearly and slowly. The MAO voltage of the samples with addition of Er2(SO4)3 was significantly higher than the unadded, which was caused by the Er3+ with great polarization ability increased the conductivity of the solution, accelerated the rate of ionization and oxidation of the metal surface plasma, increasing the rate of ions deposition. With the coating's thickness increasing (Fig. 2), the coating's resistance raised, causing the voltage to climb.12,18 Meanwhile under the influence of the electric field, negatively charged Er2O3 formed from Er3+ was easily adsorbed on the surface of the coating and increasing resistance, causing the increase in voltage.19,20 However the voltage dropped from 492 V to 465 V at the Er2(SO4)3 of 0.20 g L−1. This was because excessive Er2(SO4)3 caused hydrolyzed Er (OH)3 to be adsorbed as agglomerations on the surface, which prevented the matrix Ti4+ and OH− from reacting and decreased the rate of coating formation, decreasing the thickness of coating and the voltage.
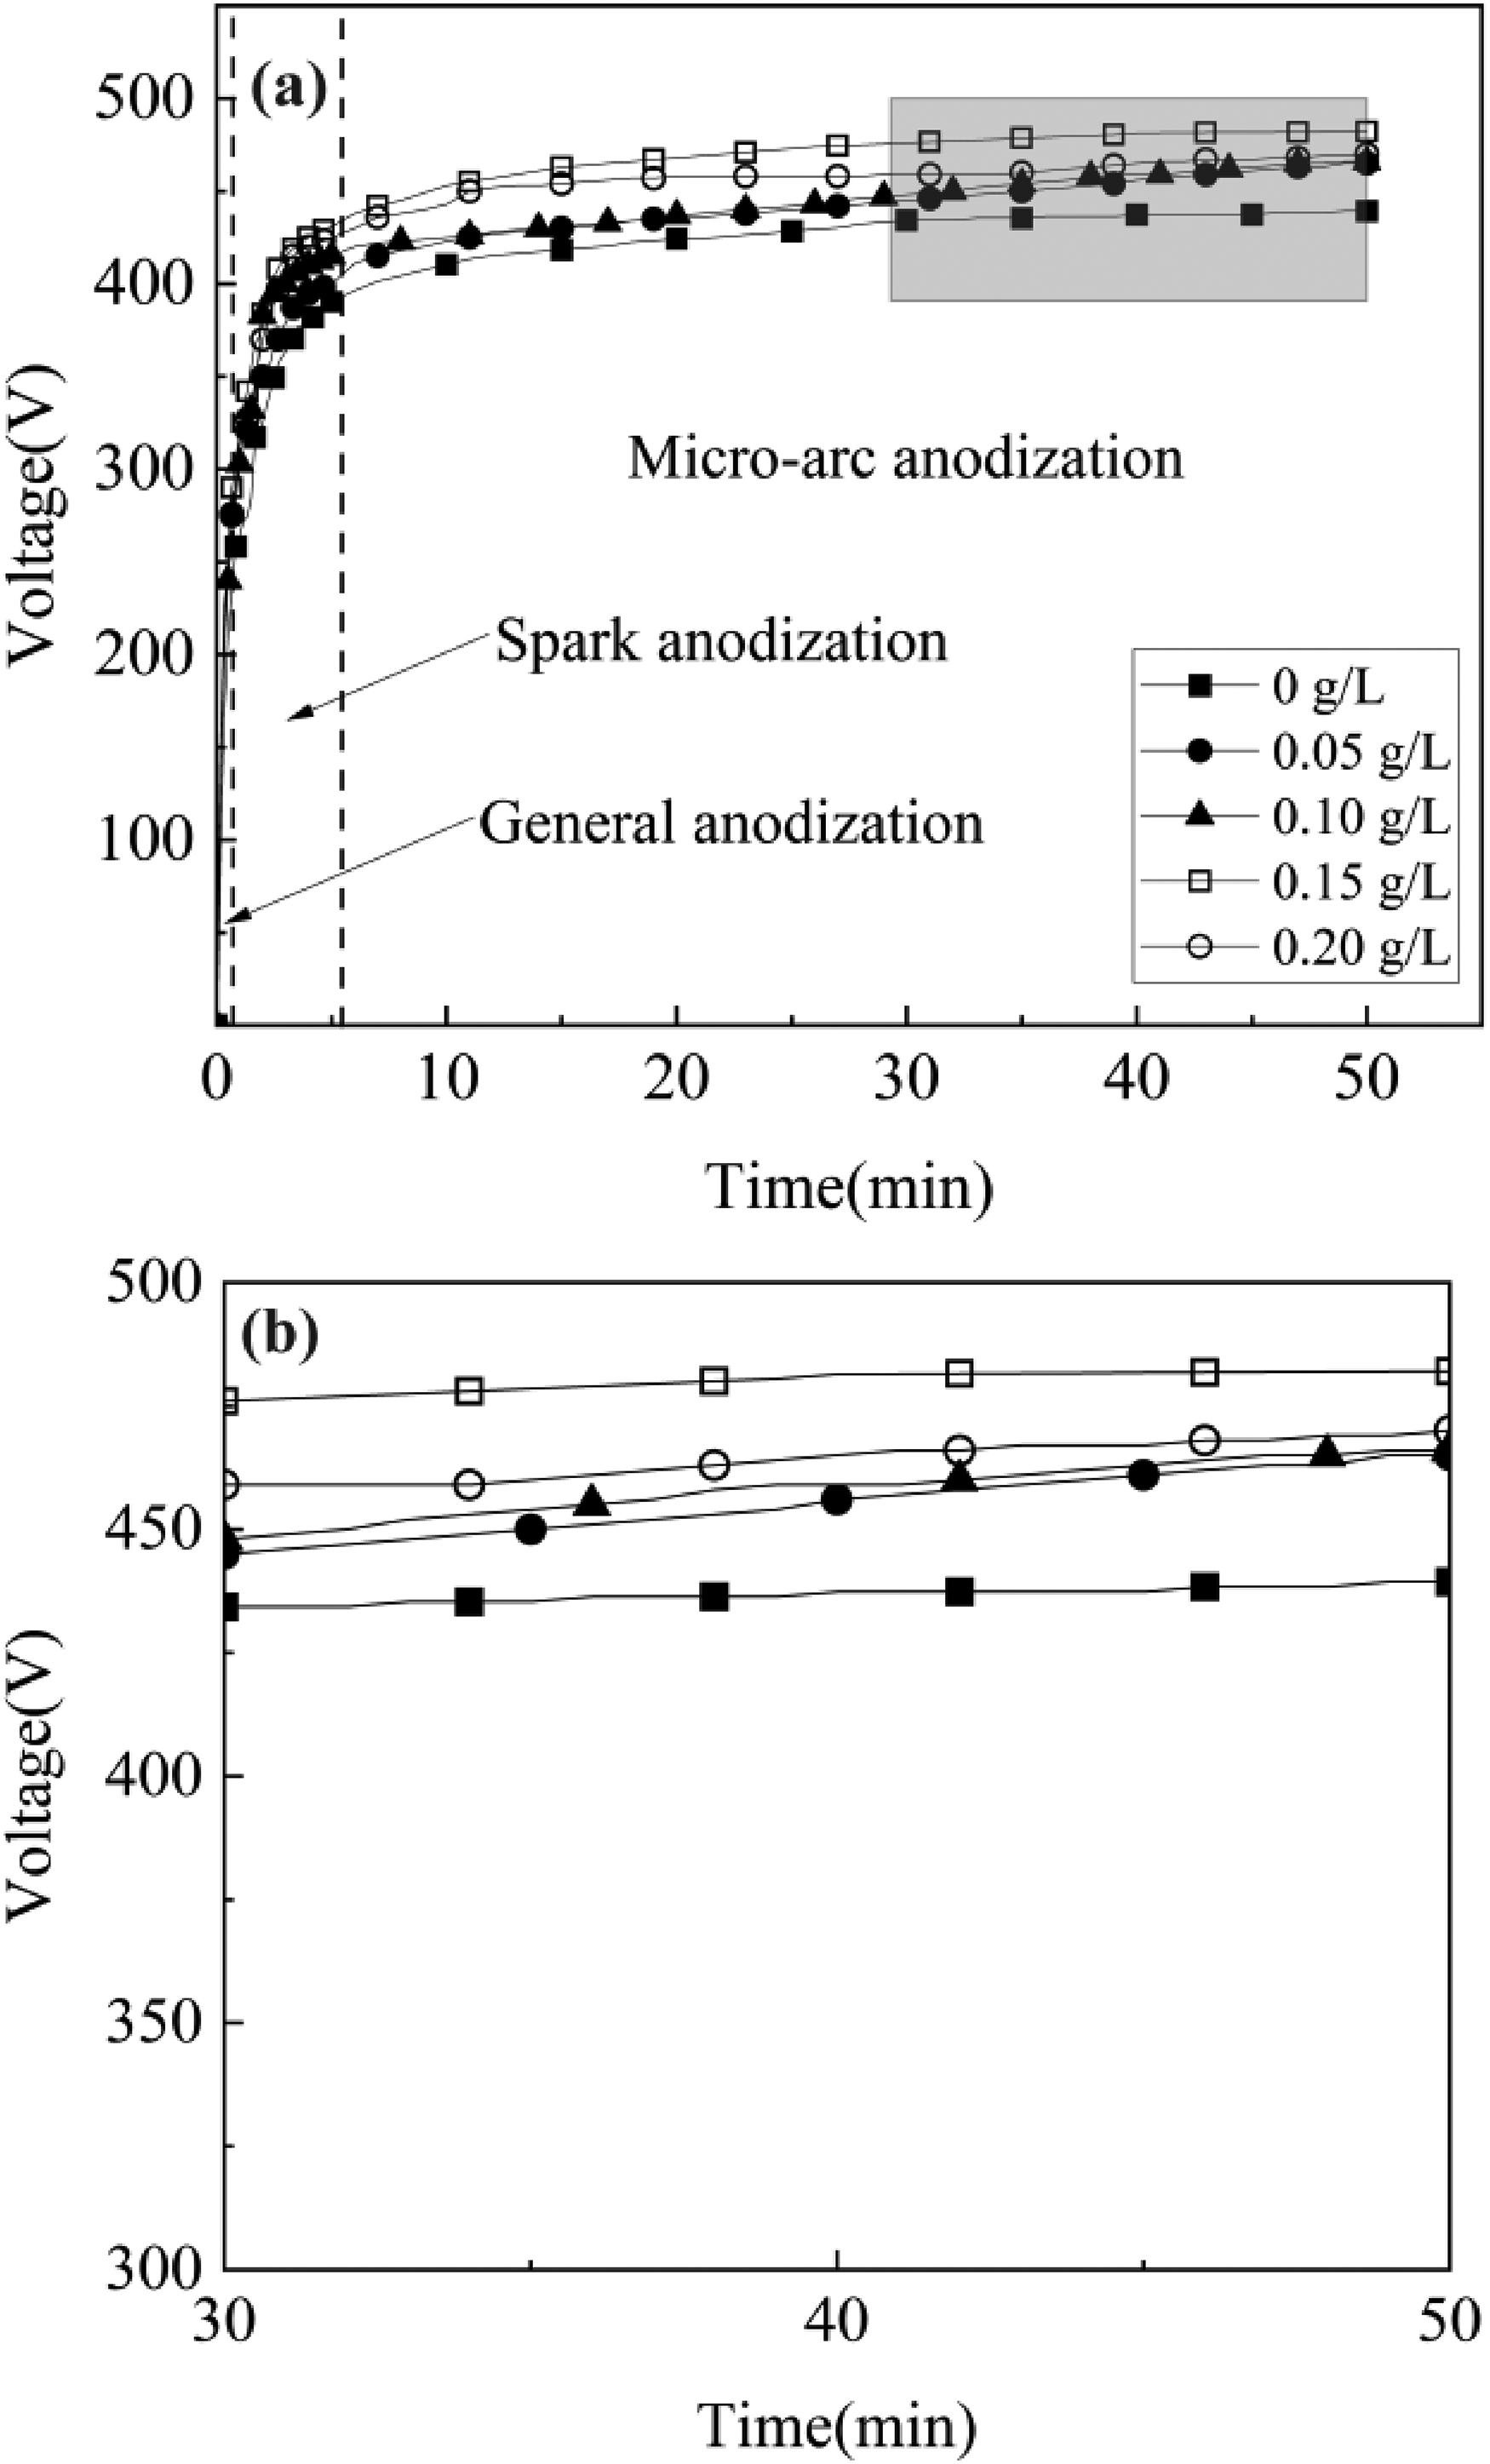
(a) Voltage variation curve of MAO process and (b) Enlarged view of the third stage.
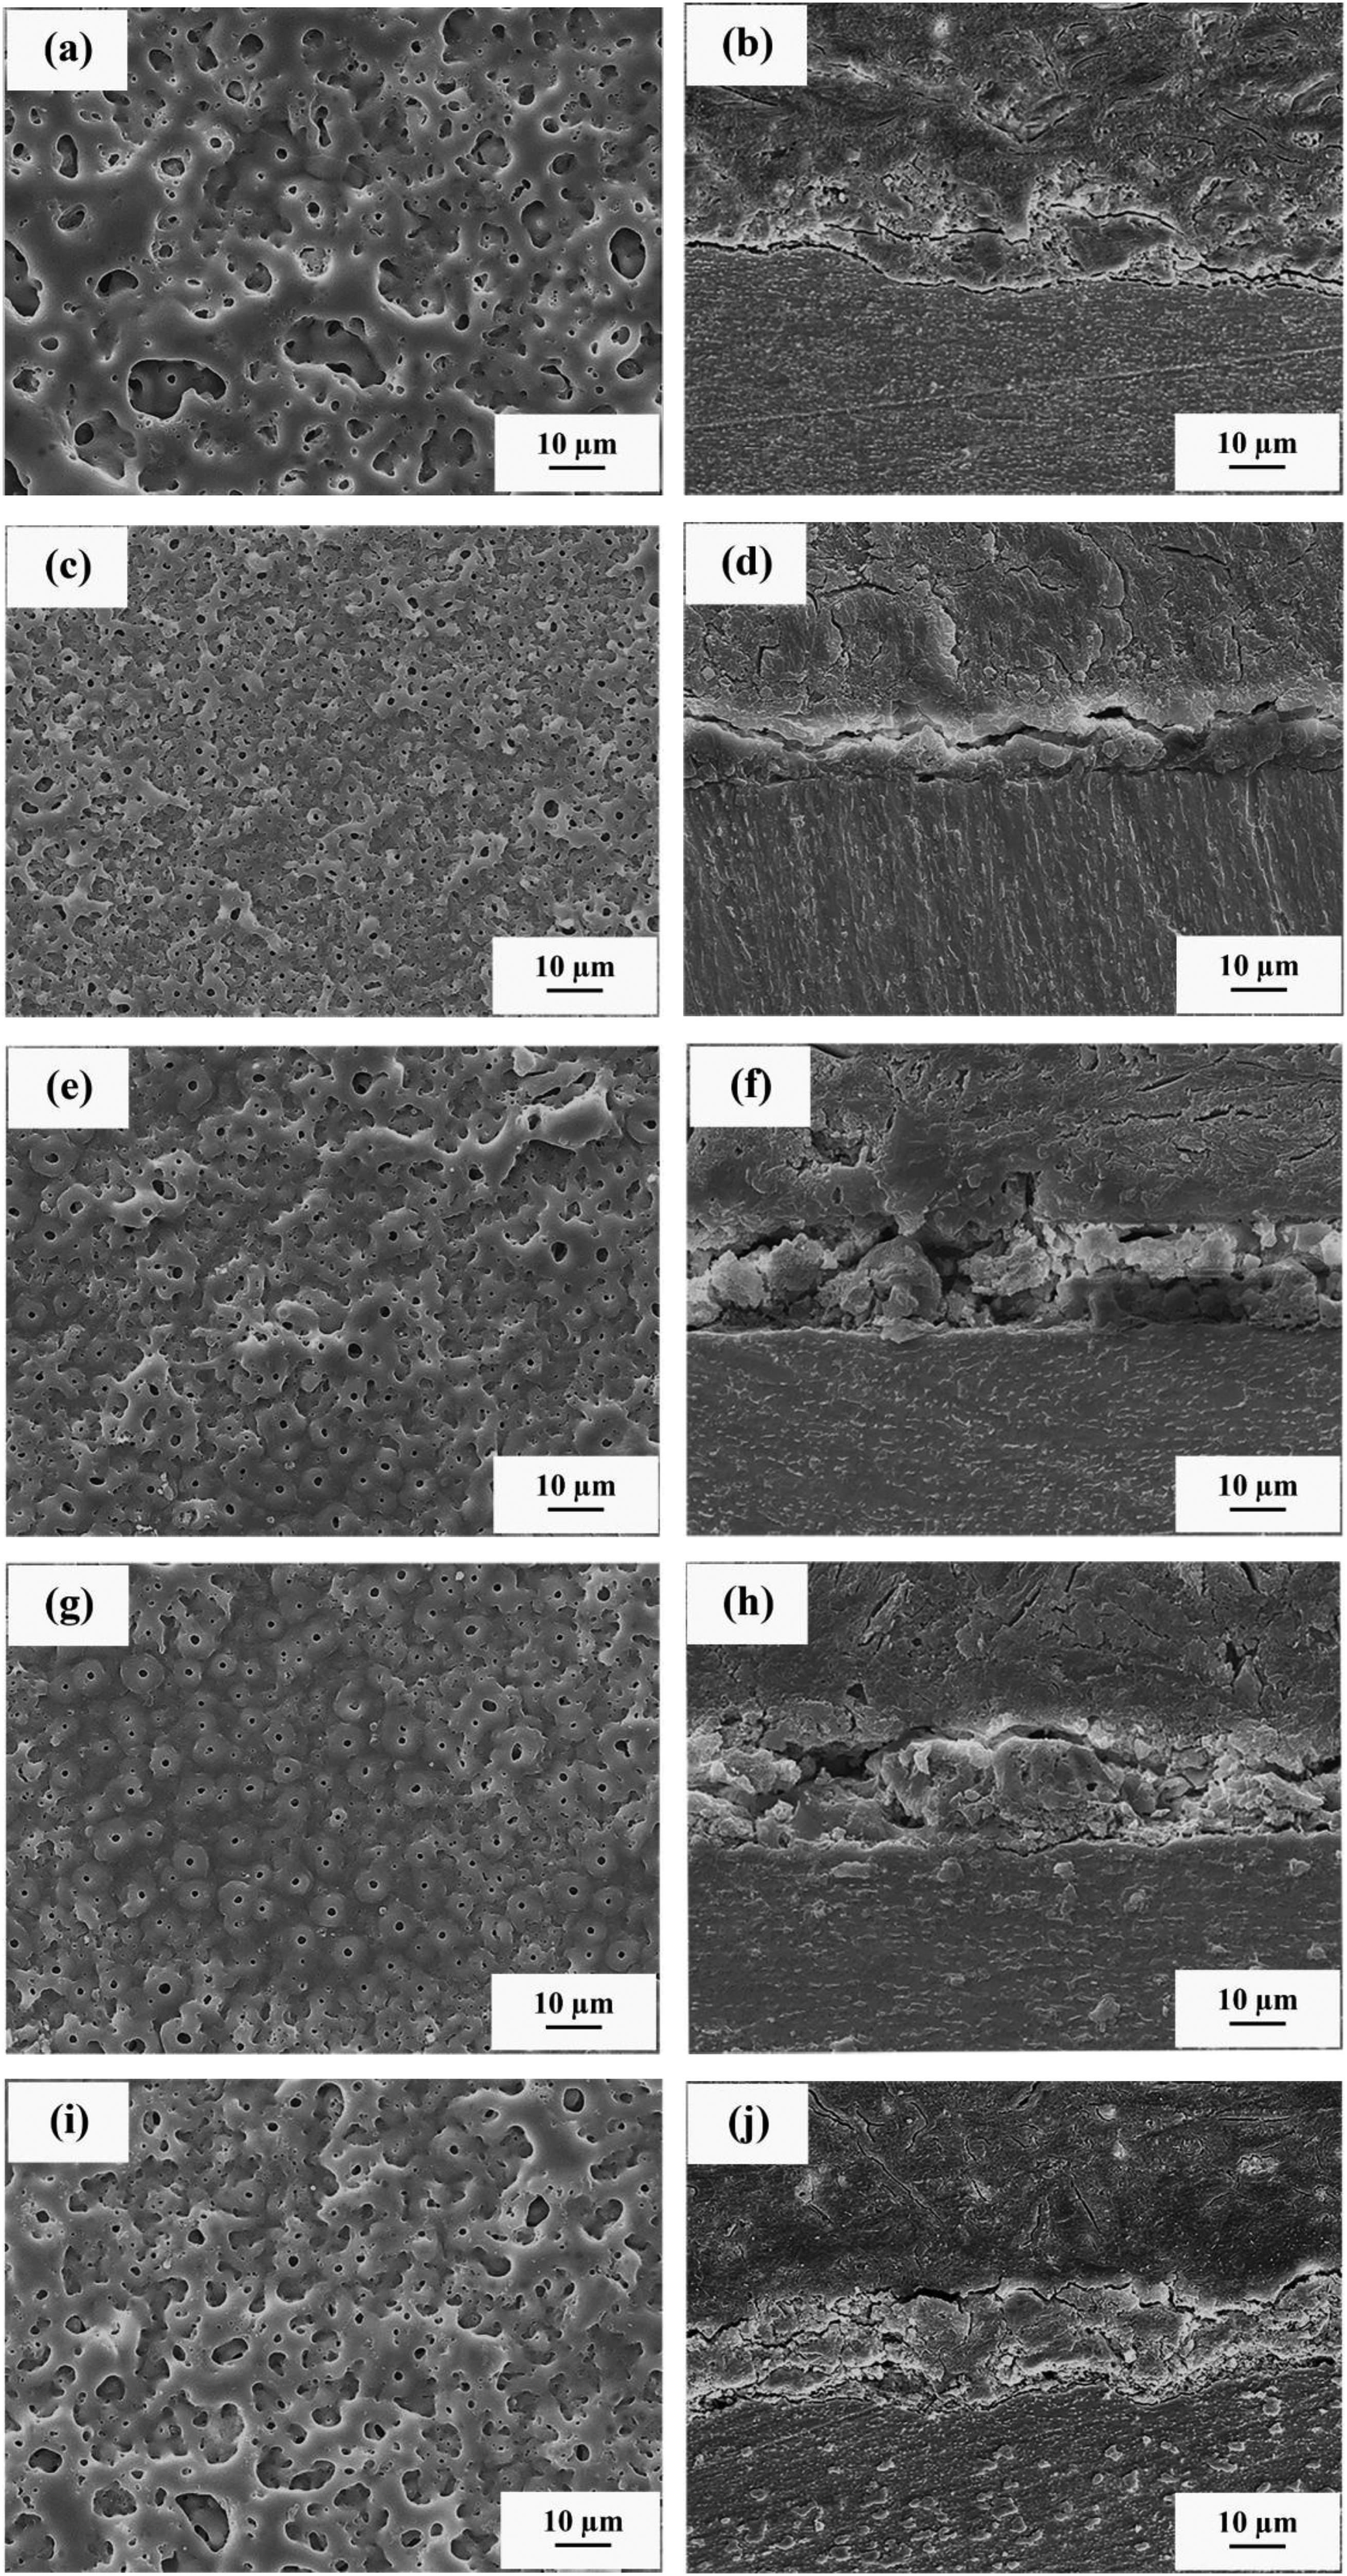
Surface morphology of the coating: (a) no addition, (c) 0.05 g L−1, (e) 0.10 g L−1, (g) 0.15 g L−1, (i) 0.20 g L−1 and cross-sectional morphology: (b) not added, (d) 0.05 g L−1, (f) 0.10 g L−1, (h) 0.15 g L−1, (j) 0.20 g L−1.
According to Figure 2(a), numerous shaped sinter disks were dispersed on the surface, meanwhile, the centers of the sinter disks included discharge micropores of various sizes and shapes, some of which were worm-like. This morphological feature resulted from the micro-arc discharge caused the TiO2 coating's weak spots to be broken, causing the molten material to pass through the discharge channel and jet outward. The resulting molten material then repeatedly condensed and accumulated in the discharge holes, eventually forming ‘crater-shaped’ sinter disks.8,21,22
Based on Figure 2(c, e, g, i), the dimension of the discharge micropores and sintered disks on the surface gradually shrank and the quantity of micropores dramatically increased with the addition of Er2(SO4)3. This was due to the increasing voltage caused by the addition of Er2(SO4)3 provided energy for MAO process. Meanwhile, the generated Er(OH)3 was adsorbed on the surface and reduced the energy required to break down the microregions of the coating, which lead to a more uniform discharge on the surface, forming lots of evenly distributed micropores to improve the ions transport efficiency and increased the thickness and densification of the coating.17,23 However, with Er2(SO4)3 at 0.20 g L−1 the coating showed slightly decrease in thickness and densification (Figure 2(i, j)). This was caused by the excessive Er(OH)3 being absorbed, which locally blocked the discharge micropores and slowed the rate of coating formation. Concurrently, the decline in voltage caused the arc mobility to worsen, and the uneven discharge caused the densification of the coating to decline.
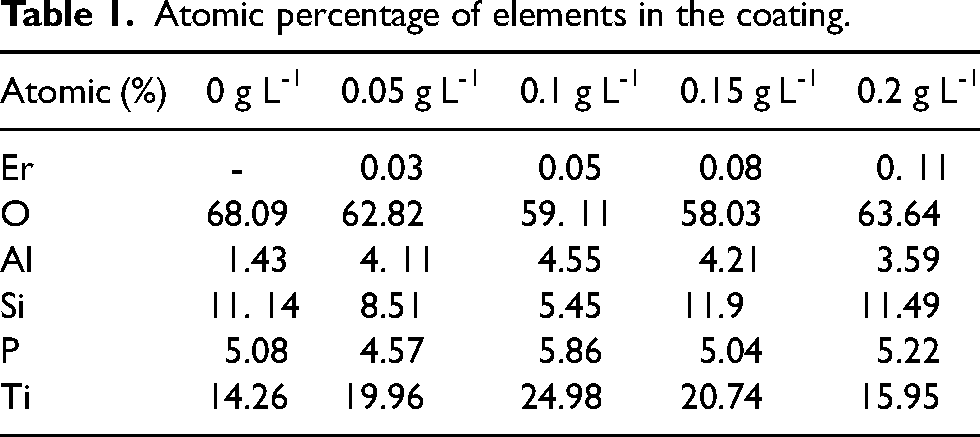
From the EDS data (Figure 3 and Table 1), the Er element was successfully incorporated into the coating, and uniformly distributed over the coating with the Er2(SO4)3 increasing. In contrast to the change in Ti element content, the O element fell and then increased with the addition of Er2(SO4)3, which effectively modified the ratio of O and Ti elements in the coating and was advantageous for the coating's performance.
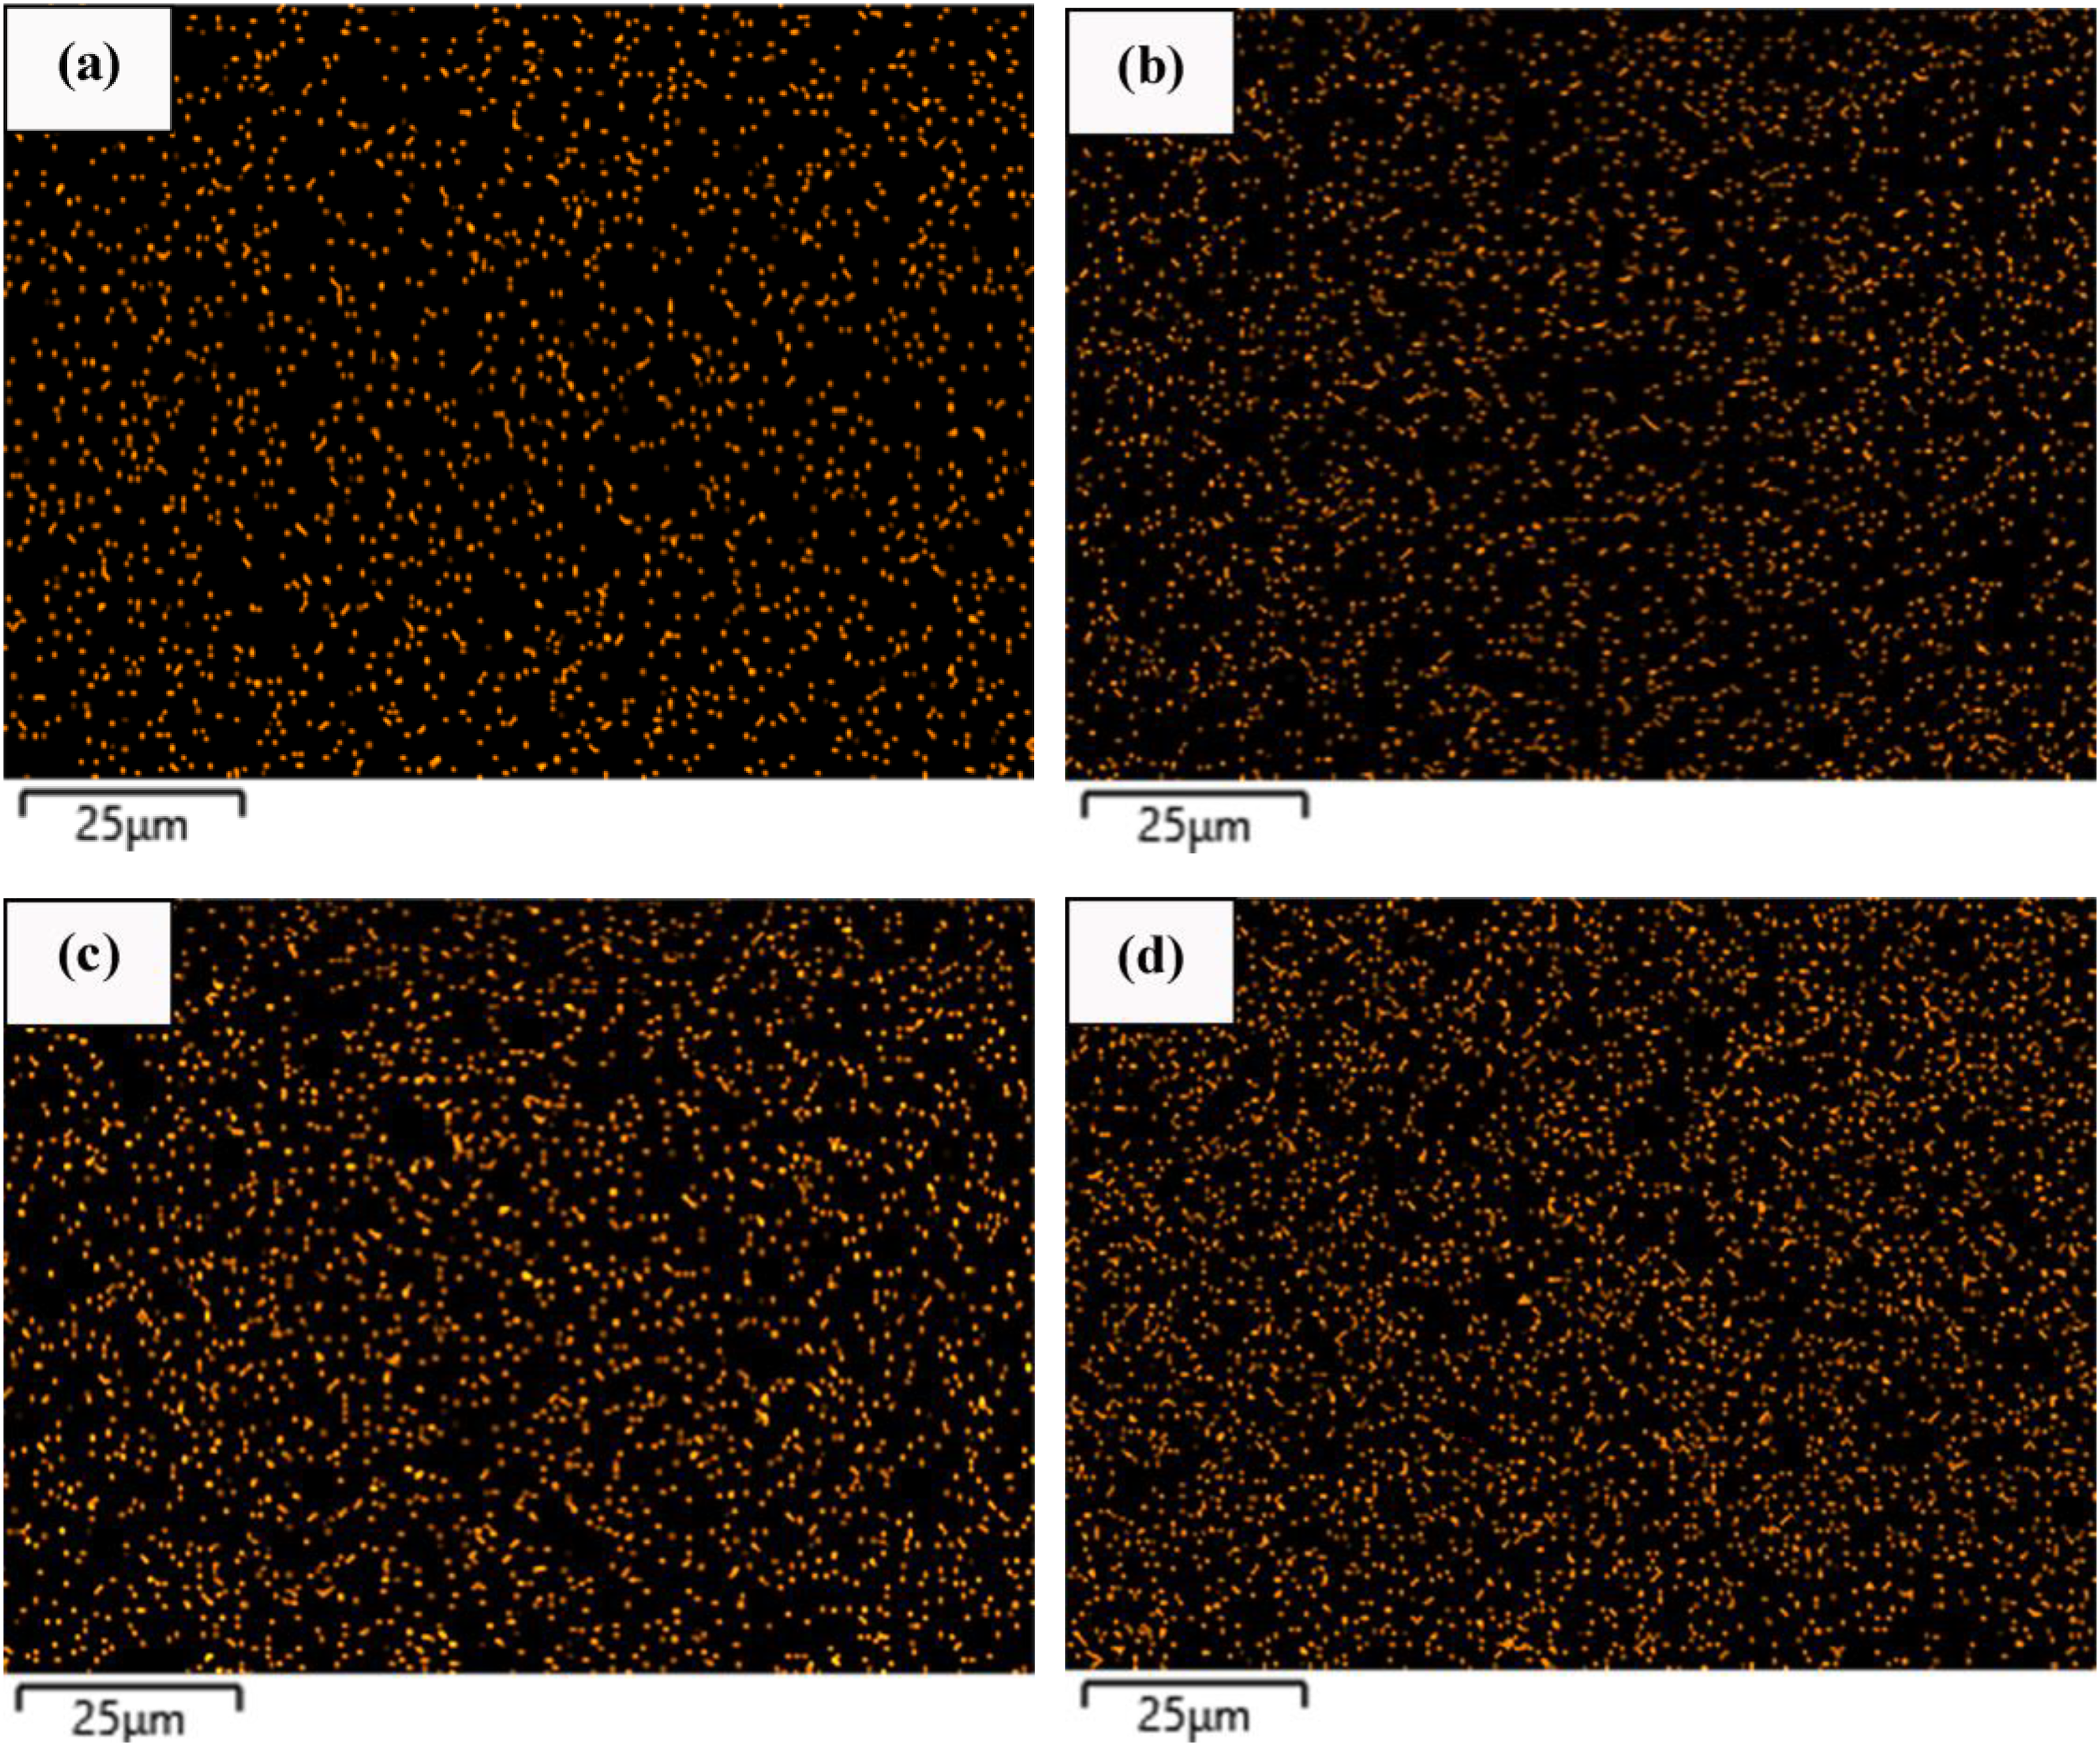
Distribution of Er element with different concentrations of Er2(SO4)3. (a) XRD results of the coating and (b) XPS results of Er.
Atomic percentage of elements in the coating.
According to Figure 4(a), which depicts XRD picture of the micro-arc oxidized coating with various Er2(SO4)3 additions, the coating was primarily composed of anatase TiO2, rutile TiO2, γ-Al2O3, and Al2TiO5. The prominent peaks of elemental Ti in the picture were the result of X-rays used for the XRD inspection detecting substrate Ti elements after they had passed through the coating's micropores. As the micro-arc oxidation reaction progressed, the coating's thickness increased gradually, making it difficult to cool the high-temperature molten oxides inside in time, when some of the anatase TiO2 was transformed into stable rutile TiO2.24,25 Ti4+ produced from the matrix reacted with OH− to generate anatase TiO2. Meanwhile, a tiny amount of Al element formed γ-Al2O3 by oxidation and then interacted with TiO2 to produce Al2TiO5 26 under the influence of an alkaline electrolyte. The absence of Er2(SO4)3 in the XRD picture was caused by the coating's low Er content, which did not reach the minimum content that can be detected by XRD.
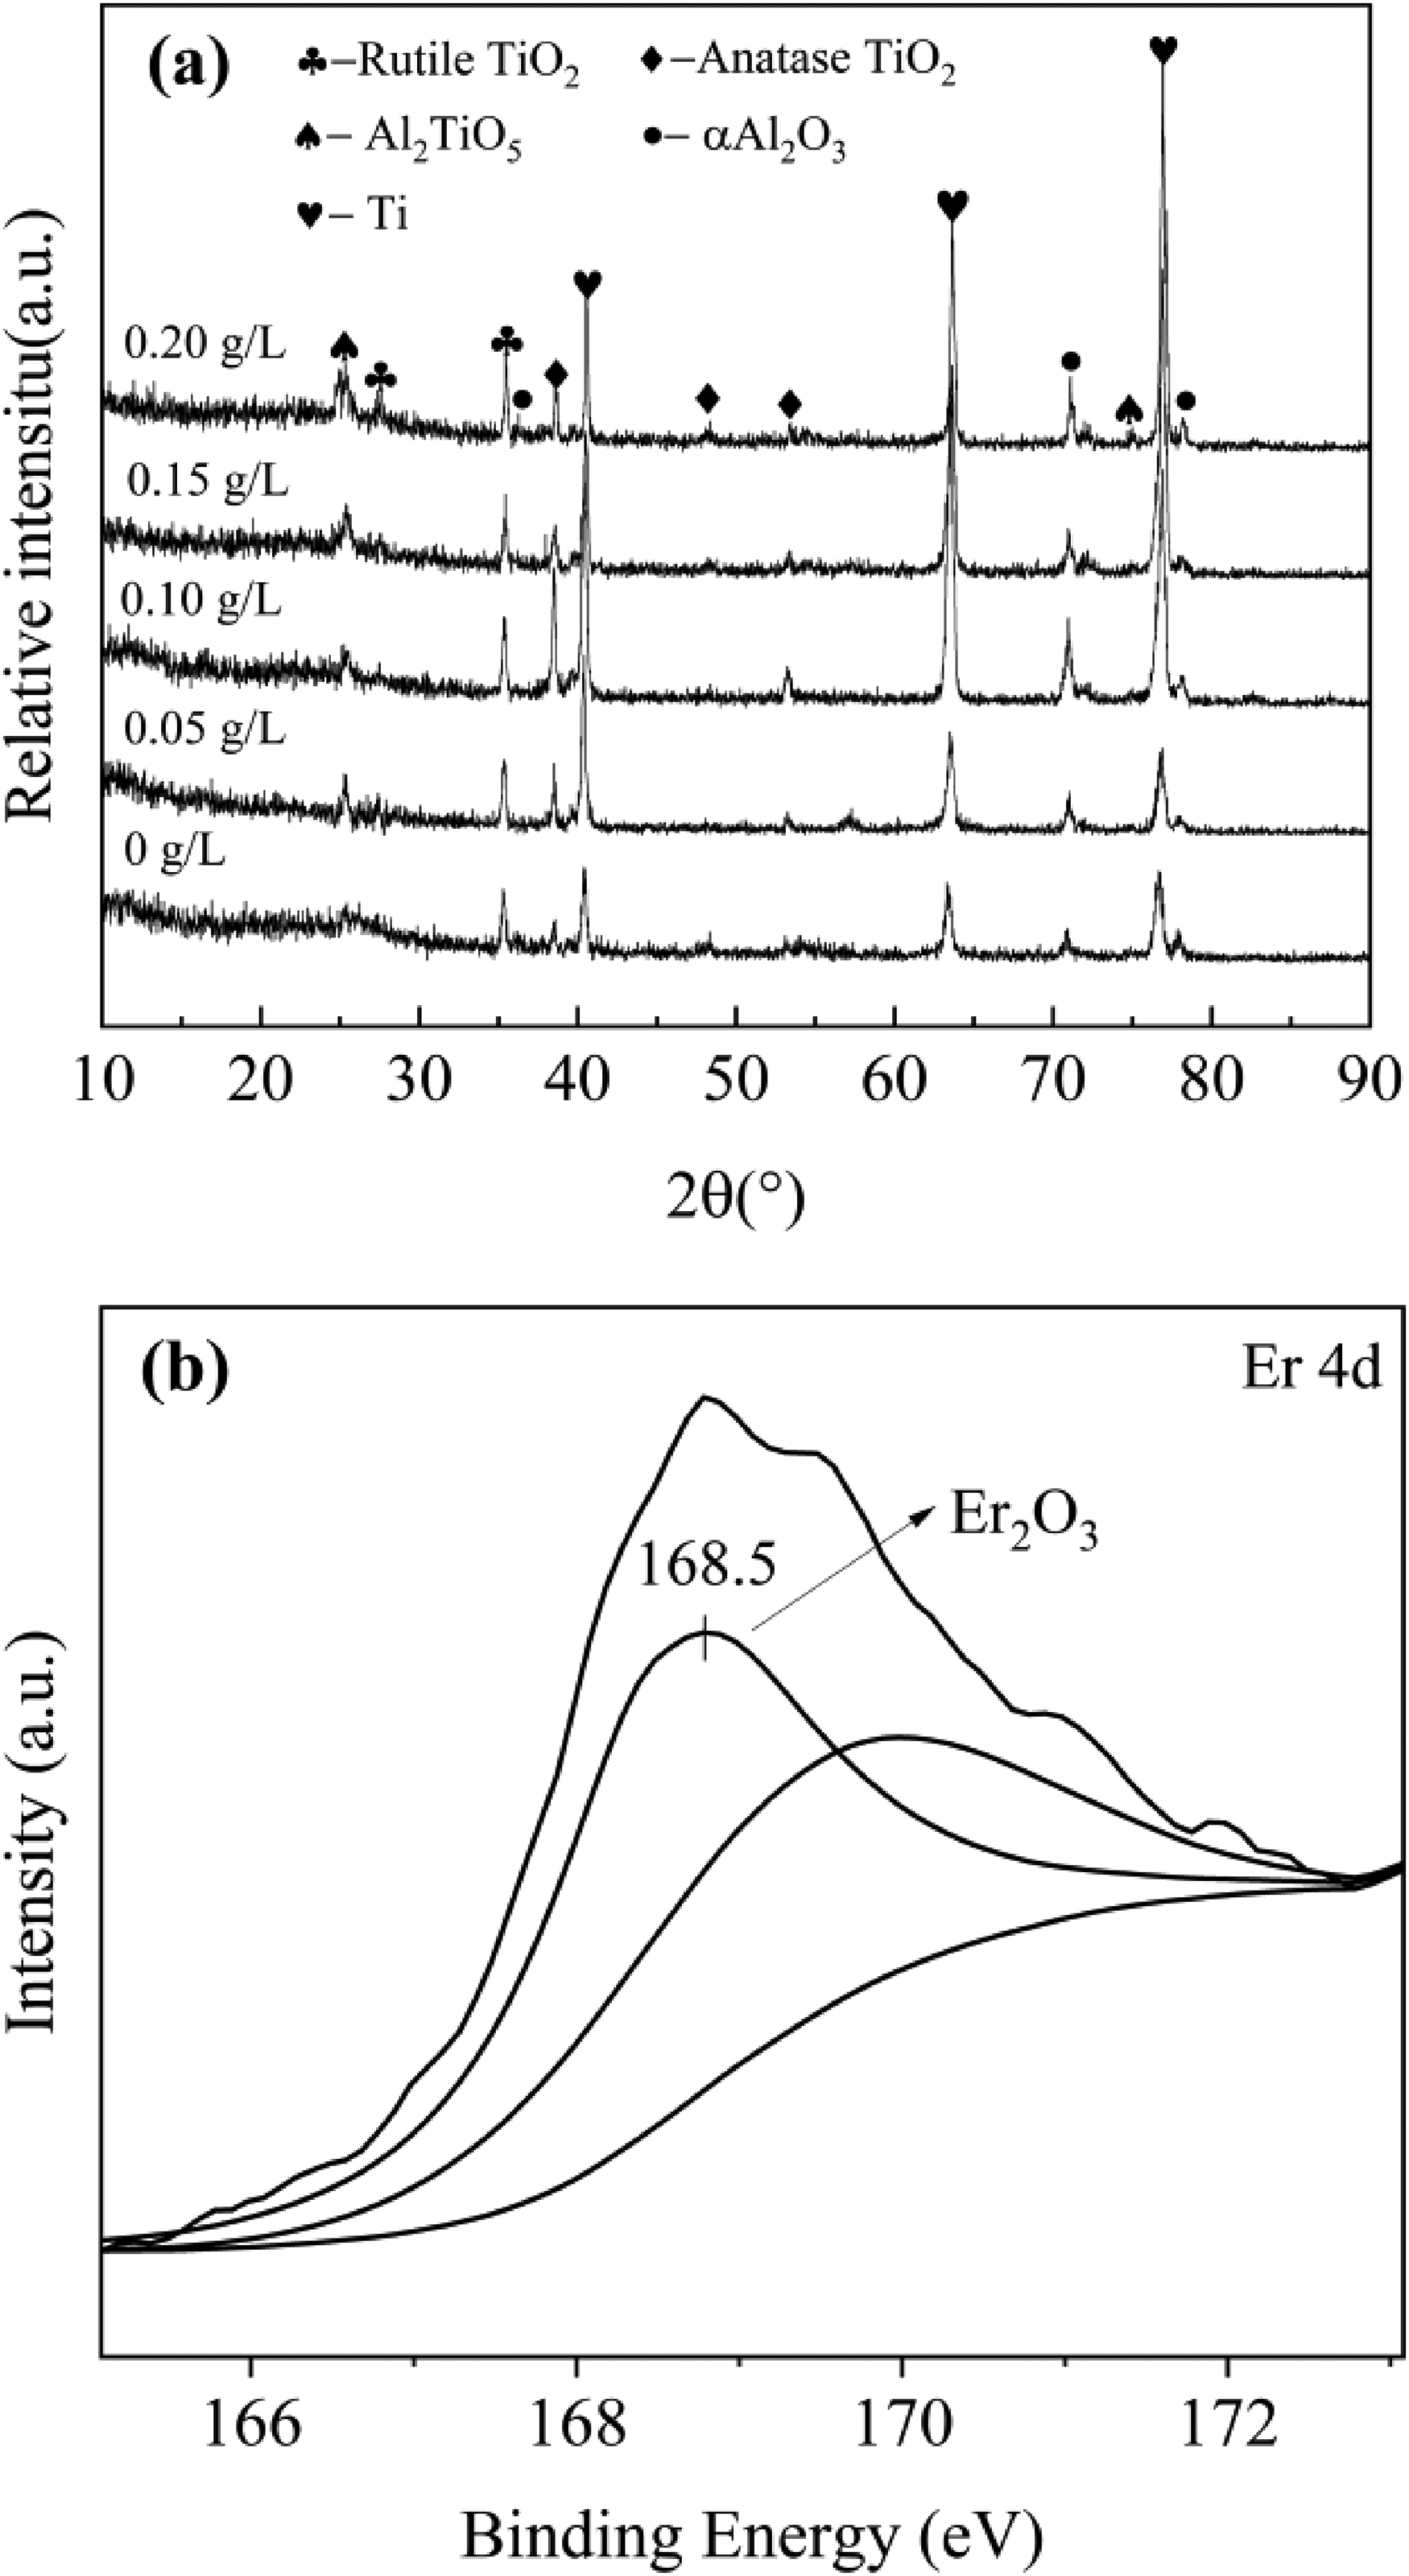
(a) XRD results of the coating and (b) XPS results of Er.
Figure 4(b) displays the coating's XPS image at 0.15 g L−1 of Er2(SO4)3 addition. The Er element exists as Er2O3 in the coating, according to the binding energy (168.5 eV) of the Er 4d spectrum. The reason for this was that Er3+ hydrolyzed from Er2(SO4)3 formed Er(OH)3 that produced Er2O3 at high temperature. 27
Combining the XRD and XPS results, the MAO procedure led to the following reactions:


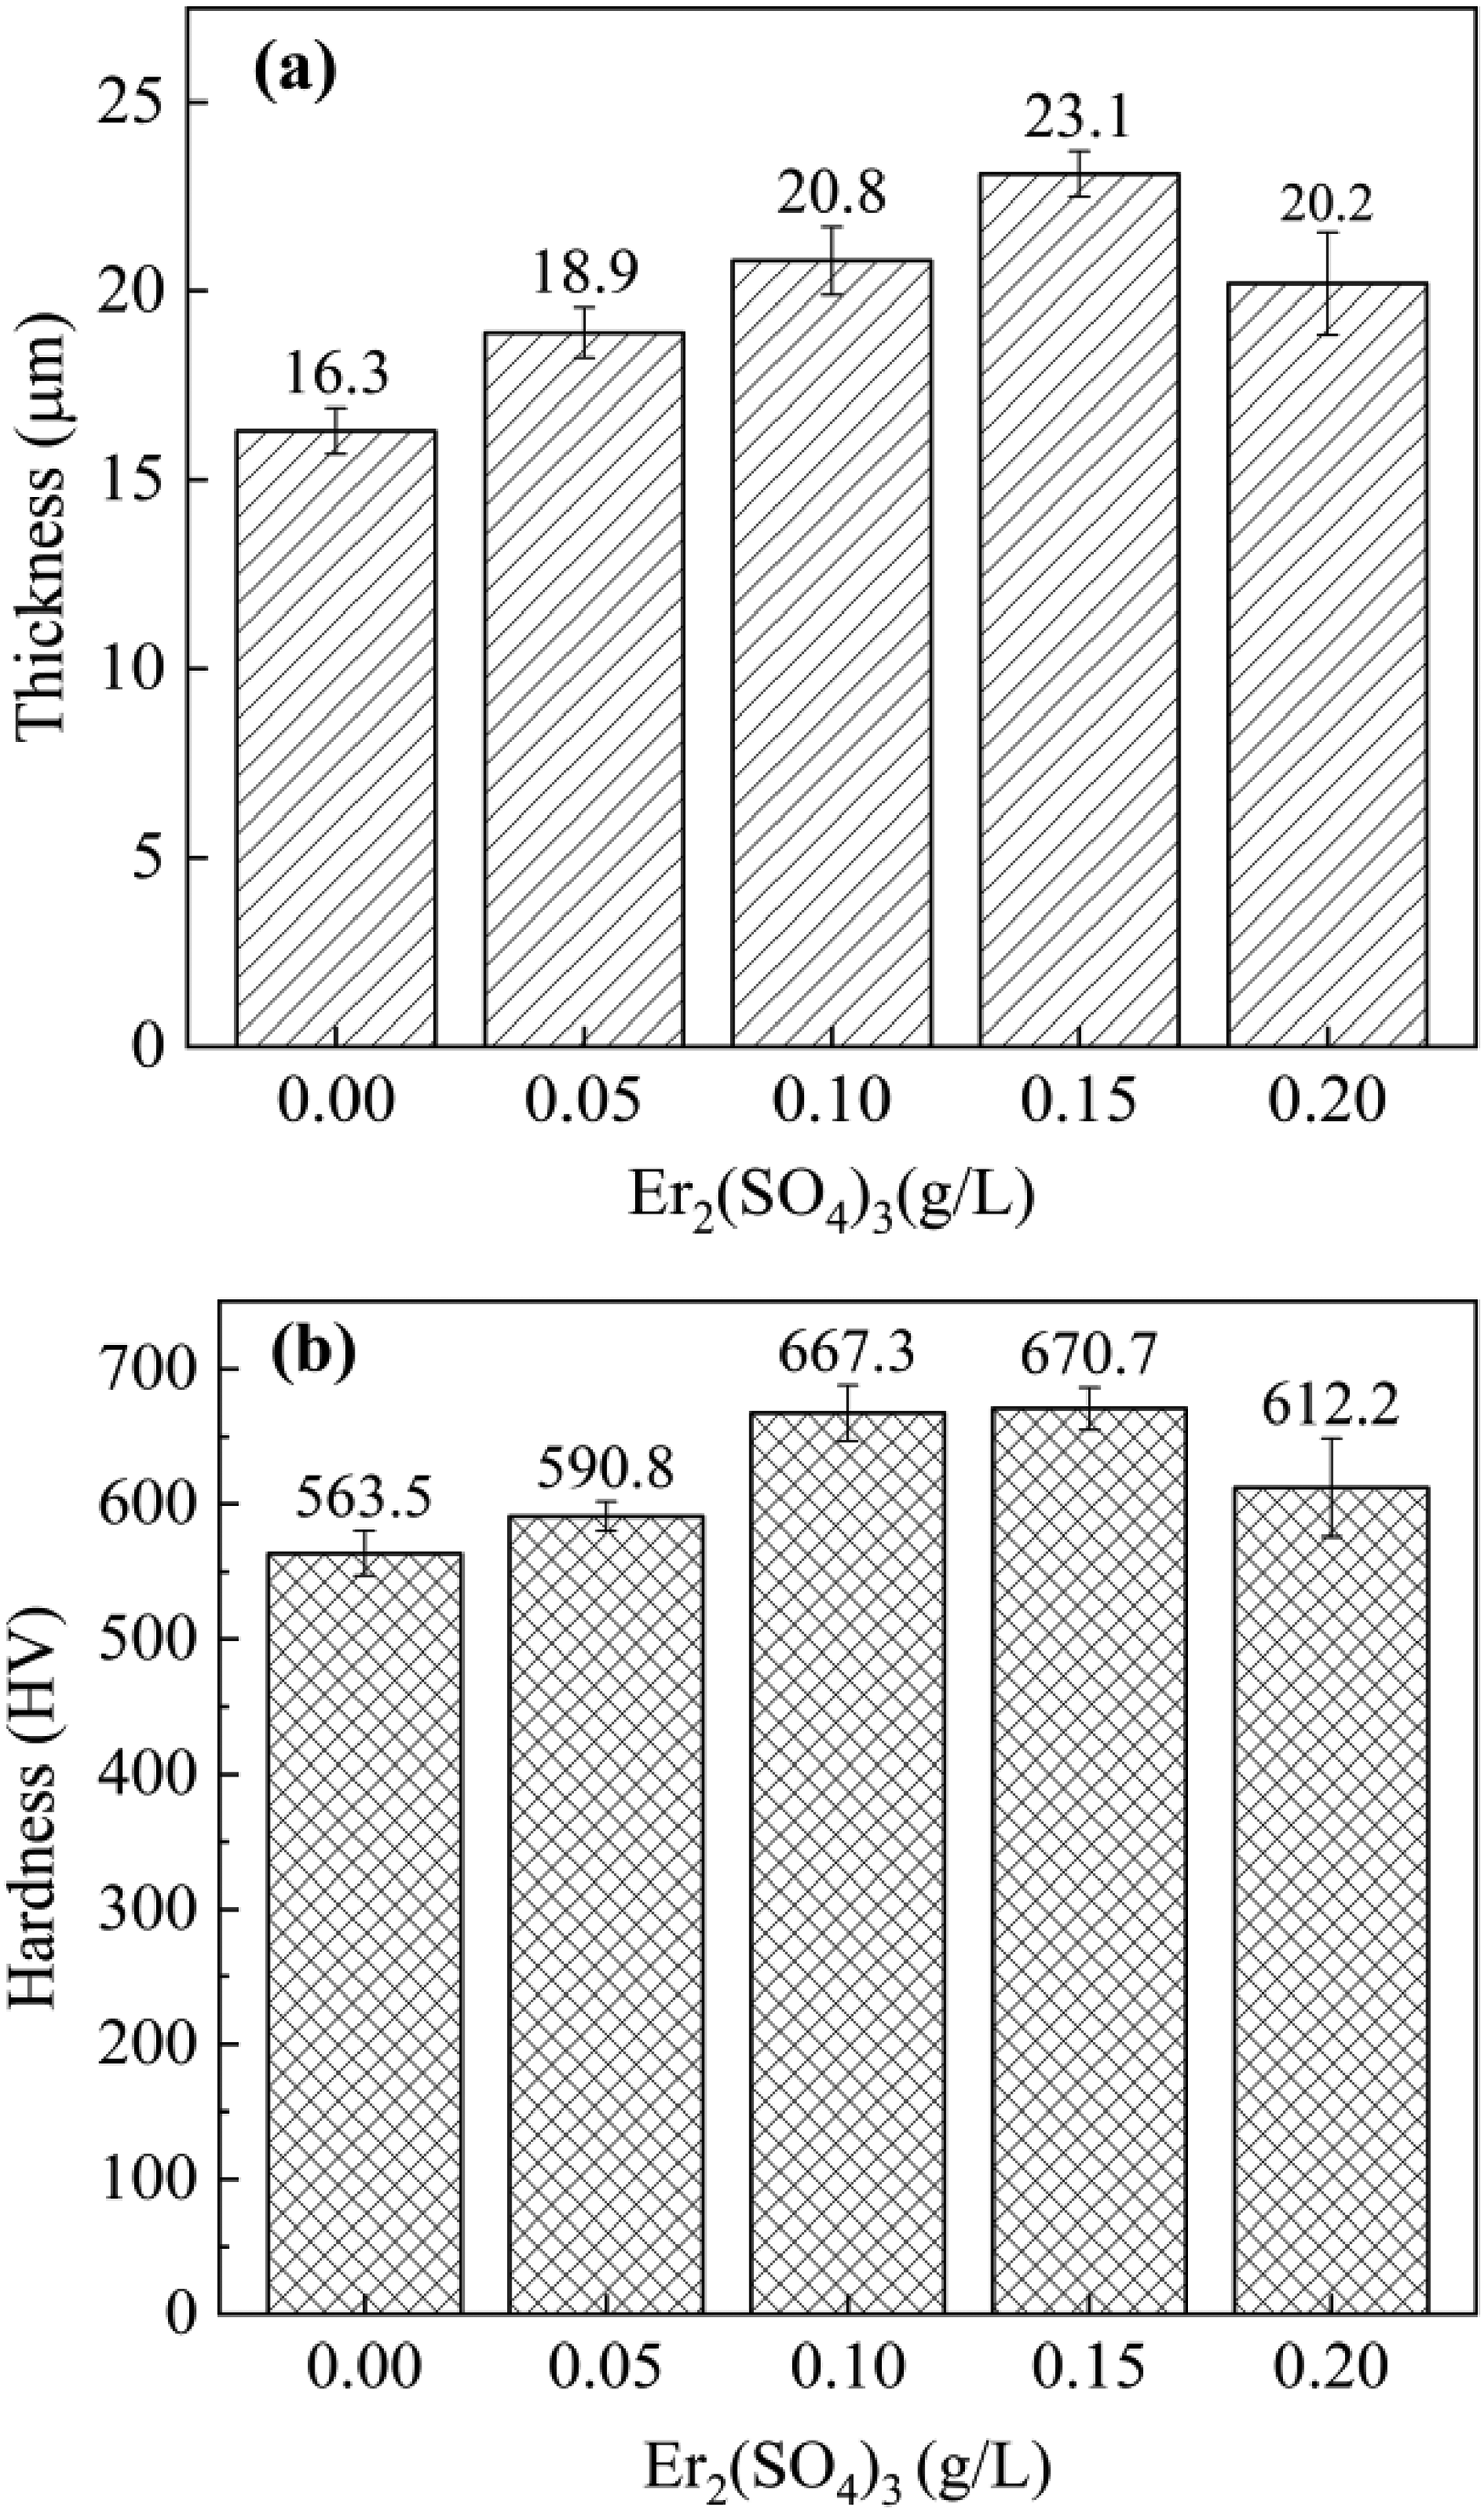
(a) Changes in the coating thickness and (b) Changes in the coating hardness of samples.
The average friction coefficients of the coating after friction wear tests are shown in Figure 6. The research revealed the samples’ average friction coefficient declined following the MAO procedure. The decrease continued with Er2(SO4)3 increasing, and the average friction coefficient eventually reached a minimum value of 0.376 (±0.189) at 0.15 g L−1. The surface of substrate and the coating without Er2(SO4)3 were severely eroded after the friction wear test, and there were clear furrow-like wear marks on the surface of substrate (Figure 7(a, b)). It was because the substrate was primarily worn by adhesives while the MAO coating was primarily worn by abrasive grains. 28 The samples’ width of wear marks and the degree of wear showed a decreasing trend with increasing Er2(SO4)3, and the wear marks had lowest depths and the width was the narrowest at 0.15 g L−1 (Figure 7(c)). This was because the addition of Er2(SO4)3 enhanced the densification of the coating and increased the content of hard phases in it, particularly rutile TiO2 with a higher microhardness, which was crucial for enhancing the coating's ability for resistance to wear.29–31 In addition, the porous structure of the MAO coating can play a certain buffering effect on the friction to improve the wear resistance of the samples.
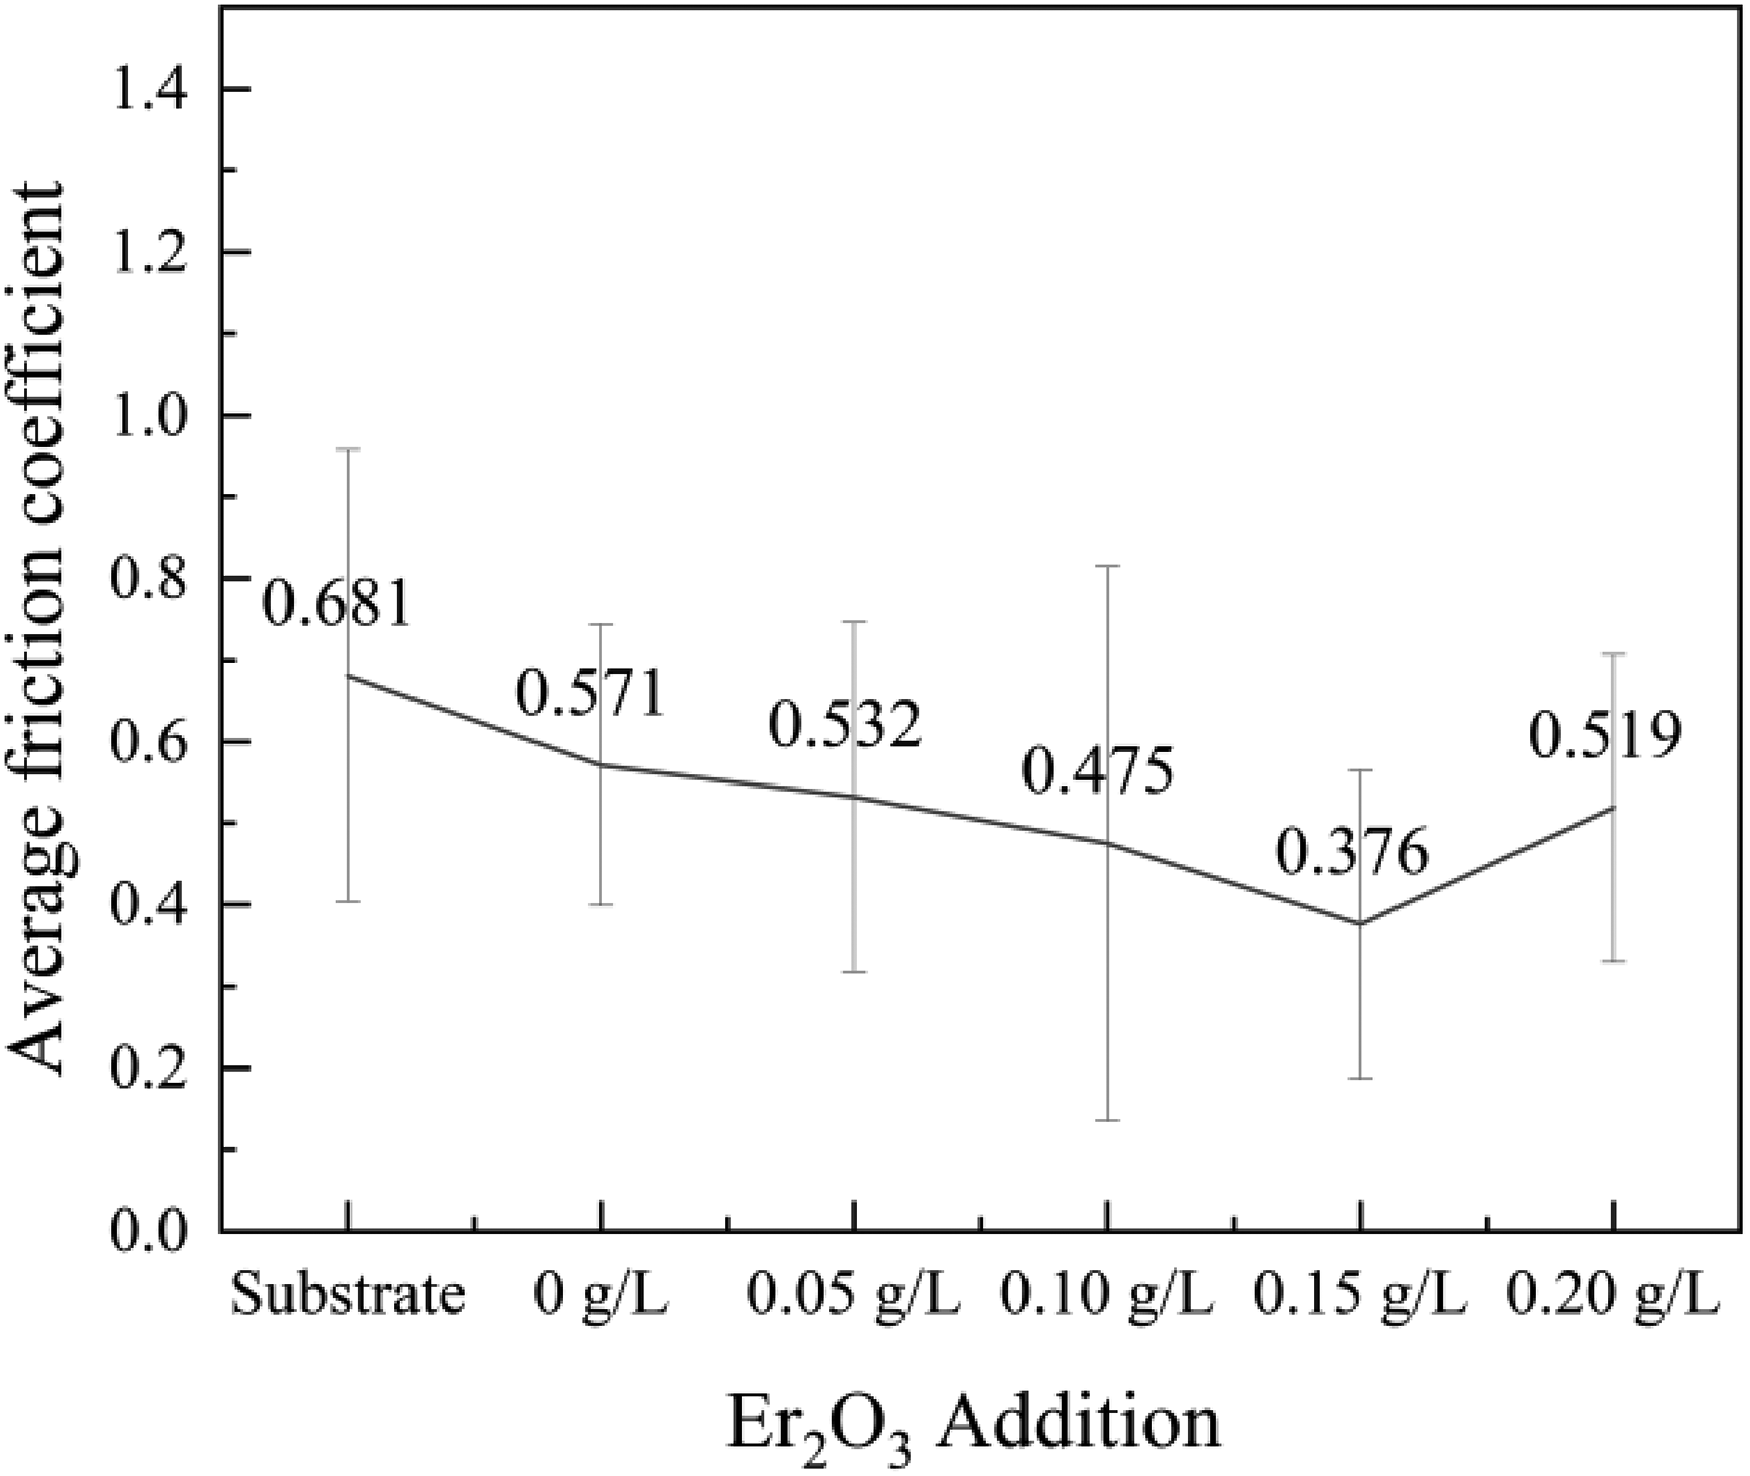
Effect of Er2(SO4)3 additive amount on the average friction coefficients of the coating.
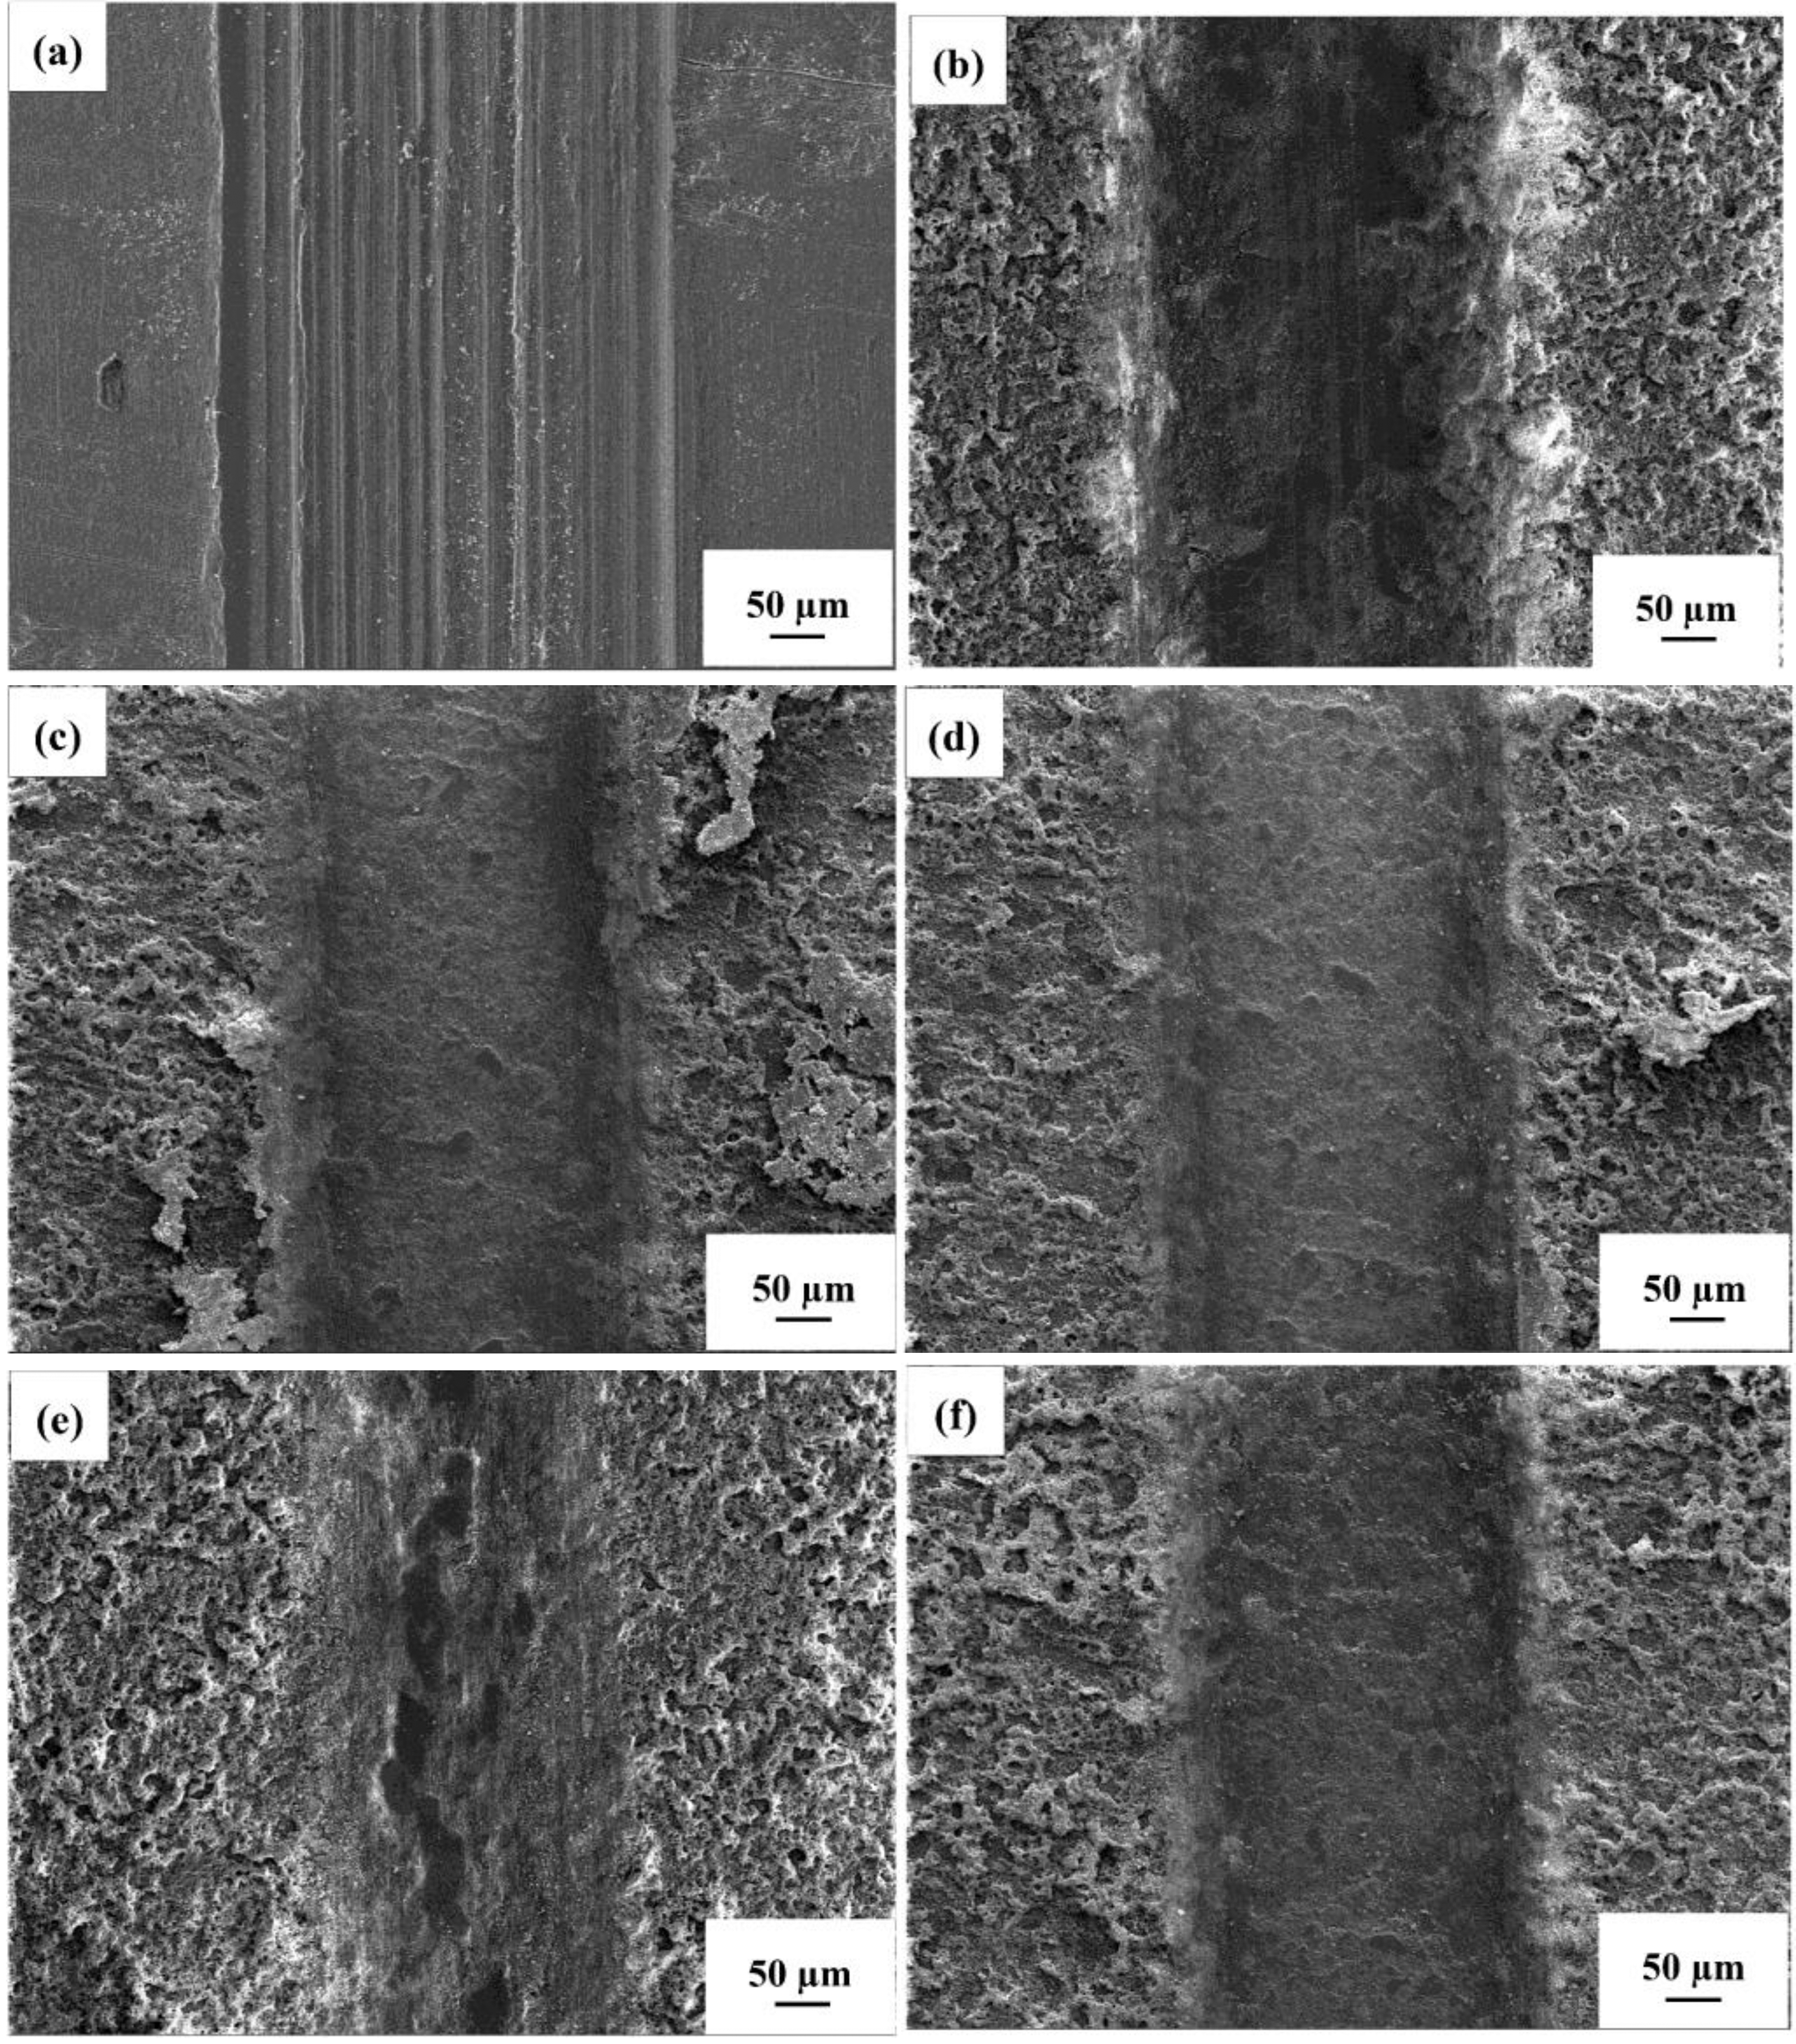
Wear mark morphology of the coating: (a) substrate (b) no addition, (c) 0.05 g L−1, (d) 0.10 g L−1, (e) 0.15 g L−1, (f) 0.20 g L−1.
Figure 8 displays the polarization curves in a 3.5% NaCl solution with different Er2(SO4)3 additions. Table 2 reveals that the Ecorr value demonstrated a positive trend with Er2(SO4)3 increasing and the Icorr was a factor of an order of magnitude less than that of the substrate. Compared with improving the corrosion resistance of the MAO coating of the TC11 by changing the current density, the coating prepared by adding Er2(SO4)3 to the electrolyte had better corrosion resistance and its Icorr was lower. 16 The corrosion rate decreased to a minimum value of 1.26 × 10⁻⁸ mm a−1 as Er2(SO4)3 reaching 0.15 g L−1, demonstrating that coating had the best resistance to corrosion at the time.
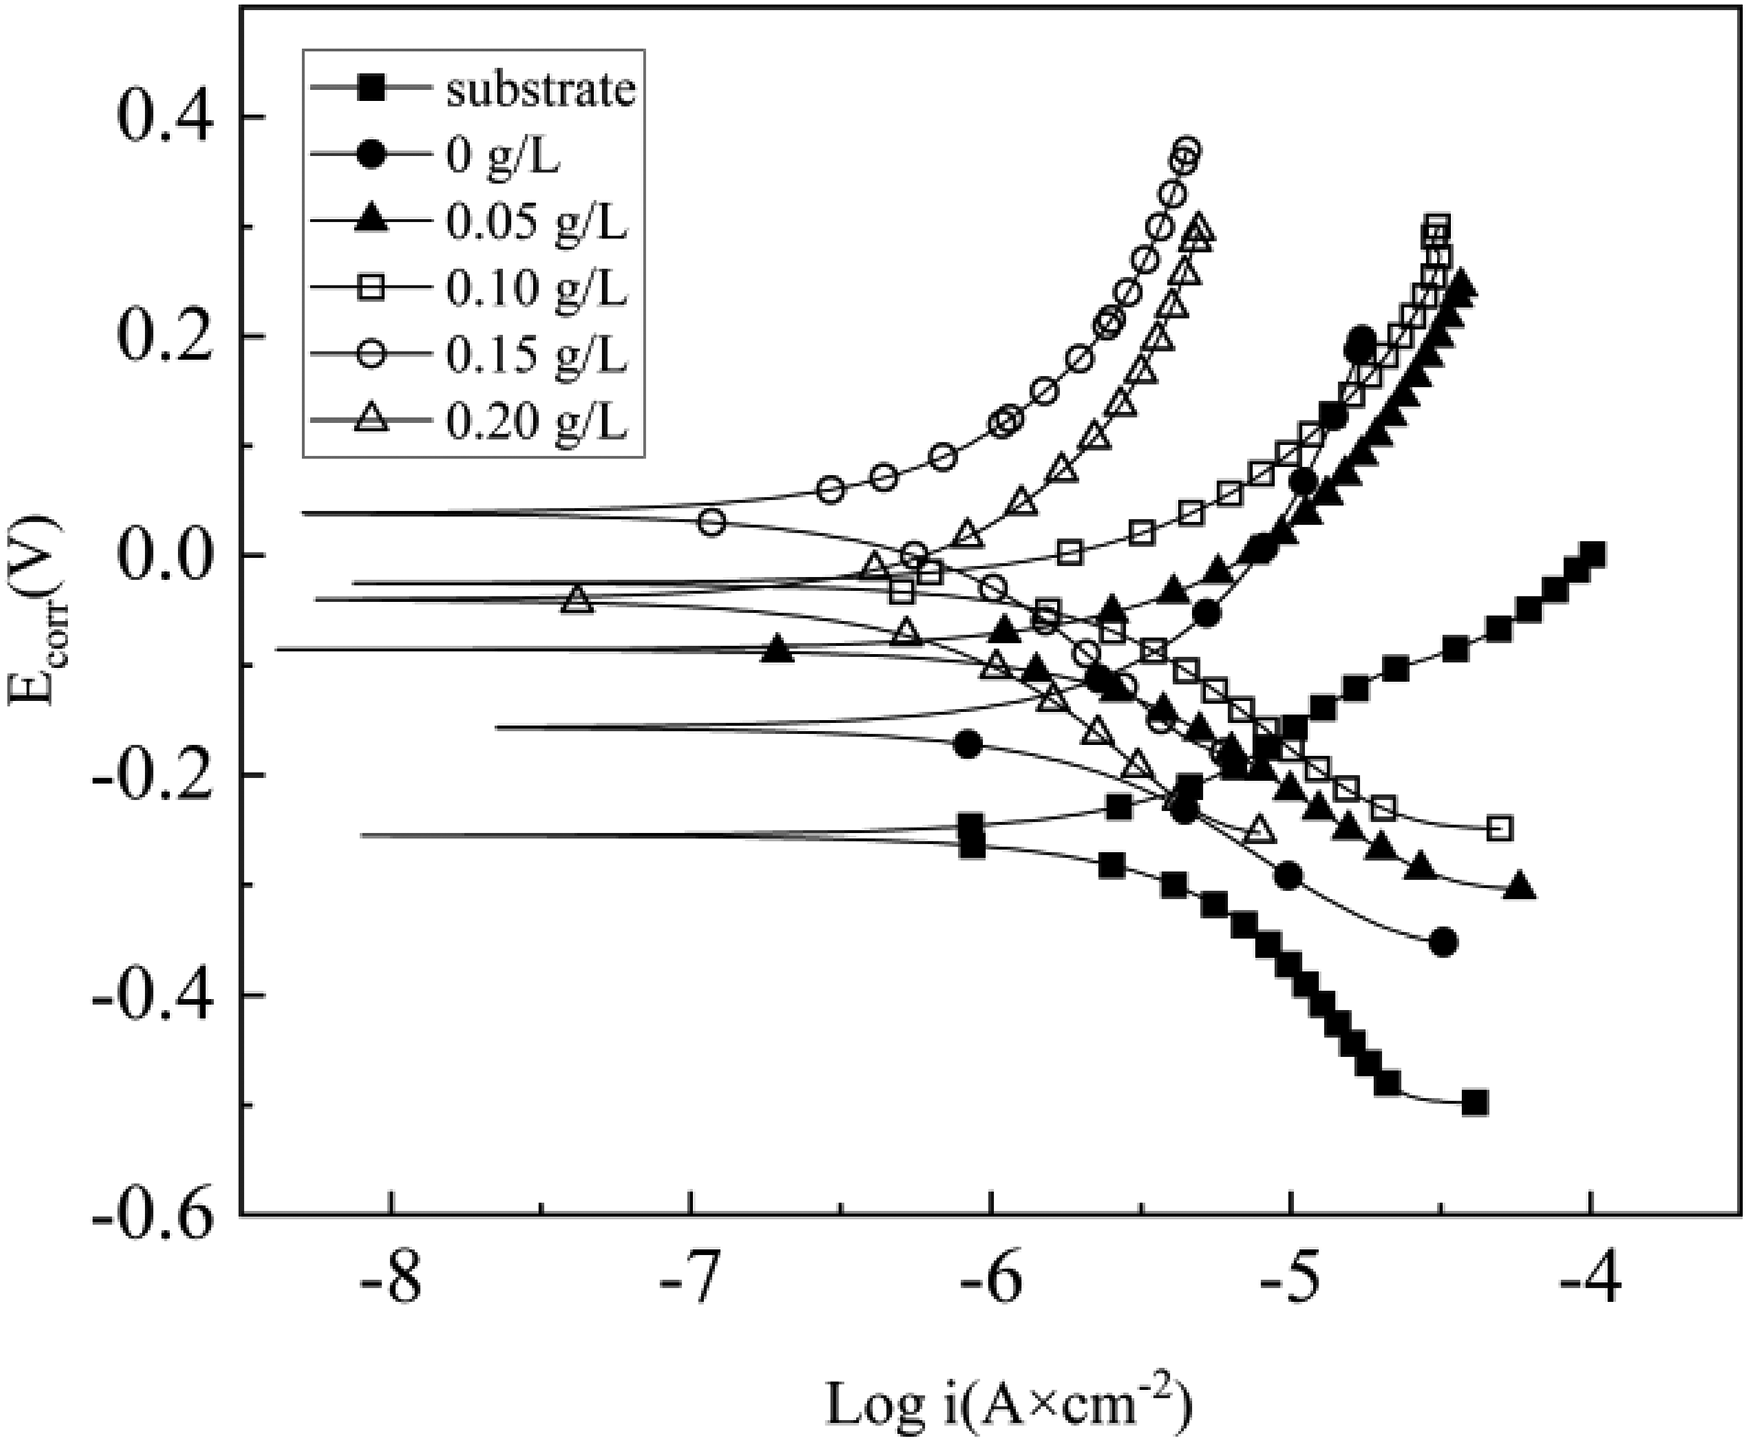
Polarization curves of the MAO coating in 3.5% NaCl solution.
Zeta potential polarization curves of different samples.
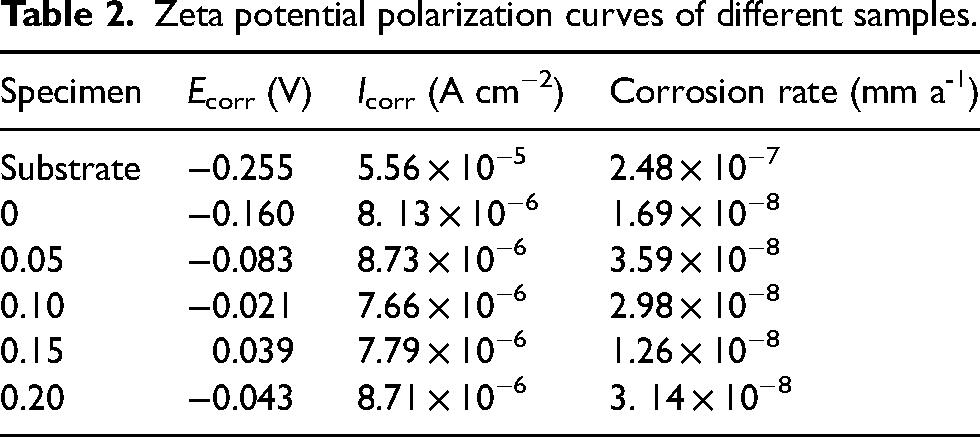
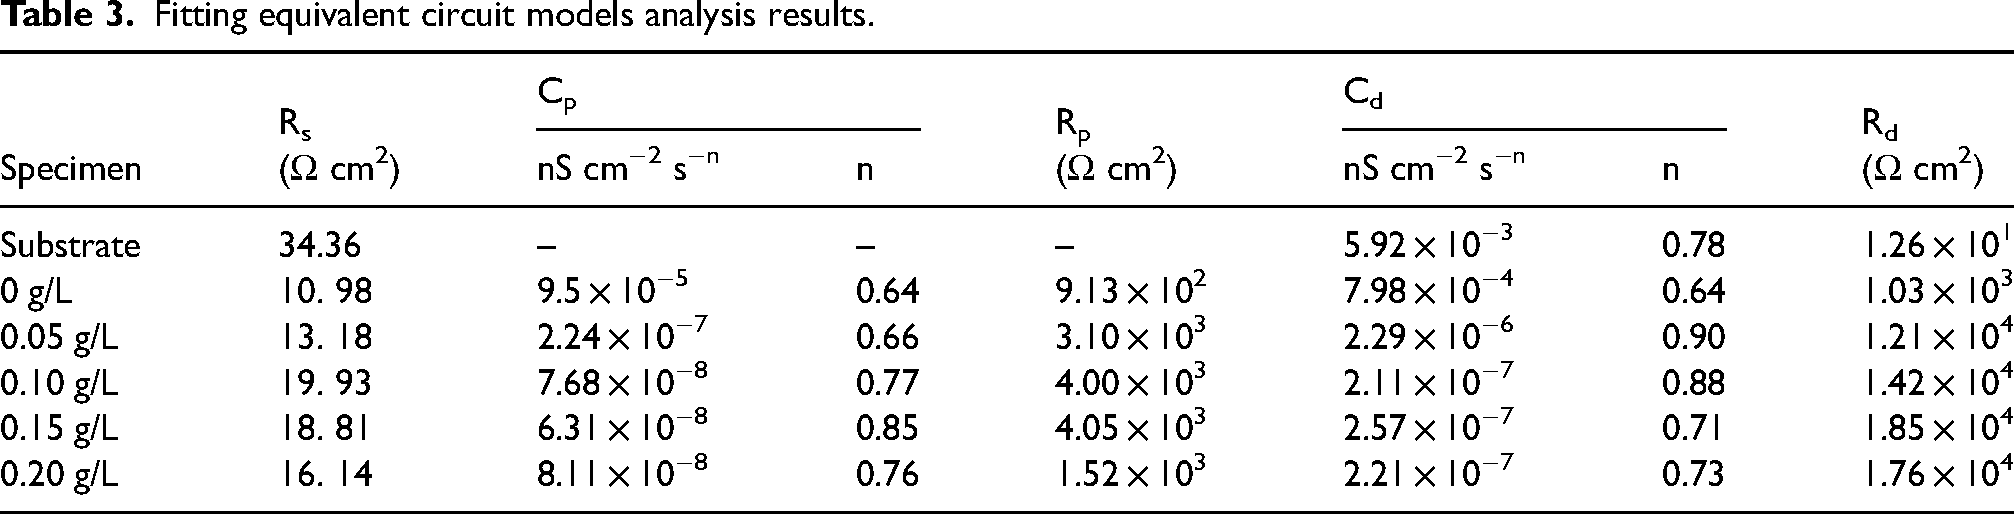
Figure 9 demonstrates the coating's arc tolerance with various Er2(SO4)3 additions, and the Bode plots show that two-time constants characterized the samples treated by micro-arc oxidation (Figure 10), which suggested that the MAO coating was composed of two layers of coating. The coating corrosion resistance can be shown by both the radius of the arc tolerance and the |Z| value in the low-frequency zone, and the coating corrosion resistance was best at 0.15 g L−1. The parameters obtained after fitting the EIS images with the fitting circuit diagrams in Figure 11 are shown in Table 3, where Rp and Rd stood for the resistance of loose coating and dense coating correspondingly. This finding revealed that when Er2(SO4)3 was added, the inner dense coating resistance (Rd) was larger than the outer loose layer resistance (Rp), indicating the dense coating had a greater influence on the coating corrosion resistance. The Rd values of the added Er2(SO4)3 coatings were all one order of magnitude greater than the Rd value for the coating without Er2(SO4)3, which was 1.03 × 10³ Ω cm2. The maximum Rd value was 1.85 × 10⁴ Ω cm2 when Er2(SO4)3 approached 0.15 g L−1, and the corrosion resistance of the coating was the best, which was consistent with the findings of the polarization curve analysis. This happened because of the addition of additives increasing the coating's thickness and densification, which reduced direct contact between Cl− and the substrate and improved the coating's corrosion resistance.
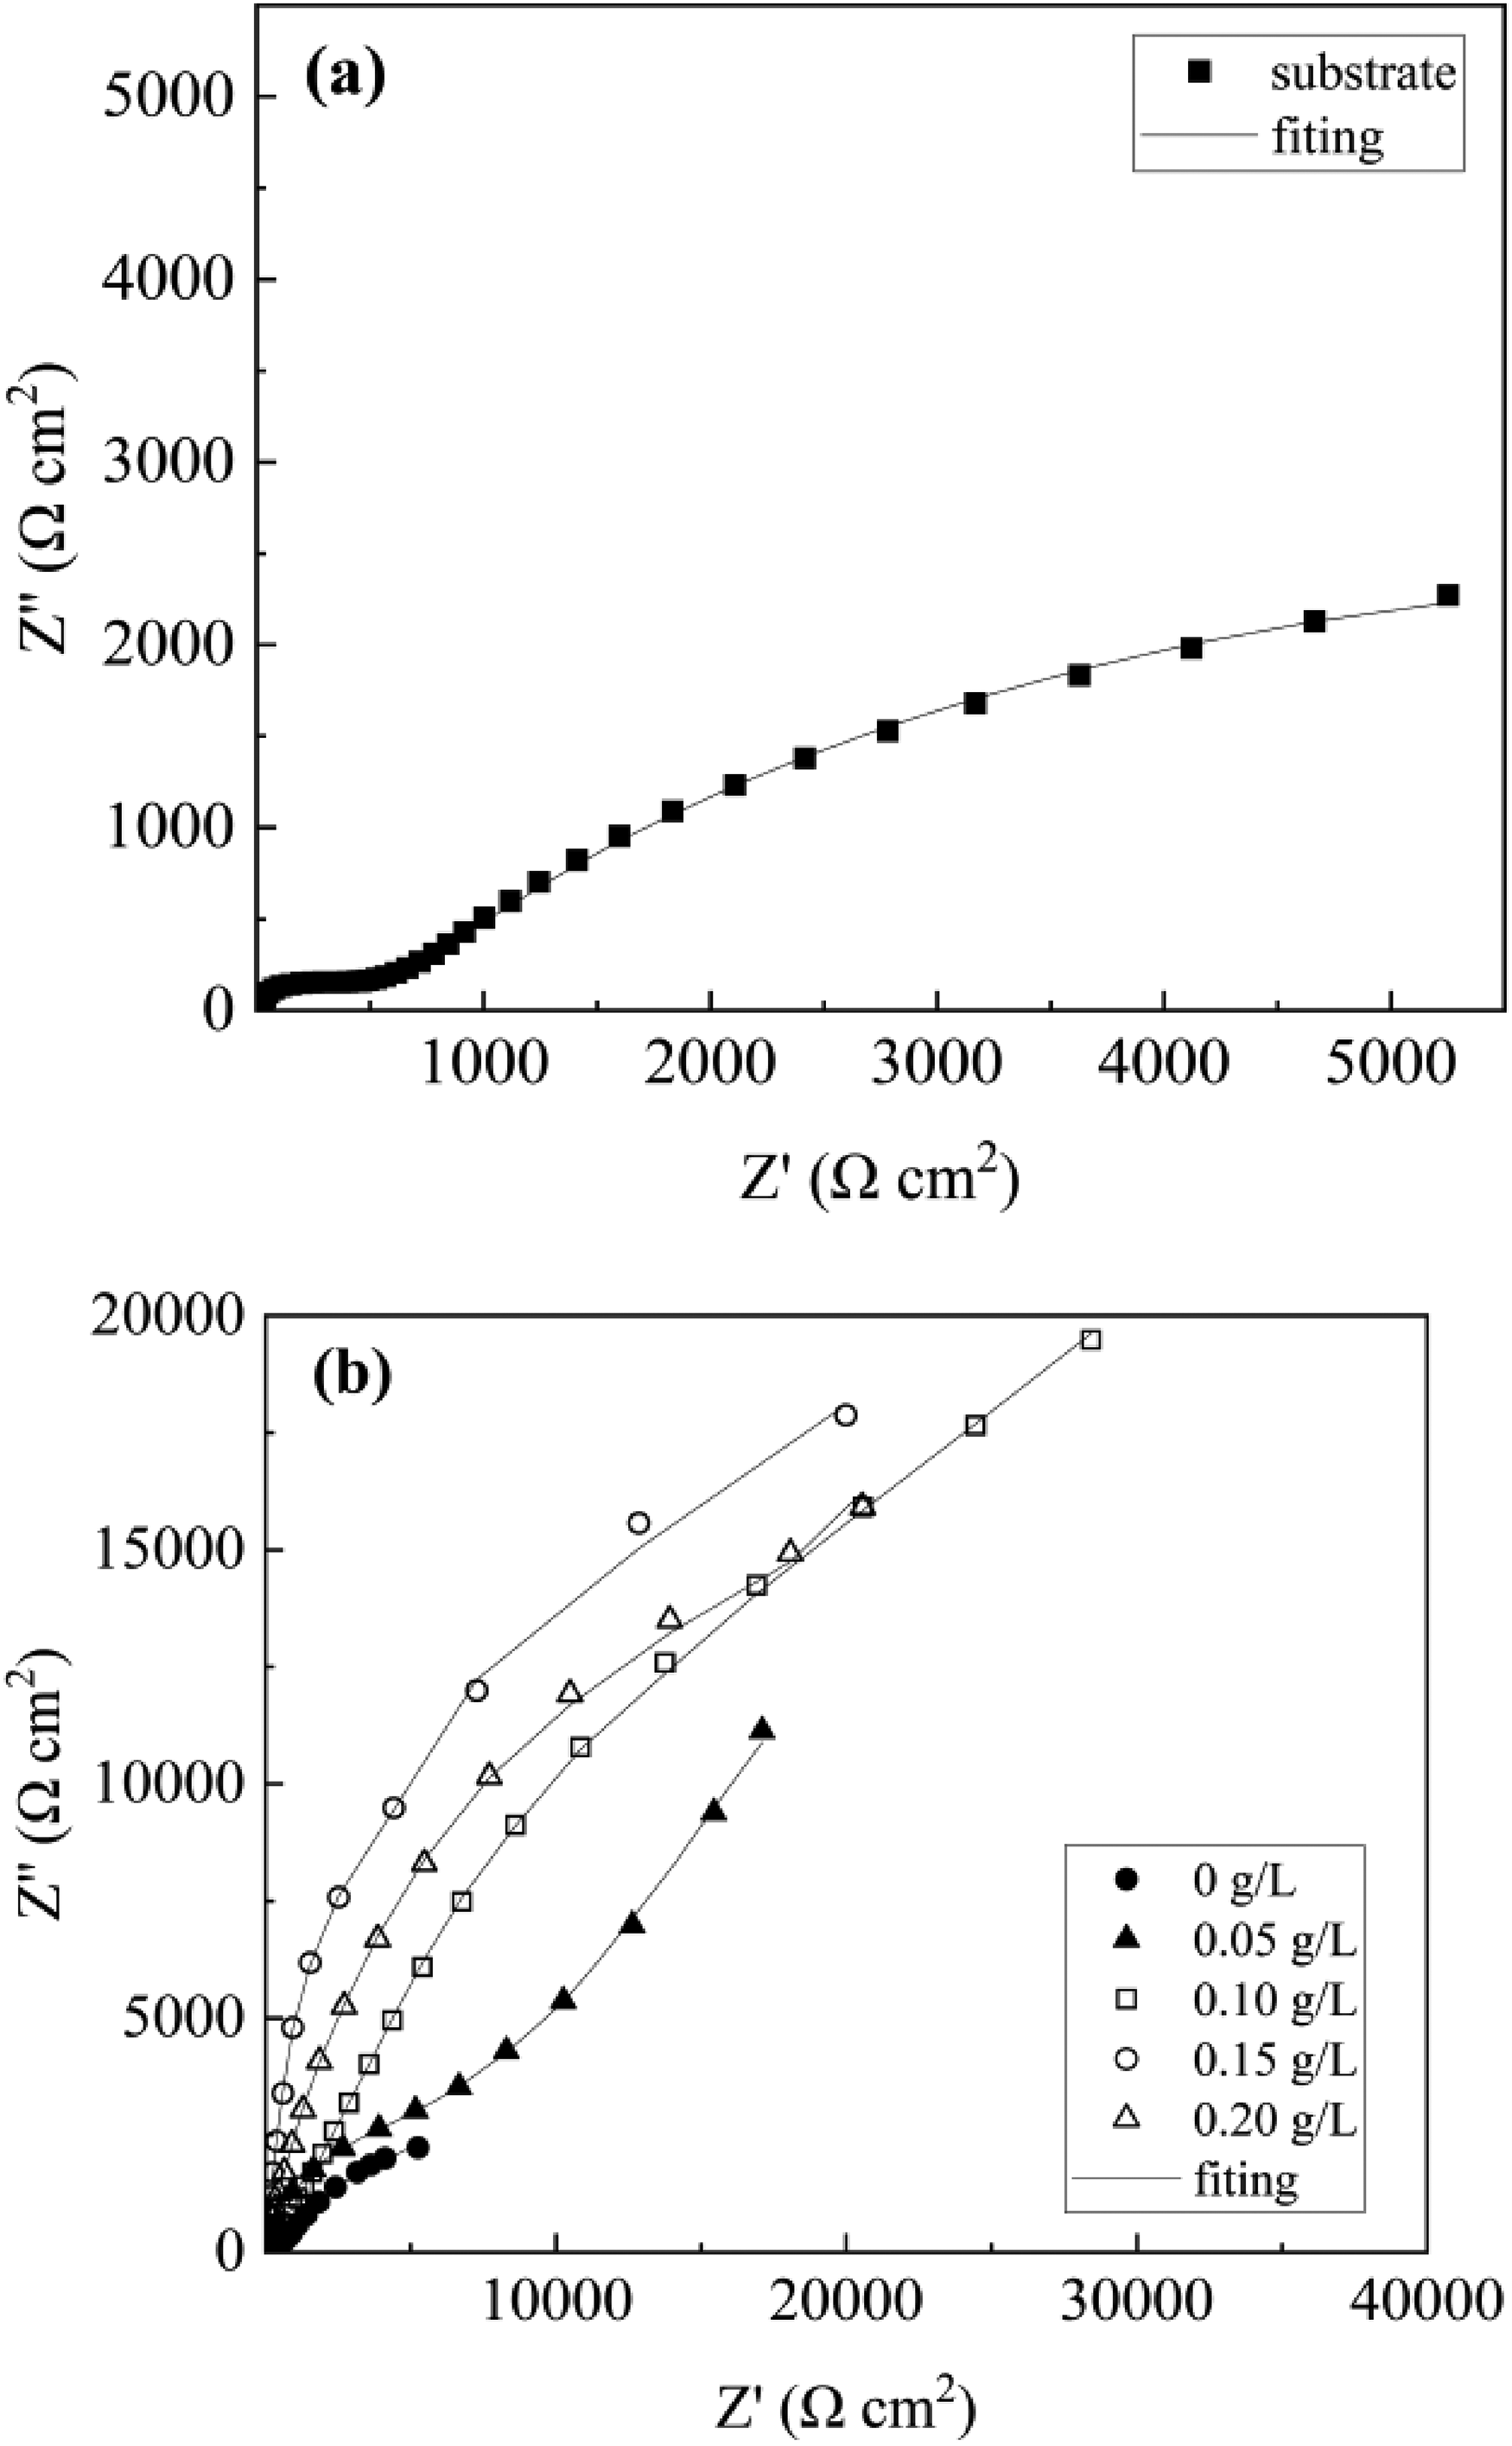
Nyquist diagram of sample coatings in 3.5% NaCl solution.
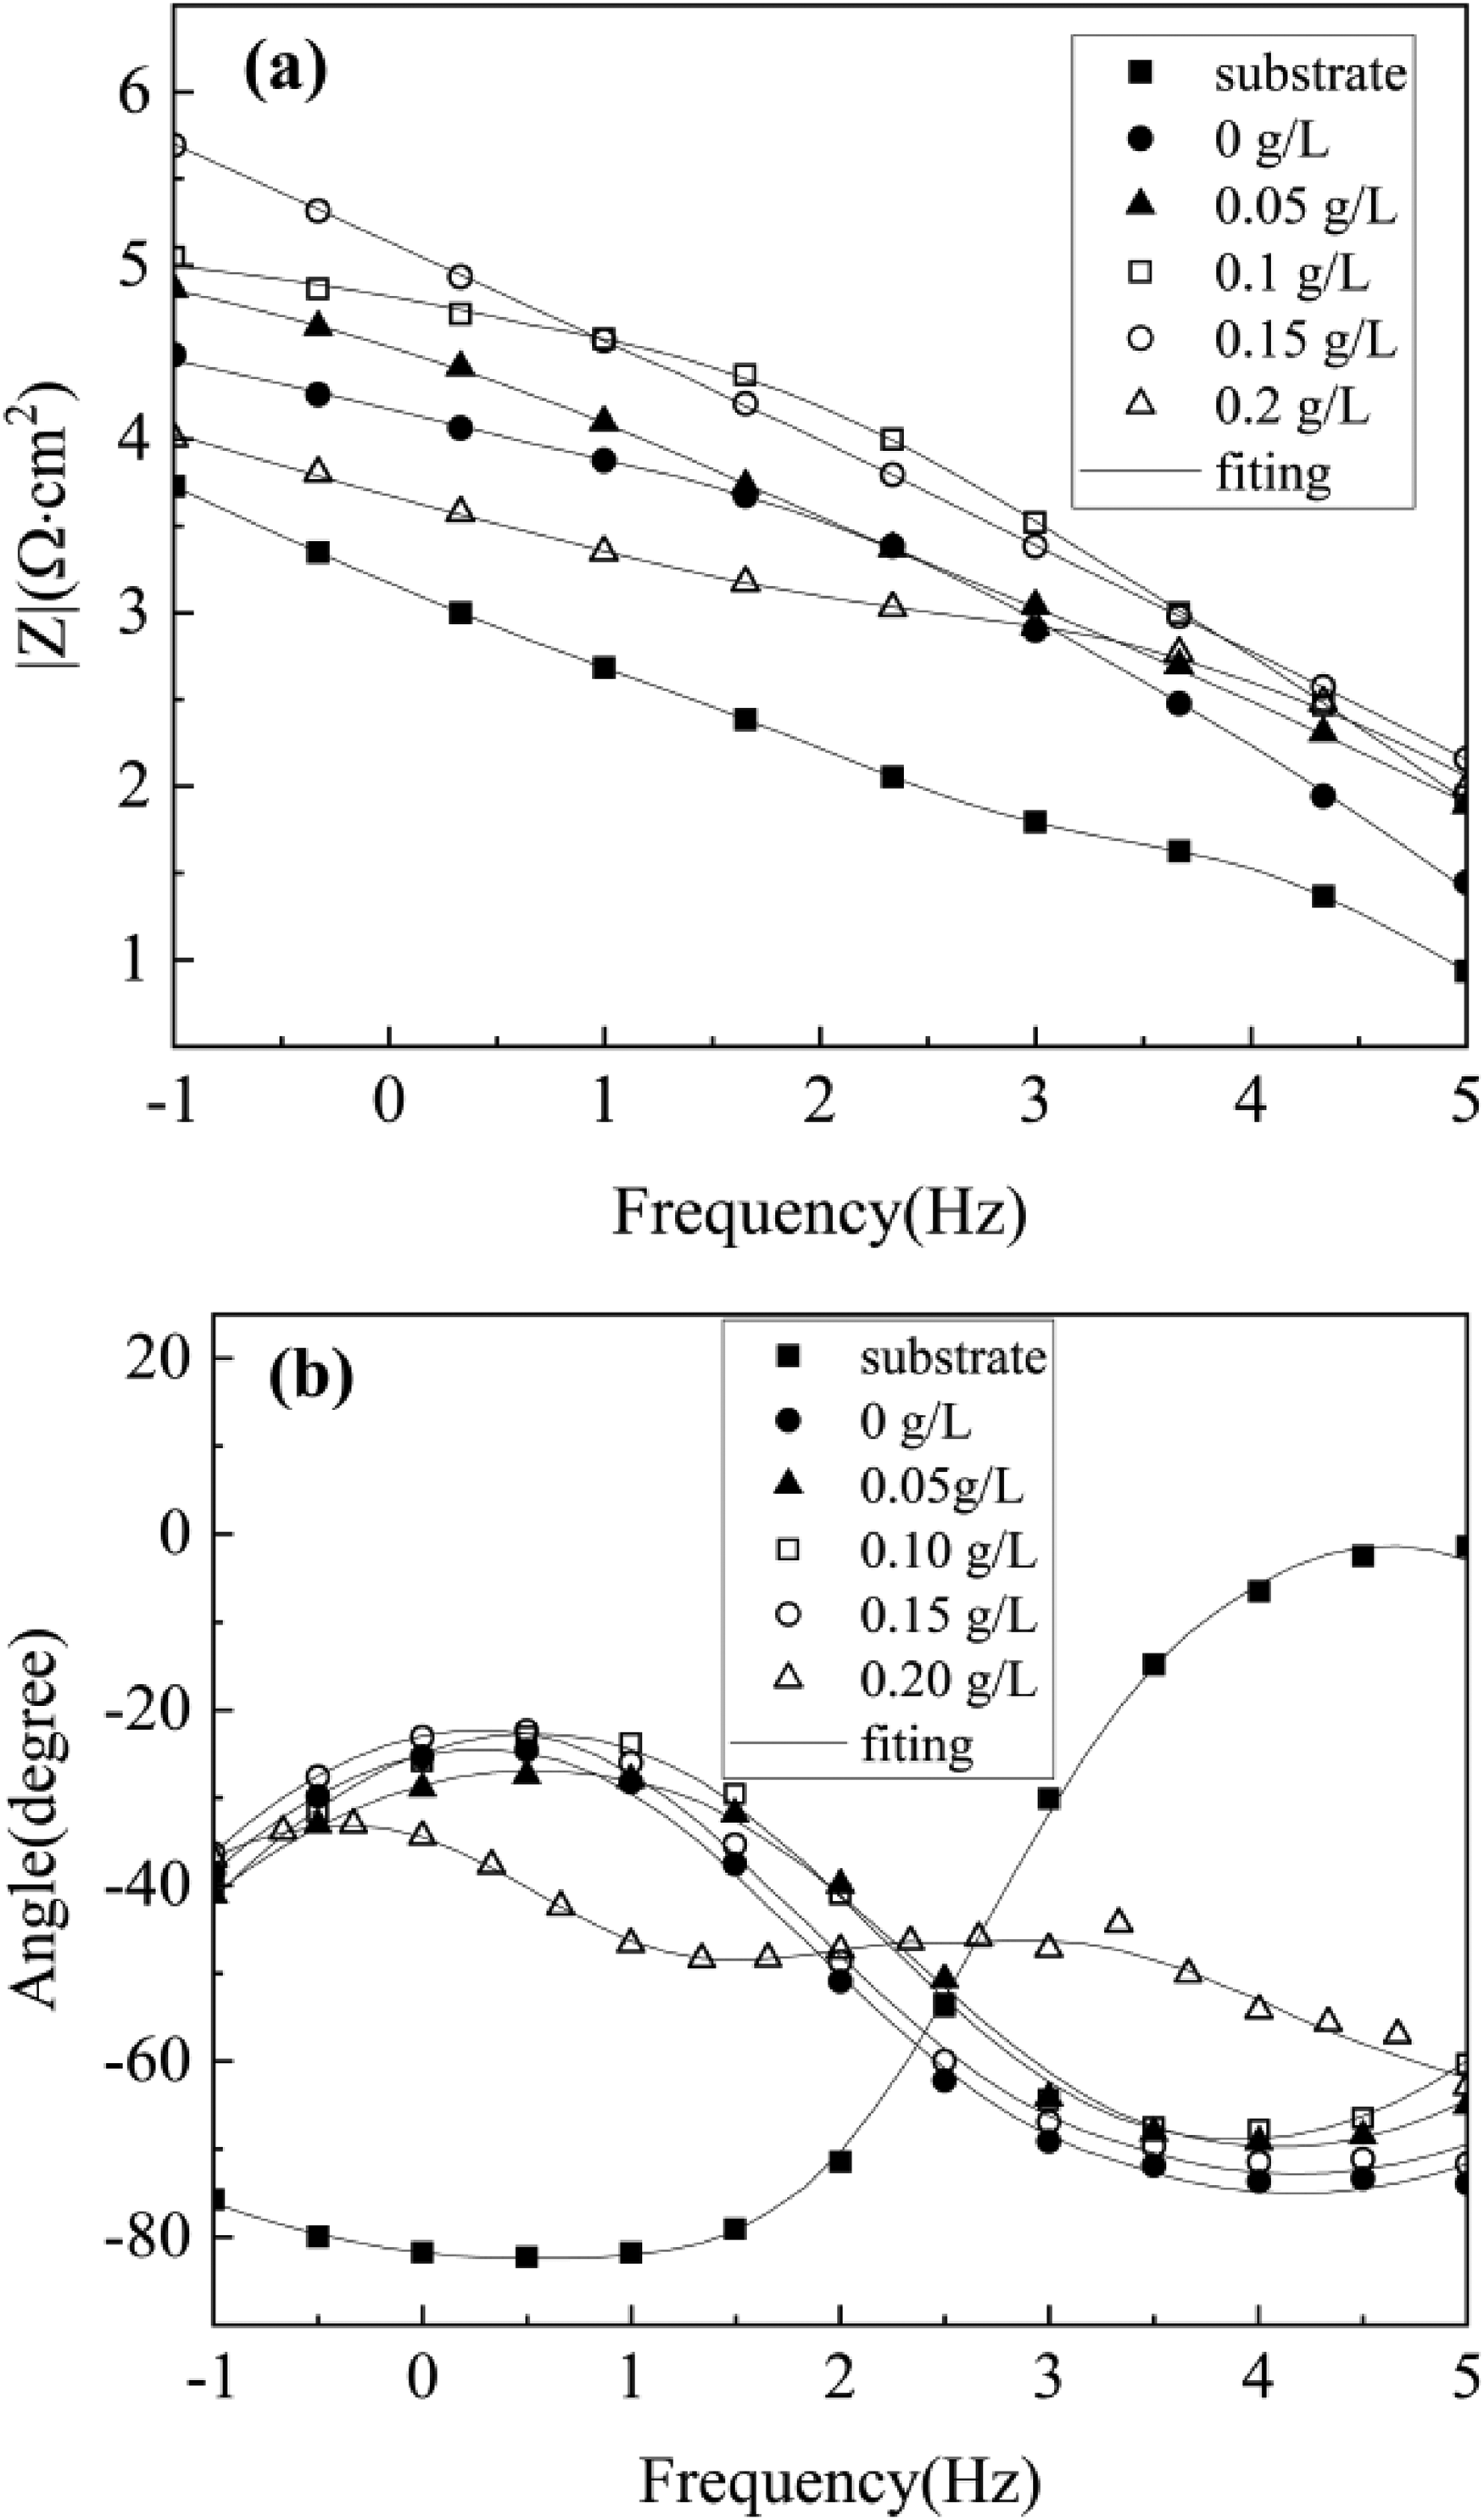
Bode diagram (a) and phase angle (b) of the coating in 3.5% NaCl solution.
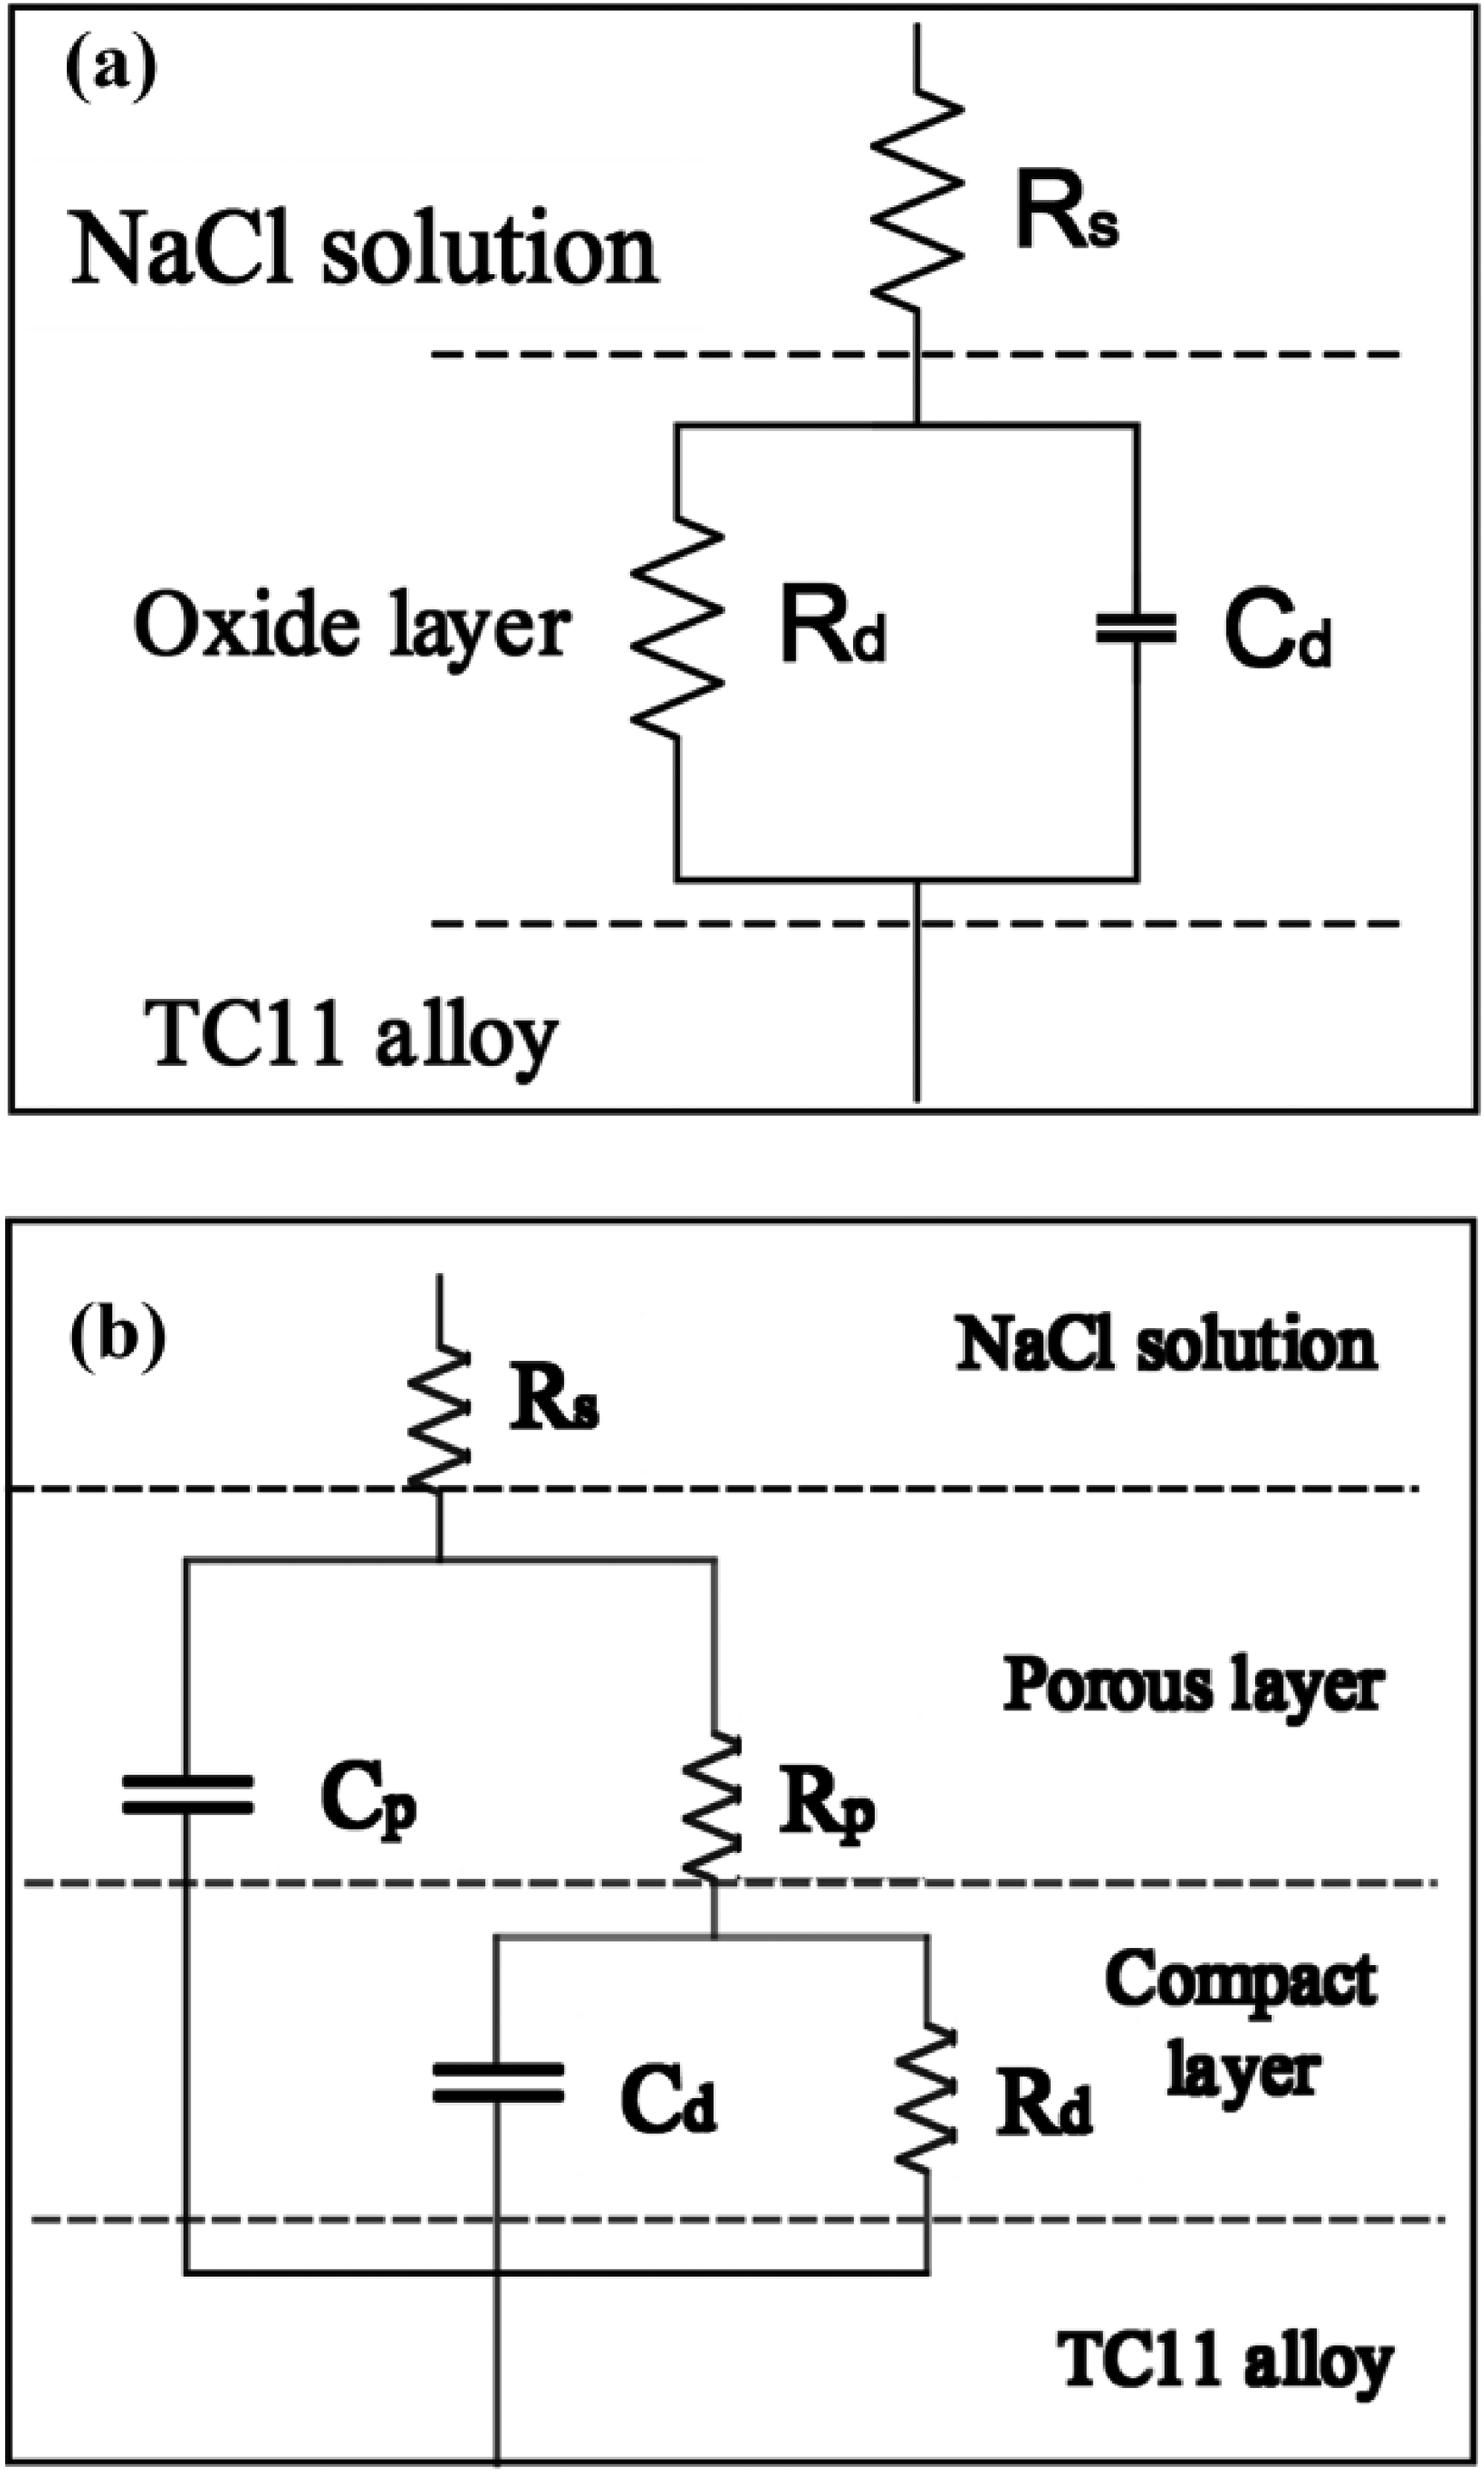
Fitting circuit diagram of the coating layer.
Fitting equivalent circuit models analysis results.
Conclusion
The addition of Er2(SO4)3 considerably influenced the surface morphology and characteristics of the MAO coating of TC11 titanium alloy.
Hydrolyzed Er3+ from Er2(SO4)3 increased the number of discharge centers on the surface of the samples to raise the oxidation voltage, providing the higher energy to enhance the ions transmission efficiency and the coating formation rate, which leaded to the thickening of the coating. The more uniform and sufficient discharge reduced the dimension of microporous, which enhanced the densification of the coating. The main components of the MAO coating were anatase TiO2, rutile TiO2, γ-Al2O3 and Al2TiO5. The Er element existed as Er2O3 in the coating and can enhance the hardness and wear resistance of the coating by increasing the content of the hard phase (anatase TiO2, rutile TiO2), and the hardness and wear resistance of the coating are optimal with the Er2(SO4)3 of 0.15 g L−1. The thickness and densification of the coating increased with the addition of Er2(SO4)3, which reduced the contact and reaction between the substrate and the corrosive media, improving the coating's corrosion resistance. When Er2(SO4)3 was 0.15 g L−1, the Rd reached a maximum value of 1.85 × 10⁴ Ω cm2, while the self-corrosion rate dropped to a minimum of 1.26 × 10⁻⁸ mm a−1, indicating that the coating had the best corrosion resistance at this concentration.
Footnotes
Declaration of conflicting interests
The authors declared no potential conflicts of interest with respect to the research, authorship, and/or publication of this article.
Funding
The authors disclosed receipt of the following financial support for the research, authorship, and/or publication of this article: This work was supported by Sichuan Science and Technology Program (2022YFSY0018); the Open Fund of State Key Laboratory of Vanadium and Titanium Resources Comprehensive Utilization (2022P4FZG08A).