
Abstract
The microstructure and crystallographic textures of API X65 grade linepipe steel were studied in the base metal, the weld interface after high-frequency electric resistance welding (HF-ERW), and the weld interface following post-weld heat treatment (PWHT). Optical microscopy, scanning electron microscopy (SEM), and electron-backscattered diffraction (EBSD) were used to study the microstructure and texture evolution and correlated with Charpy V-notch impact toughness. The Charpy values were 172.9 ± 5.2 J for the base metal, 7.5 ± 1.6 J for the as-welded weld interface, and 69 ± 24 J after PWHT, with the latter still significantly lower than the base metal. Base metal showed a low fraction of low-indexed cleavage planes at about 9% and major texture components were (113)[110], (112)[110], and (332)[113]. In the as-welded condition, major intensities of rotated Cube (001)[110] and Goss (110)[001] texture components were observed near the weld interface. Although PWHT reduced the texture intensities, rotated Cube and Goss components were still observed. The fraction of cleavage planes was about 44% for the as-welded and about 30% for the PWHT-ed weld interface. Clearly, PWHT has reduced but not eliminated the detrimental rotated Cube and Goss textures at the weld interface. These detrimental textures likely have contributed to the low Charpy toughness after welding and continuing after PWHT.
Keywords
Introduction
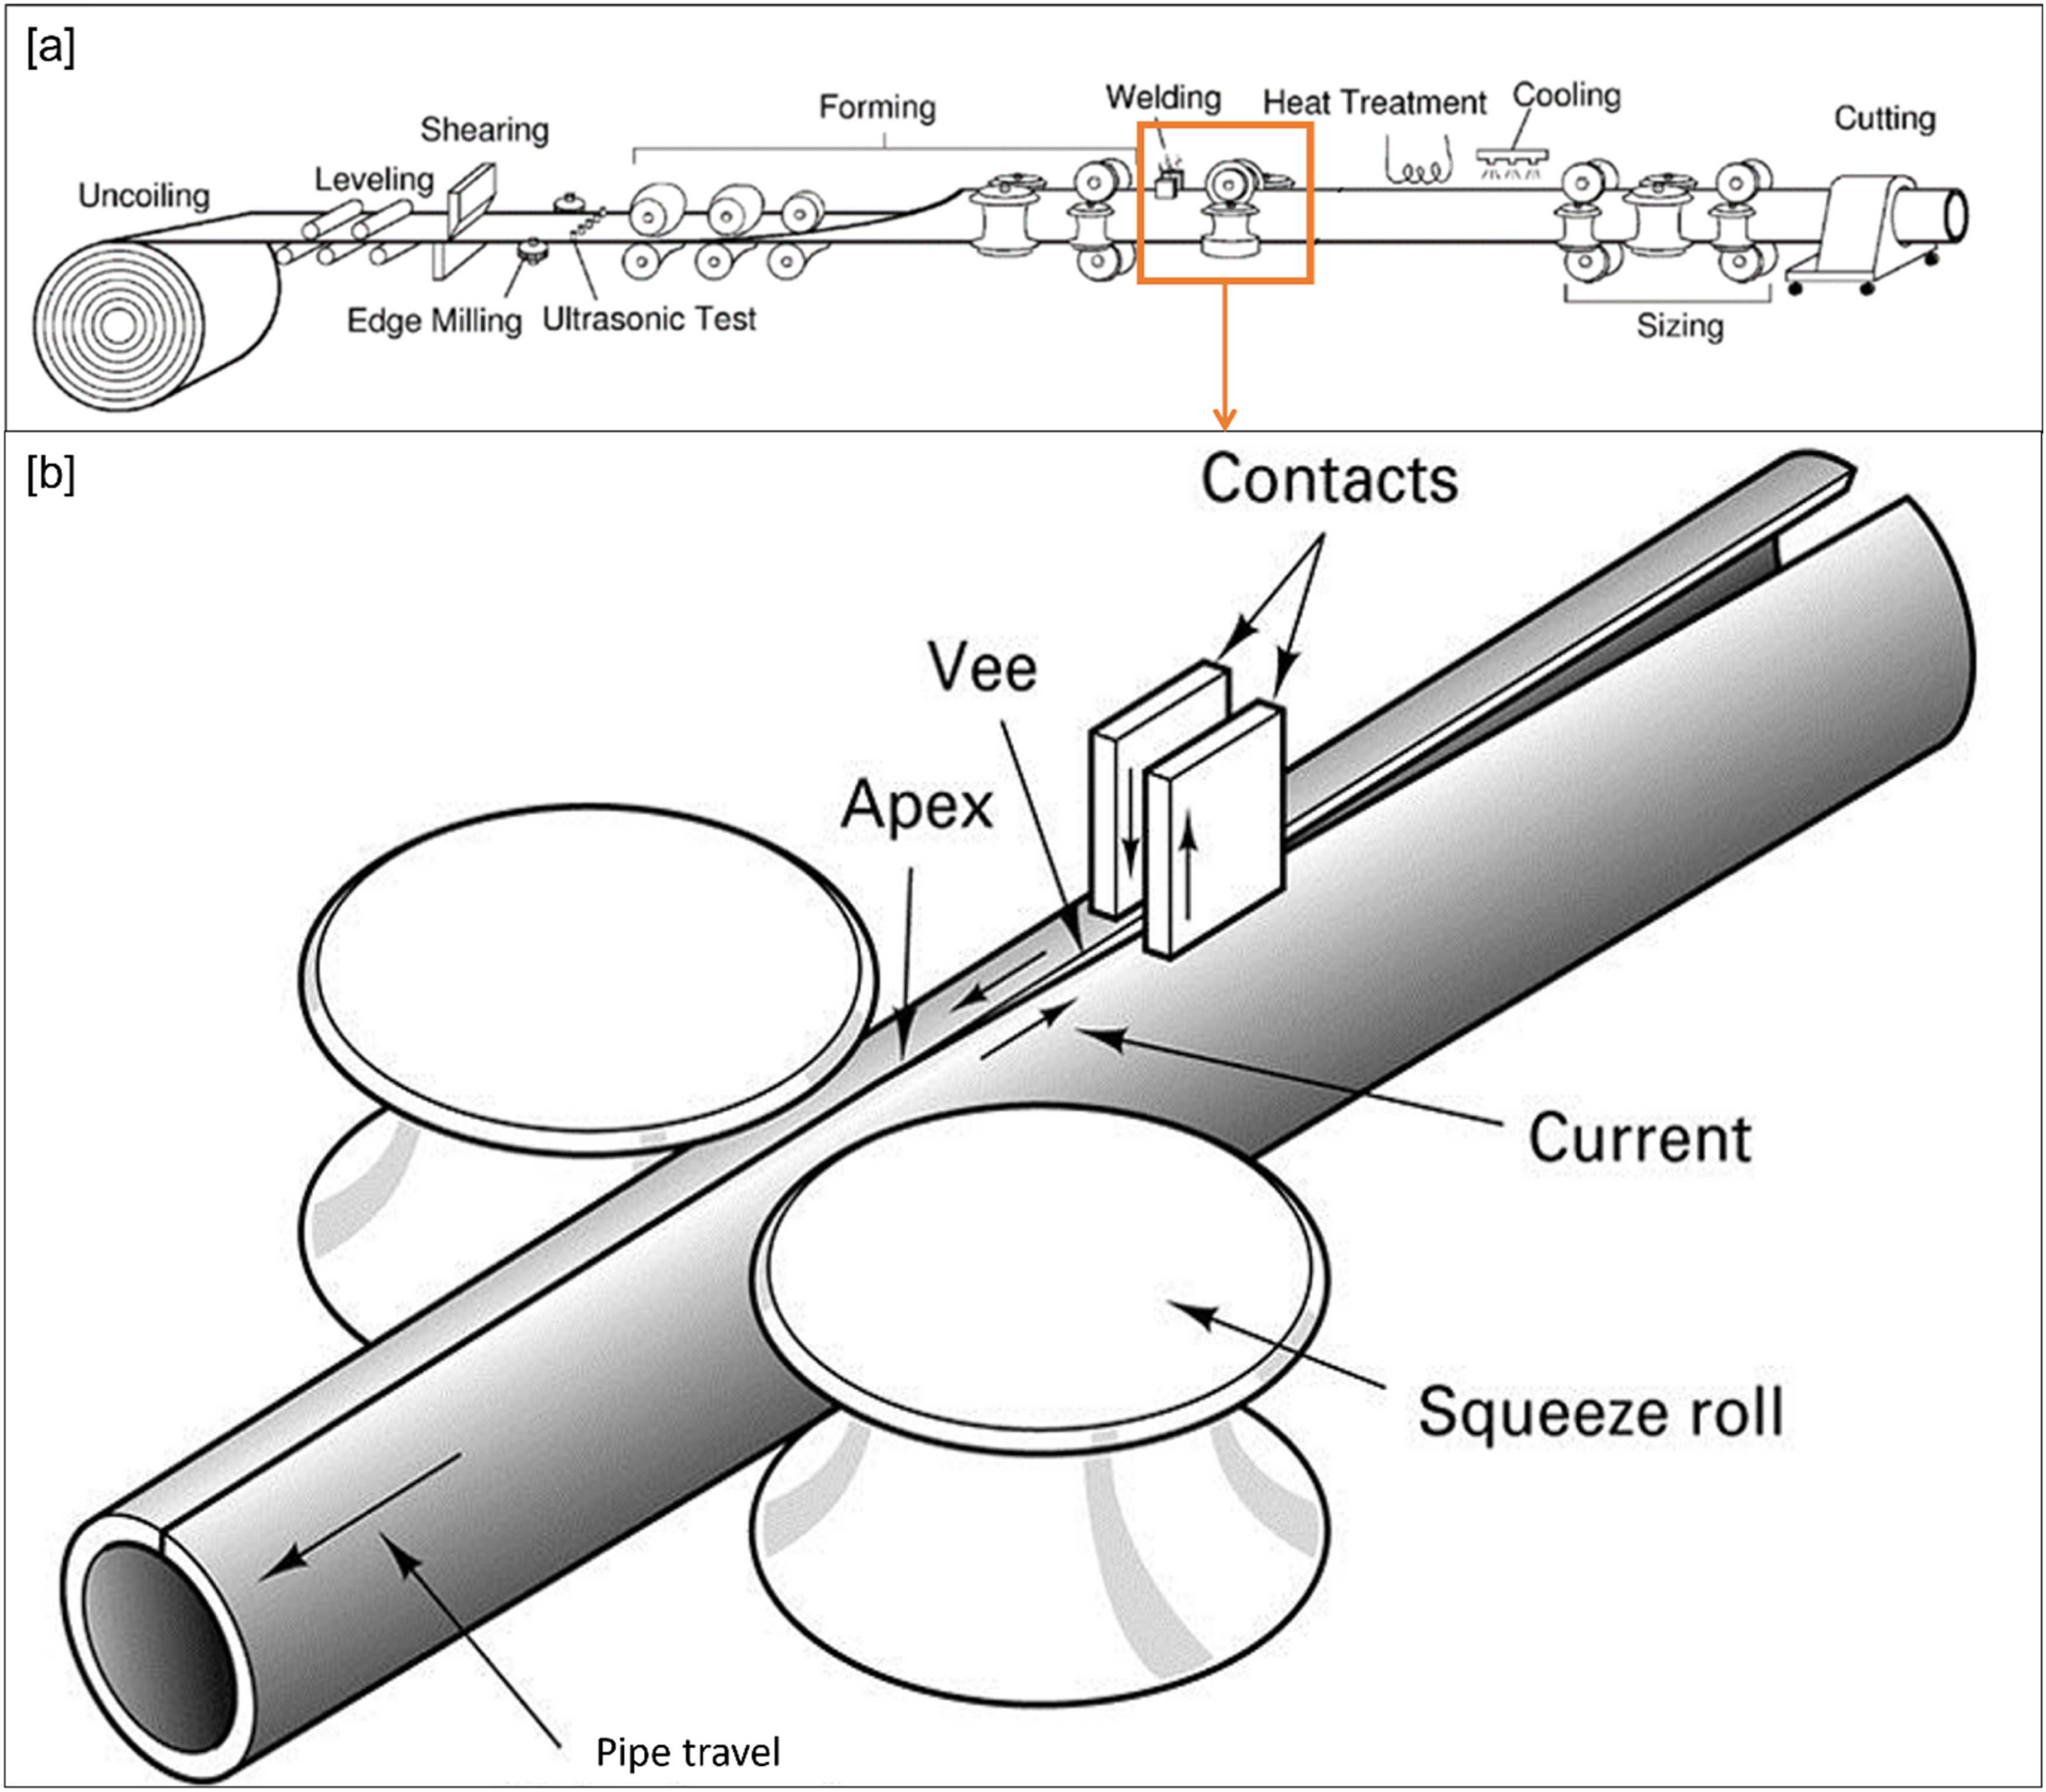
High-frequency electric resistance welding (HF-ERW) is used to manufacture longitudinal seam-welded steel line pipes with diameters less than 24 inches. These linepipes are used for the long-distance transportation of oil and natural gas products (Figure 1(a)). 1 In HF-ERW, heat is generated through the resistance to the flow of applied electric current (Figure 1(b)). Subsequently, the steel edges are pressed together to form a solid-state weld interface, eliminating any melted material.1–3 Following HF-ERW, the weld joint is water-quenched, and the flash is removed from the pipe surfaces. 2 It has been well documented that the as-welded joints usually possess poor Charpy V-notch (CVN) impact toughness.3–6 Therefore, post-weld heat treatment (PWHT) is required.3,7–11 During the PWHT, the weld interface and the heat-affected zone (HAZ) are heated to above Ac3 temperature followed by air cooling (normalizing). 12 This is usually performed at an induction heating stage immediately following flash removal.
Even after PWHT, the CVN impact toughness of HF-ERW linepipe steel welds is consistently lower than that of the base metal.12,14,15 Yan et al. 5 observed that, after PWHT, CVN impact toughness for HF-ERW API X65 steel fell below the acceptance limit, when the V-notch is at the weld interface. Similarly, Anderson et al. 15 found that CVN tests did not meet the target minimum criteria at temperatures at −45 °C. Although it was suggested that crystallographic texture significantly influences CVN impact toughness in HF-ERW linepipes, this relationship remains unclear.3,9,11,14 X65 base metal has a prominent (113)[110], (112)[110], and (332)[113] texture components.3,11,16 A high intensity of {112} and {113} planes may benefit the impact toughness, as the close-packed planes may promote slip deformation. Various, sometimes conflicting texture components in the weld interface were reported following the PWHT.9,11,12,16,17 Anijdan et al. 16 reported high intensities of S-{123}<624> and Brass-{011}<211> weak intensities of Copper-{112}<111> and Cube-{001}<100> components. Xu et al. 17 observed comparable findings in API X65 linepipe steel, in which the as-welded texture was partly recovered after the first stage of PWHT and fully recovered after a two-stage PWHT.11,16 In another study, Yan et al.2,5 observed that after HF-ERW, the weld interface contained a strong Cube texture and argued that PWHT reduced the intensity of the as-welded texture but did not completely alter it. Nevertheless, the mechanism behind the formation of {100} planes at the weld interface and the changes during PWHT remain unclear. Although the CVN impact toughness was above the acceptance limit of the standards, a significant difference (275 J, 5 J, and 27 J for base, as-weld, and PWHT conditions, respectively) can be observed. Zhang et al. 9 reported that the as-welded texture was significantly altered after normalization, whereas the quench-and-temper PWHT partly altered the as-welded texture. Although it was suggested that normalization reduced the intensity of unfavorable {100} planes, variations in texture components due to different thermal cycles were not correlated. Although the effect of crystallographic texture on the CVN impact toughness of HF-ERW linepipe is frequently mentioned in the literature, it has not been thoroughly investigated.3,9,11,12,16–18 This might be due to the practical limitation that most studies could only access the samples in the PWHT condition. In addition, although reported CVN toughness after PWHT often exceeds the qualification limits set by linepipe standards such as API, CSA, and DNV,12,19 significant difference in toughness compared to the base metal requires further clarification.
This study systematically investigates the crystallographic texture evolution from the base metal, to the as-welded, and to the PWHT-ed API X65 linepipe steel. The results will provide insights into optimizing PWHT cycles to mitigate unfavorable textures at the weld interface and enhance toughness in HF-ERW linepipe steels.
Materials and experimental methods
Materials
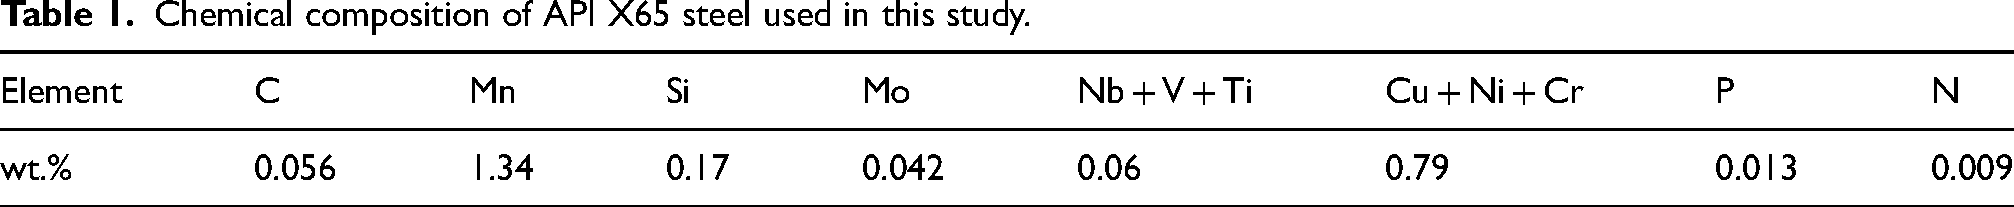
API X65 line pipe steel coils, produced using thermomechanically controlled processing (TMCP), were used as the base metal with a wall thickness of 7.9 mm. The nominal composition (wt.%) is listed in Table 1.
Chemical composition of API X65 steel used in this study.
Experimental methods
HF-ERW and PWHT
TMCP API X65 steel coils were progressively cold-formed into a pipe with an outer diameter of 406 mm at a commercial linepipe mill. For HF-ERW, the frequency was 200 kHz and the power was 250 kW. Following welding, induction normalization PWHT was carried out by passing the as-welded HF-ERW linepipe through an induction furnace. The peak temperature during PWHT was between 950–1100 °C. After austenitization, the weld joint was air-cooled to approximately 400 °C and then water-quenched to room temperature.
Microstructure and texture characterization
Specimens from the as-welded and post-weld heat-treated weld interface were mounted, ground, and polished using standard metallographic techniques. Silicon carbide (SiC) grinding papers with grit sizes of #80, #180, #360, #600, and #1200 were used. Diamond suspensions of 3 μm, 1 μm, and 0.5 μm were used to polish for a mirror finish. The polished samples were etched with Nital (a mixture of alcohol and HNO₃) to reveal the microstructural constituents. Microstructure was observed using an optical microscope (OM, Zeiss Axioscope) and a field emission scanning electron microscope (FESEM, Zeiss Sigma FESEM). Electron-backscattered diffraction (EBSD) was conducted on a Zeiss Sigma FESEM equipped with an EDAX backscattered electron detector and the APEX™ software package for data acquisition. The specimens were metallographically polished down to 0.25 µm, with final polishing with a 0.05 µm colloidal silica suspension for nearly one hour. EBSD was performed on the as-polished specimens, with data acquired at an acceleration voltage of 20 kV, a tilt angle of 70°, an objective aperture of 60 µm, and a step size ranging from 0.1 to 0.4 µm. Acquired EBSD data was post-processed using the open-source MTEX data analysis software in MATLAB. Inverse pole figure (IPF) maps of rolling direction (RD), orientation distribution functions (ODFs) section at φ2 = 45°, high angle and low angle grain boundaries (HAGBs and LAGBs), and grain orientation spread (GOS) maps were generated to analyze various microstructural characteristics and crystallographic texture. 20 However, for brevity, only GOS and ODFs were shown here. ODF maps were used to describe the statistical distribution of crystallographic orientations. A GOS map was a visual representation of the local orientation spread within a polycrystalline sample. In GOS maps (only grains with orientation less than 2° were shown), a shape factor of less than two was used to obtain the fraction of recrystallized grains. A condition of misorientation exceeding 10° was used for identifying individual grains during grain size analysis. Parent austenite grains were reconstructed using the algorithm proposed by Huang et al. 21 Equilibrium phase fractions, critical temperatures (Ae1 and Ae3), and precipitate dissolution temperatures for API X65 linepipe steel in the current study were estimated using Thermo-Calc software and the database TCFE10. 22
Mechanical properties
Microhardness was evaluated using a Vickers microhardness tester across the cross section, on the ND-TD plane following ASTM E384 standard. 23 Vickers microhardness was performed using an indentation load of 50 gf for a dwell time of 10 s. The indents were placed with a measurement grid with 60 µm in the horizontal direction (TD) and 100 µm in the vertical direction (ND).
CVN impact testing was performed in accordance with API 5L, ASTM A370, and ASTM E23 standards at −45 °C for the base metal, as-welded, and post-weld heat-treated weld interface samples. For the HF-ERW line pipes, according to the API 5L line pipe specification, “the axis of the notch shall be located on, or as close as practicable to, the weld line.” Therefore, the as-welded and post-weld heat-treated weld joints were etched to identify the weld interface, and a V-notch was machined at the weld interface.
Results
Macrostructure and regions
The cross section of the HF-ERW weld interface in API X65 steel is shown in Figure 2(a) and (b) for the as-welded and PWHT conditions, respectively. The outer diameter (OD) of the pipe is at the top, and the inner diameter (ID) is at the bottom (inset of Figure 2(a) and (b)). In the as-welded condition, the microstructure across the weld joint is heterogeneous and comprises the weld interface, coarse-grained heat-affected zone (CGHAZ), fine-grained heat-affected zone (FGHAZ), thermomechanically affected zone (TMAZ), and the base metal. After PWHT, the microstructure across the weld joint is more uniform with equiaxed grains compared with the as-welded joint. A faint hourglass shape with flowlines can still be observed under extensive Nital etching (Figure 2(b)). The cross section of the post-weld heat-treated weld joint can be divided into three different zones, the weld interface, heat-affected region, and unaffected region.
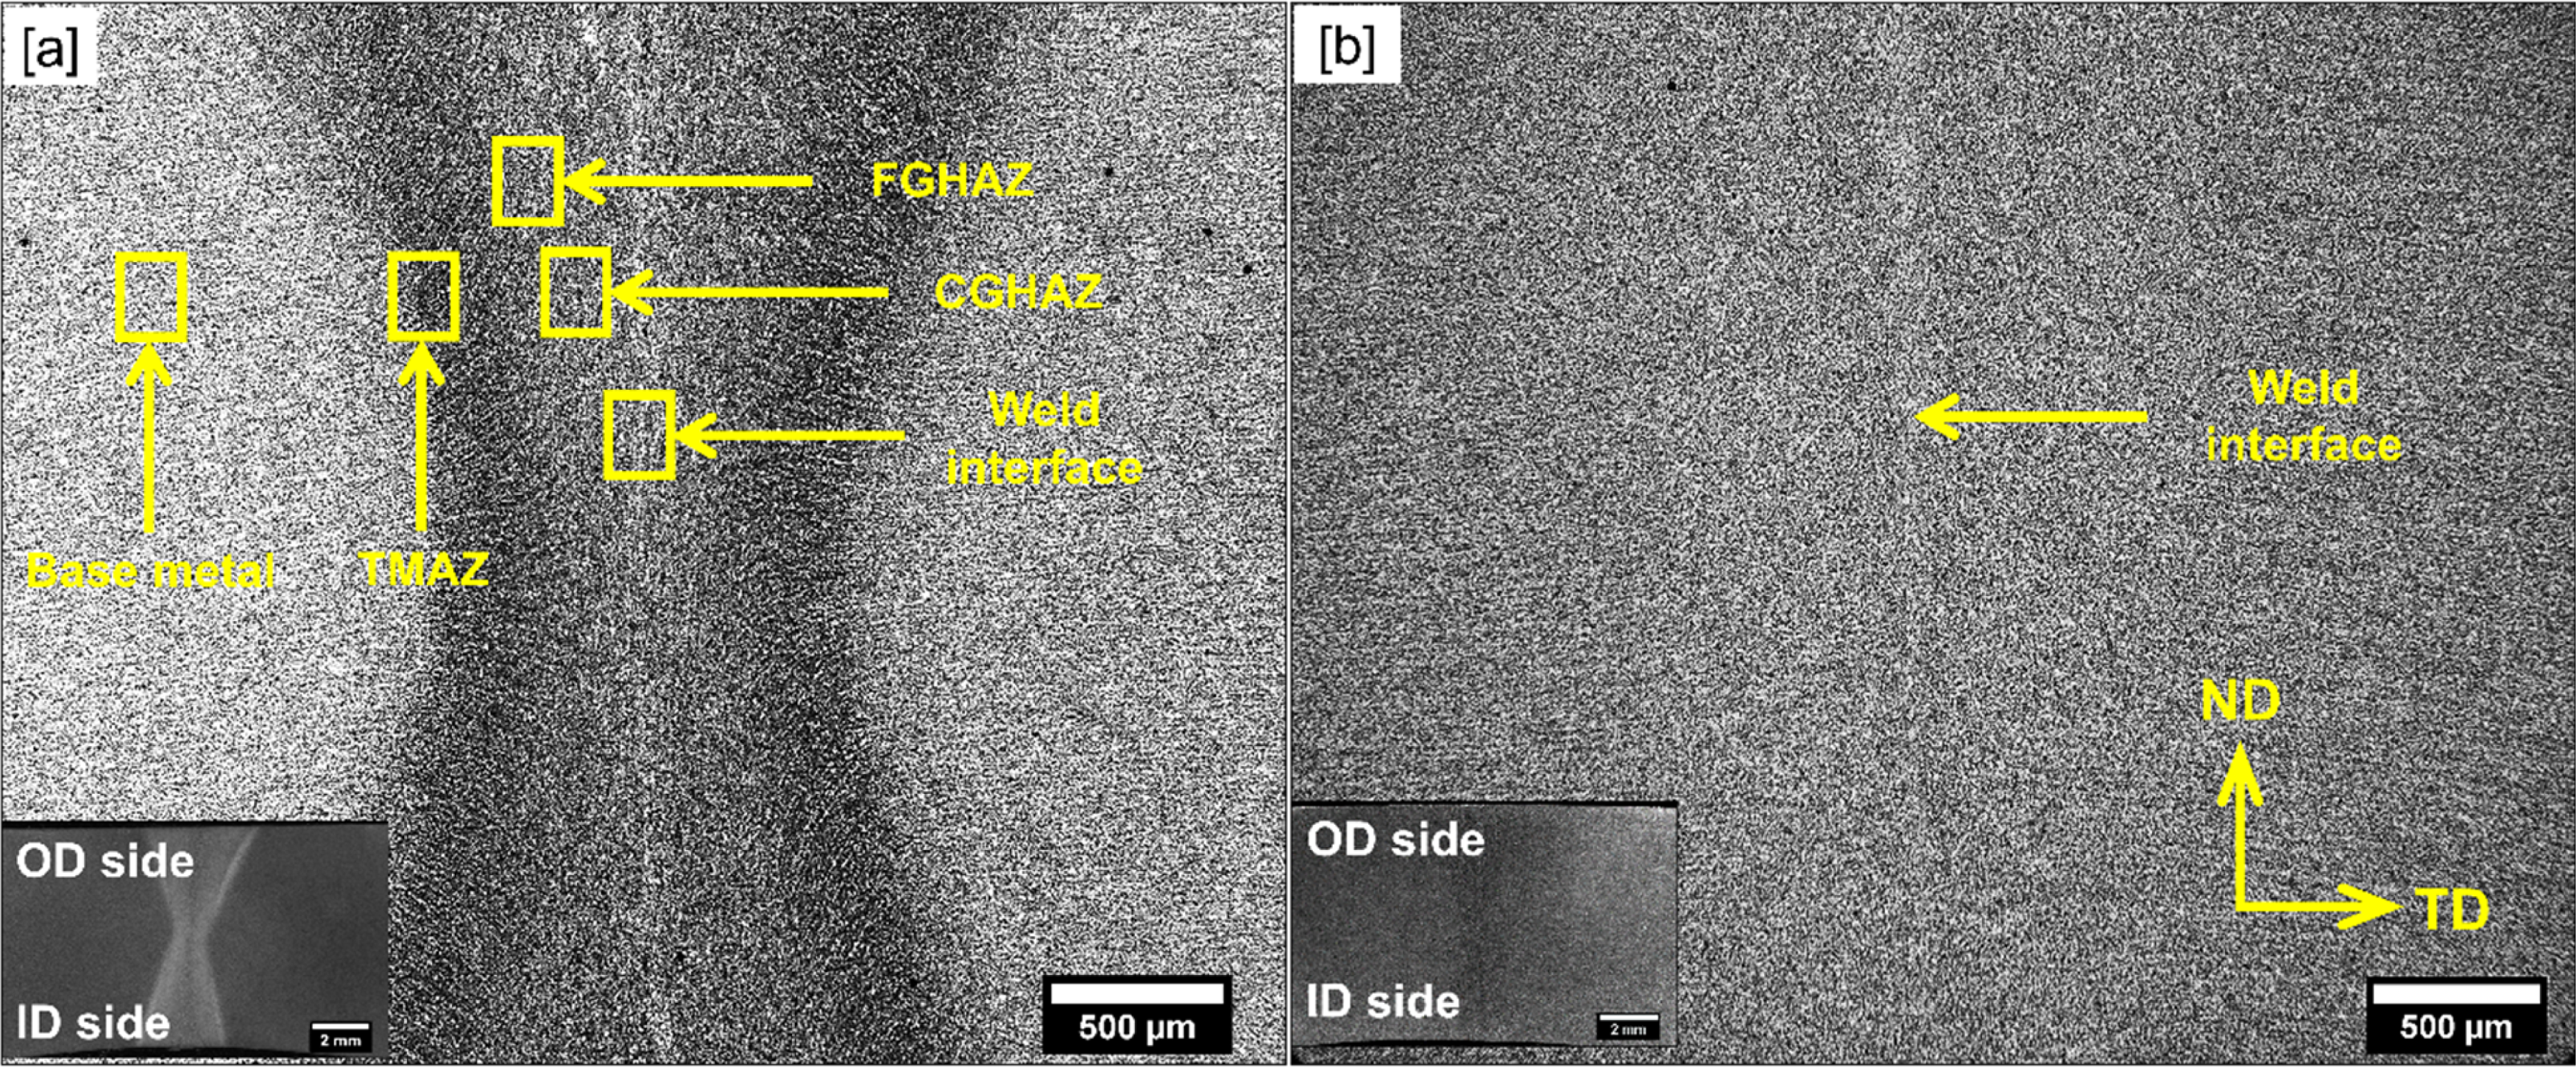
Cross section of HF-ERW X65-grade linepipe steel in (a) the as-welded and (b) the post-weld heat-treated conditions.
Microstructure
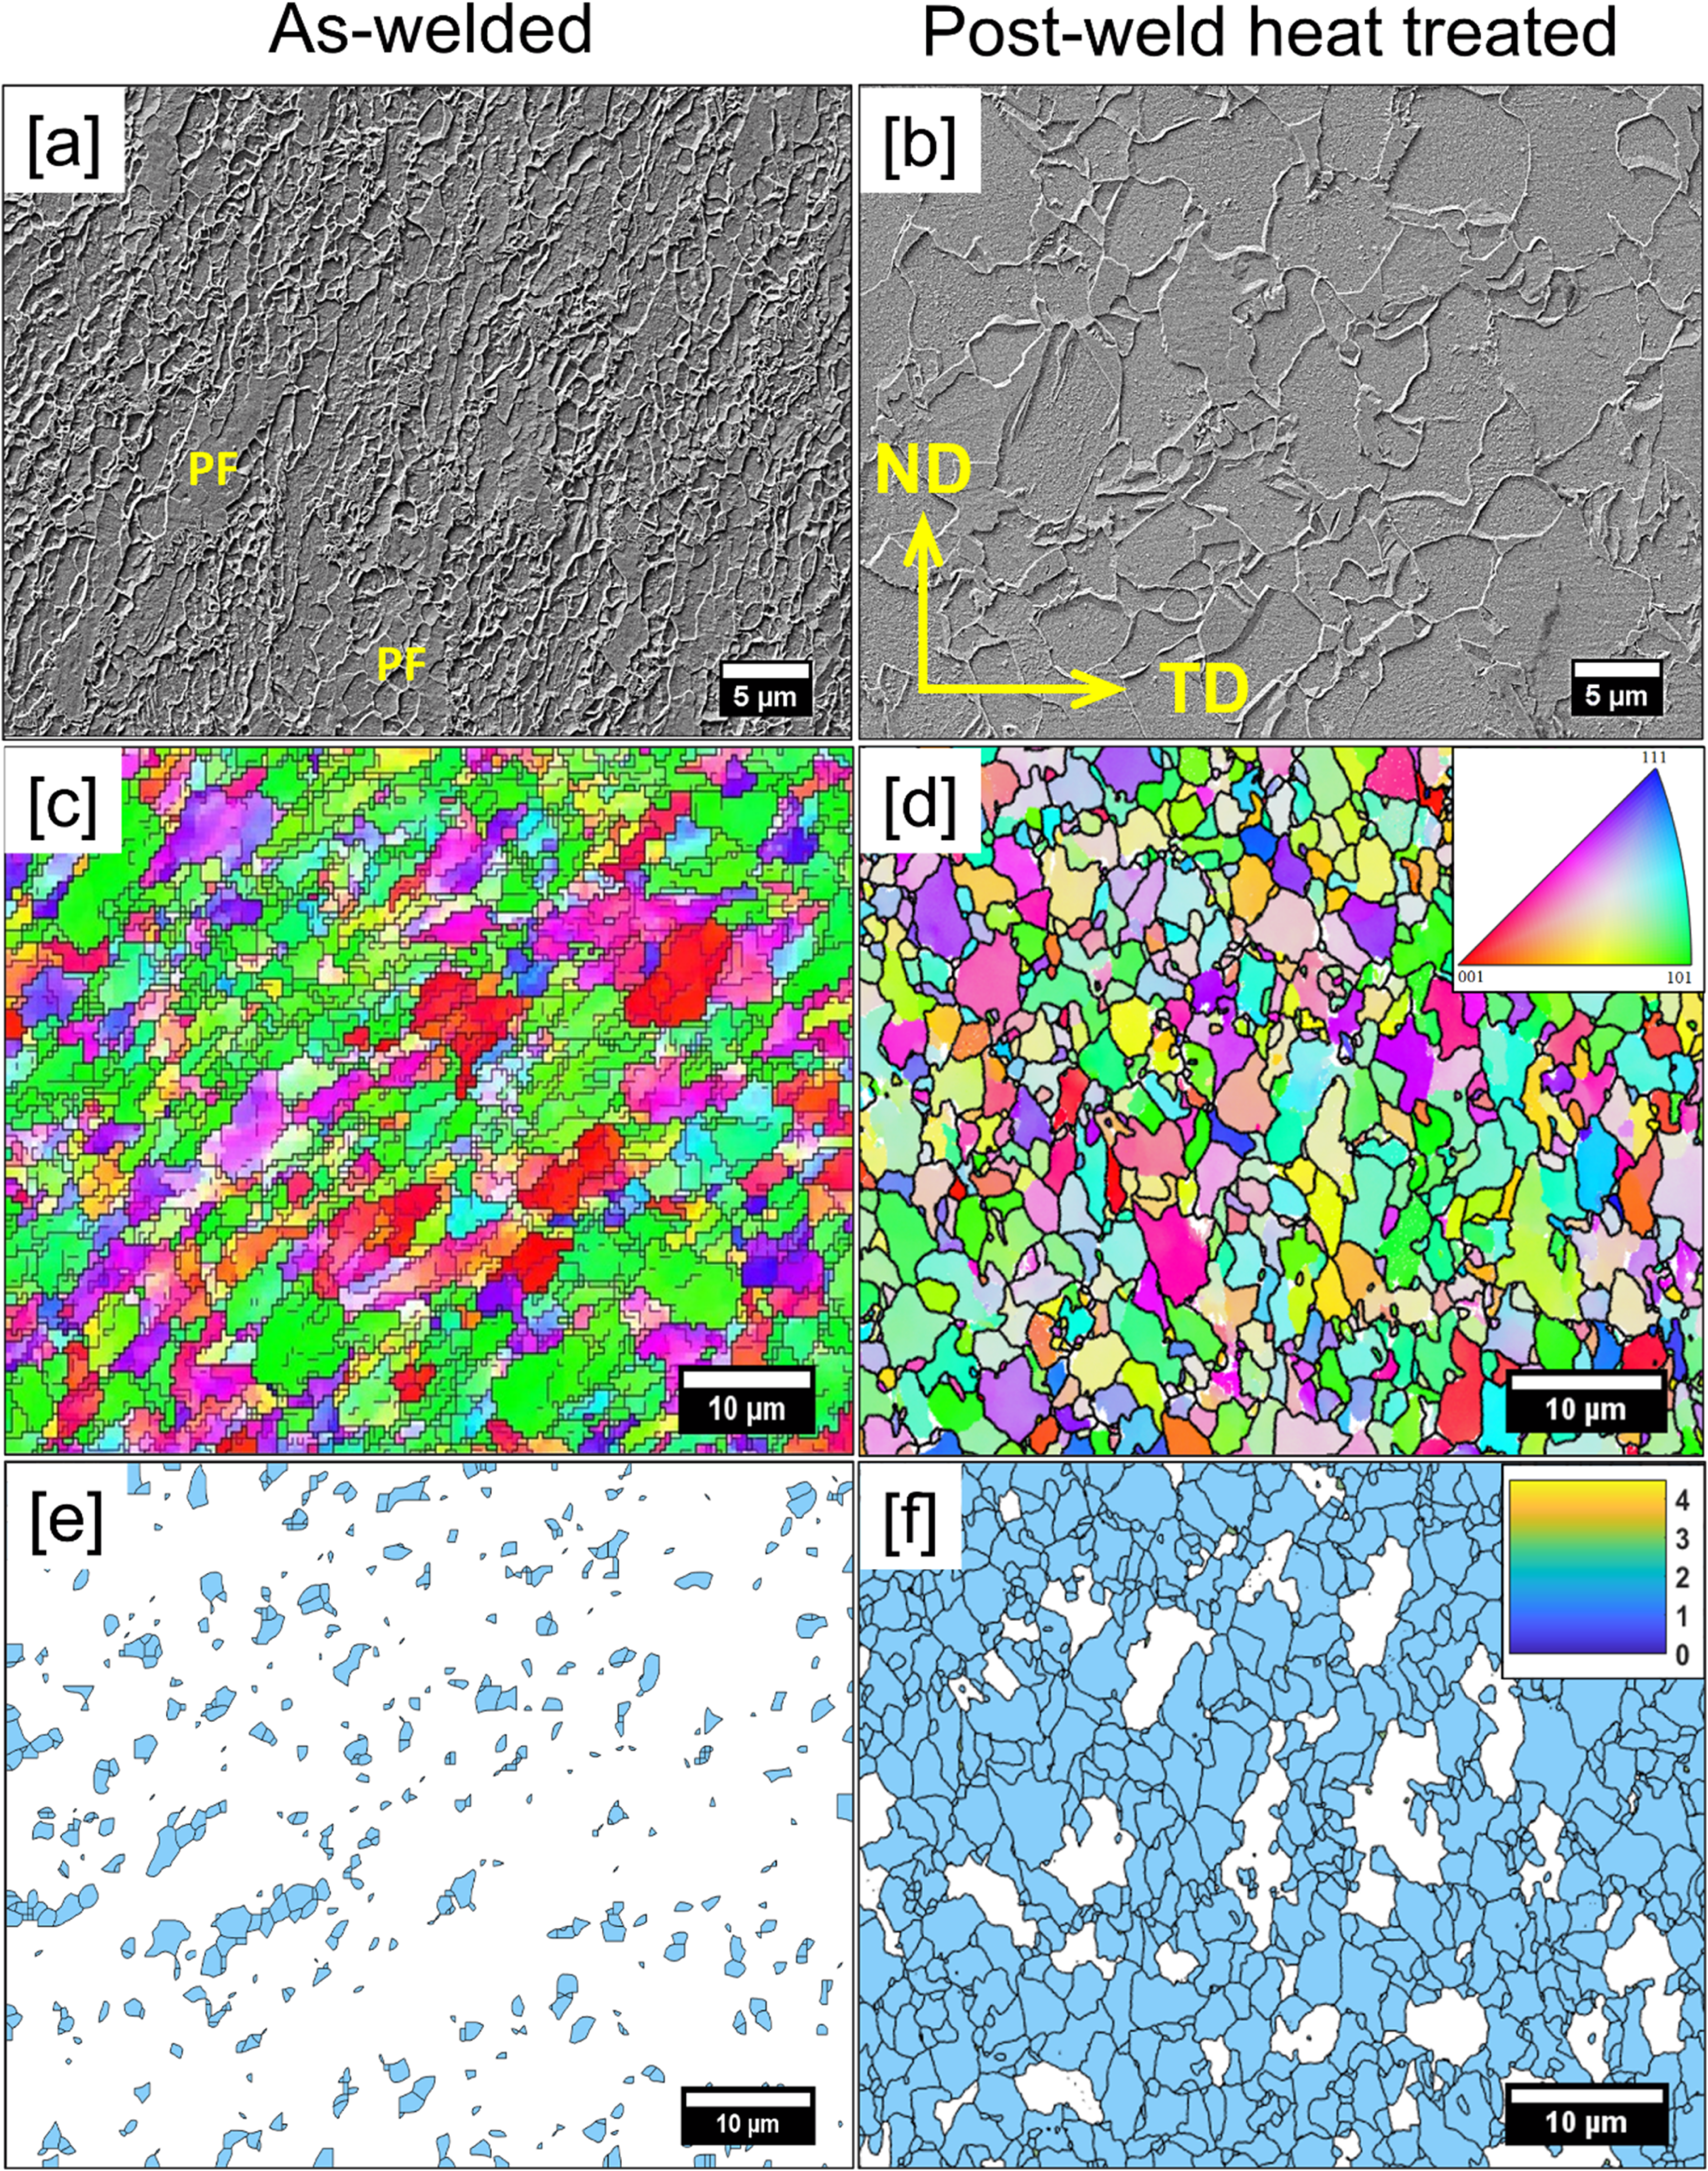
Microstructure and EBSD images depicting IPF maps and GOS maps of different regions in the as-welded and post-weld heat-treated weld joints are shown in Figures 3–7. The EBSD results of various regions in both the as-welded and post-weld heat-treated weld joints are summarized in Table 2. The microstructure of the base metal region in the as-welded condition contains polygonal ferrite (PF) and quasi-polygonal ferrite (QF), shown in Figure 3(a). In the as-welded condition (Figure 3(a)), grains are aligned toward the RD. After the normalization, the microstructure of the base metal region (Figure 3(b)) showed more equiaxed PF. Figure 3(c) and (d) depicts the IPF maps for the as-welded and post-weld heat-treated conditions of the base metal, respectively. In the as-welded condition, the average grain size is 3.3 ± 2.2 μm. The average grain size of the base metal region after PWHT is 4.34 ± 2.43 μm. The as-welded condition depicted a small fraction of recrystallized grains (3%, Figure 3(e)) in the base metal region, whereas the post-weld heat-treated sample showed a higher fraction of recrystallized grains (92%, Figure 3(f)).
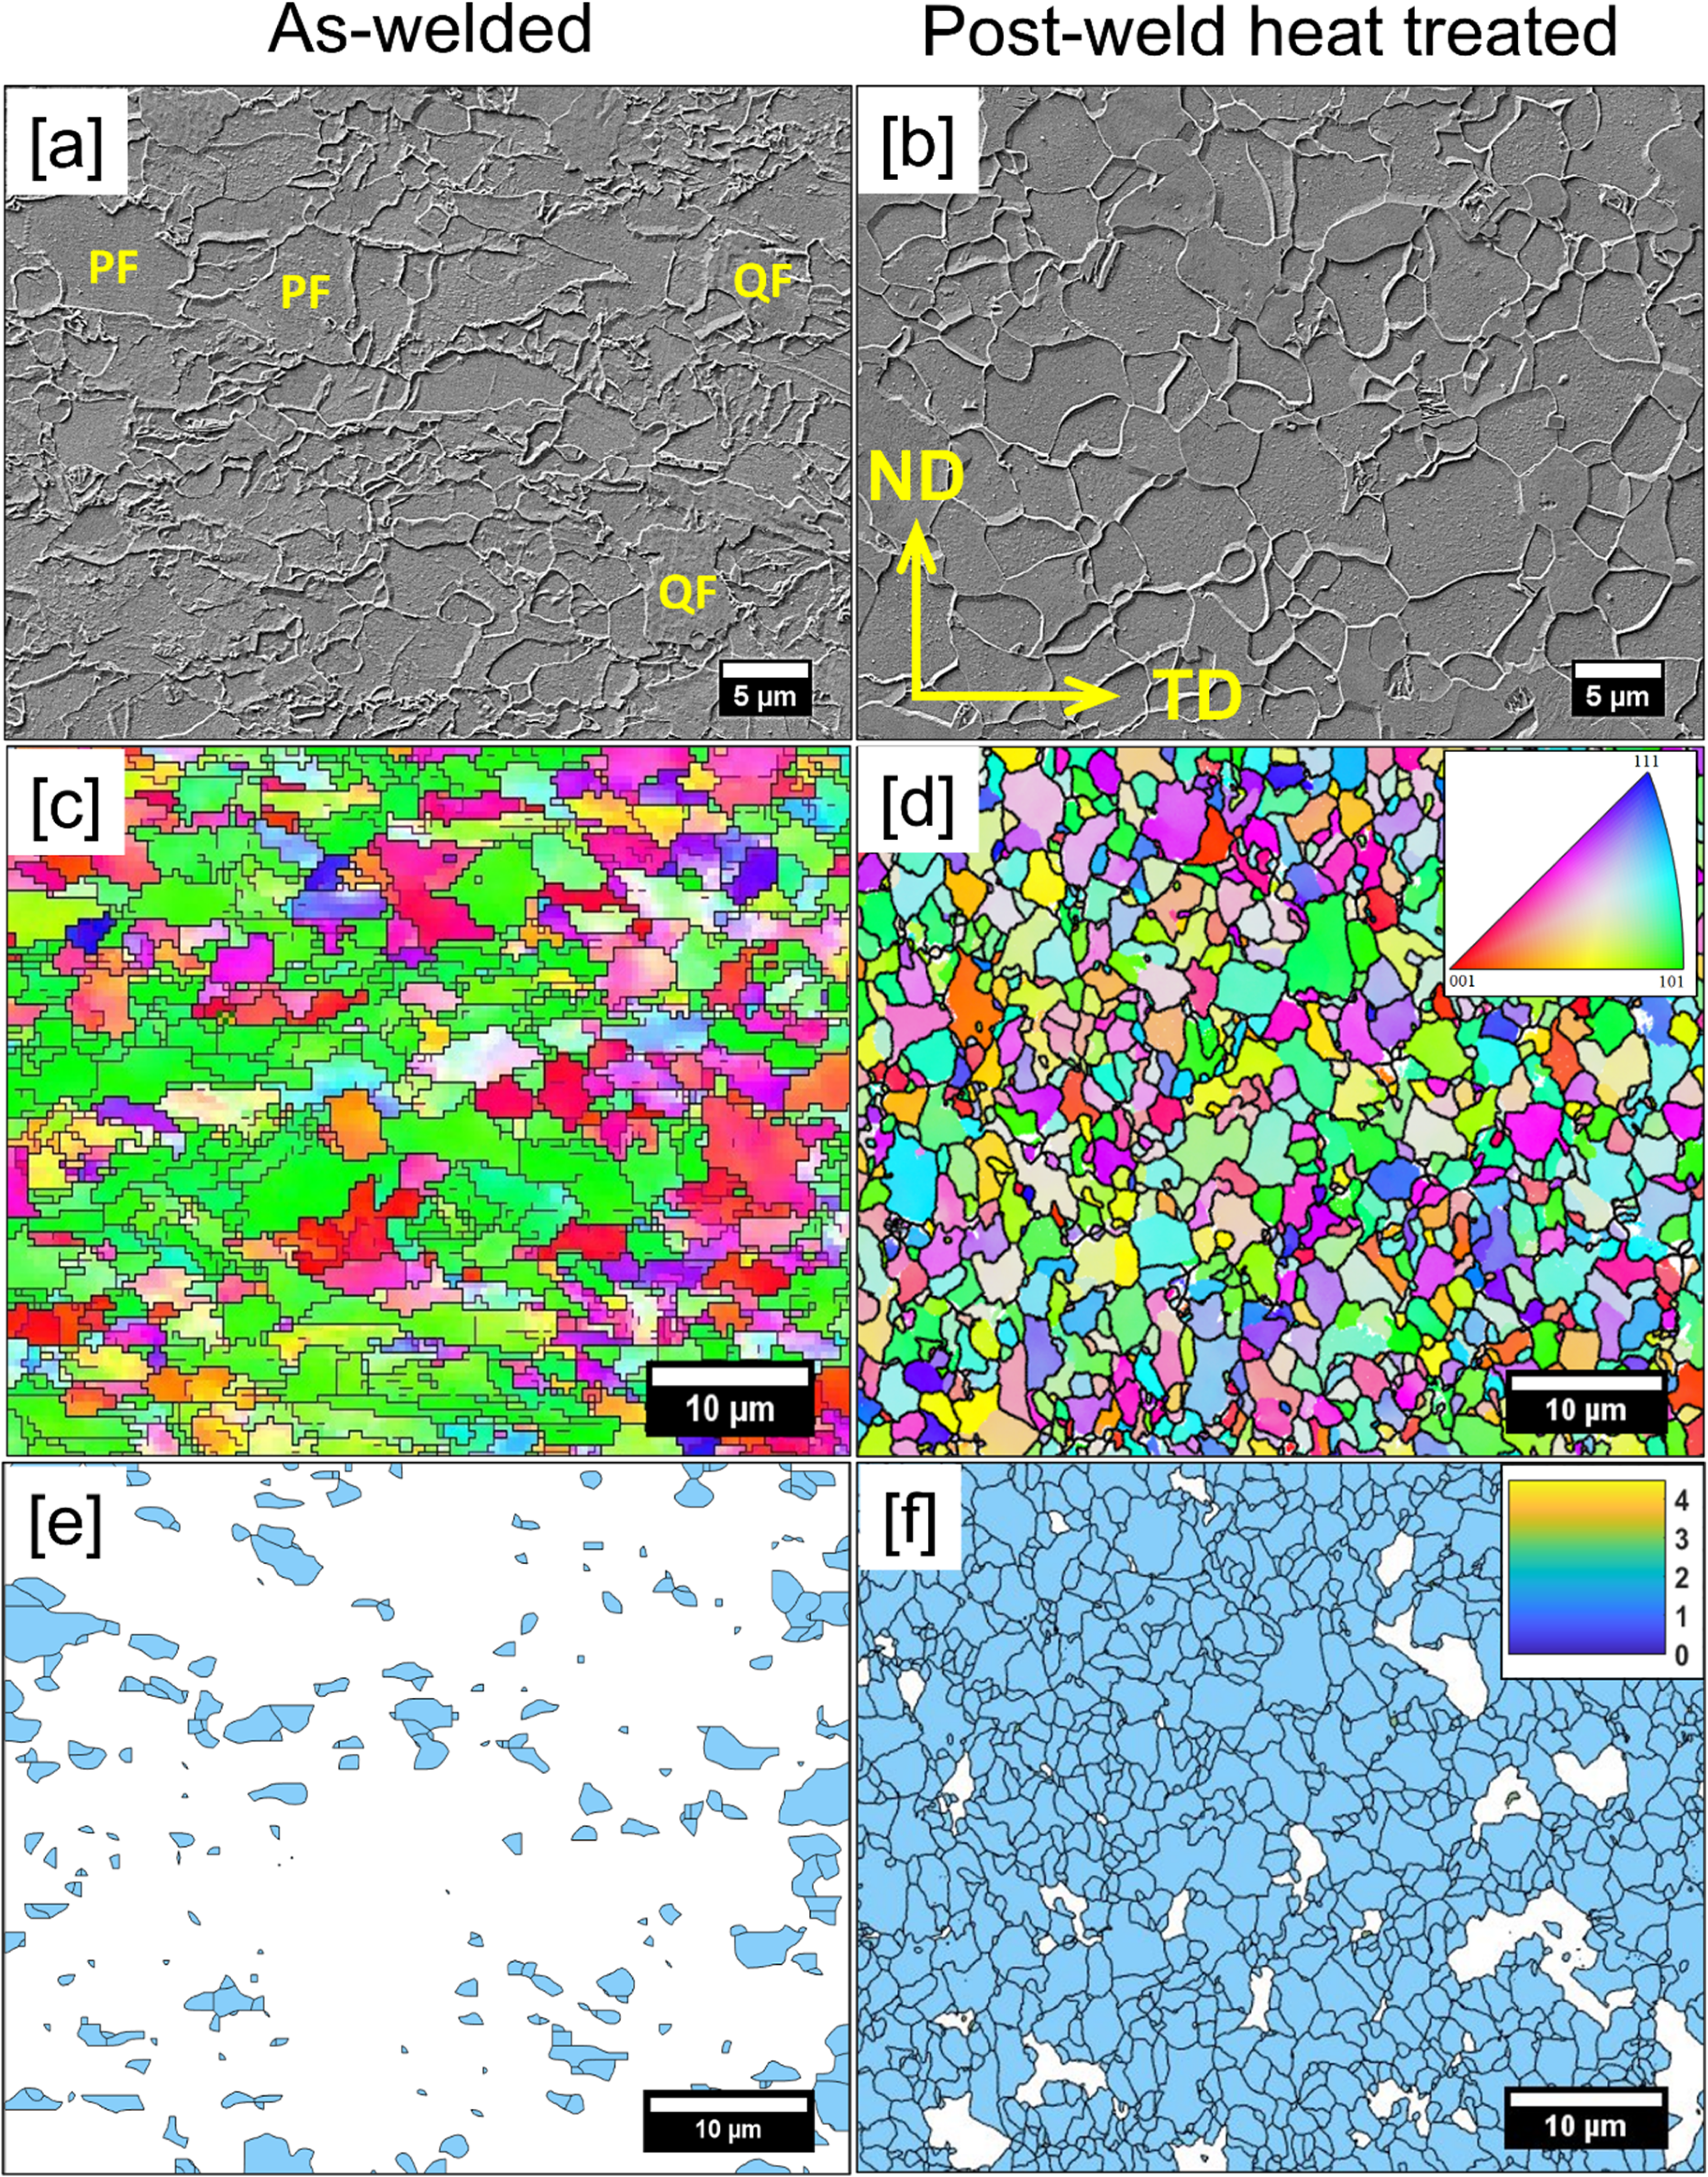
(a)-(b) Microstructure, (c)-(d) IPF, and (e)-(f) GOS maps for the base metal region in the as-welded and post-weld normalized conditions of HF-ERW X65 steel.
(a)-(b) Microstructure, (c)-(d) IPF, and (e)-[f) GOS maps for the thermomechanically affected region in the as-welded and post-weld normalized conditions of HF-ERW X65 steel.
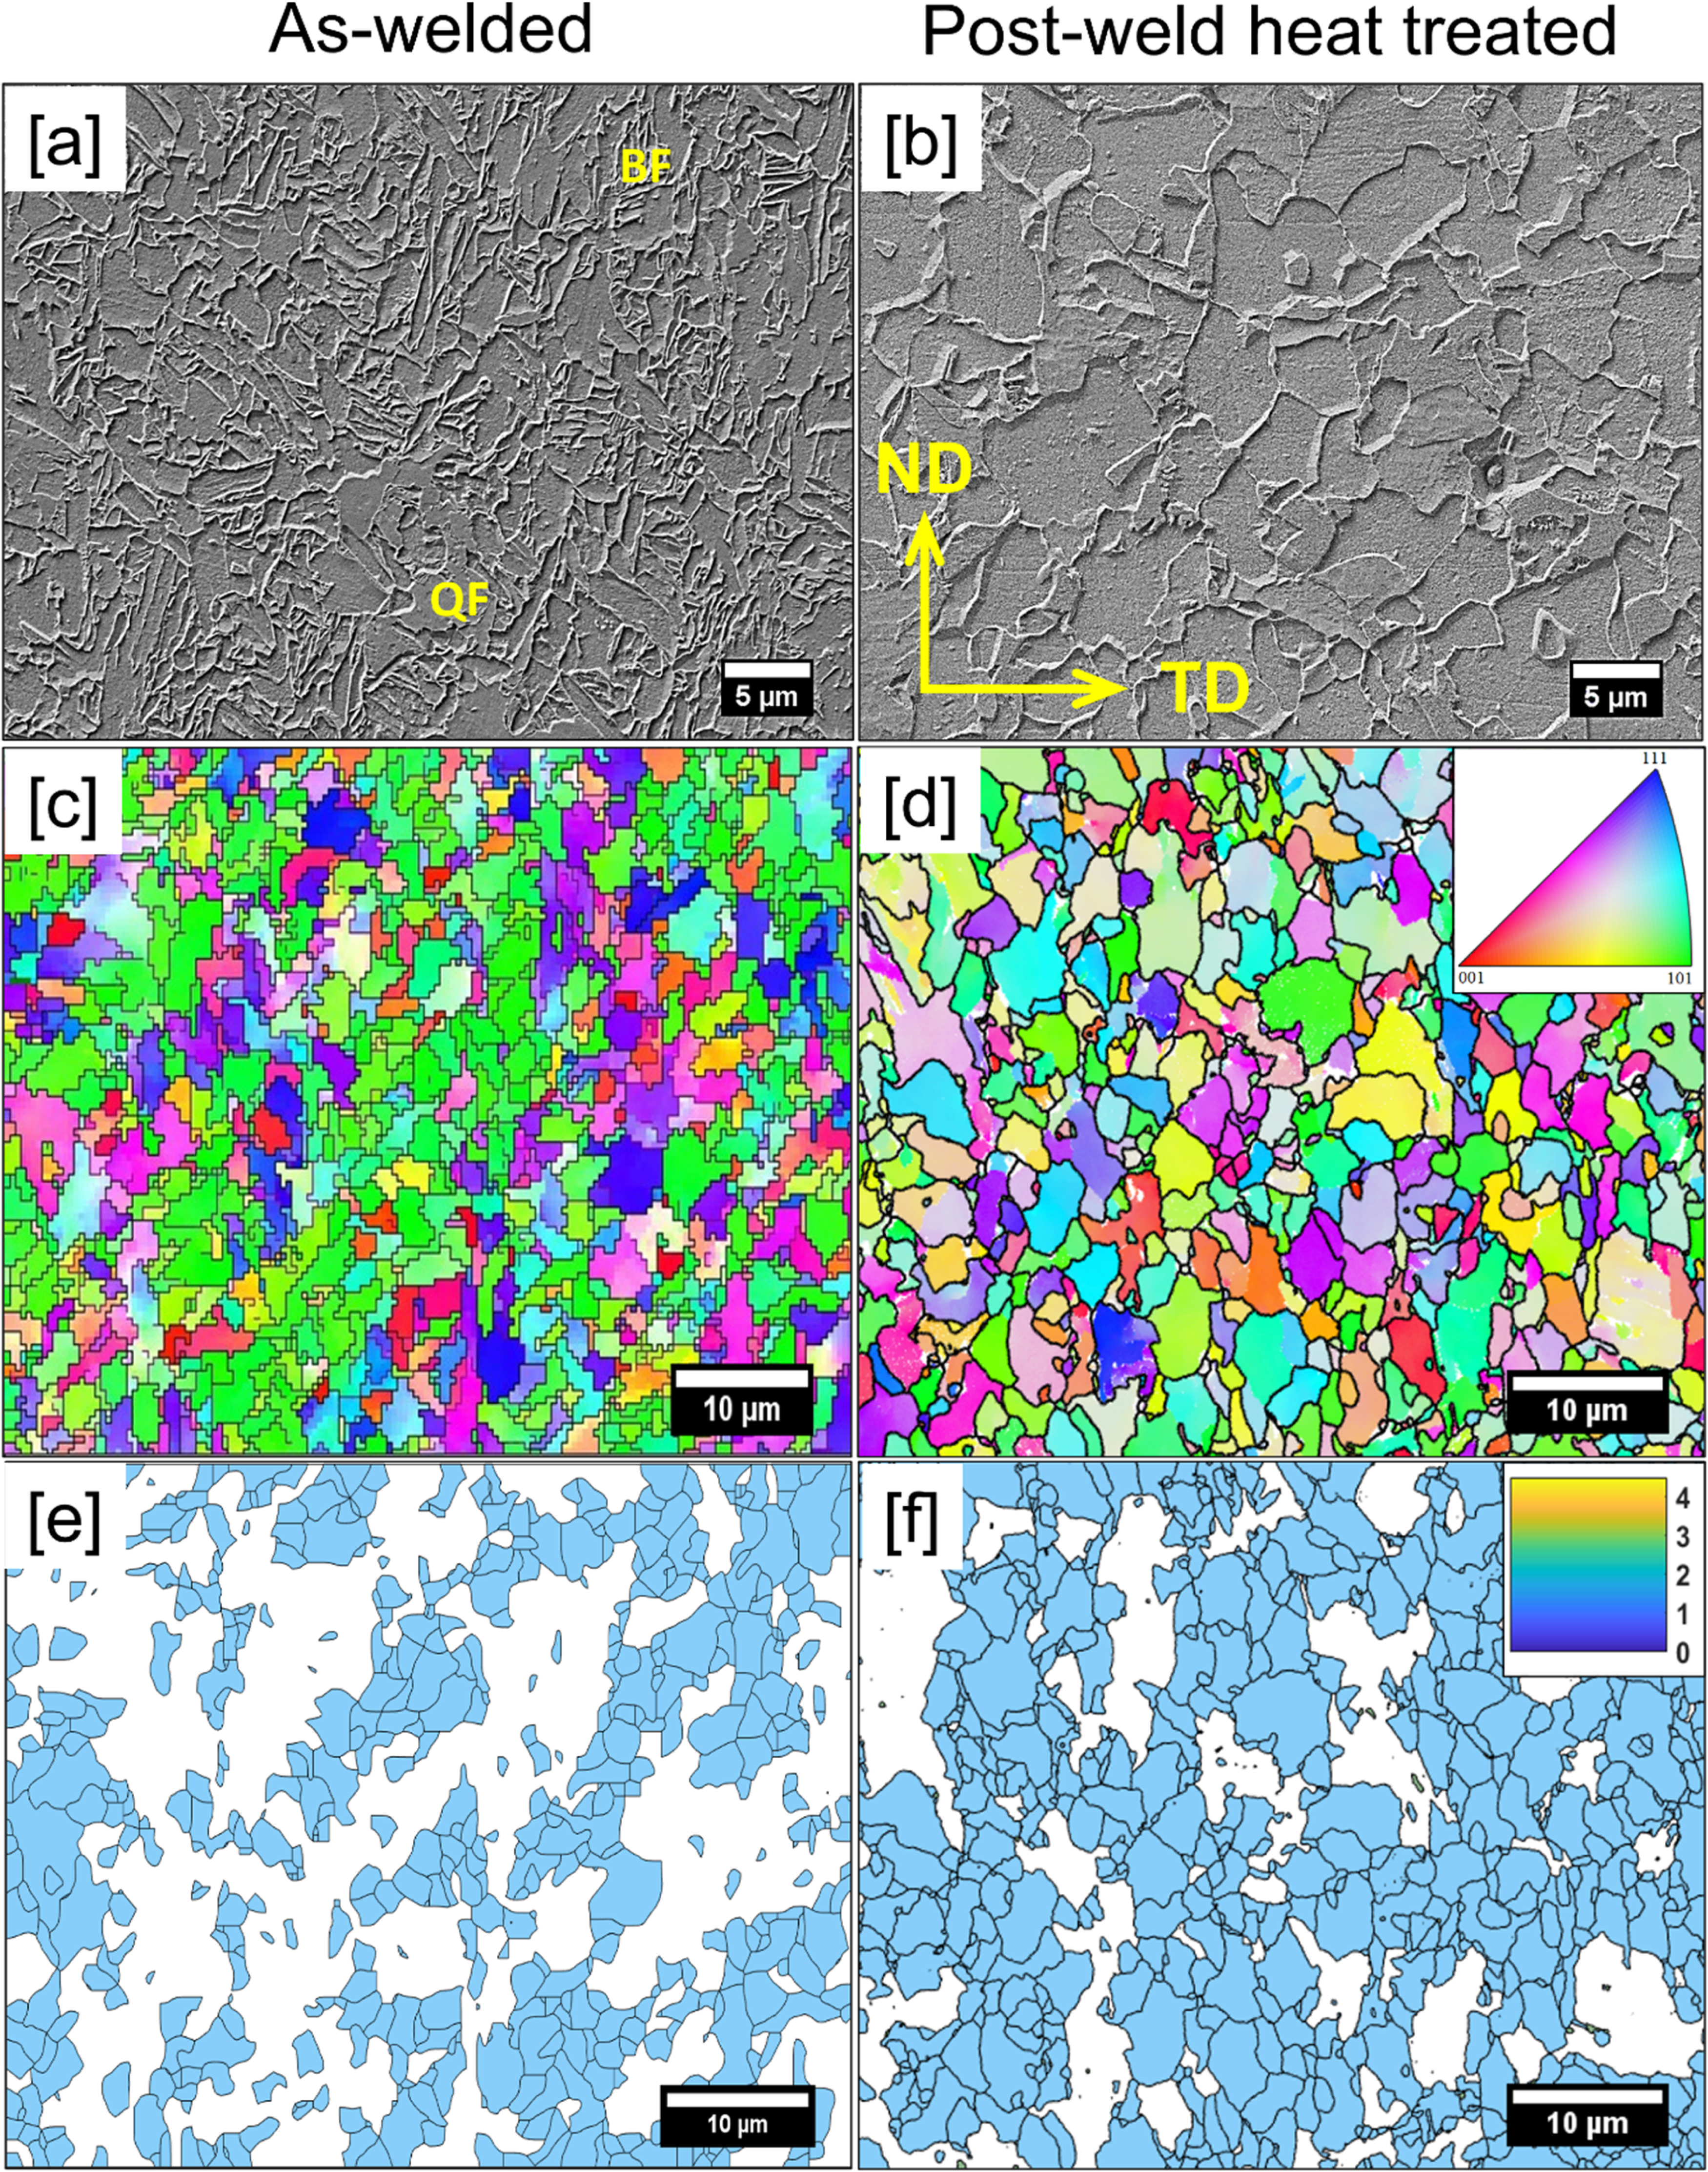
(a)-(b) Microstructure, (c)-(d) IPF, and (e)-(f) GOS maps for the FGHAZ region in the as-welded and post-weld normalized conditions of HF-ERW X65 steel.
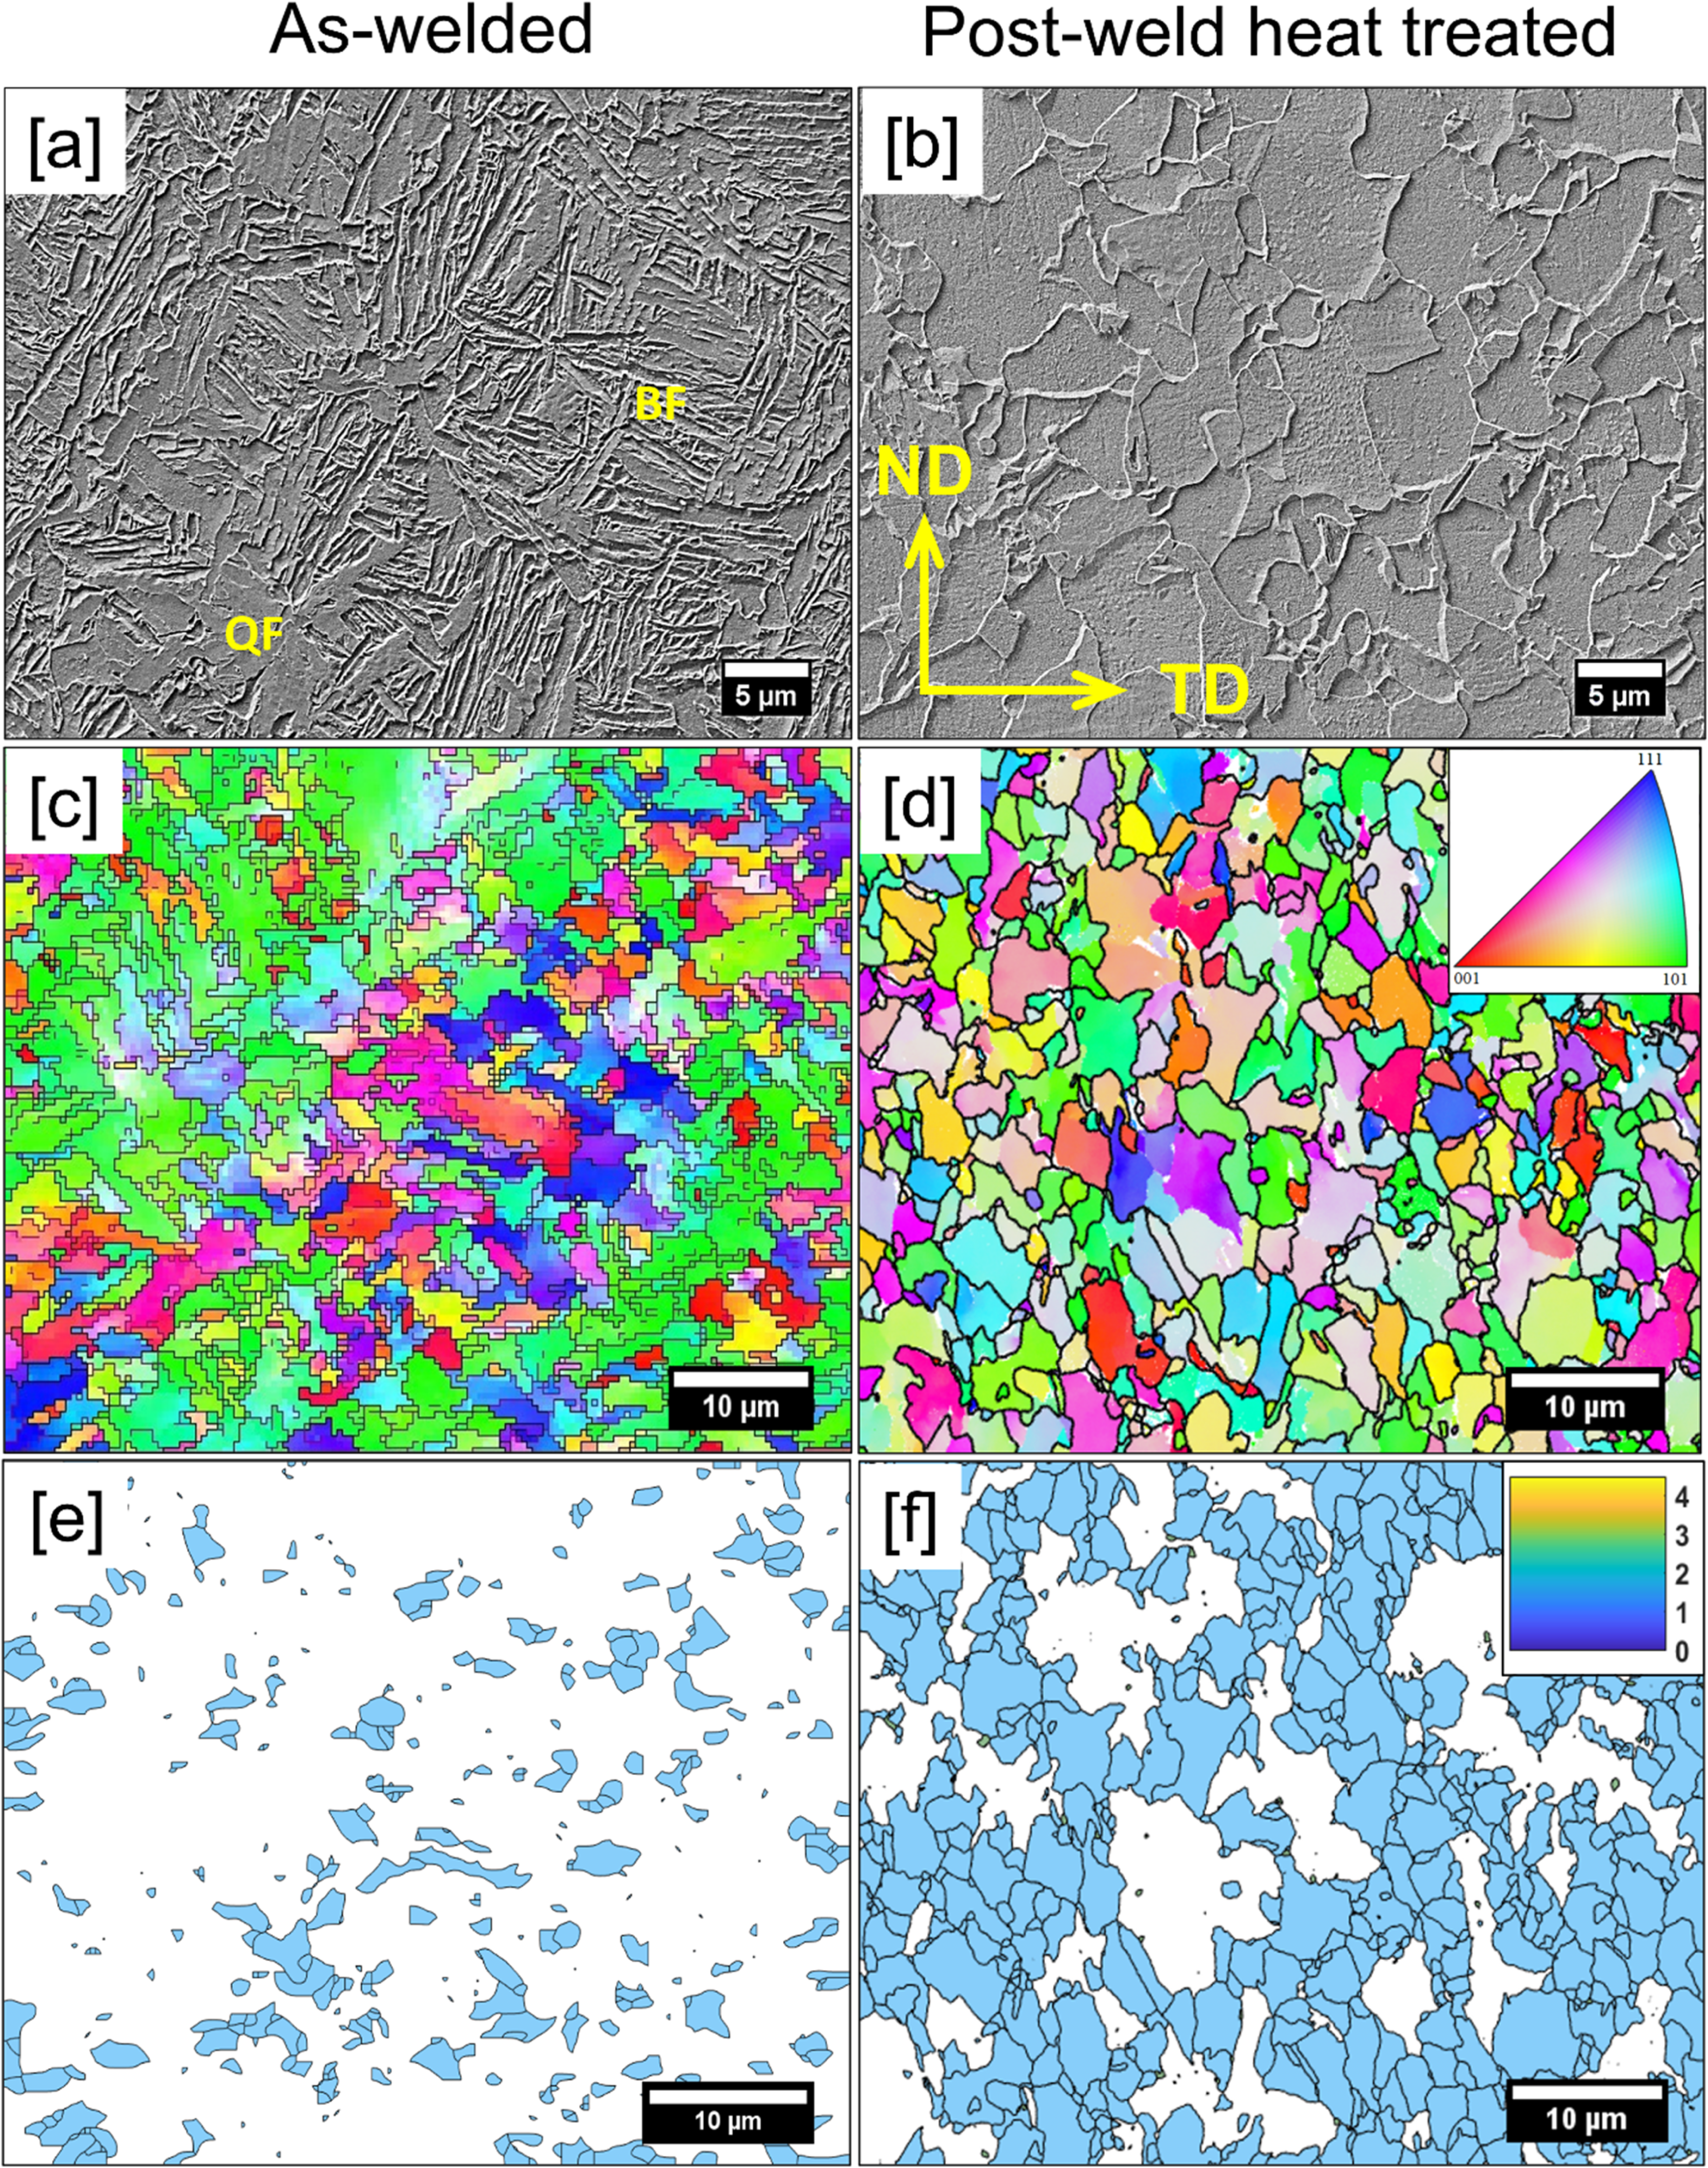
(a)-(b) Microstructure, (c)-(d) IPF, and (e)-(f) GOS maps for the CGHAZ region in the as-welded and post-weld normalized conditions of HF-ERW X65 steel.
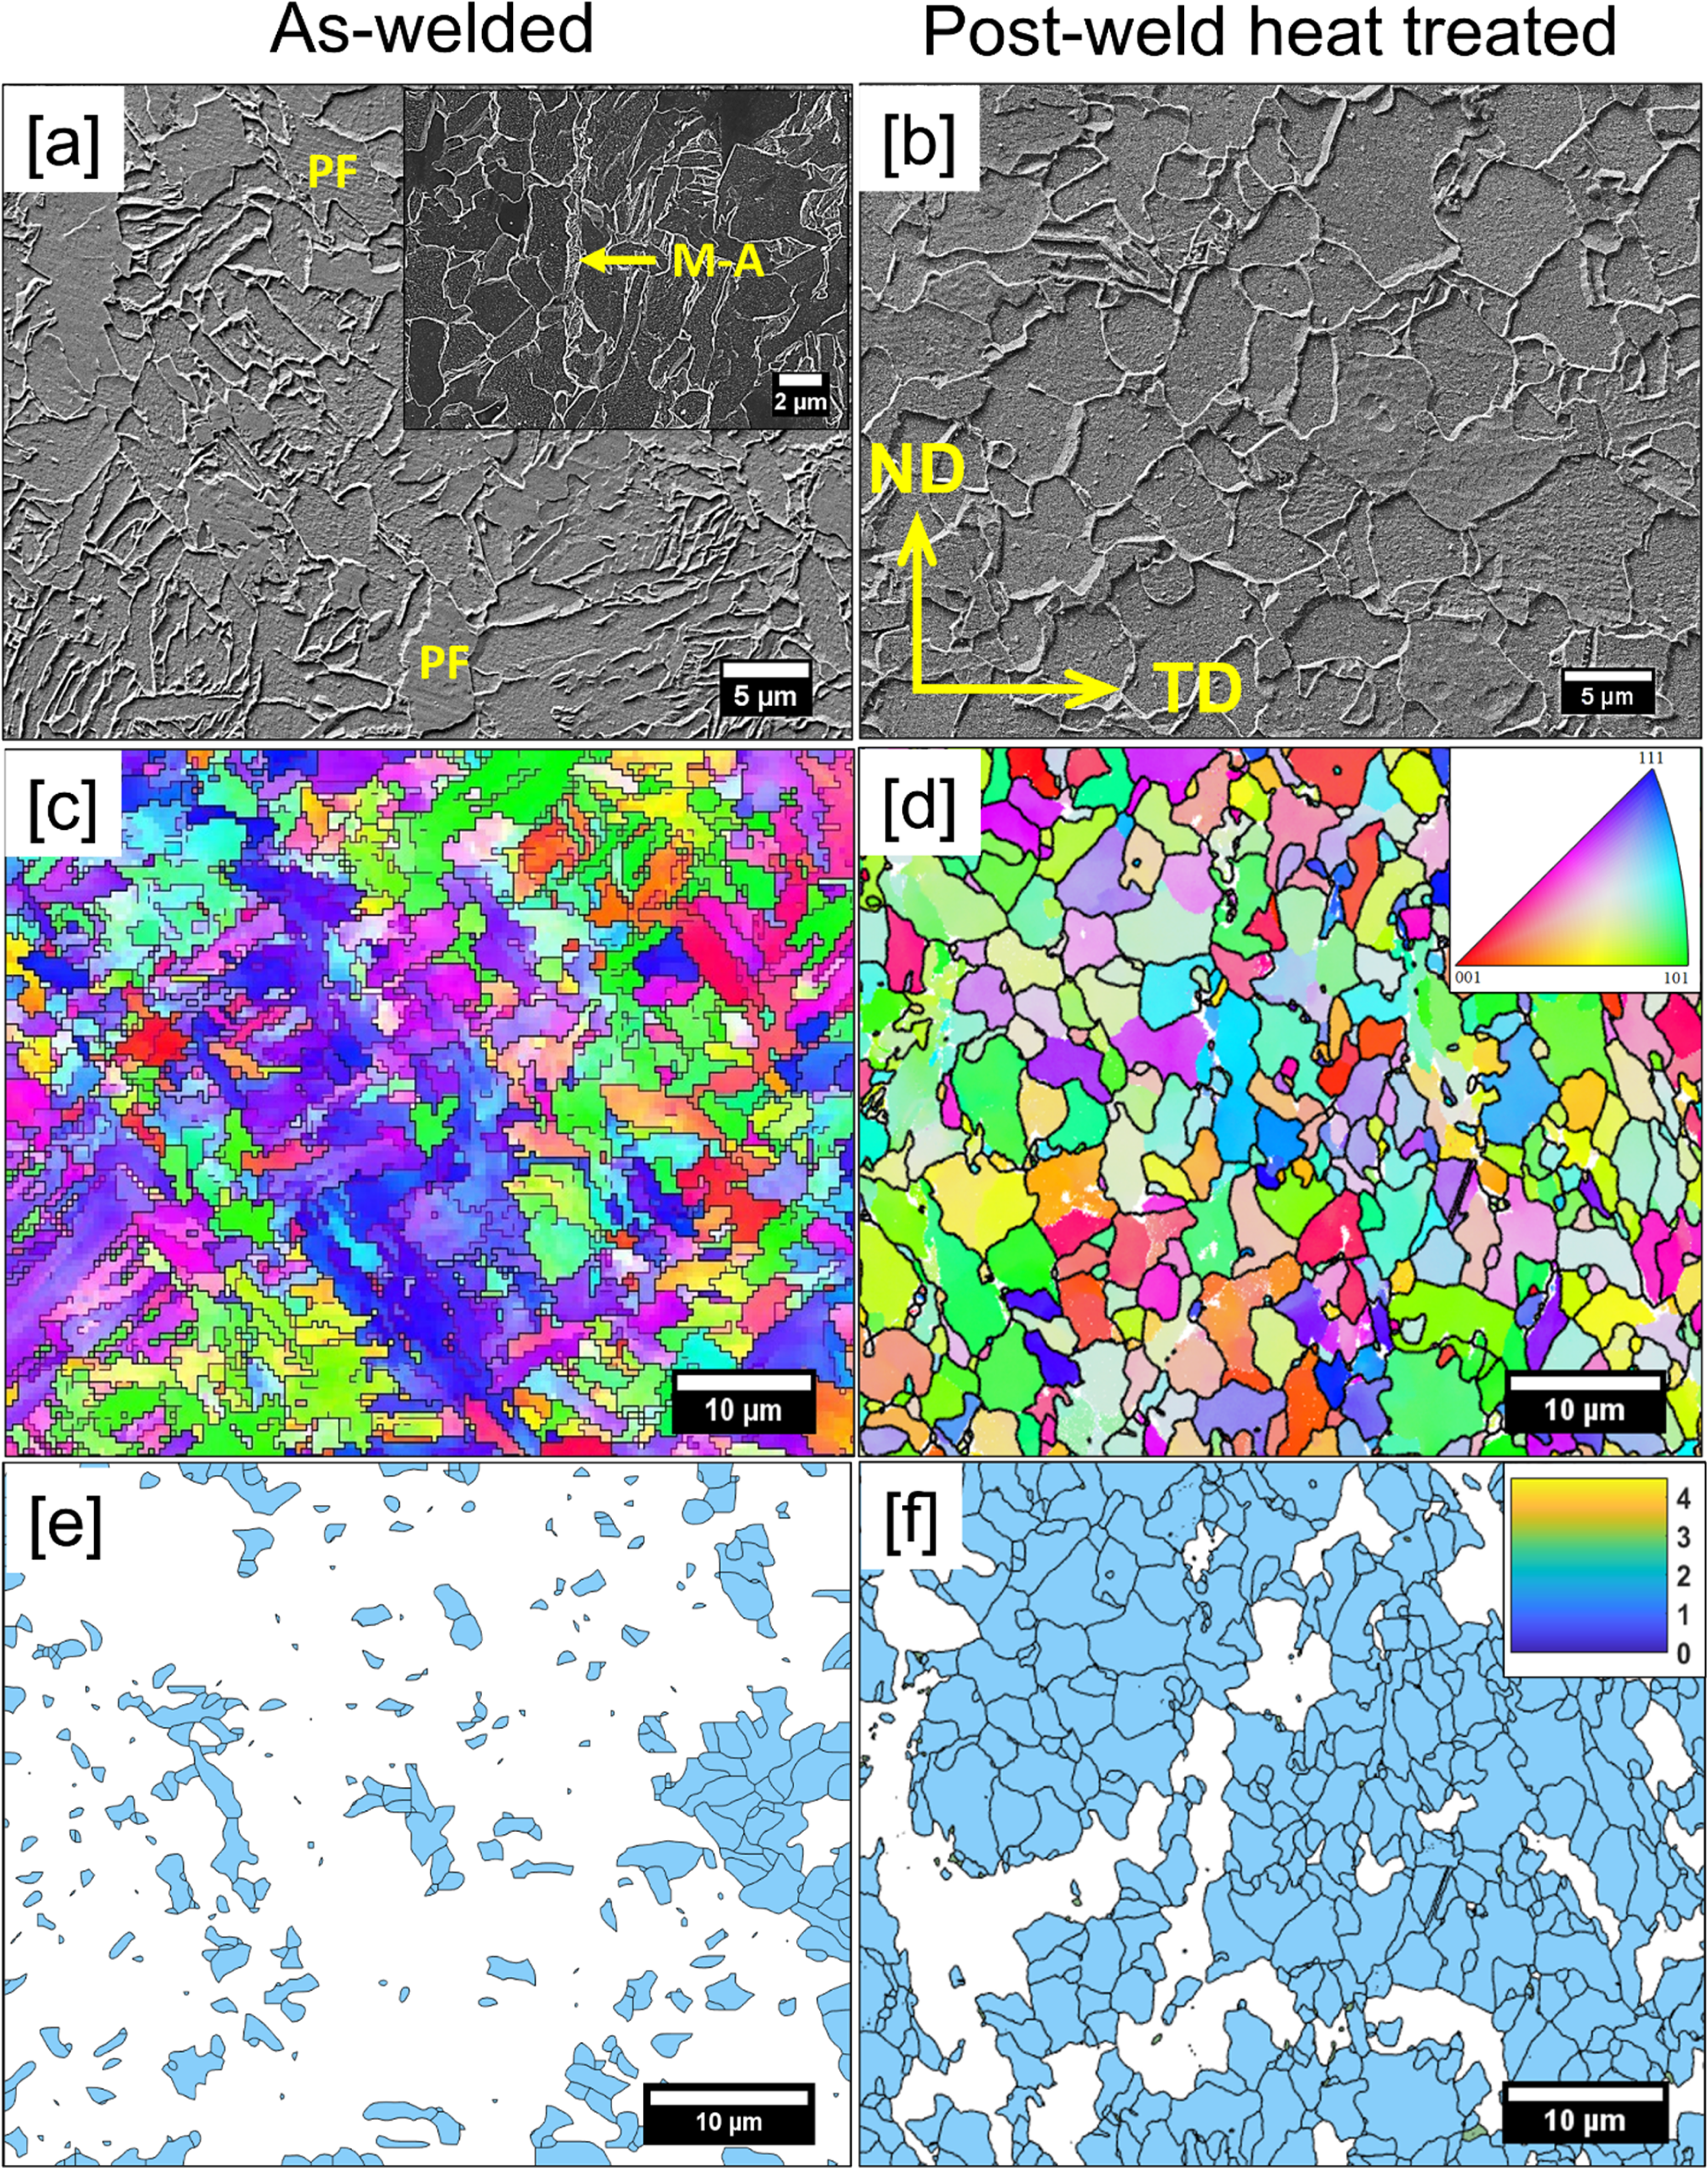
(a)-(b) Microstructure, (c)-(d) IPF, and (e)-(f) GOS maps for the weld interface region in the as-welded and post-weld normalized conditions of HF-ERW X65 steel.
Grain size, recrystallized grain fraction, and fraction of high-angle grain boundaries to low-angle grain boundaries in various microstructure regions in the welded joints.
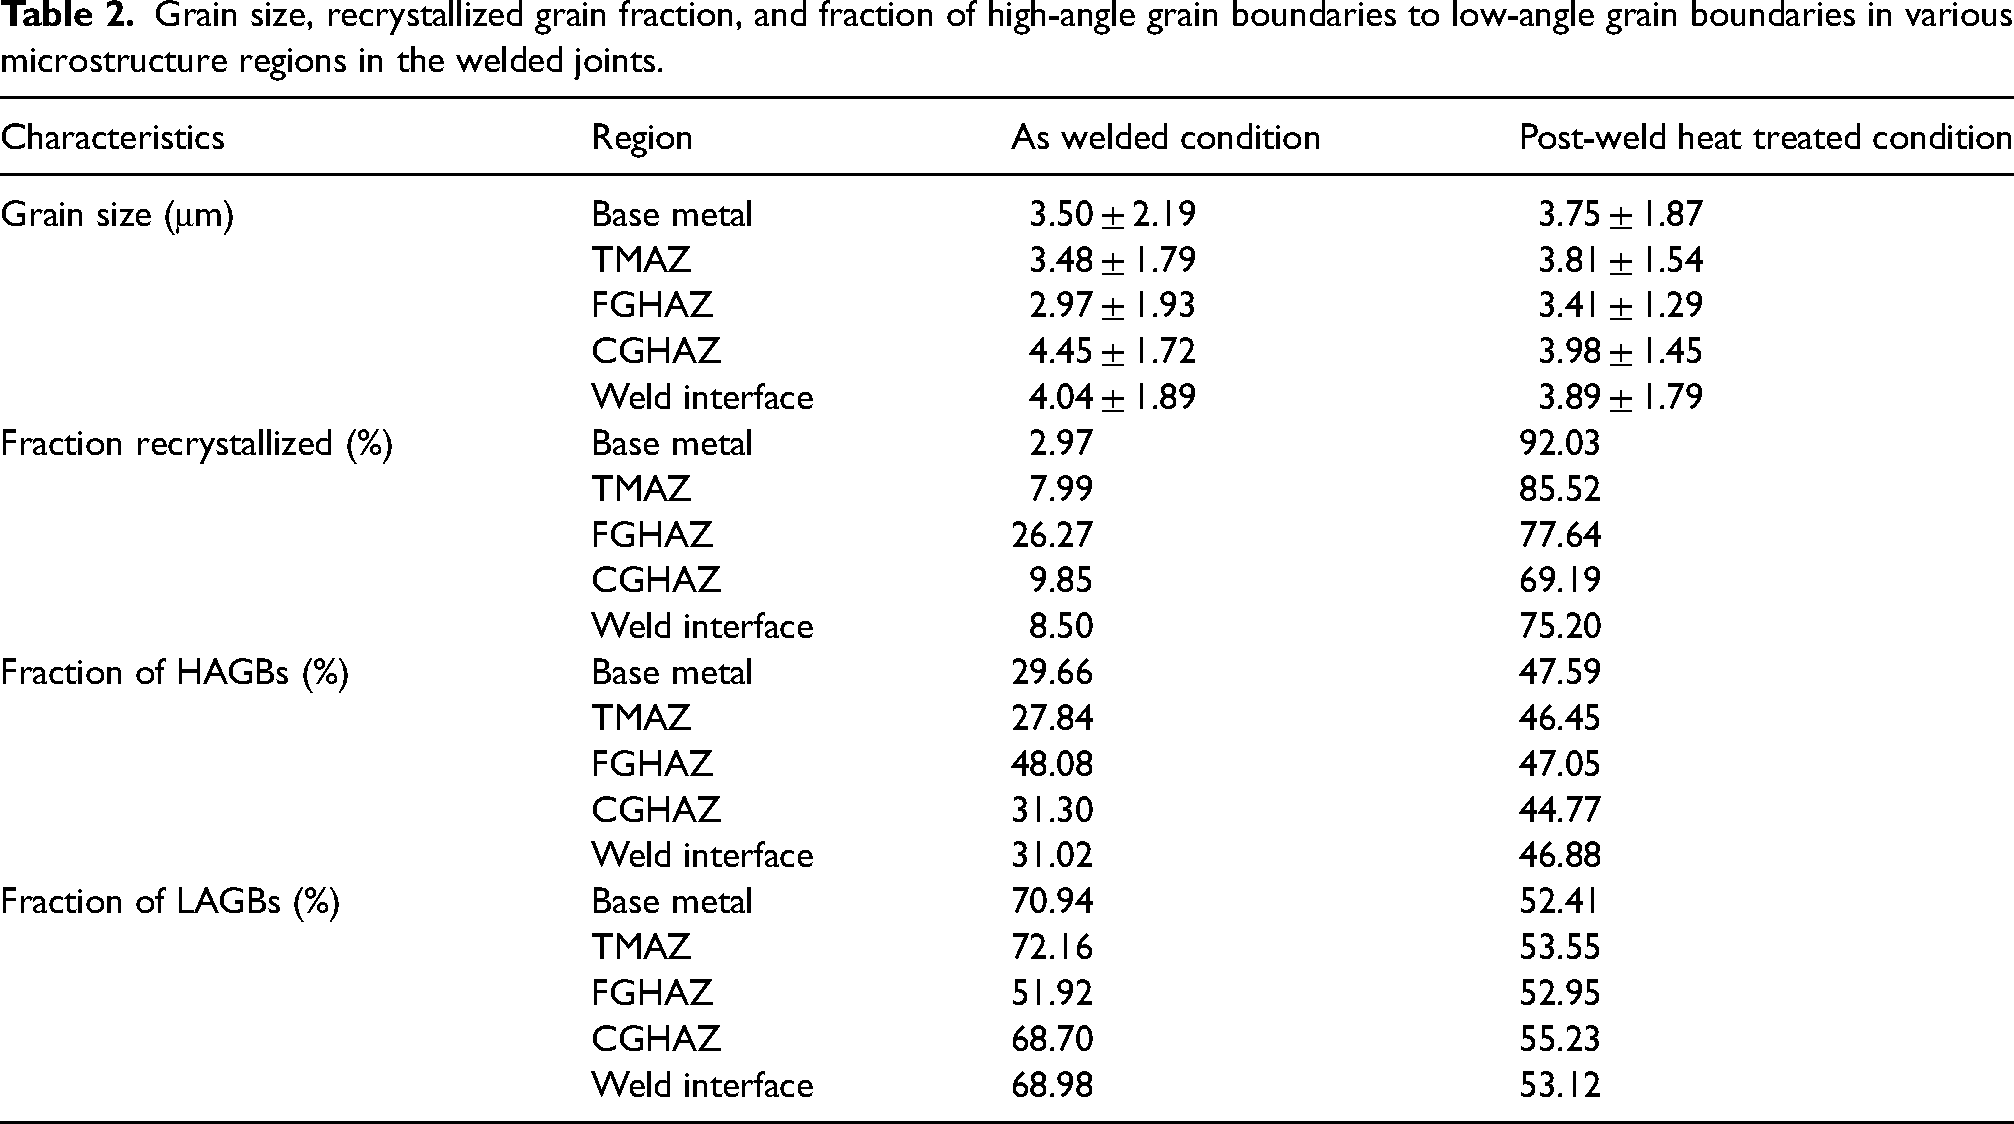
The TMAZ region was on either side of the weld interface (Figure 2). However, for brevity, only the TMAZ on the left side of the weld was shown here. The microstructure of the TMAZ (Figure 4(a) and (c)) in the as-welded condition is similar to the base metal, depicting PF; however, the grains are aligned towards the metal flow direction (Figures 2(a) and 4(a)). After PWHT, grains in the TMAZ region were more equiaxed and larger in the average grain size. In the as-welded condition, the average grain size of the TMAZ region was 3.5 μm (Table 2). After PWHT, the grain size increased to 4.5 ± 2.12 μm. GOS maps (Figure 4(e) and (f)) indicate that in the as-welded condition, the TMAZ region has undergone a partial recrystallization in comparison to the base metal (7.9% for TMAZ, Figure 4(e) and 3.0% for base metal, Figure 3(e)). After PWHT, the fraction of recrystallized grains increased to 86% (Figure 4(f)).
The microstructure of the FGHAZ region consisted of QF and bainitic ferrite (BF), in the as-welded condition (Figure 5(a)) with an average grain size of 2.97 ± 1.93 (Table 2). After PWHT, the microstructure of both FGHAZ regions consisted of PF (Figure 5(b)). The grain size of FGHAZ was 5.12 ± 1.89, after PWHT. In the as-welded condition, the FGHAZ depicted a higher fraction of recrystallized grains than any other region (26.3% for FGHAZ).
The CGHAZ region in the as-welded condition, shown in Figure 6(a), had a typical BF with a minor fraction of QF. In comparison with the FGHAZ, CGHAZ depicted a lower fraction of recrystallized grains (26.3% for FGHAZ and 9.9% for CGHAZ). The grain size of CGHAZ is 4.45 ± 1.72 and 5.3 ± 1.27, respectively before and after PWHT. After PWHT, both FGHAZ and CGHAZ regions depicted similar fractions of recrystallized grains (78% for FGHAZ and 69% for CGHAZ).
The weld interface in the as-welded condition depicted polygonal ferrite, as shown in Figure 7(a). The average grain size in this region was 4.04 ± 1.89 μm. After PWHT, the polygonal ferritic microstructure was observed with an increase in the grain size (Figure 7(b)). Consistent with the other regions, the number of recrystallized grains increased after PWHT (Figure 7(e) and (f)).
Crystallographic texture
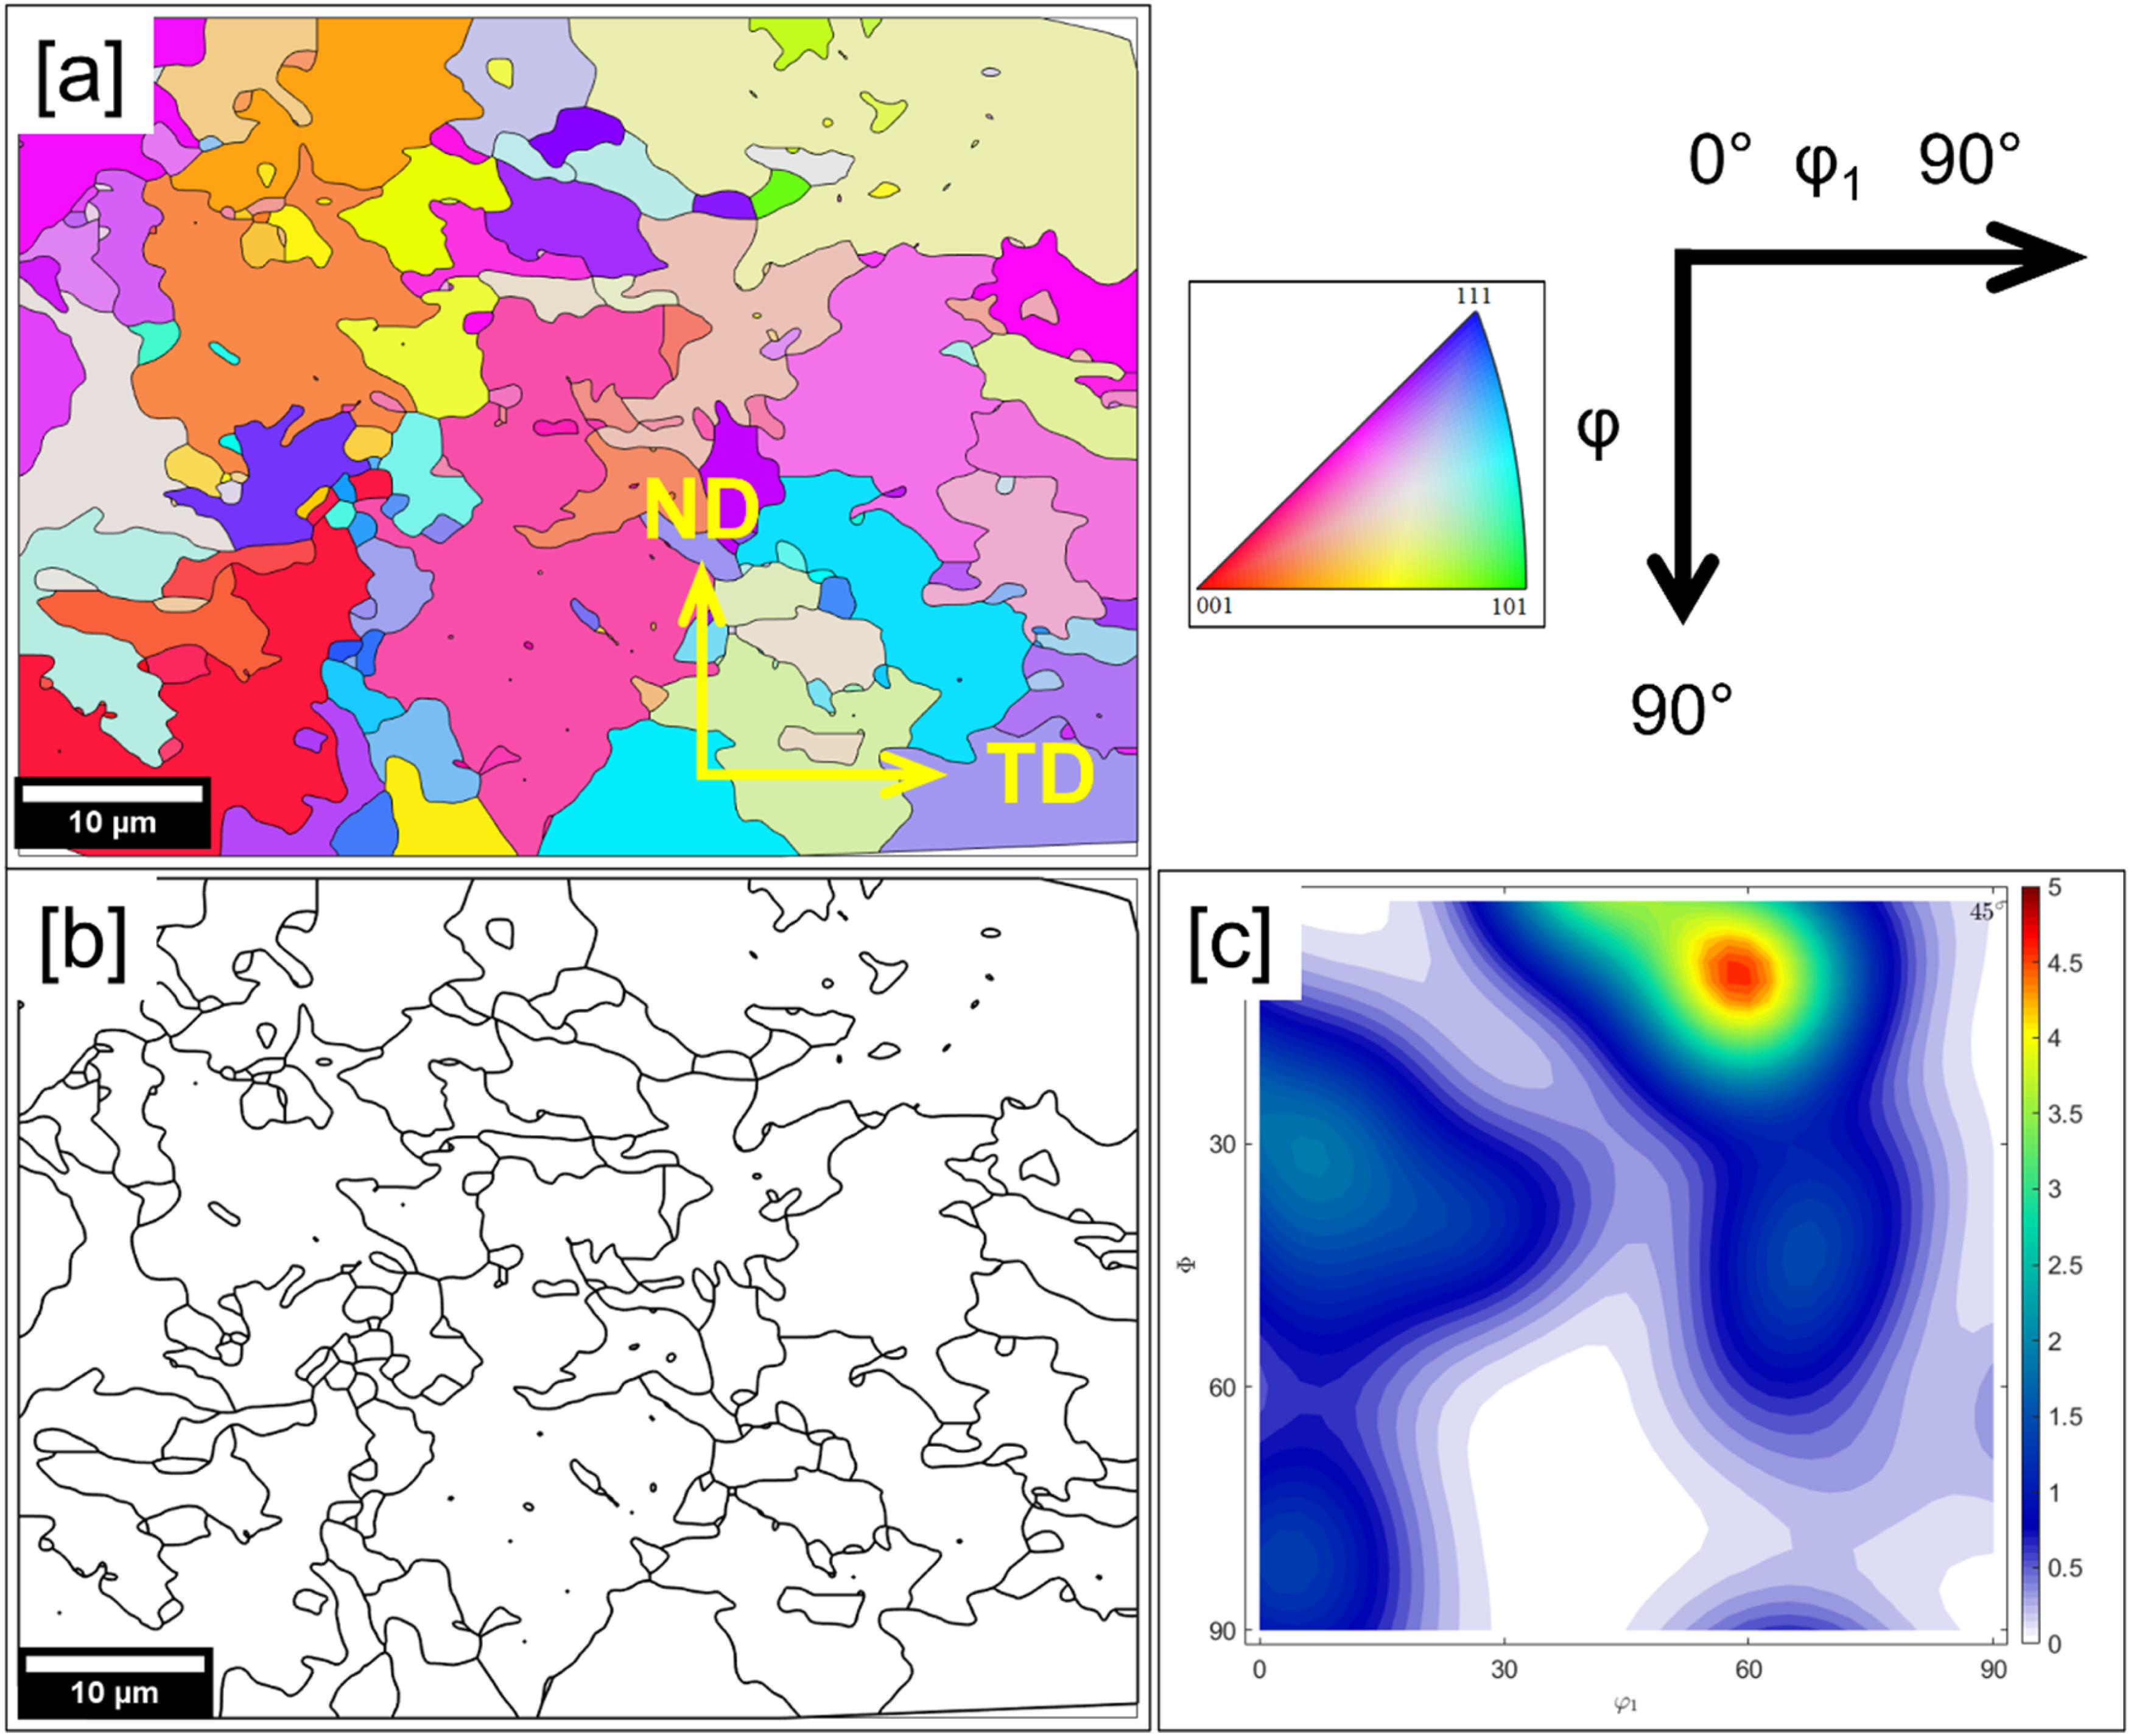
Through the reconstruction of the ODFs, crystallographic texture components were identified. Figure 8 shows, for both the as-welded (Figure 8(a), (c), (e), (g), and (i)) and PWHT conditions (Figure 8(b), (d), (f), (h), and (k)), φ2 = 45° sections reconstructed to accurately quantify the orientations {hkl}. The positions of the important texture components in the ideal BCC steel are shown in Figure 9(a). 24 The base metal region, in its as-welded condition, exhibited alpha and weak gamma fibers, with a maximum texture intensity of 4.9. 25 Major texture components were (113)[110], (112)[110], and (332)[113] (Figure 8(a)).
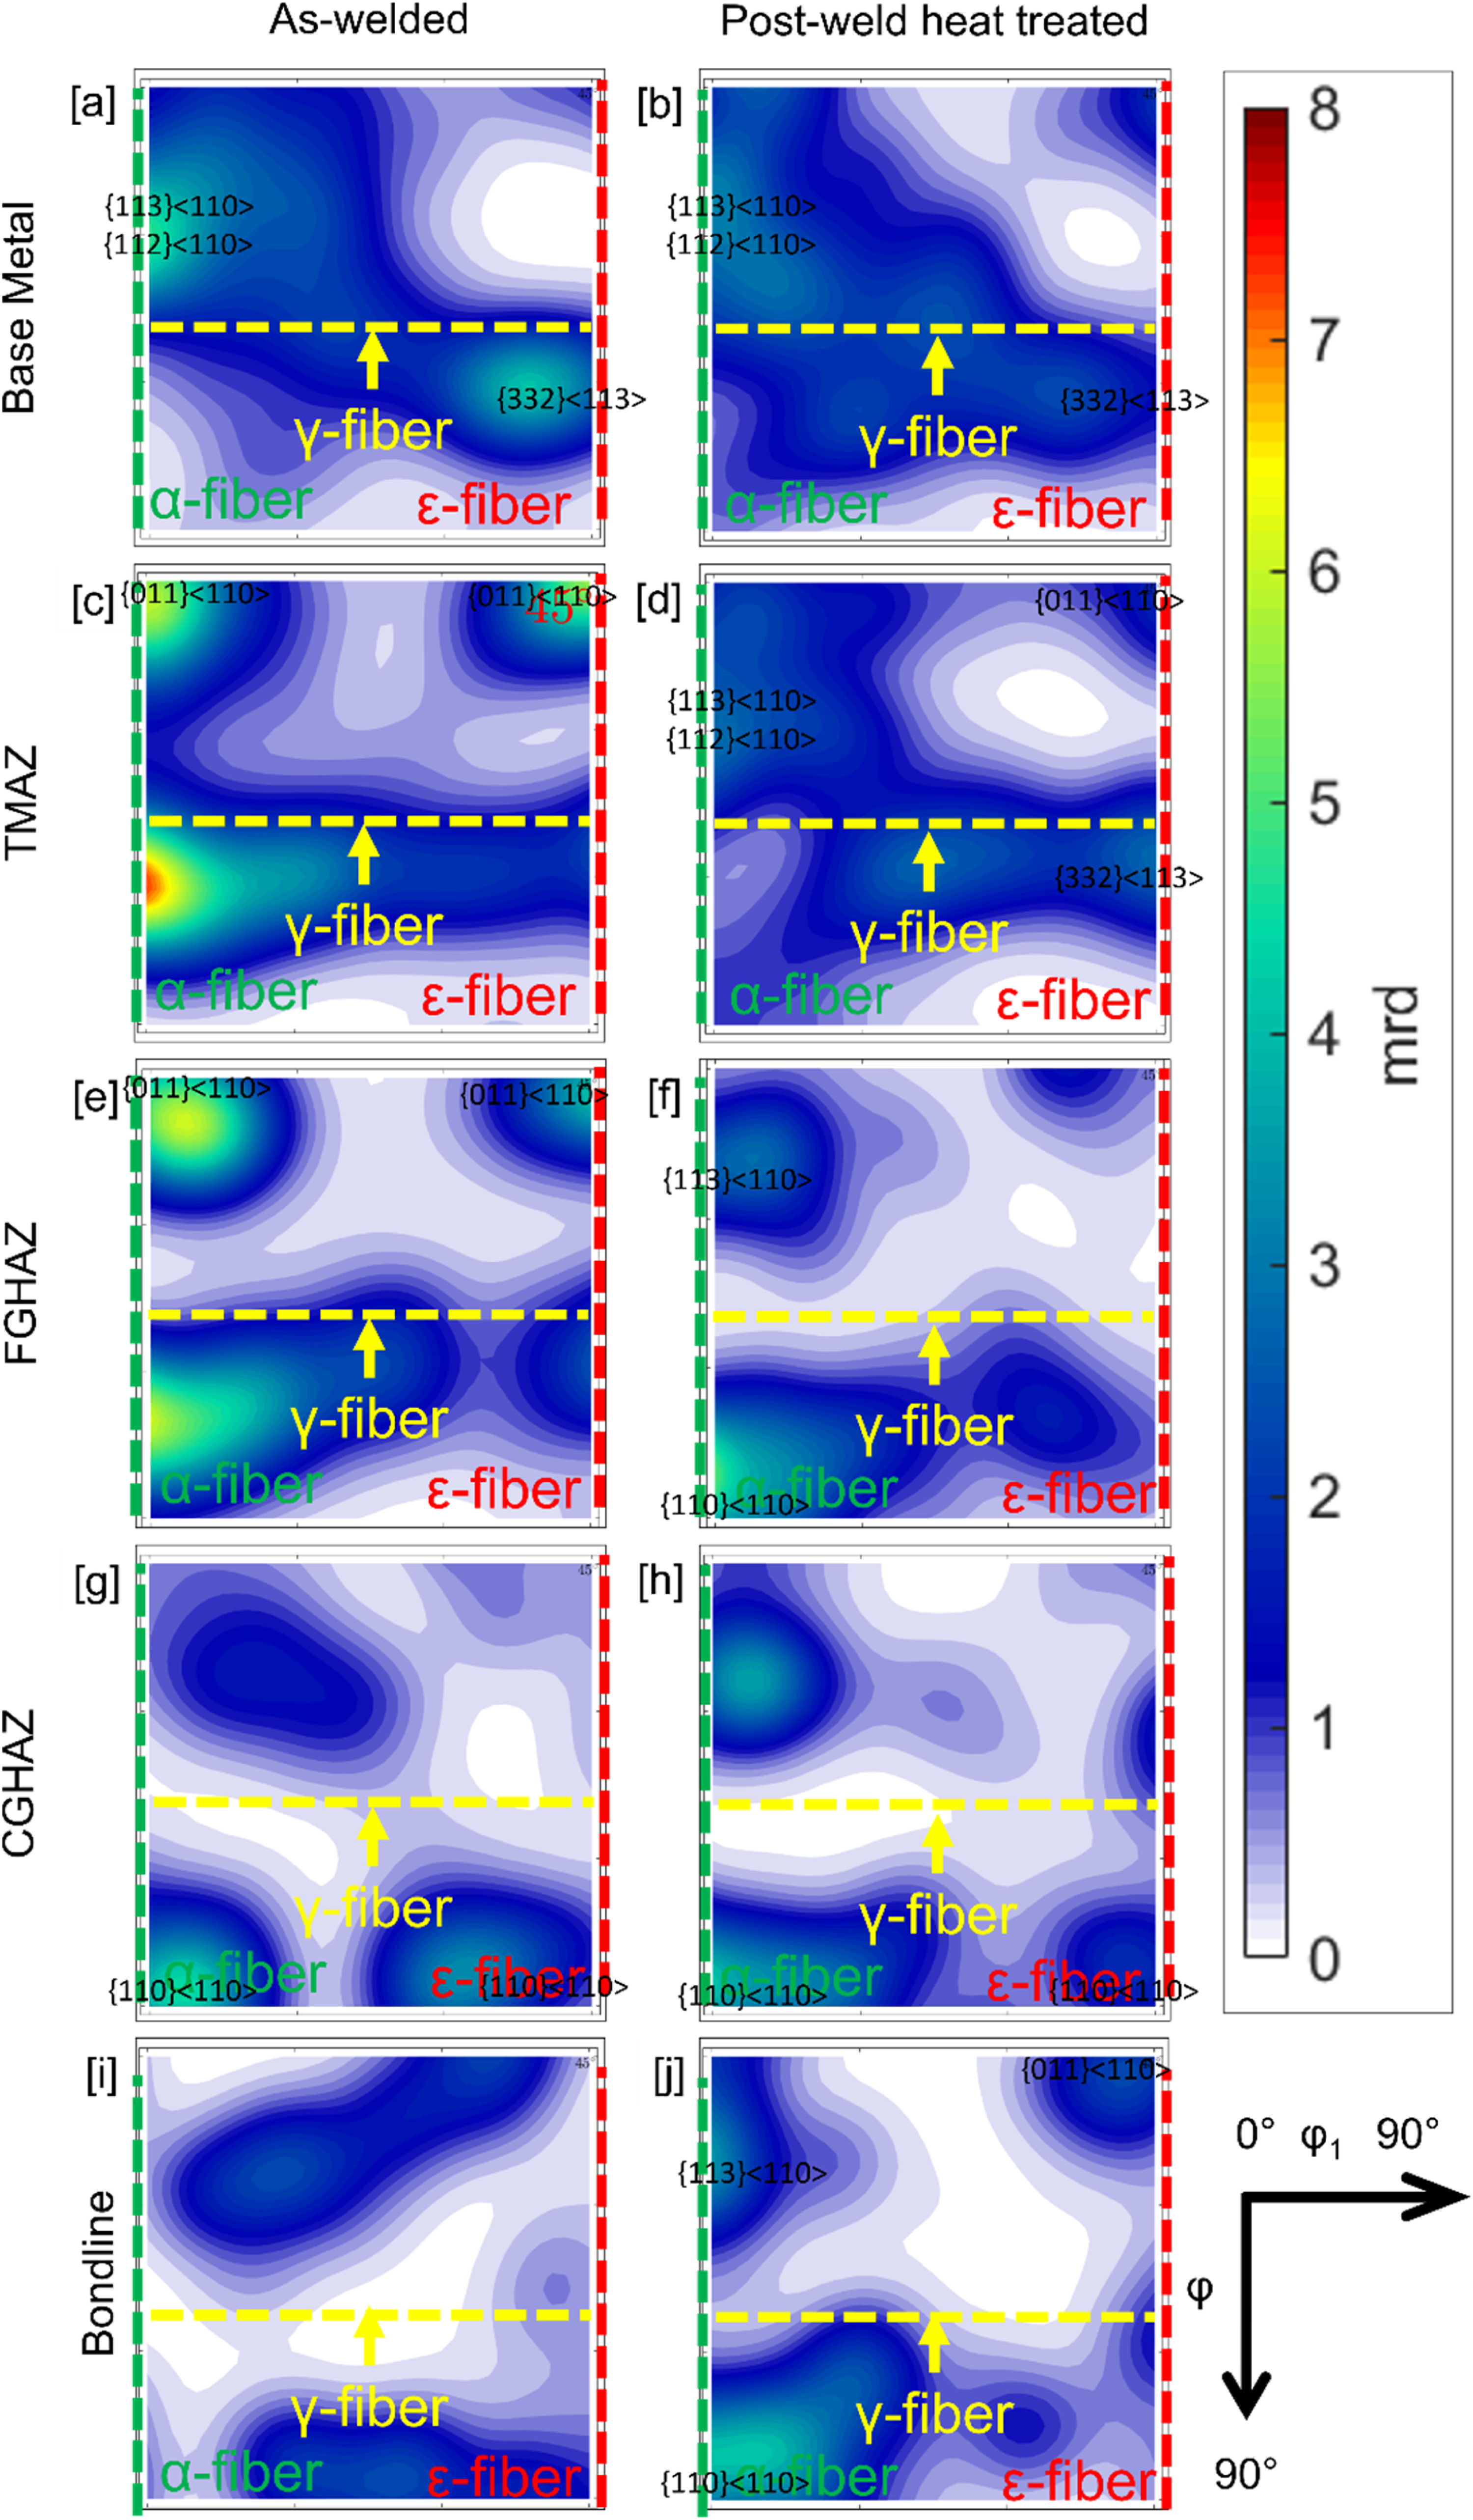
ODF section at φ2 = 45° of different regions of HF-ERW X65 steel in (a)-(e) for the as-welded and (f)-(j) are for the post-weld heat treated conditions (mrd = multiples of random density).
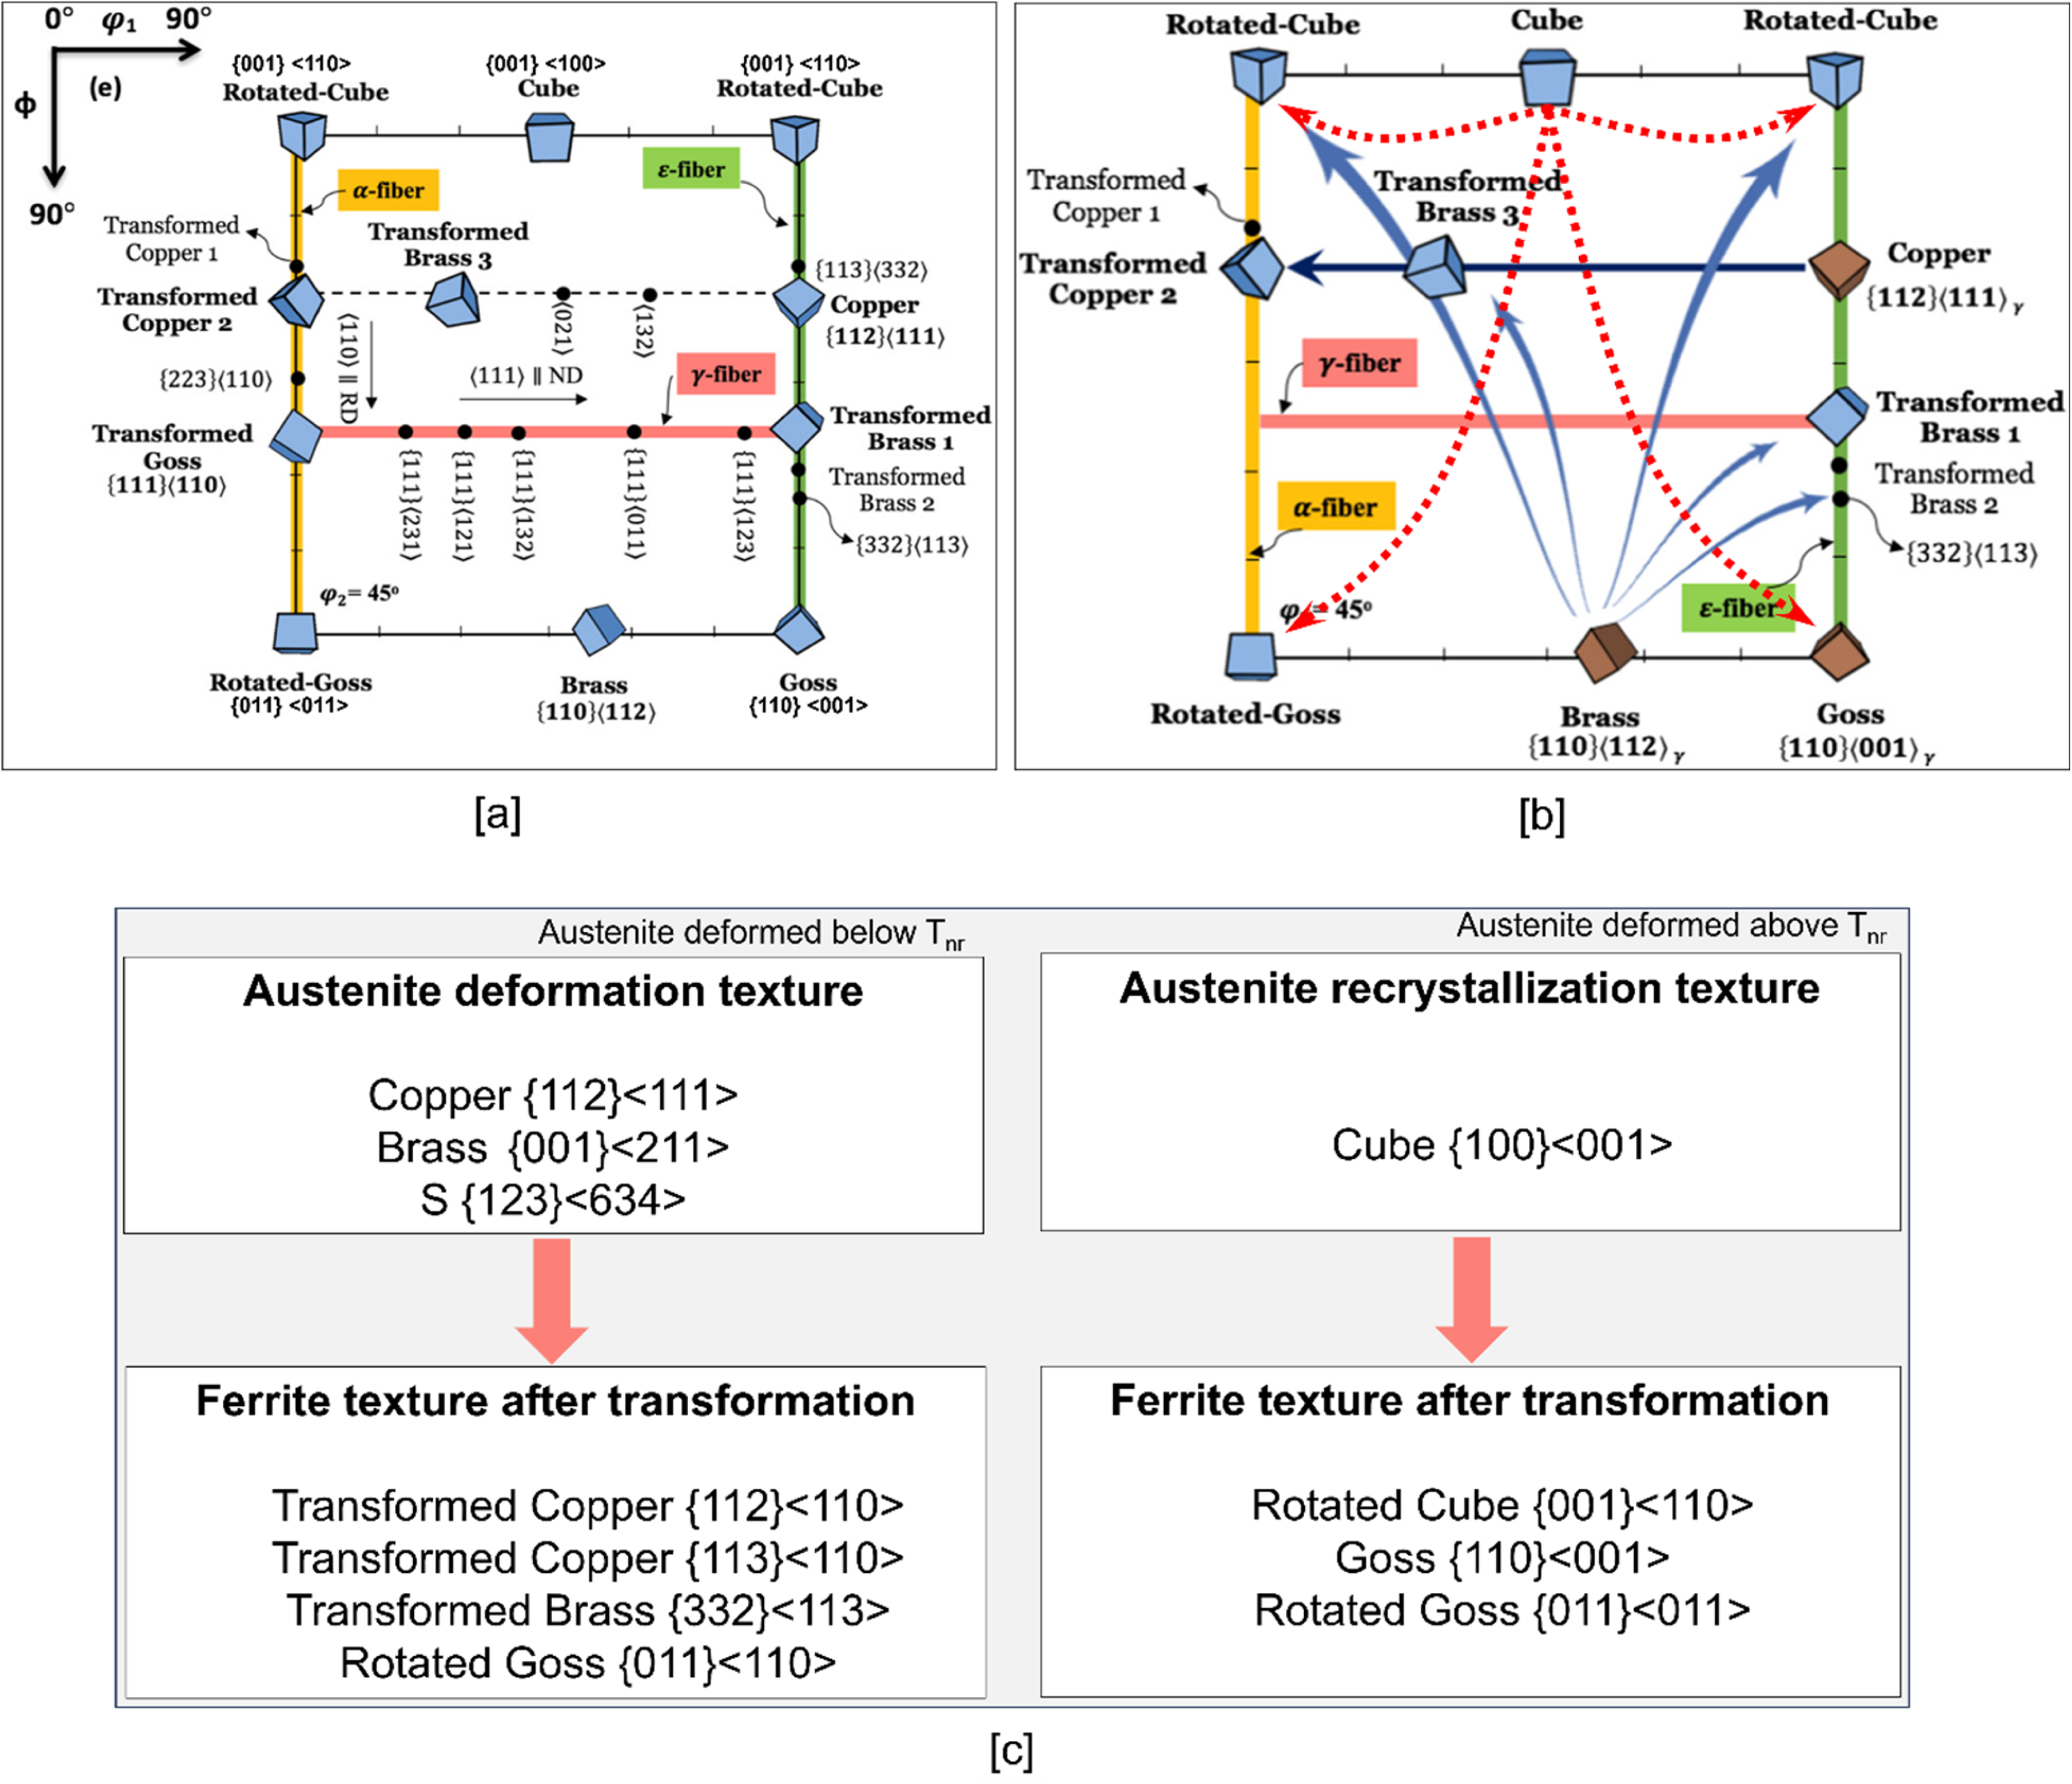
(a) Ideal position of BCC texture components and fibers in the φ2 = 45° ODF section, (b) schematic illustration of orientation relations between parent austenite and BCC product in the φ2 = 45° ODF section, and (c) summary of crystallographic texture relationships (Tnr is non-recrystallization temperature). 22
The texture intensity was increased in the TMAZ region to 7.4. TMAZ depicted alpha fiber along with the rotated Cube texture component (001)[110] (Figure 8(c)). The α and γ fibers in the base metal had converted majorly to rotated Cube (001)[110] texture components in the FGHAZ with a texture intensity of 6.1 (Figure 8(e)); Goss (110)[001] and rotated Goss (110)[110] texture components were identified in the CGHAZ (Figure 8(g)). The maximum texture intensity of the CGHAZ region was 4.6.
After PWHT, texture components were weaker in comparison to the as-welded condition (Figure 8(b), (d), (f), (h), and (k)). Away from the weld interface, in base metal and TMAZ regions, no major change in the texture components was observed, except for the reduction in the overall texture intensity. Base metal (Figure 8(b)) and TMAZ (Figure 8(d)) regions showed (113) [110], (112) [110], and (111) [110] components along with a rotated Cube texture component (001)[110]. The intensity of the rotated Cube component increased after PWHT in base metal and TMAZ region (Figure 8(b) and (d)). The texture intensities of base metal and TMAZ regions after PWHT were 3.3 and 2.9, respectively. After PWHT, in the FGHAZ (Figure 8(f)) and the CGHAZ (Figure 8(h)), strong rotated Goss (110) [110] and rotated Cube (001)[110] texture components were observed. The maximum texture intensities of FGHAZ and CGHAZ regions were 5.1 and 4.2, respectively.
Microhardness distribution
Vickers microhardness distribution for the as-weld and post-weld heat-treated conditions are shown in Figure 10. In the as-welded condition, consistent with the microstructure, hardness distribution across the weld was non-uniform. The highest hardness was observed next to the weld interface, in the CGHAZ. Hardness values increased from the base metal to the CGHAZ and then decreased in the weld interface. After the PWHT, the hardness distribution was more uniform across the cross section in the affected region with minor fluctuations due to inherent heterogeneity.
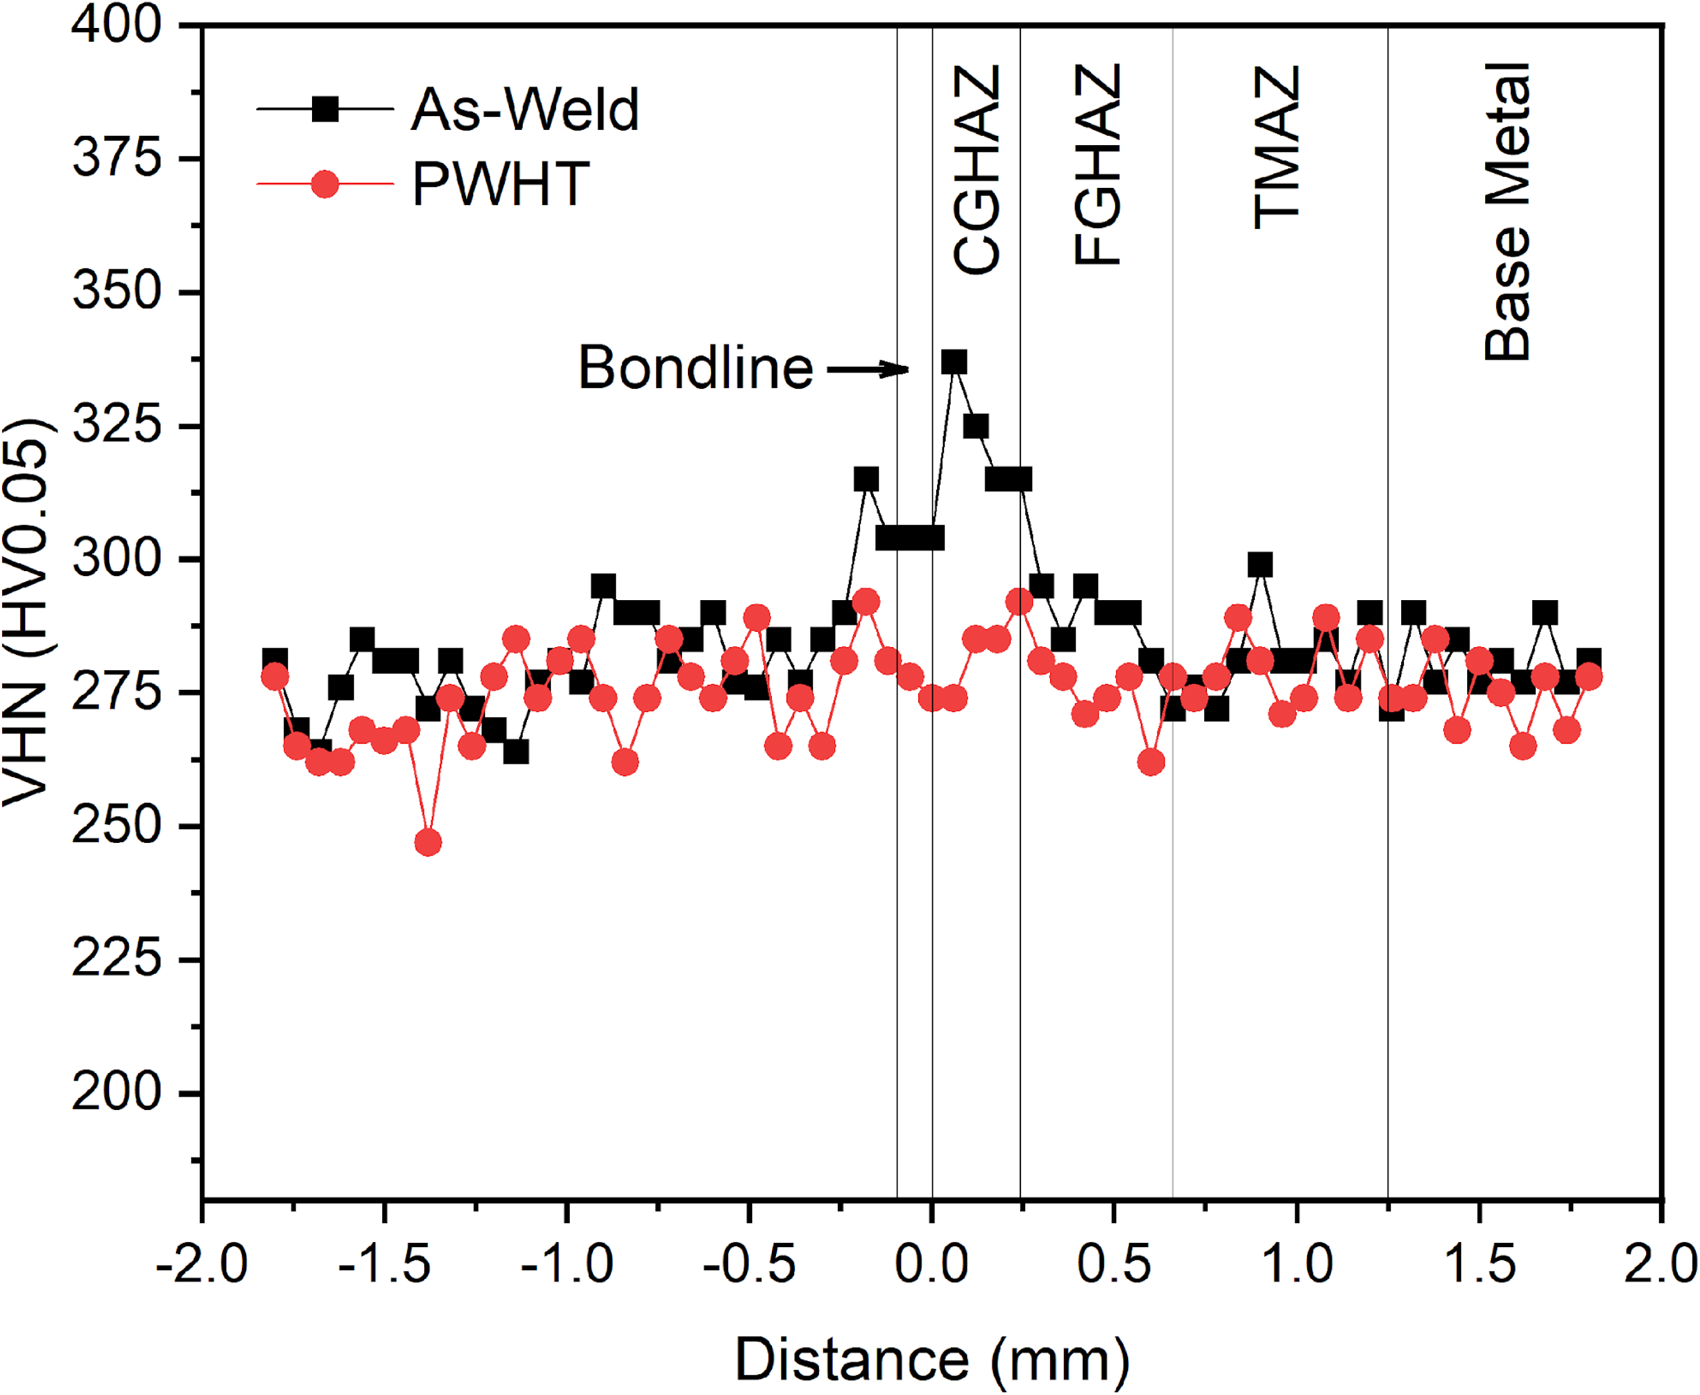
Vickers microhardness distribution across the cross section for the as-weld and post-weld heat treated conditions.
Charpy V-notch (CVN) impact toughness
Figure 11 depicts the CVN impact toughness test results, at −45 °C, for the base metal, as-welded, and post-weld heat treated conditions. The average absorbed energy (a minimum of three samples) for the base metal, as-welded, and PWHTed condition was 172.9 ± 5.2 J, 7.5 ± 1.6 J, and 69 ± 24 J, respectively. For HF-ERW linepipe with an outer diameter of less than 508 mm, the minimum average absorbed energy should be 27 J, as per API 5L – LinePipe Specification. 12 The base metal depicted excellent CVN at −45 °C and the as-welded sample was well below the specified limit. However, after the PWHT, the CVN value was improved in comparison with the as-weld condition and was above the API 5L linepipe standard. 12
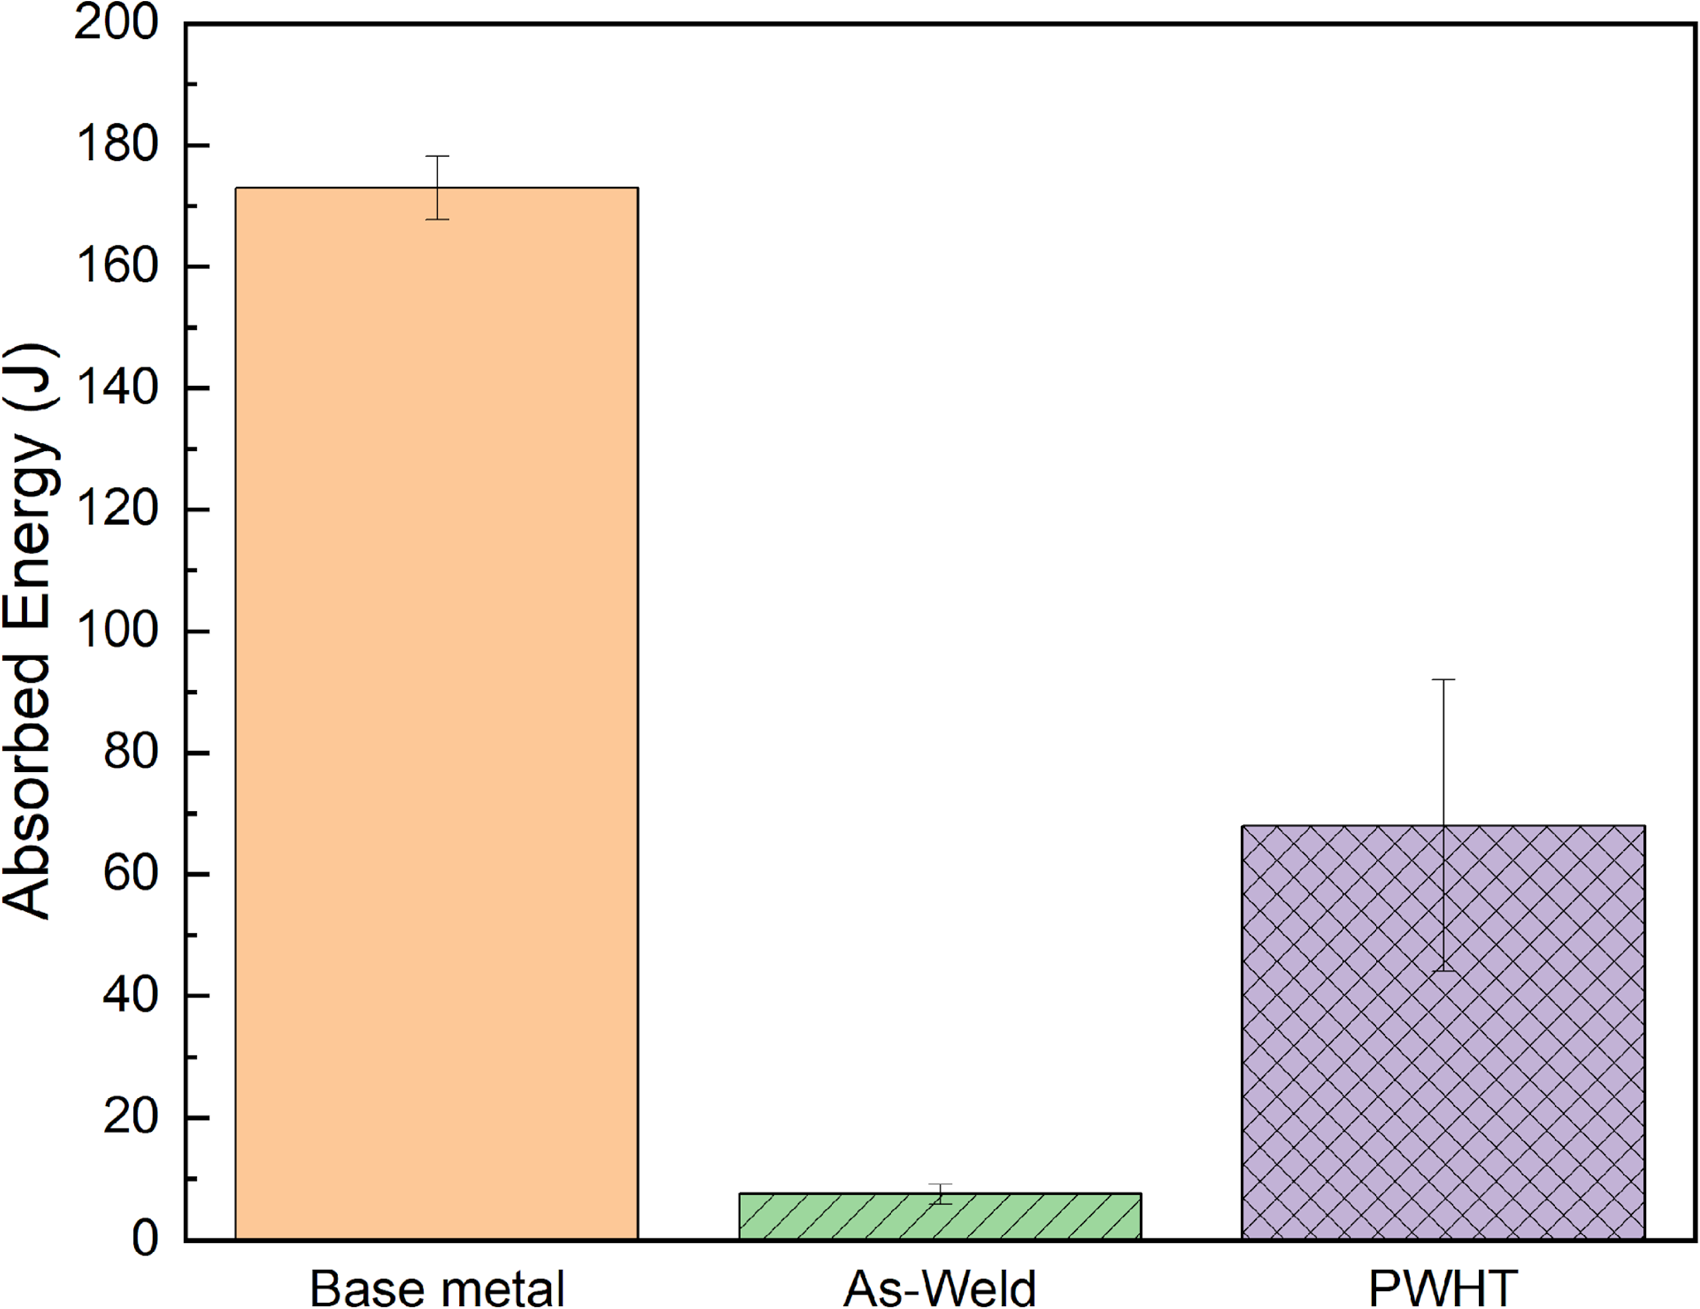
Charpy V-notch (CVN) impact testing results of HF-ERW API X65 steel at −45 °C for the base metal, as-weld, and post-weld heat treated conditions. 18
Discussion
The highest intensity of orientations for the X65 base metal was located at (113)[110], (112)[110], and (332)[113], as shown in Figure 8(a). API X65 linepipe steel used in the current study was produced via TMCP, in which the final rolling was performed above Ae3 and usually below the no-recrystallization temperature (Tnr) of austenite.24–26 This will retain the substructure with dislocation density and control the grain size to improve the tensile strength and impact toughness. 26 As the final rolling will happen below the Tnr, the austenite deformation texture components of copper {112}<111>, Brass {001}<211>, S {123}<634>, and Goss {110}<001> will transform into ferrite texture components, on cooling, such as transformed copper (112)[110], (113)[110] and rotated Goss (011)[110].27,28 Therefore, in the current investigation, (113)[110], (112)[110], and (332)[113] texture components indicate a significant deformation of austenite above Ar3 but below the recrystallization temperature (Tnr) during TMCP.28,29
In HF-ERW, the peak temperature and extent of squeeze deformation vary across different regions, from the weld interface (bondline) to the base metal. During PWHT, the as-welded sample is exposed to temperatures exceeding the upper critical temperature of Ae3.3,11,16,18 The resulting differences in texture between the as-welded and PWHT conditions across these regions will be discussed according to the distinct thermomechanical histories. Away from the weld bondline, in the TMAZ, the as-welded sample exhibited weak alpha and gamma fibers along with the minor rotated Cube component. The major intensities are at (111)[112], (111)[110], and (001)[110] (Figure 8(c)). It is well documented that the rotated Cube component is an indication of the austenite recrystallization (Figure 9(c)). 28 The GOS map for the TMAZ (Figure 4(e), 7.99%) showed that the recrystallized grain fraction is higher in comparison to the base metal (Figure 3(e), 2.97%). Therefore, the appearance of a minor Cube component suggests a partial austenite recrystallization in the as welded TMAZ region. Furthermore, the high intensity of the TMAZ's texture (max. 7.4) in comparison to the base metal (max. 4.9) is believed due to the progressive cold forming and squeeze deformation during HF-ERW. 2 The decrease in the fraction of HAGBs to LAGBs from the base metal to the TMAZ, as shown in Table 2, suggests the residual effects of squeeze deformation in the TMAZ. 2
After PWHT, the texture components of the TMAZ region were weakened (max. 2.9), and a more randomized texture was observed with a strong gamma fiber (Figure 8(d)). There was an appreciable drop in the (113)[110], (111)[112], and (111)[110] components. This random and weak texture is believed due to the formation of new grains during normalization, as the GOS map shows that the number of recrystallized grains increased after PWHT in the TMAZ region (∼86%, Figure 4(f)) and a drastic increase in the fraction HAGBs to LAGBs. 30 The gamma fiber components suggest a ferrite recrystallization (Figure 9(c)). Similar textures and intensity patterns have been reported in the literature for the TMAZ region in both HF-ERW and flash butt welding (FBW) joints.11,16,30
Near the weld interface, the FGHAZ exhibited high intensities of the rotated Cube texture (001)[110], while the CGHAZ was characterized by dominant intensities of the Goss (110)[001] and rotated Goss (110)[110] textures. When austenite is deformed at temperatures above the no-recrystallization temperature (Tnr), the austenite deformation texture components will transform into the austenite Cube texture (001)[100] (Figure 9). This transformation occurs due to the recrystallization of austenite as reported in.28,29 Upon further transformation to room temperature ferrite, the austenite Cube texture will change into rotated Cube, Goss, and rotated Goss components of (001)[110], (110)[001], and (011)[011], respectively (Figure 9).28,29 This is in correlation to the observed texture components in the FGHAZ and CGHAZ regions (Figure 8(e) and (j)).
Reconstructing the prior austenite grains (PAGs) is effective in determining the texture of austenite grains at high temperature.31–33 Figure 12(a) and (b) shows the IPF map and grain boundaries map of the reconstructed austenite from the crystallographic orientation data of ferrite in the CGHAZ region in Figure 6(c). Figure 12(c) shows the ODF section at φ2 = 45° for the PAG. The reconstruction showed that the parent austenite grains contained a strong austenite Cube texture (001)[100] due to the recrystallization of austenite. This austenite Cube texture was transformed into rotated Cube, Goss, and rotated Goss components during austenite decomposition to ferrite (Figure 9). The FGHAZ region experiences a temperature just above Ae3, and the CGHAZ experiences a temperature well above Ae3. Therefore, the formation of Cube, rotated Cube, Goss, and rotated Goss components is due to the recrystallization of austenite during HF-ERW.
Parent austenite grain reconstruction results of the CGHAZ region in Figure 6(c), (a) IPF map (b) austenite grain boundaries and (c) ODF section at φ2 = 45° (units in mrd).
It was suggested that a significant enhancement and sharpness in the Goss texture was due to the increase in shear deformation, upset pressure, and processing temperature.34,35 The simultaneous application of heat and deformation led to recrystallization and shear deformation in both the FGHAZ and CGHAZ. However, the CGHAZ experienced higher levels of shear deformation and peak temperatures, resulting in an enhanced Goss texture. During PWHT, the as-welded joint was subjected to temperatures above the upper critical temperature (between 900 °C and 1200 °C), resulting in complete austenization. Recrystallization was observed in both the FGHAZ and CGHAZ regions in the post-weld heat-treated sample, as seen in the GOS maps (Figures 5(f) and 6(f)) and the ratio of HAGBs to LAGBs (Table 2), compared to the as-welded condition. The recrystallized austenite developed a Cube texture, and upon transformation to ferrite, it evolved into Cube, rotated Cube, Goss, and rotated Goss components. Therefore, after PWHT, both FGHAZ and CGHAZ regions together with the bondline comprise high intensities of rotated Cube, Goss, and rotated Goss texture (001)[110], (110)[001], and (011)[011]. Similar texture intensities with the accumulation of {100} planes near the weld junction of HF-ERW X65 linepipe steel, after post weld normalization, significantly above Ae3 temperature, were reported. 3 The as-welded textures in the HAZ were retained after the PWHT due to the austenite memory effect or K-S relationship, as the heating and cooling rates involved in induction normalization PWHT are rapid.3,36 Therefore, the formation of Cube and Goss texture in the HAZ at the weld bondline, after PWHT, is because of both recrystallization of austenite and retention of as-welded texture.
In the literature, it has been demonstrated that the presence of high-indexed planes parallel to the plane of applied tensile stress, such as {113} and {112} families, facilitates slip deformation and improves impact toughness in BCC materials.26–28 Conversely, low-indexed planes, including the {100} and {110} families, are susceptible to cleavage fracture in BCC materials37–41 when parallel to the plane of applied tensile stress. Figure 13 depicts the accumulation of low indexed {100} cleavage planes parallel to the macroscopic fracture surface in different regions before and after PWHT. In the current study, the base metal of API X65 linepipe steel exhibited (113)[110], (112)[110], and (332)[113] texture components, which have been shown to significantly benefit impact toughness.26–28 In the context of HF-ERW, Yan et al. 3 and Ravikiran et al. 18 reported excellent impact toughness values, even at arctic temperatures, for the base metal of API X65 linepipe steel. However, during the HF-ERW welding, undesirable rotated Cube and rotated Goss texture components, specifically (001)[110] and (011)[011], formed in the HAZ. Similar findings were reported by Shajan et al..14,30 These undesirable texture components were not fully eliminated by PWHT, which might deteriorate the impact toughness of HF-ERW joints in API X65 steel. It was observed that specimens notched along the bondline, which displayed low CVN impact toughness, experienced fracture paths along the CGHAZ region.42,43 As mentioned in the introduction, the impact toughness of HF-ERW linepipe steel weld joints depend on various factors, including microstructure, weld defects at the bondline, grain size, grain distribution, and crystallographic texture. Therefore, the inferior CVN impact toughness of HF-ERW API linepipe, frequently reported in the literature,3,16,34,42 may be partially attributed to the unfavorable Goss and Cube textures in the HAZ near the weld interface.
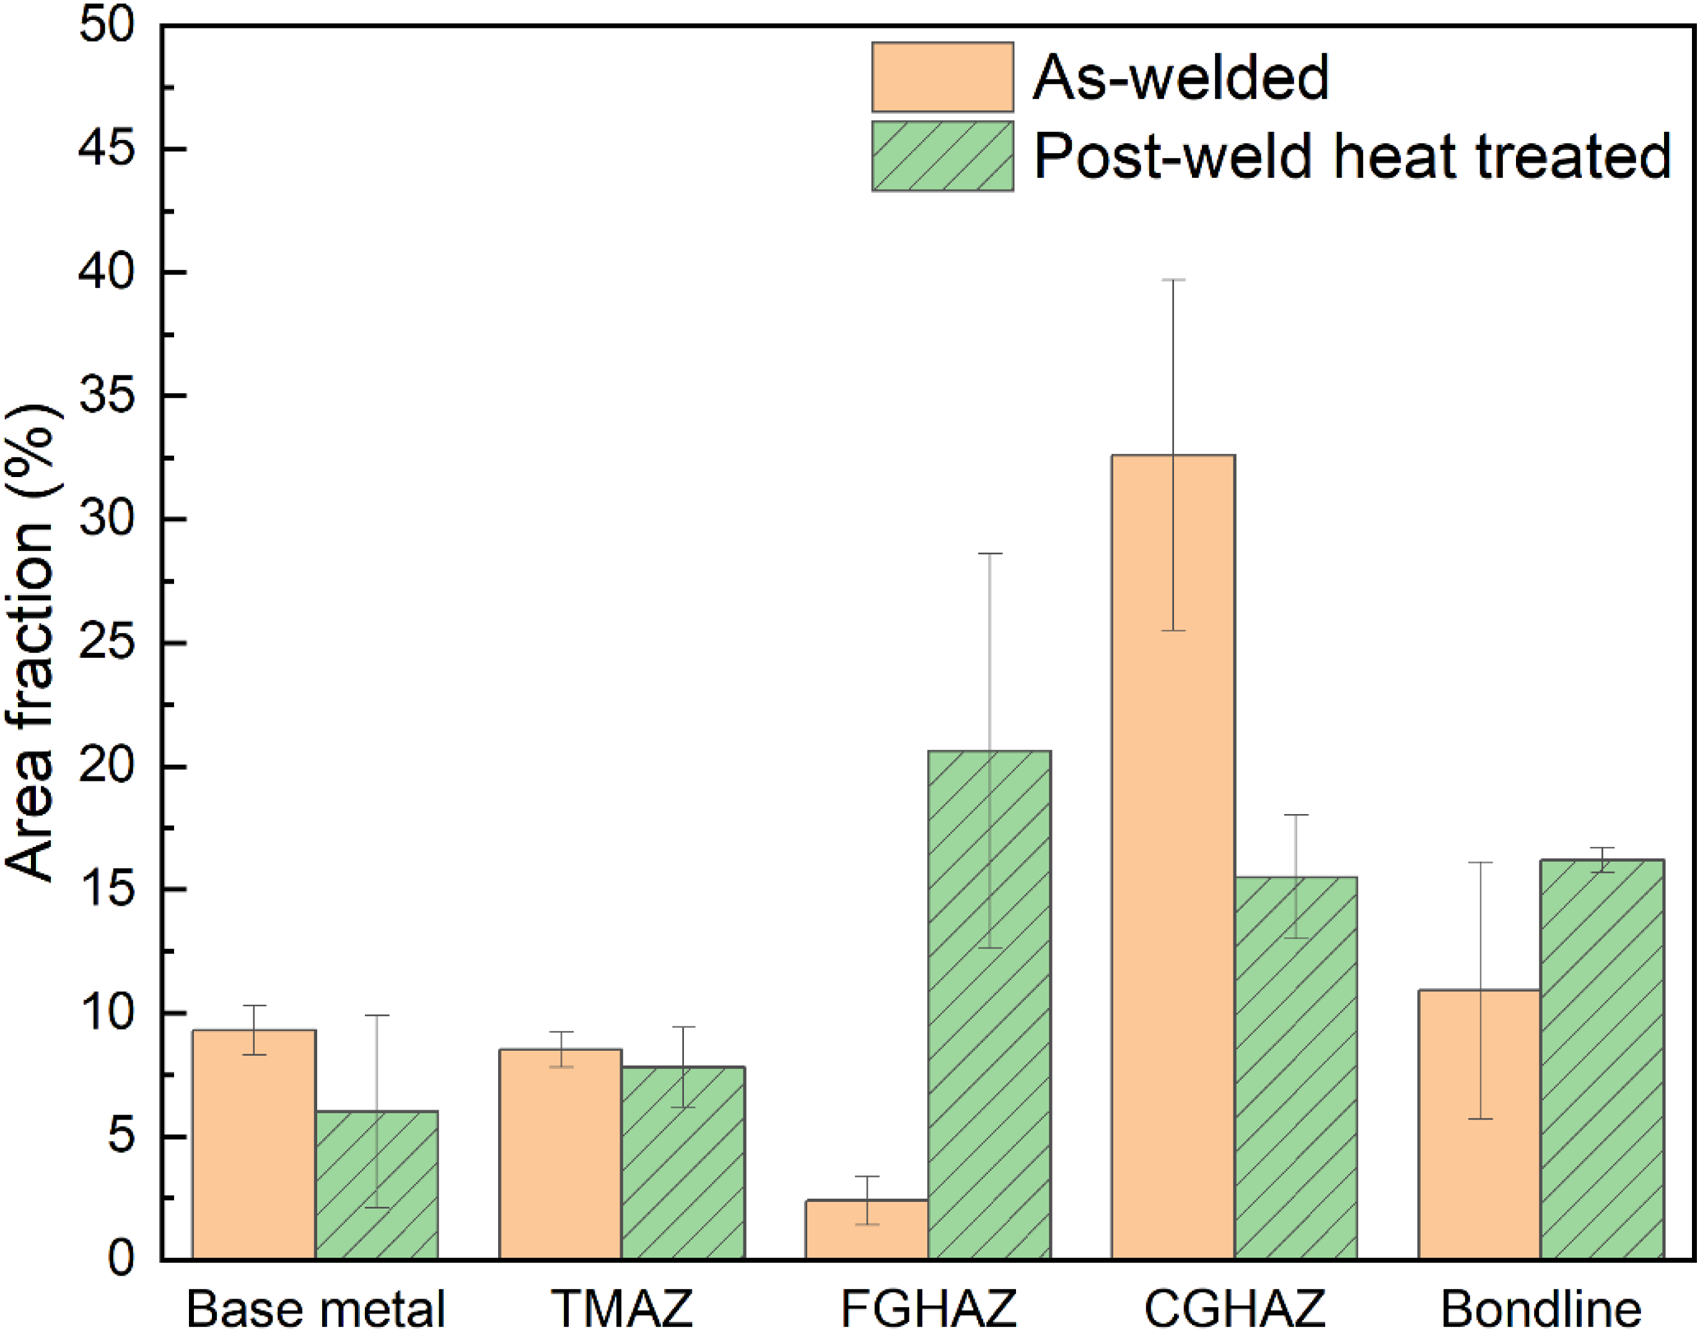
Area fraction of grains containing {100} cleavage planes at an angle of 10° or less relative to the macroscopic fracture plane. 18
Conclusions
API X65 steel was welded using HF-ERW, followed by a normalization PWHT via induction heating. The evolution of crystallographic texture was analyzed in the base metal, after HF-ERW, and following PWHT and correlated with CVN impact toughness at −45 °C. Major findings are summarized below:
The API X65 grade linepipe steel base metal depicted a low fraction of cleavage planes, at 9%, relative to the macroscopic fracture plane and therefore, showed excellent CVN impact toughness value of 172.9 ± 5.2 J. The CVN value for the as-welded weld interface was 7.5 ± 1.6 J. Near the weld interface, the fraction of cleavage planes increased to 44%. Goss (110)[001], rotated Goss (011)[011], and rotated Cube (001)[110] components were observed due to the recrystallization and shear deformation of austenite. After PWHT, the CVN impact toughness of the weld interface improved to 69 ± 24 J. The microstructure was homogenized across the weld joint, and texture intensities were reduced. However, a strong austenite recrystallization texture consisting of rotated Cube (001)[110] and rotated Goss (011)[011] was still observed at the weld interface, with a 30% fraction of cleavage planes parallel to the macroscopic fracture plane. Although PWHT improved impact toughness compared to the as-welded condition, it remained below that of the base metal, partly due to the unfavorable Goss and Cube textures in the HAZ near the weld interface with significant fraction of cleavage planes (30% after PWHT) parallel to the macroscopic fracture plane.
Footnotes
Declaration of conflicting interests
The authors declared no potential conflicts of interest with respect to the research, authorship, and/or publication of this article.
Funding
The authors received no financial support for the research, authorship, and/or publication of this article.