
Abstract
Ultrasonic metal welding, an emerging solid state bonding method, has drawn extensive attention and been applied in various manufacturing scenarios in recent years. This paper reviews the quality monitoring system of ultrasonic metal welding from in-situ testing (online monitoring), non-in-situ testing and prediction of ultrasonic weld quality through machine learning methods. In-situ testing focuses on the acquisition of different process parameters and their relationship to weld quality, while non-in-situ testing focus on the monitoring indicators of the weld quality and the testing means. The exploration of machine learning methods concentrates on the influence of model selection and parameter input on prediction accuracy. Based on the analysis, the future development trend of ultrasonic weld quality monitoring is provided.
Keywords
Introduction
As a type of solid state welding, ultrasonic metal welding was invented 90 years ago. Through the combined effects from static pressure on the workpieces and high-frequency ultrasonic vibration, this technology is able to transform the energy generated by high-frequency ultrasonic vibration into friction between welding interfaces, plastic change of metal materials and limited increase of temperature, so as to achieve solid state bonding between the workpieces. It features short welding cycle, independence from metallurgical restriction, excellent welding effects, availability for precision welding and low requirement for weldment surface cleanliness. The temperature rise that happen during ultrasonic welding is local and transient, with the temperature being lower than the recrystallisation temperature of the metal. It can thus effectively avoid oxidation, high temperature damage and melting of the material during the process of welding. It is, therefore, a suitable approach for precision welding of microelectronic devices and dissimilar metal welding.1,2 The material and size of weldable workpieces in ultrasonic metal welding mainly is decided by the power of welding machine, the setting of welding parameters and the design of sonotrode. 3 The welding machines that are widely used currently can weld copper, aluminium, magnesium and other metal foils, wires and micro-pieces with good plasticity, 4 yet the range of weldable workpieces by ultrasonic metal welding technology is constantly expanded with the continuous development of high-power ultrasonic welding system. Some scholars have successfully welded together aluminium and magnesium,5–8 aluminium and titanium,9–11 aluminium and steel,12–15 magnesium and copper, 16 magnesium and titanium17,18 etc. of thick plate using ultrasonic welding. Due to the features of this technology, its application prospects in multiple fields, such as electrical manufacturing, electronic industry, aerospace and nuclear industry, advanced parts sealing and new material preparation.19–22
Researchers in this field has carried out a considerable number of experiments and numerical modelling to investigate the joining mechanism in ultrasonic metal welding, which now mainly includes interdiffusion and intermetallic compound,1,7,8,12–14,16,23–29 recrystallisation and grain fusion,12,26,30–34 mechanical locking,3,30 friction and plastic deformation11,13,22,30,35 and even local melting.1,16,18 The welding mechanism of the technology is still controversial, with the previous mechanism's inability to explain all the phenomena in the ultrasonic welding process. 36 Research conducted at home and abroad now mainly concentrate on the joining mechanism and process parameters, with very limited attention paid to quality monitoring of ultrasonic metal welding.9,37,38 The short welding cycle and small welding window of ultrasonic metal makes it very difficult to monitor the welding process. 39 Additionally, the welded joints with limited area are sensitive to many factors, mostly uncontrollable, such as the condition of the welding machine, the workpiece surface and the welding parameters, making it more difficult to assess the quality of welded joints in the later stage.40–45 Due to the characteristics of ultrasonic metal welding, it is impossible to use traditional non-destructive monitoring methods such as fusion welding and pressure welding, resulting in the necessity to use equipment with higher accuracy or special non-destructive testing.
Ultrasonic welding involves multiple parameters, the relationship between each is non-linear. These parameters all exert influence on frictional heat generation and plastic deformation in the welding process, and finally determines the quality of welded joint in ultrasonic metal welding. Since different materials can lead to the change of weight of different welding parameters in monitoring weld quality, the joint quality prediction and process optimisation of ultrasonic metal welding is very complicated.7,46 Machine learning can be an effective tool in data processing and quality prediction can be a good method to clarify the still unclear relationship between each parameter and the weld quality, while a proper model can lead to a good fit relationship.
Given the characteristics of ultrasonic medal welding, weld defects of this welding method are different from those of other welding methods.9,47–54 Although there hasn’t been any specific definition and classification of the weld defects of ultrasonic medal welding currently, the definition of defects of other welding methods, such as stir friction welding and resistance spot welding can be used as reference. The influencing factors, types, detection methods are collated and presented in Figure 1. As shown in the figure, improper selection of welding parameters, improper design of welding head patterns and other influencing factors will lead to internal defects and external defects such as cracks and deformation in ultrasonic welded joints.55–57 Under the combined action of these defects, the performance of the solder joint will decrease, which will affect the quality and service life of the weld.
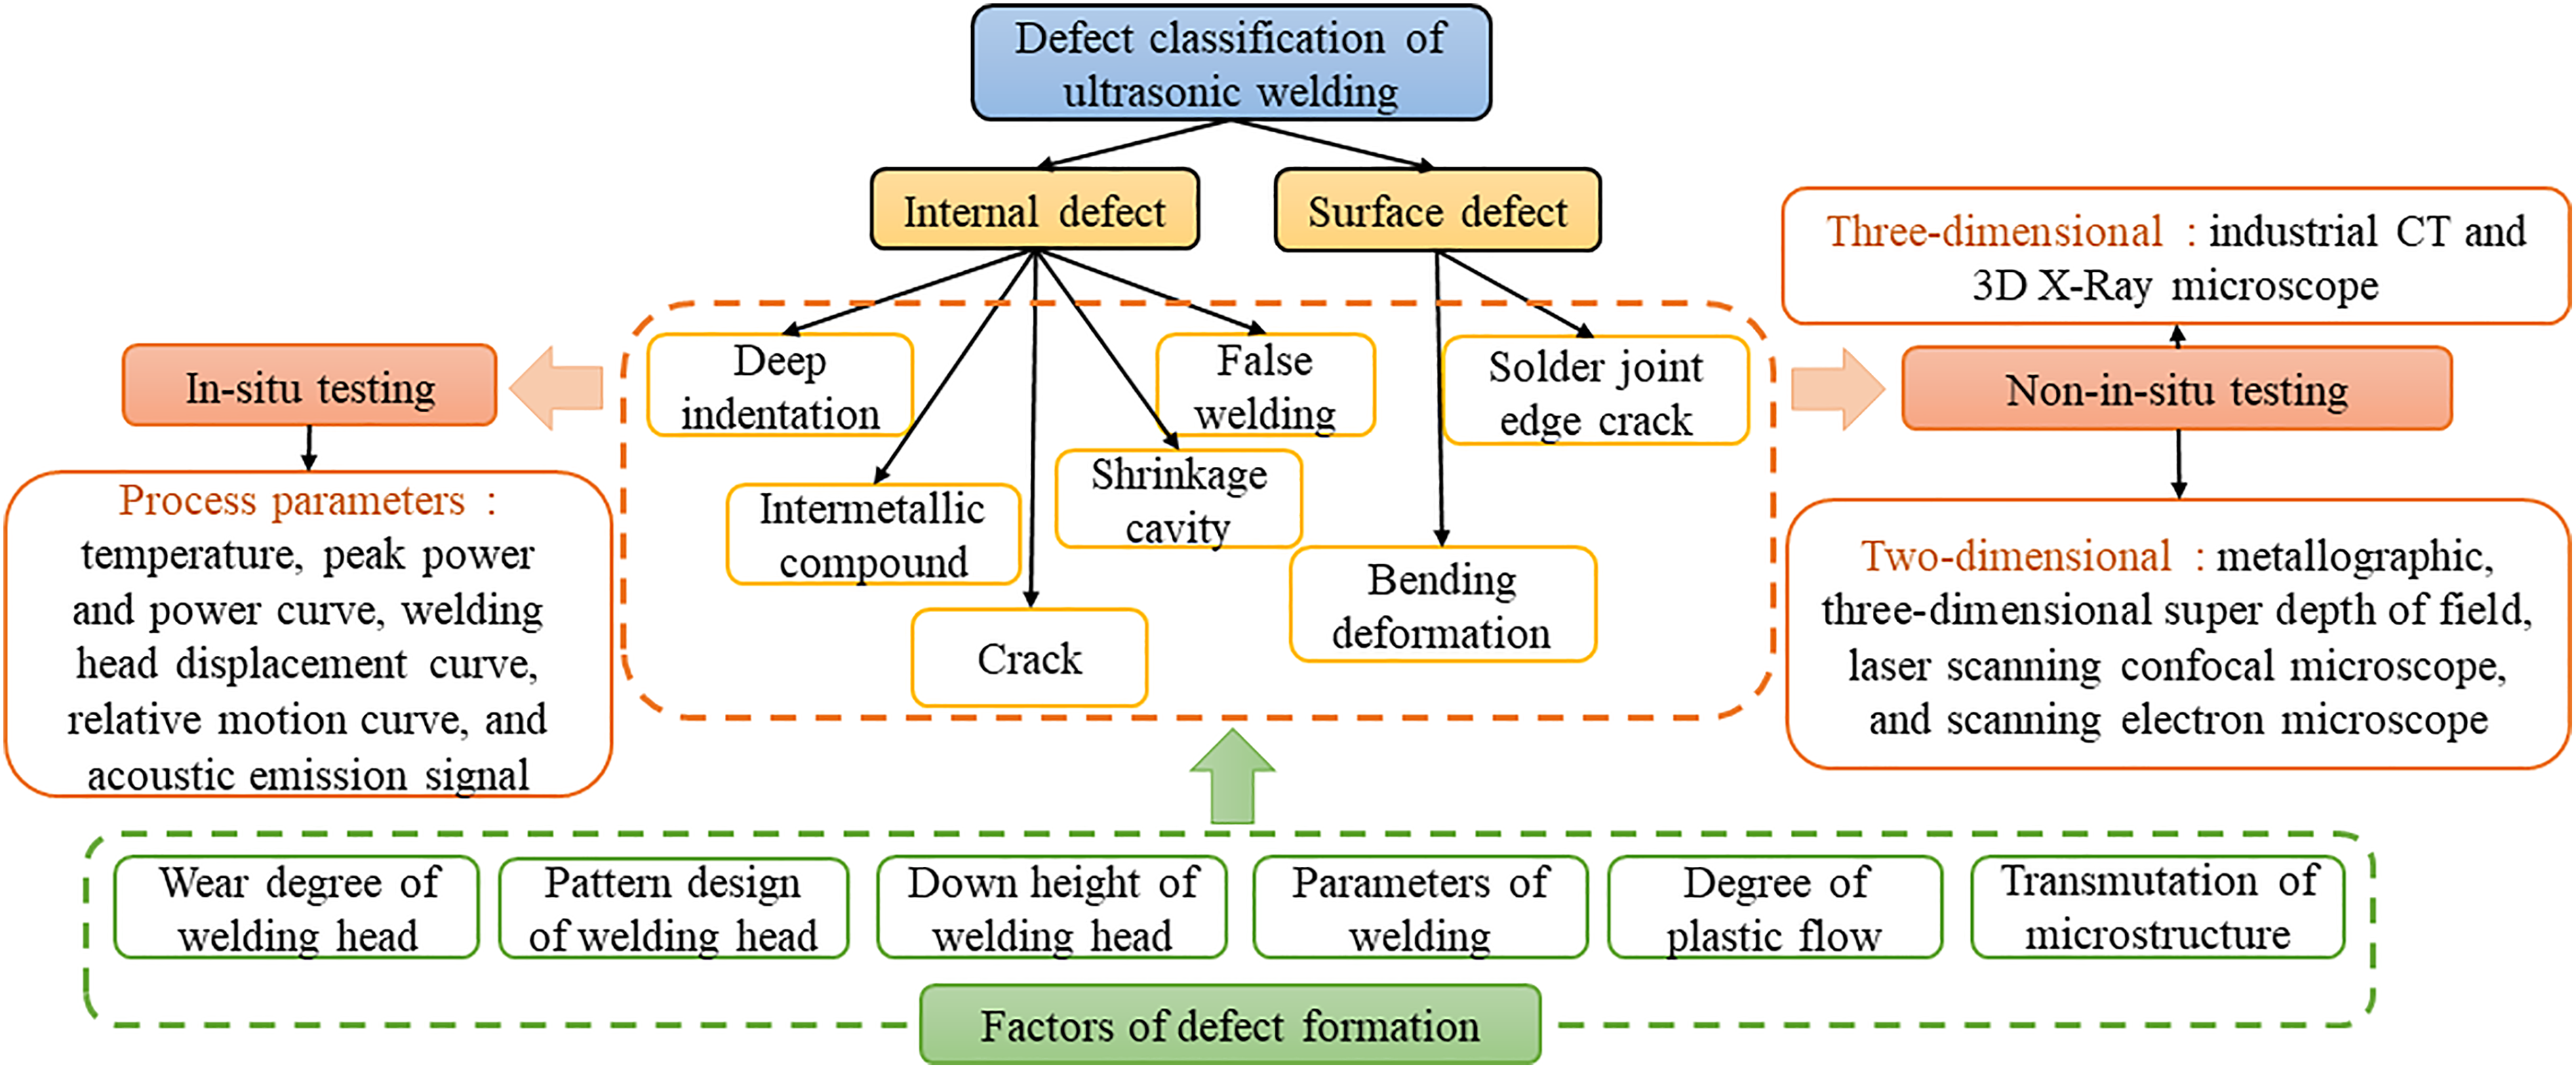
The influence factors, classification and detection methods of ultrasonic welding defects.
This paper summarises the previous quality monitoring of welded joints in ultrasonic metal welding, including in-situ testing (on-line monitoring), non-in-situ testing and non-destructive testing of ultrasonic welding and compares prediction accuracy of joint quality by different machine learning models, based on which, the future development trend of this field is put forward.
In-situ testing
Among all the factors that can impact the quality of ultrasonic metal welding, some cannot be controlled manually, such as the oil stain on the specimen surface, the contact state of the joining surface, etc., which leads to the fluctuation of the weld quality of the specimen even when the process parameters, such as welding energy (time), welding pressure (WP), amplitude and surface appearance of sonotrode, are set the same. The most intuitive monitoring method in assessing weld quality of specimens is to use non-in-situ testing to characterise the performance and interface connection quality of welded joints. However, most of such tests are destructive, which entails long inspection period and impossibility of monitoring the weld quality in real time. That's why studying weld quality monitoring by in-situ testing is very important to the application of ultrasonic medal welding.
According to the process data, the current in-situ testing can be divided into five categories, namely the acquisition of signal movement related to sonotrode, identification of equipment status and online monitoring, power signal acquisition, welding process exothermic change acquisition and acoustic emission signal acquisition.
Displacement signal of horn
The acquisition of signal for ultrasonic sonotrode can be divided into two types: the first is to collect and analyse only the signal of sonotrode displacement to obtain its movement process in the clamping direction, while the second is to collect and compare the displacement signal of sonotrodes, upper specimen and lower specimen simultaneously. The ultrasonic welding process can be summarised into the following stages of prepressing, welding and maintaining. In the stage of prepressing, the sonotrode is pressed down; in the stage of welding and maintaining, the sonotrode vibrates, with the sonotrode displacement and maintaining time being different in different stages. The lowest point to which the sonotrode is pressed down can reflect the thickness of the specimen after welding, thus showing the weld quality. Thus, the displacement of sonotrode is of great importance to the division of ultrasonic welding stage and the monitoring of weld quality.
Lee et al. 41 used a linear variable differential transformer (LVDT) to measure the displacement curve of sonotrode in the clamping direction. The material compaction is closely related to the weld quality and can influence the sonotrode displacement curve. Therefore, they obtained the material compaction amount through the displacement curve to represent the post-weld thickness and build the relations with the weld quality, providing physical evidence of the effects of process conditions on weld quality. It also provided a theoretical underpinning for later usage of sonotrode displacement as a process parameter to explore the ultrasonic weld quality. Ma and Zhang 58 studied the relationship between the displacement curve of sonotrode in the clamping direction and plastic deformation and welding qualities and explored the influence of welding parameters on the displacement curve. It is proposed by them that the displacement rate, the slope of the displacement-time curve, could be used to monitor the weld quality, as shown in Figure 2. When the displacement rate is smaller than 370 μm/s over a long period of time, the welding energy is insufficient. The bond density is used to characterise the weld quality, while the plastic deformation is calculated by the finite element model. The displacement curve is also divided into three stages accordingly. In the third stage, plastic deformation and heat generation lead to recrystallisation. If the displacement curve exists in all of the three stages, the weld quality is thus considered strong. Based on the displacement curve under different amount of pressure and amplitude shown in Figure 2(a) and (c) and the corresponding displacement rate curves shown in Figure 2(b) and (d), when the pressure and amplitude increase, the displacement curve and displacement rate show better performance. In real ultrasonic metal welding process, excessive pressure and amplitude will, however, cause over-welding, worsening the weld qualities. Therefore, the judgment of the welding qualities by the displacement curve only will lead to inaccuracies.
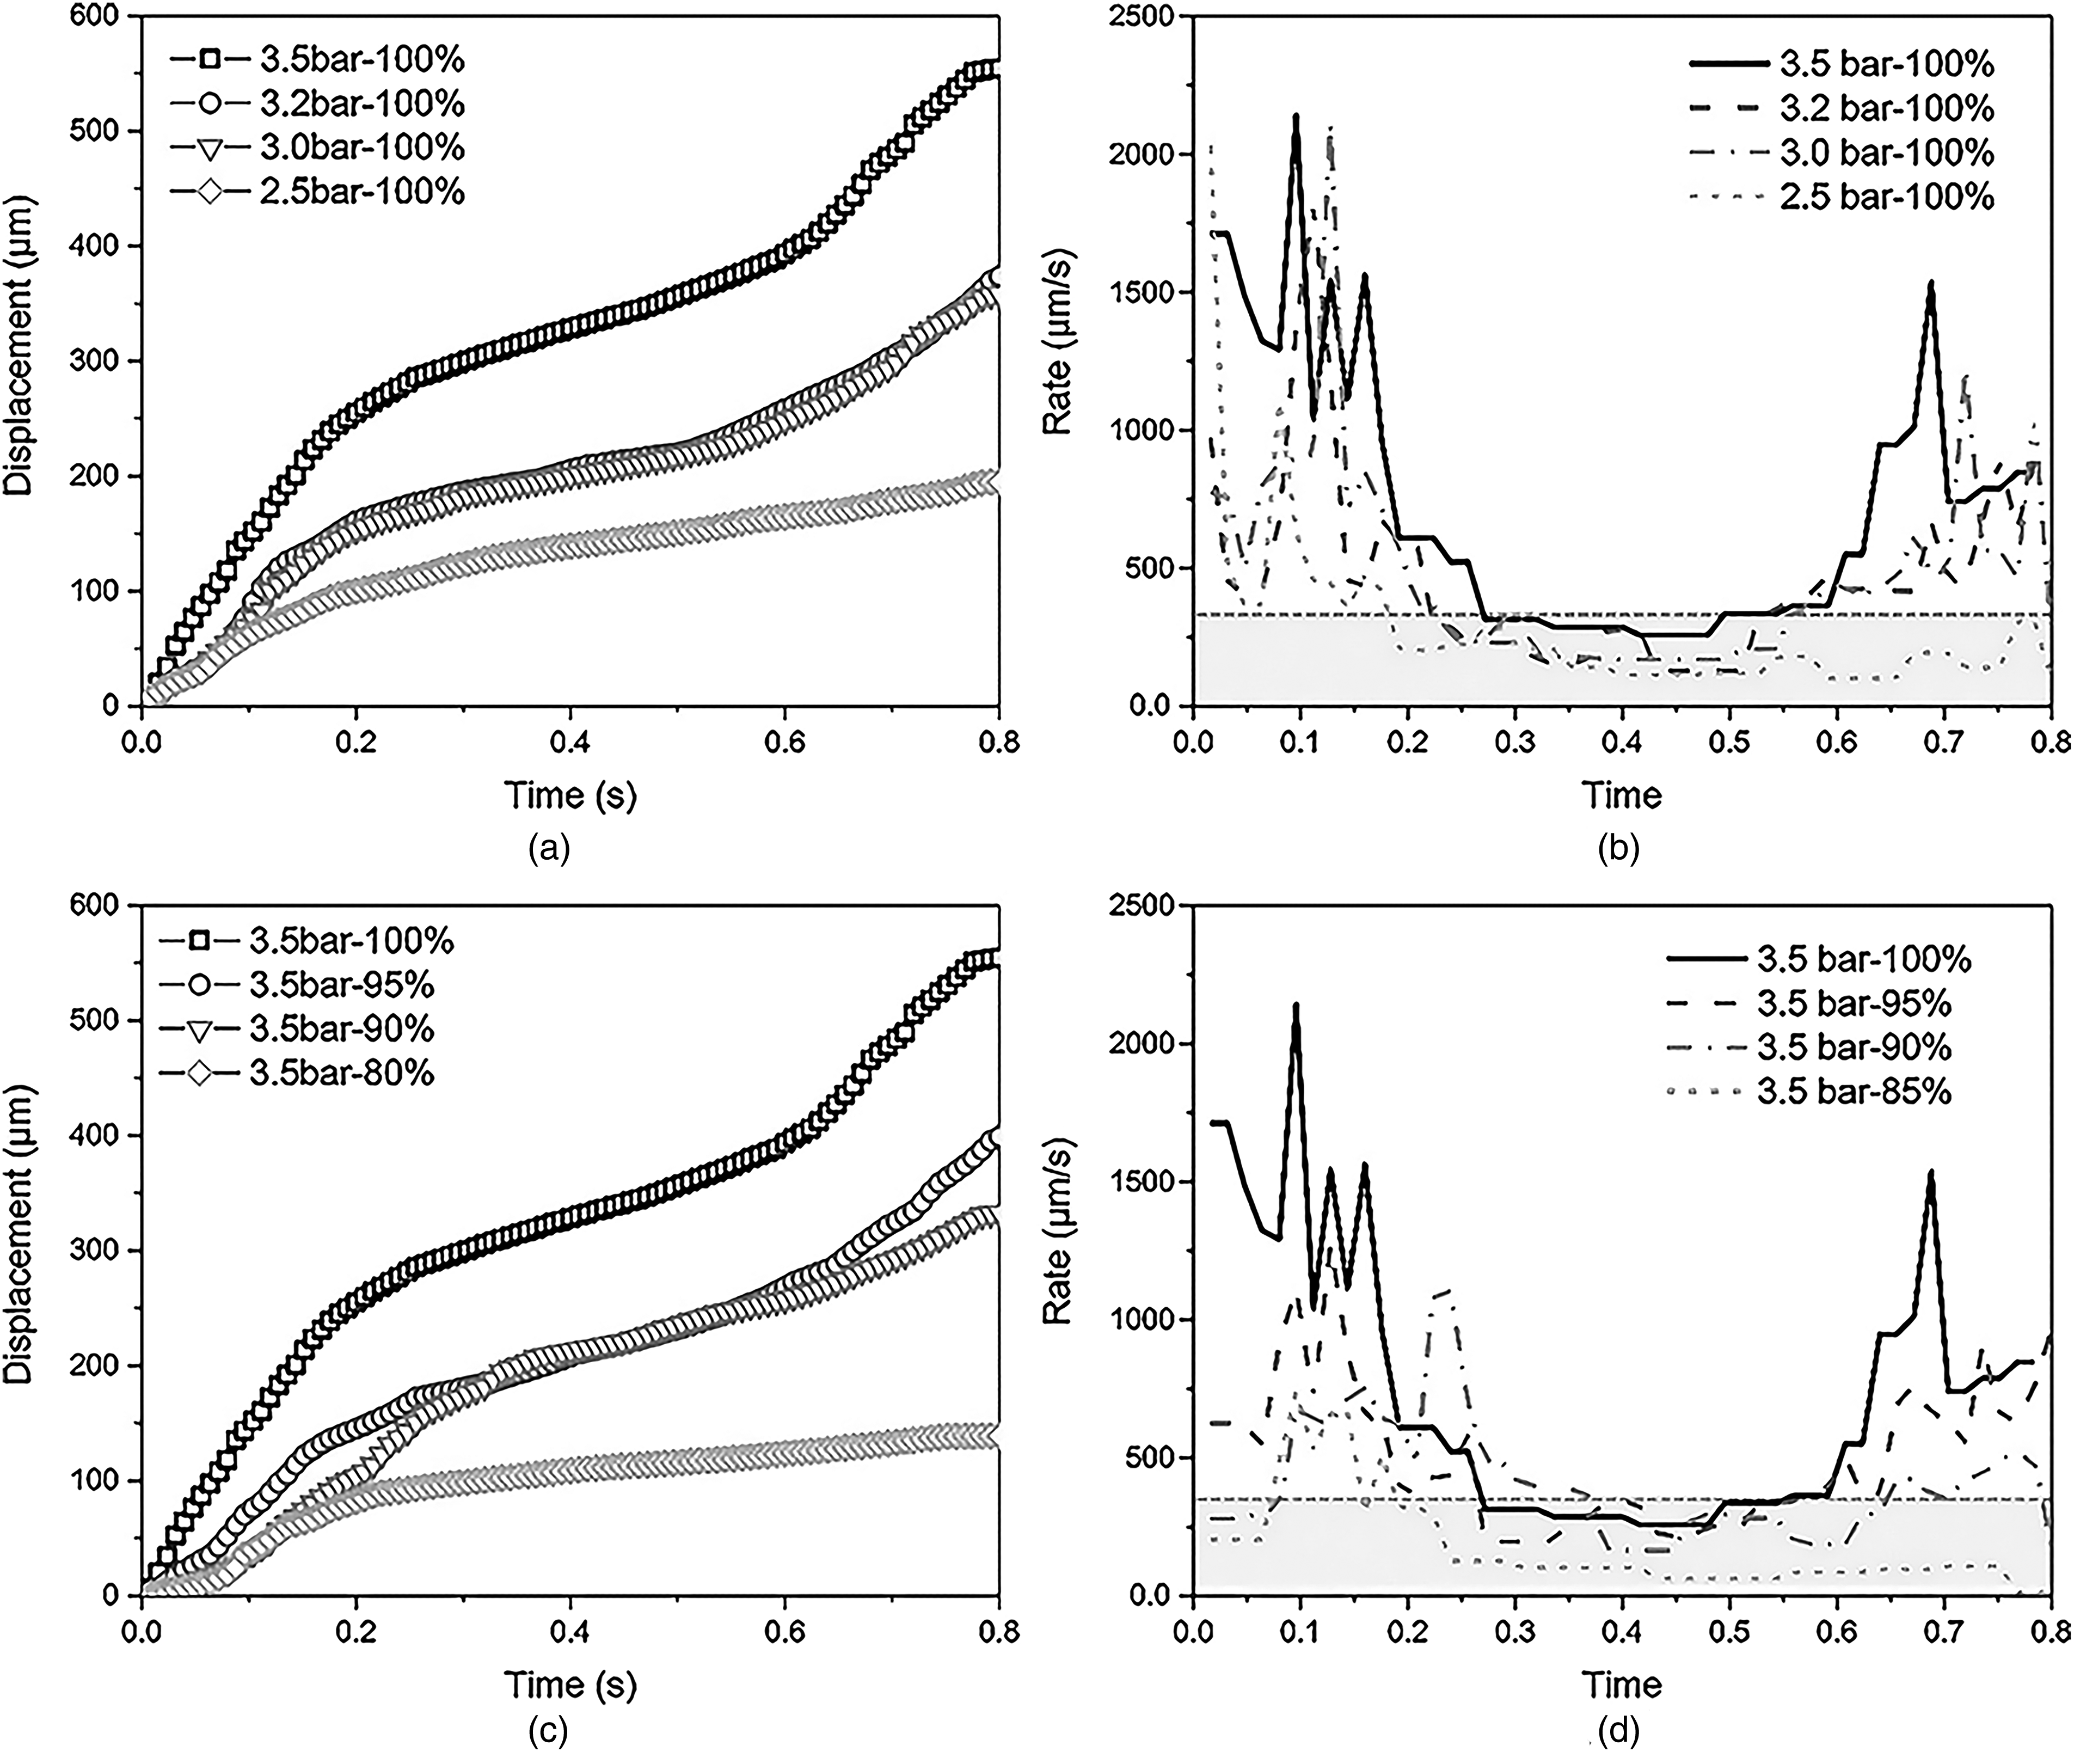
Displacement and displacement rate curves of the horn under different pressures and amplitudes: (a) displacement–time curves at different pressures, (b) displacement rate at different pressures, (c) displacement–time curves at different amplitudes and (d) displacement rate curves at different amplitudes. 58
Sasaki et al. 59 used a high-speed camera to observe and analyse the relative motion in ultrasonic welding. The subset image with discernibility on the welding tip, upper specimen and lower specimen to figure out their displacement curves through related calculations. However, the high-speed camera can only capture the relative motion of the welding process in 600 ms. When the time exceeds the range, the image will become out of focus. Additionally, different kinds of welding workpieces with different attributes may cause different subset image selection areas. Therefore, it is difficult to use this method to detect the weld quality of large-batch specimens. D.R. Foster et al. 60 performed in-situ velocity measurements in the direction of vibration on the sonotrode, welding foil and substrate using a photonic Doppler velocimetry (PDV). The frequency of motion is acquired by PDV, and then the signal is converted by Matlab, finally creating a velocity profile. The test results of in-situ velocity curve show that there is no phase difference between the welding foil and the sonotrode, and they are close in phase angle. There is, however, differences in phase data between the substrate and the welding foil, which can be characterised to determine whether they are successfully bonded. As shown in Figure 3(a), the constantly different phase angle between the welding soil and the substrate indicates unsuccessful bonding. When the phase angle curve of the substrate almost coincides with the welding foil and intersects with the sonotrode at 0.34 s, as shown in Figure 3(b), bonding is successful. Research results on related topic show that the phase angle is used to investigate whether the joint has obvious welding features, providing a new insight into in-situ monitoring of ultrasonic welding. However, monitoring of weld quality is not reflected in detail. To optimise parameter and achieve online weld quality monitoring, other parameters should be included and a larger amount of data will be created.
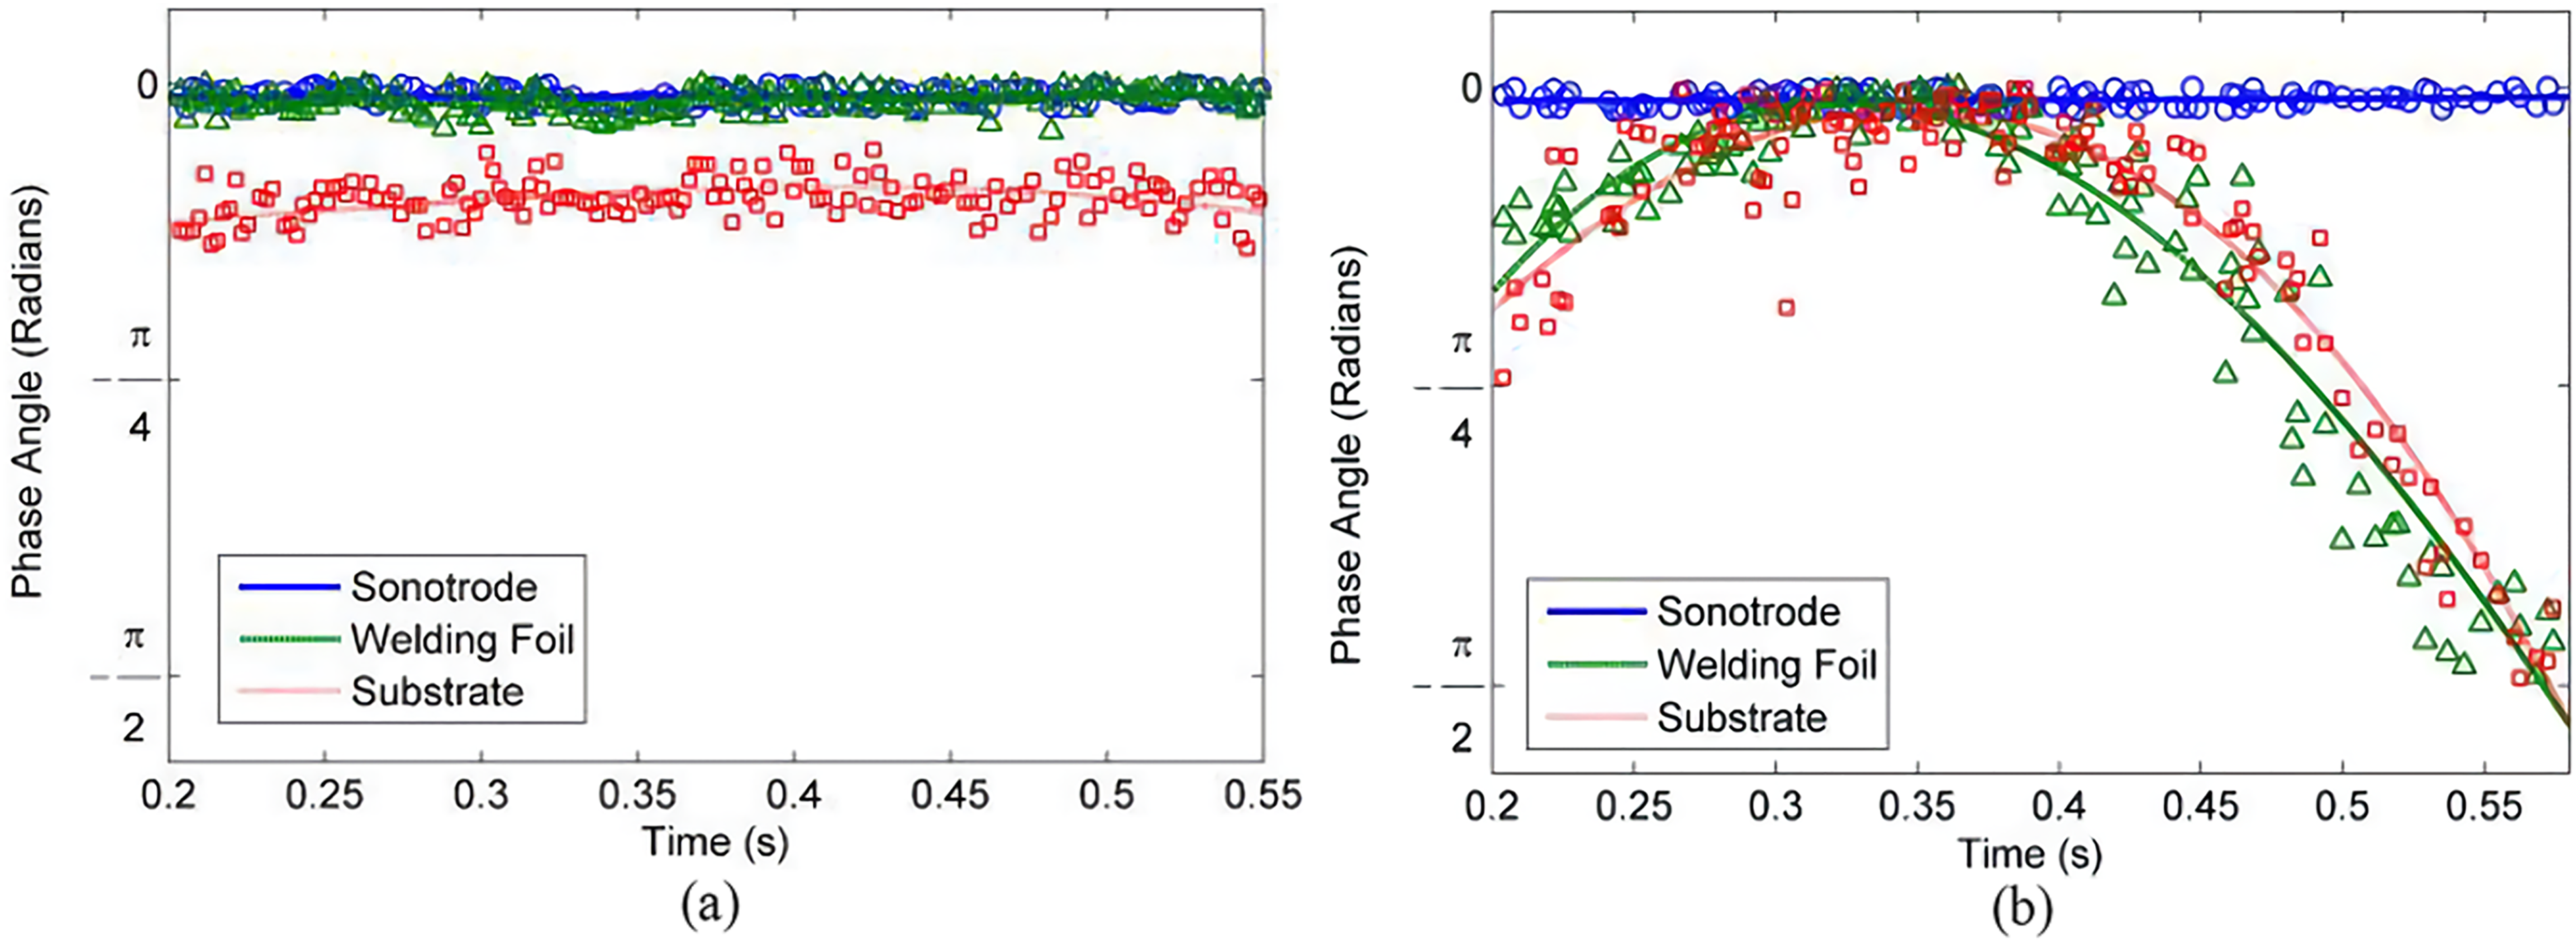
Phase angle curve with time: (a) an unsuccessful consolidation pass and (b) a successful consolidation pass. 60
Identification of tool state and online monitoring
In ultrasonic metal welding, the state of horn and anvil can significantly impact the weld quality. The establishment of online tool condition monitoring (TCM) system can facilitate timely maintenance and replacement of workpieces, so as to reduce the impact on the weld quality. TCM techniques can be generally divided into two groups, namely direct and indirect methods, and indirect online TCM has greater advantages in reducing production downtime and cost.
Shi et al. 61 explored the impact of different screw looseness on the state of welding machine, mainly in the change of welding power, time and anvil acceleration signal during welding. The acceleration signal of the anvil is obtained through the acceleration sensor fixed on the anvil. Related research shows that the impact of screw loosening on welding power and time is not obvious, and it is difficult to identify the state of the anvil through its output signal. Therefore, the characteristic signal IMF3, which represents the state of the anvil, is finally acquired from the acceleration signal by the signal decoupling method, as shown in Figure 4. When the abnormal state occurs – the energy ratio of IMF3 increases and exceeds 20%, the anvil is extremely unstable and the online monitoring of the anvil state is realised. However, the state identification of the anvil only restricts to the detection of the equipment state, and using the characteristic signal to judge the weld quality of the workpiece is too one-sided.
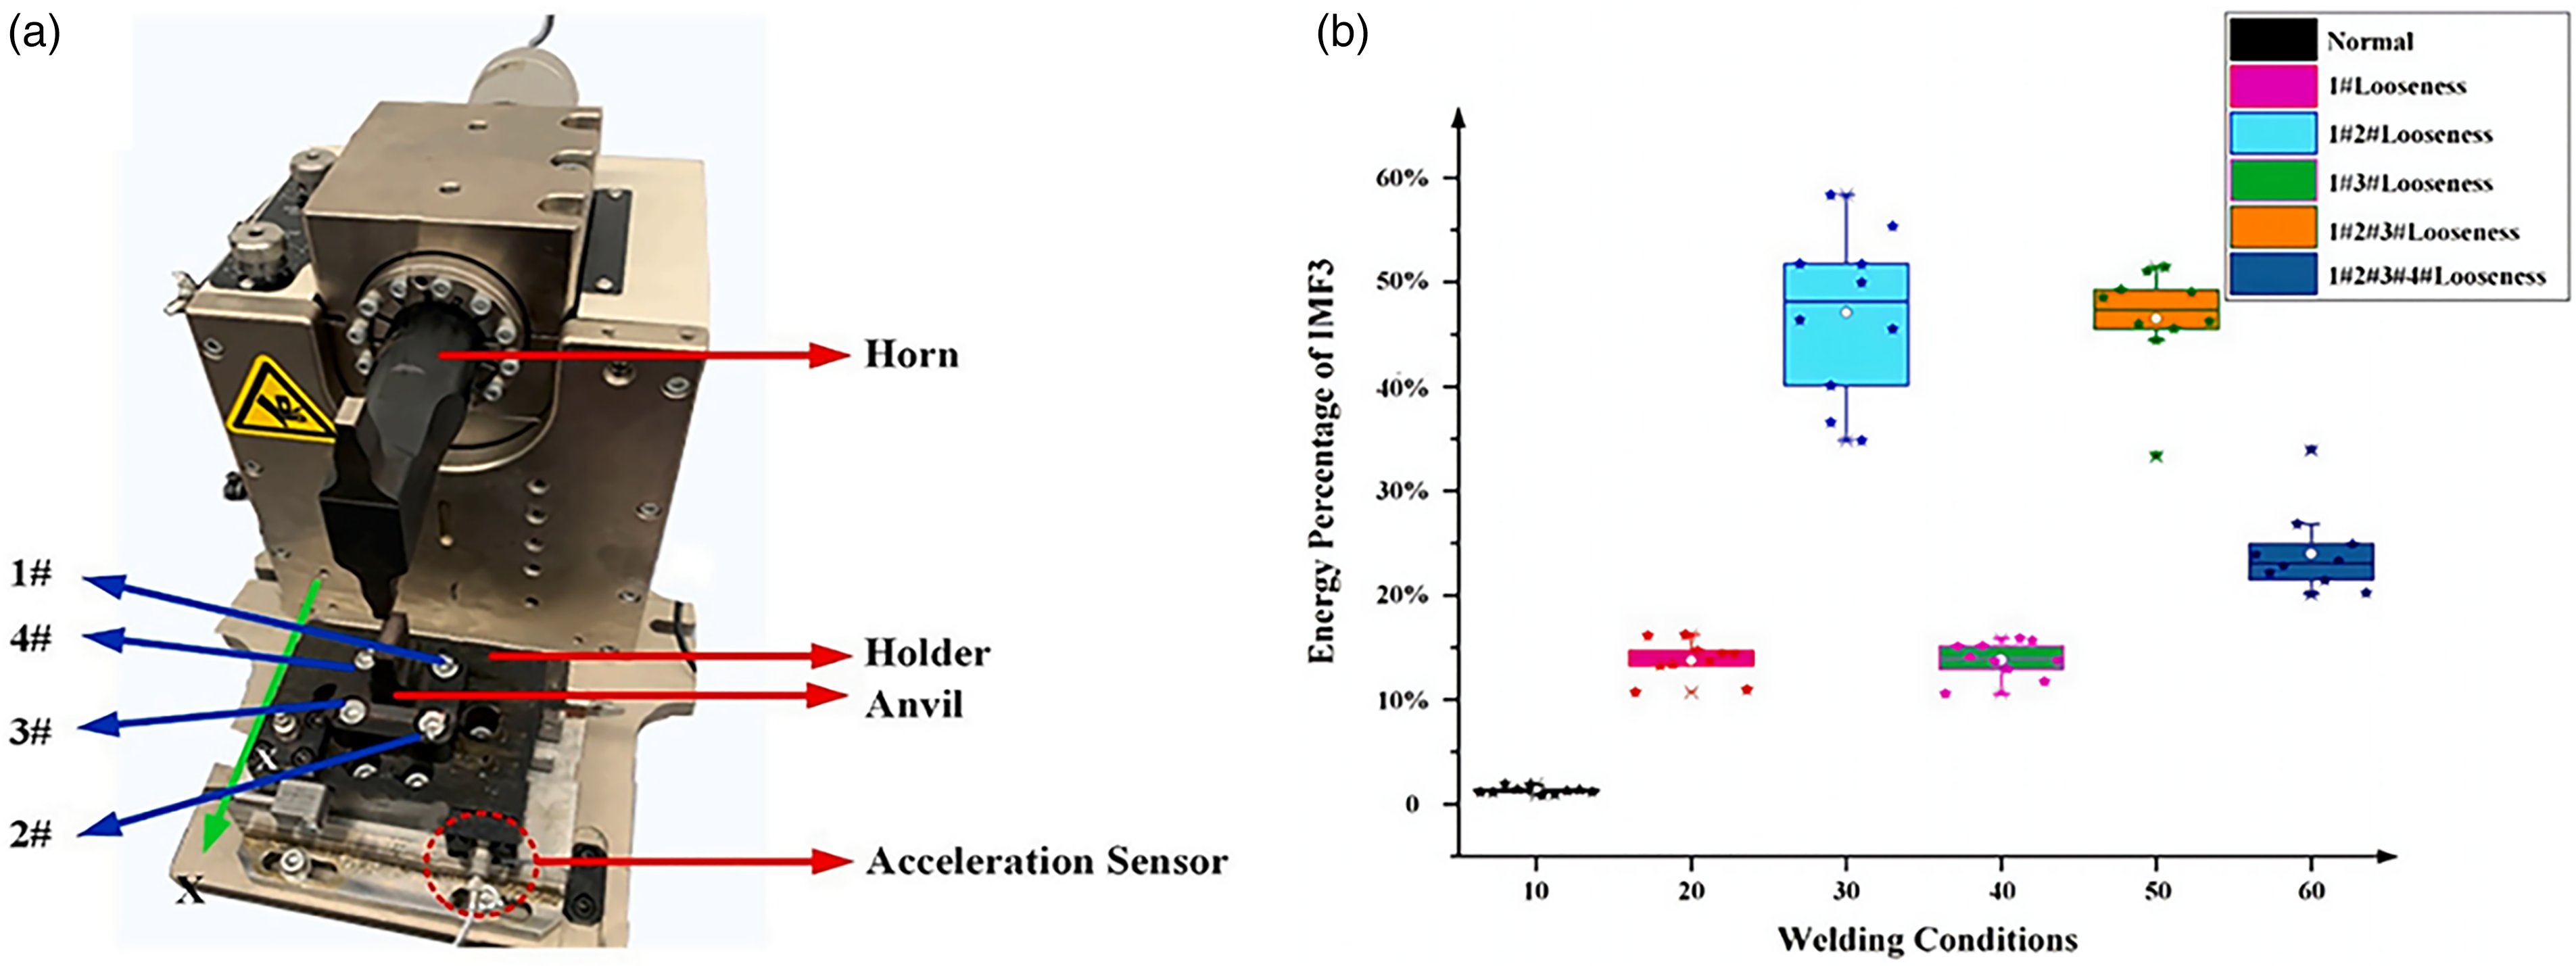
The statistical results of IMFs: (a) the anvil state monitoring experiment system of ultrasonic metal welding and (b) energy percentage of IMF3 in different welding situations. 61
Nazir and Shao 62 tried to collect power signals, horn displacement signals, sound signals and acoustic emissions signals to achieve online monitoring of horn and anvil wear, such as shown by Figure 5. The results show that displacement, power and sound signals have poor stability with tool wear, and the features of acoustic emissions signal are not obvious. In a word, the basic purpose of the online TCM system is to reflect the running status of the equipment, and its effects on reflecting the quality of the specimens are not significant.
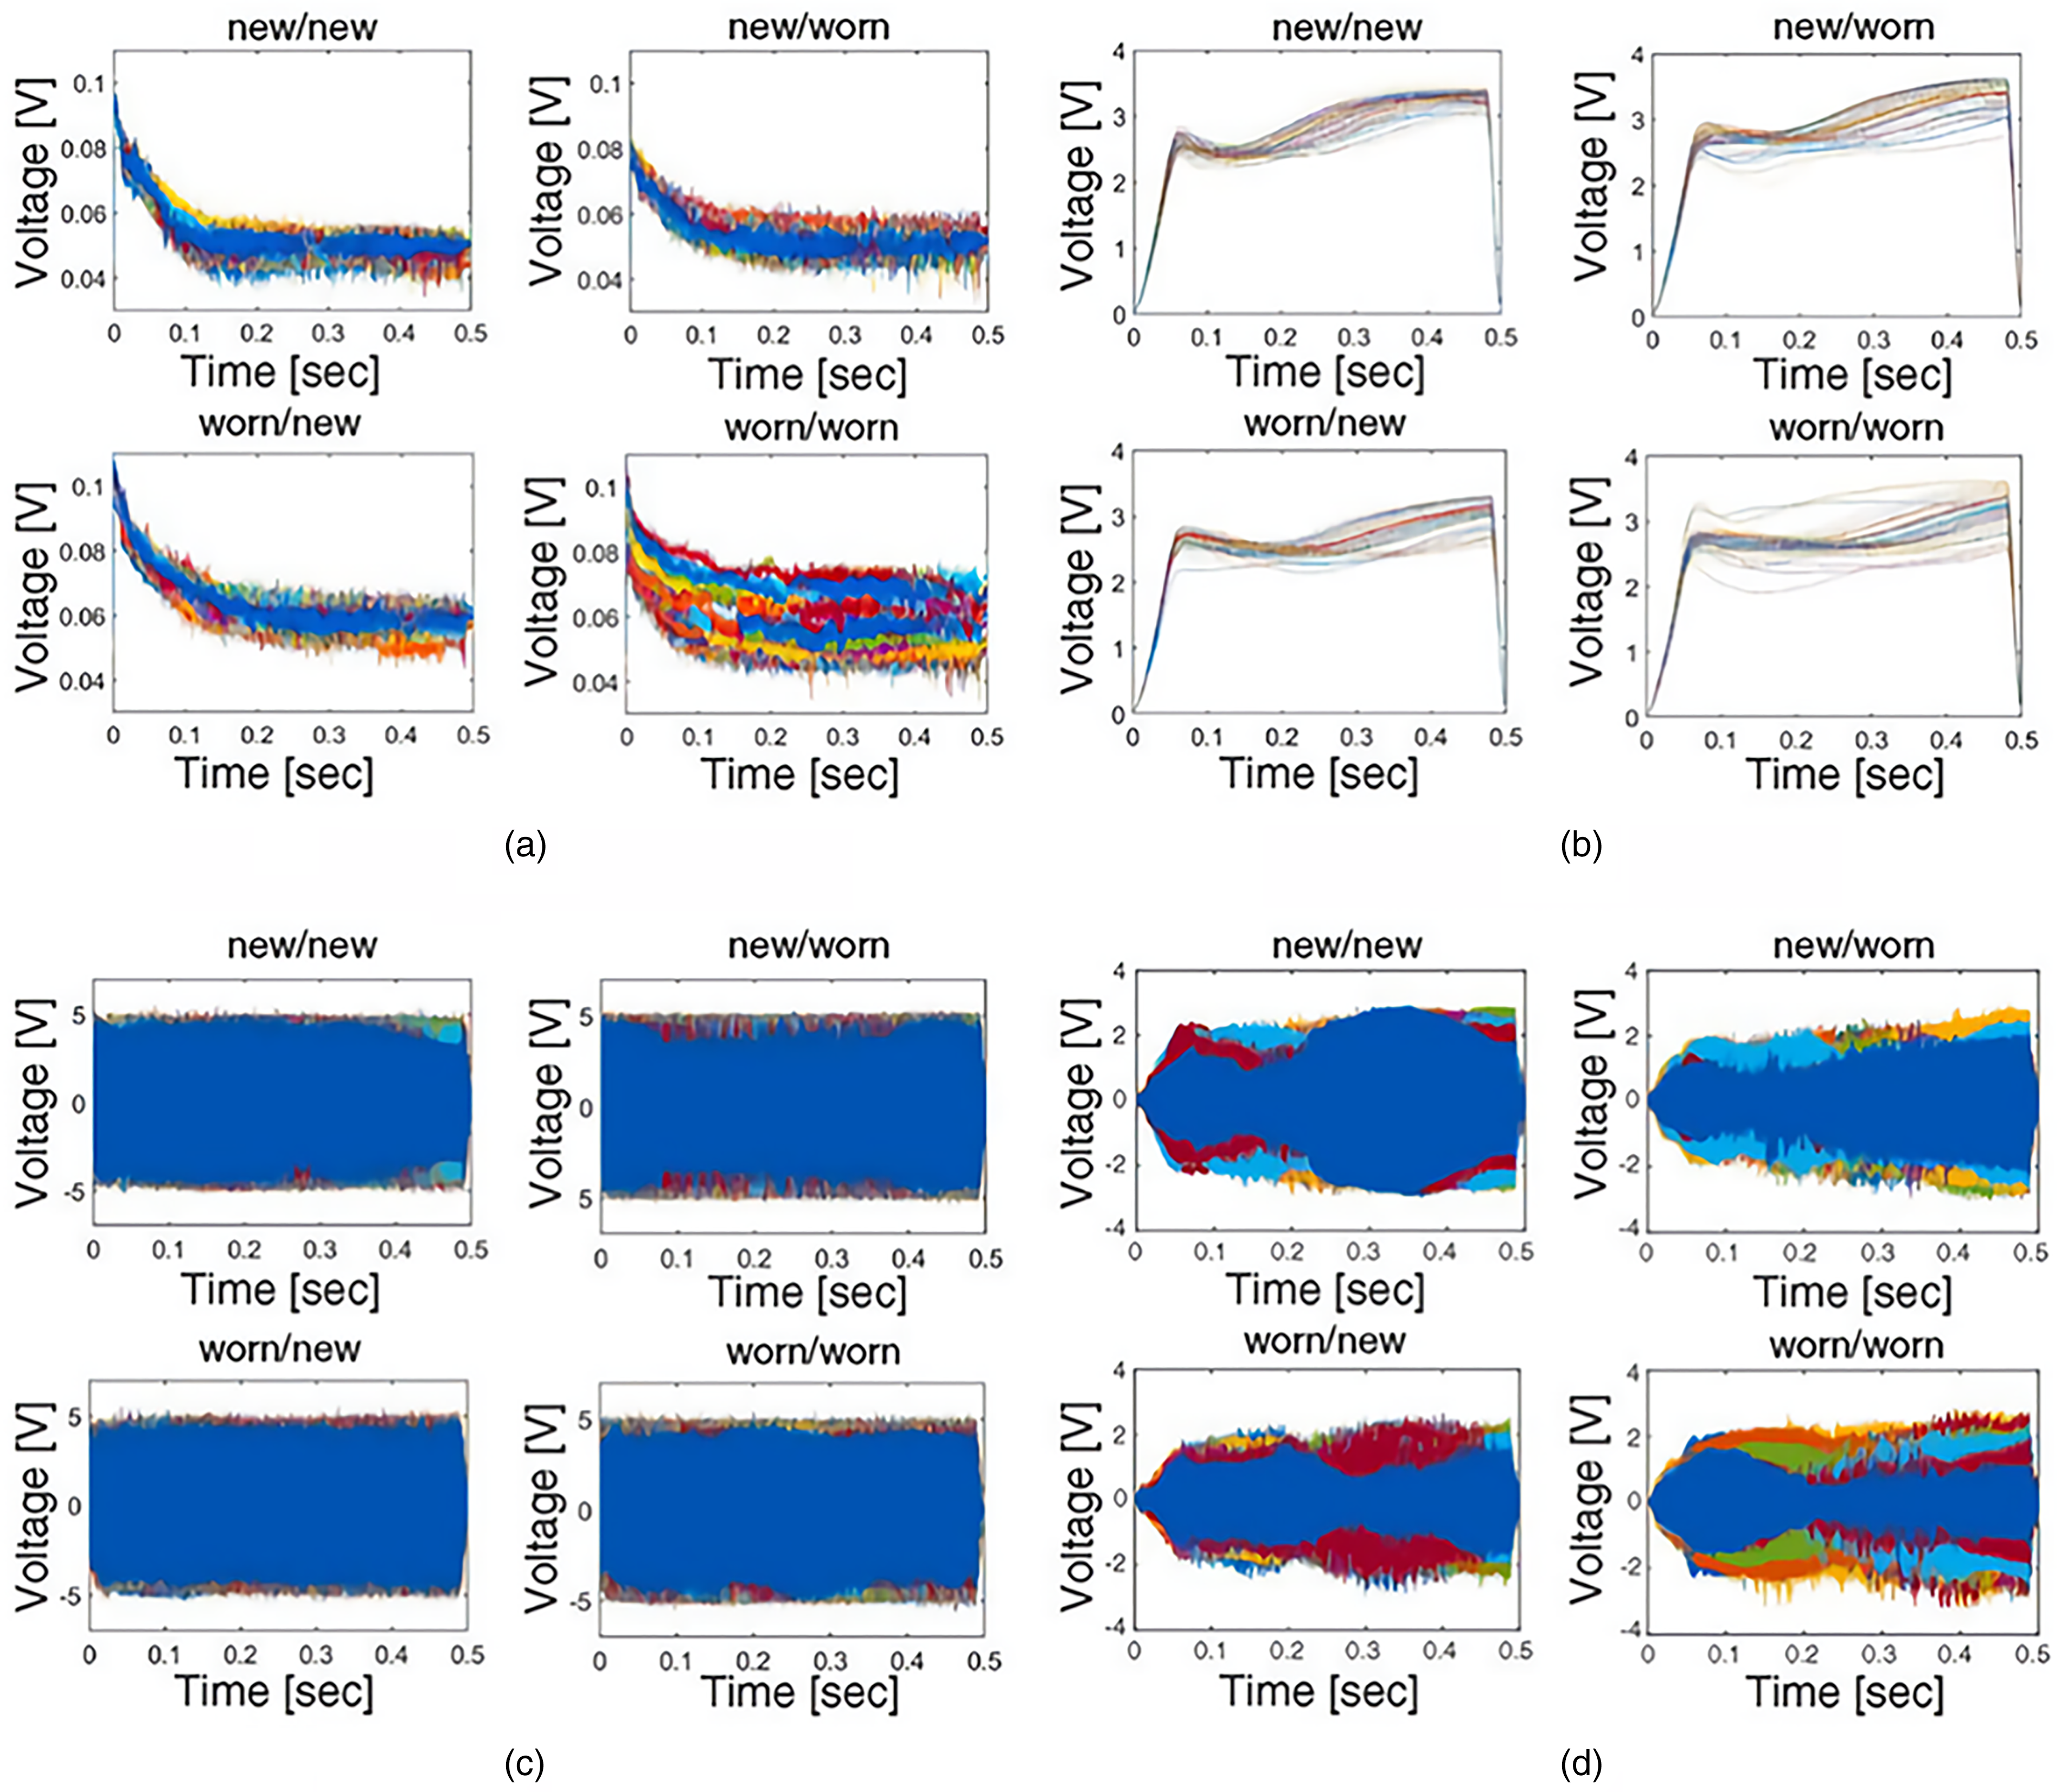
Raw sensing signal of the tool states horn/anvil:(a) displacement signals, (b) power signals, (c) acoustic signals and (d) acoustic emission signals. 62
Power signal identification
Lee et al.
41
defined the power of ultrasonic welding as

Variation of power signal. 41
Mongan et al. 58 adopted the peak power as the negative feedback parameter to adjust the machine learning model and predict the ultrasonic weld quality. A genetic algorithm-artificial neural network (GA-ANN) is adopted to improve the prediction accuracy. As a welding method that is sensitive to all factors, adding process parameters to ultrasonic welding is vital in the machine learning model where ideal parameters are used to predict.
Temperature signal collection
Li et al. 63 used micro-thin-film thermocouples (TFTC) and thin film thermopile (TFTP) arrays to monitor changes in heat flux during welding. Through the change of heat flux curve, the ultrasonic welding process is divided into three distinct stages, that is, friction heating, plastic work and diffusion bonding stages. As a result, the understanding of welding process is further deepened. However, in this monitoring method, the sensor is deposited on the workpiece, which destroys its integrity and increases the instability of the welding process.
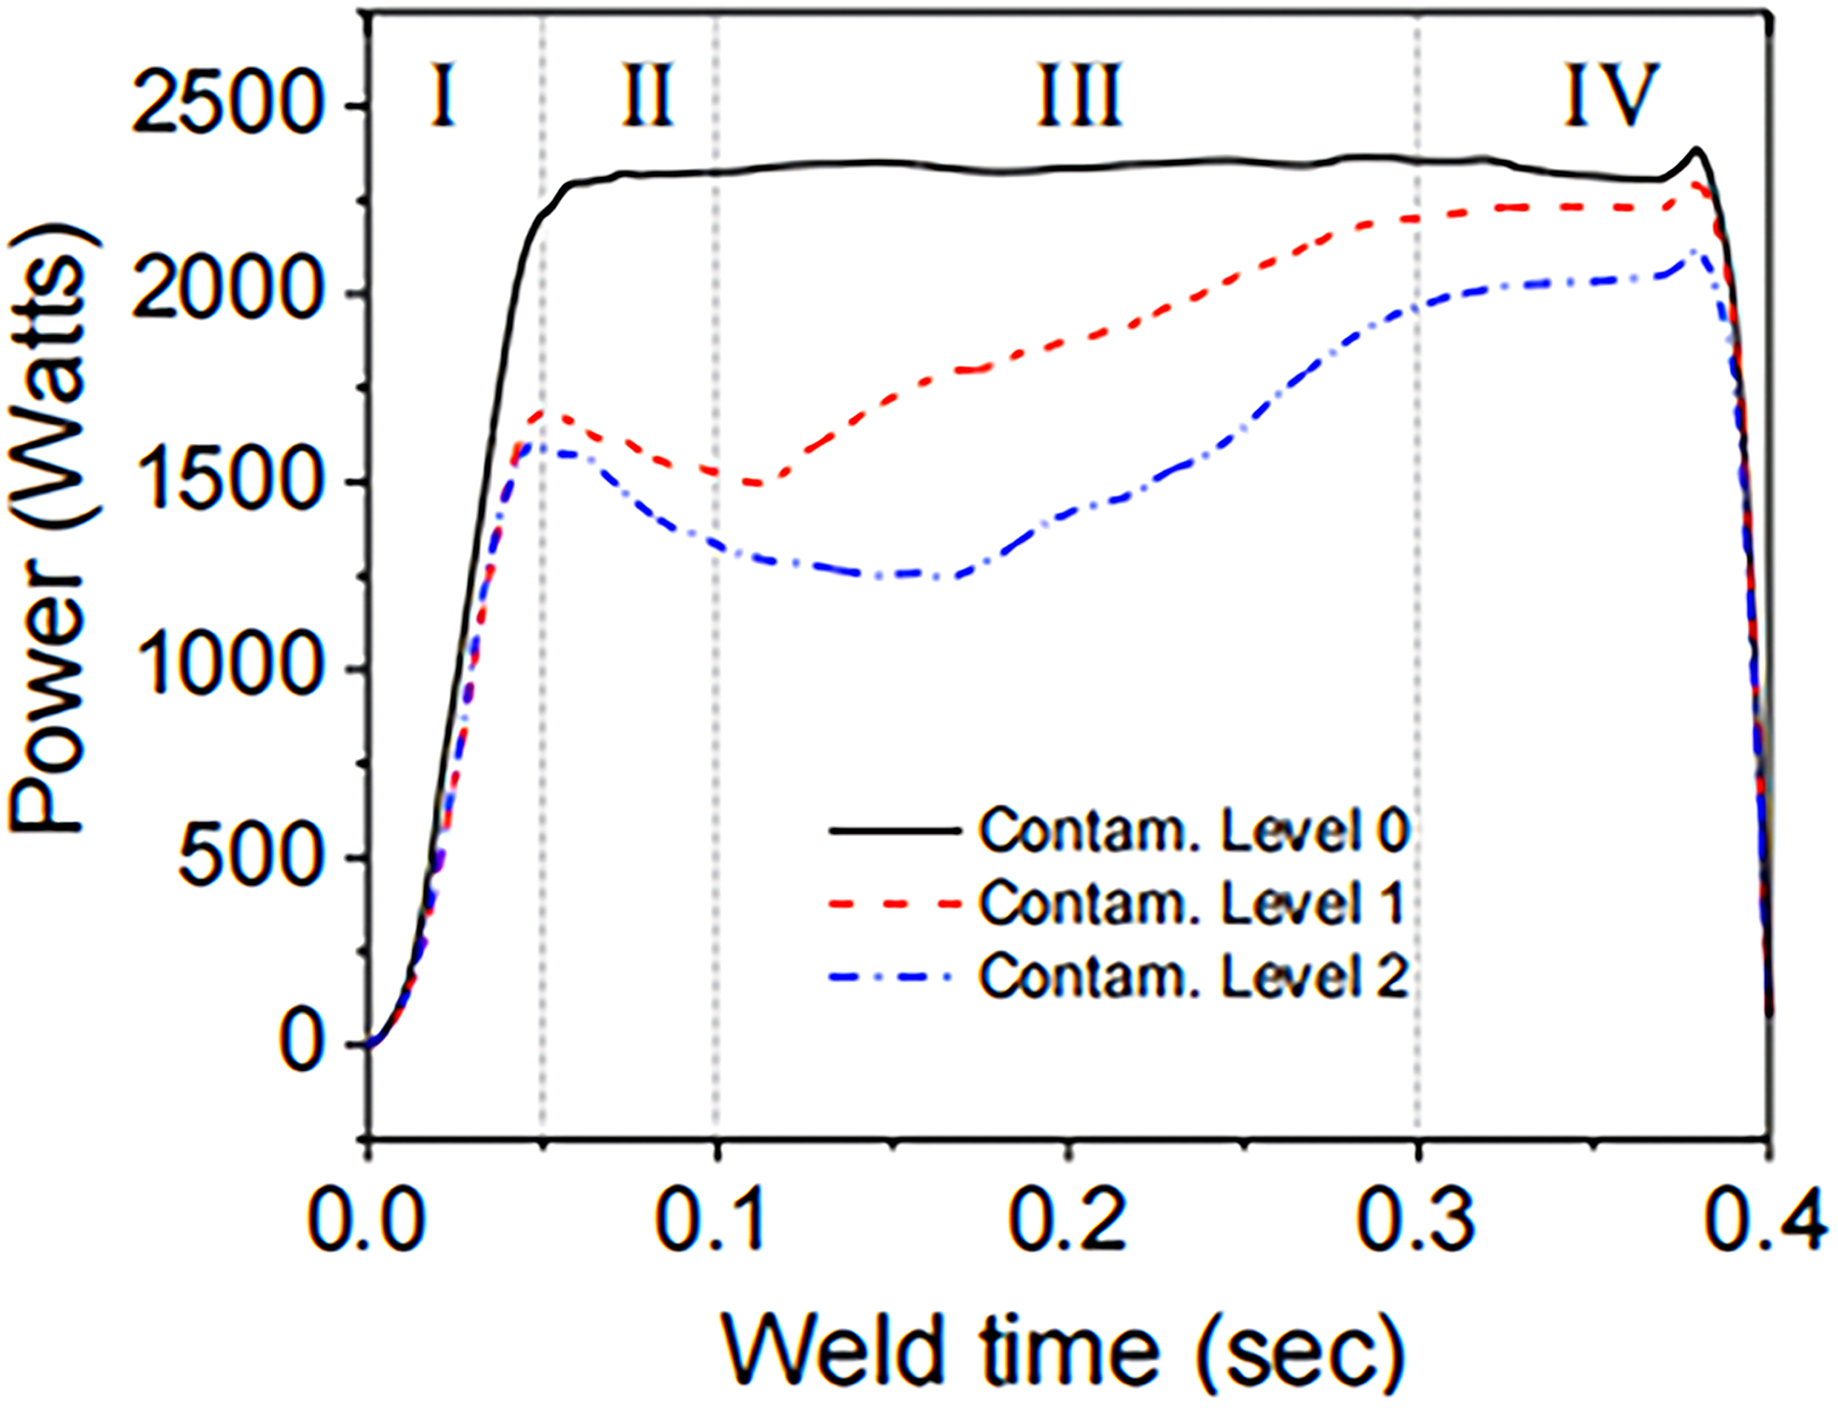
Apart from obtaining temperature data in welding process by thermocouples, infrared temperature measurement devices can be used to monitor the real-time change of temperature field in welding. Deposited outside the welding system, the device is independent of the welding system to avoid interactive influence on the welding process. Shin et al. 64 used infrared thermometer to measure the ultrasonic welding process of dissimilar metal joints, such as copper with copper and copper with aluminium. The experiment shows that the material, thickness and different lapping modes (such as the switch of upper and lower plates) on the workpiece will impact the temperature curve. Feng et al., 65 used infrared temperature measurement to conduct real-time temperature monitoring of ultrasonic welding process of high porosity open-cell foam and aluminium sheet. The change of obtained temperature field-distribution of the weld interface of the joint and at the edge of the weld interface with the change of energy are shown in Figure 7. Different welding energies lead to different peak temperatures at the edge of the weld interface, but the paths before rising to the peak temperature are similar, that is to say, the magnitude of the welding energy has little influence on the rising rate of the welding process temperature. With the increase of energy, the peak temperature also increases but never exceeds the solution temperature of Al-Cu. Therefore, it can be concluded that no intermetallic compound with high brittleness is produced during welding, which is consistent with the conclusion drawn by Shin.
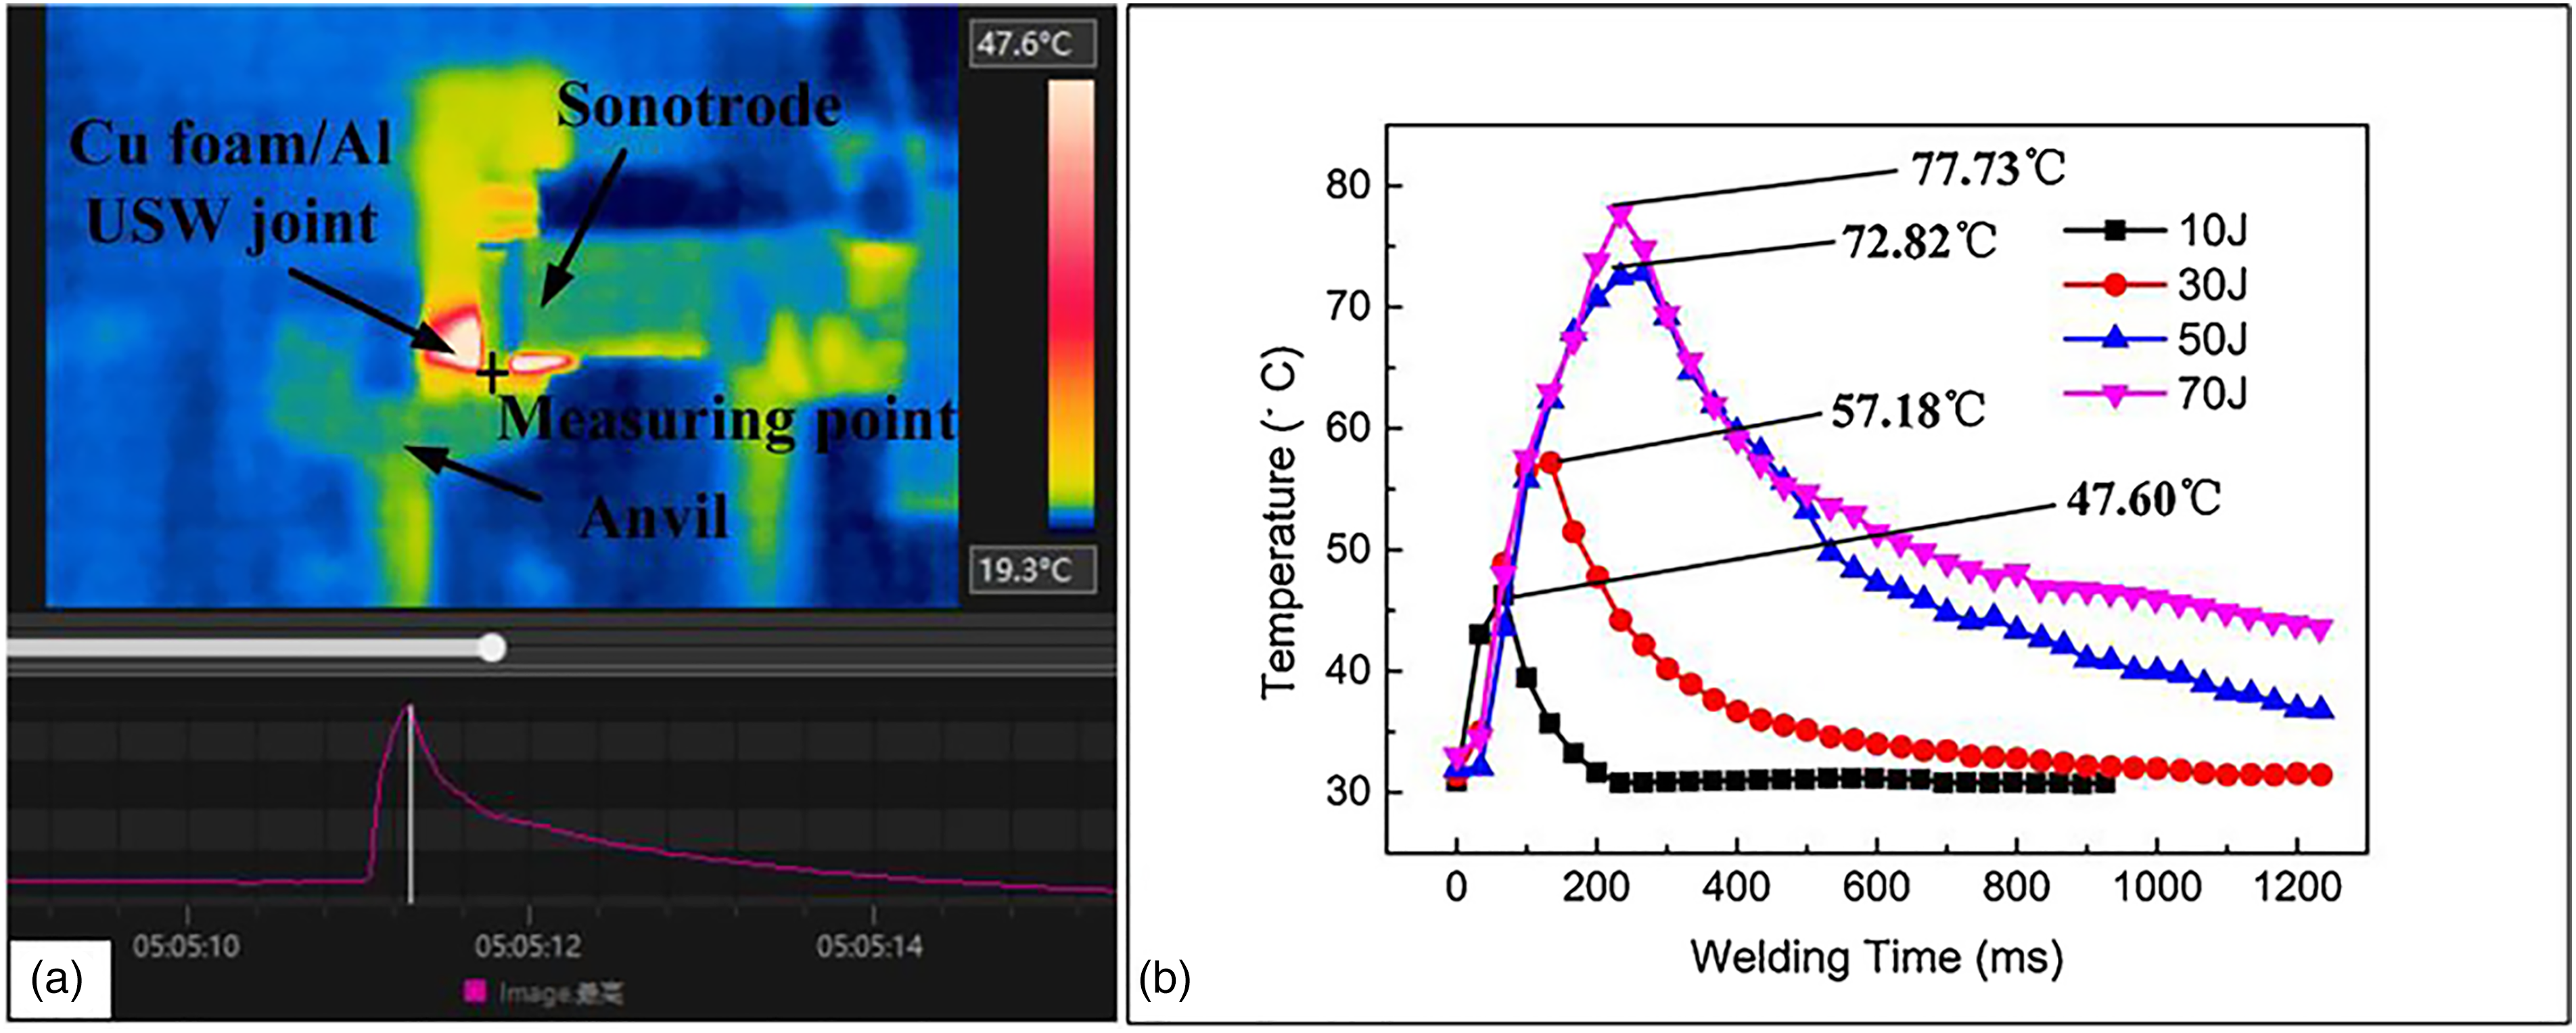
Infrared temperature measurement results of the welding process: (a) real-time infrared temperature-measurement result and (b) temperature change curve of ultrasonic welding interface between Cu foam and Al with 10–70 J weld energy. 65
Multiple factors, such as welding parameters, texture of specimen and size can influence the change of temperature field in the welding process, but previous literature only focused on the temperature to divide the welding stage and made judgements on whether intermetallic compounds exist between different metals through peak temperatures. In future research, more attention should be paid to obtaining the law of change of temperature curve and conducting quantitative analysis of the horns in welding.
Acoustic emission signals collection
There have been very few research results of acoustic emissions signal. In the early stage, Masuzawa et al. 66 tried to acquire the radiating ultrasound during ultrasonic welding of plastic rods to obtain the variation law of load acoustic impedance with time and reflect the welding state. Given that the ultrasonic welding of plastics is very different from the ultrasonic welding of metal, the signal collected in the study cannot be Nazir and Shao 62 collected the acoustic emission signals of ultrasonic welding equipment in different states, but the abnormal condition of the equipment cannot be clearly indicated by certain features. As is shown in Figure 5(d), the combination of horn and anvil wear is less different from the comparison of acoustic emission signals in the unworn state. Based on the results of previous research, the acoustic emission signal may reflect the information regarding welding process in the ideal state. However, it is difficult to extract the features, and the noise situation in the actual production cannot be completely covered, making it very difficult to achieve perfect filtering.
In-situ testing collects process parameters in welding, such as temperature and power. Instead of directly monitoring the time and number of the occurrence of certain defect, the process variables aim to reflect anomalies in the process of welding and make comprehensive judgements on the quality of welding through the comparison of parallel tests. In terms of signal selection in welding, it is an ideal method to use infrared temperature measurement to collect temperature signal and monitor the welding process. The displacement signal cannot identify the over weld, while phase angle curve analysis process is over complicated, so the feature extraction of sound signal and acoustic emission signal is difficult, which cannot be easily achieved in actual production. The power curve can well reflect the surface state of the specimen plate, and thus facilitate the monitoring of weld quality. Therefore, the combination of temperature signal and power curve can be considered in the online monitoring of ultrasonic metal welding. However, in-situ testing cannot monitor the location, quantity and other aspects of a particular defect, and the process parameters need to be processed by mathematical modelling in order to make predictions of weld quality.17,67–71
Non-in situ testing
Ultrasonic metal welding is now widely used in multiple areas, such as battery packaging, automotive and aerospace. It is easy for ultrasonic welding, a solid state welding method, to obtain high-quality and low-resistance joints of dissimilar metals, and is thus widely applied in the field of battery. However, the weld quality of ultrasonic welding is sensitive to welding parameters and is susceptible to many factors. Given that weld defects may lead to the deterioration of overall performance, and the weld window is small, it is difficult to evaluate the quality of weld joints. Compared with the concept of in-situ testing, the non-in-situ testing can directly reflect the weld joint quality, which cannot be replaced by in-situ testing.
Non-in-situ testing is divided into destructive test and non-destructive test based on whether the specimen is damaged. Non-destructive test is also called non-destructive test and can be directly used to evaluate the weld quality.
Mechanical properties of weld joints
The evaluation of mechanical properties of ultrasonic spot welding joint are evaluated in a similar manner to resistance spot welding joint, using equipment and methods that can be referred to welding methods such as fusion welding and other quality assessment systems that have been established. Most scholars test the shear strength and peel strength of ultrasonic spot welding joints through tensile testing machines, so their tensile shear (TS) strength and peel strength test methods are mostly referred to the standards of resistance spot welding. Ultrasonic spot welding TS failure mode is similar to spot welding, which is divided into interface failure mode, button pull-out failure mode and partial interface failure mode. Previous research on the TS strength of ultrasonic welding joints centres mostly on the impact of welding parameters on the TS strength and joint failure mode.
Meng et al. 72 studied the influence of welding parameters on tensile and shear strength of ultrasonic metal welding by machine learning. The trend of change is presented by the response surface method. There are two peak regions of shear strength under the influence of welding time (WT) and welding amplitude, respectively, as shown in Figure 8(a) and (b), a new finding for the determination of shear strength in ultrasonic welding. Previous research results in this respect are mostly linear rise or parabola form of shear strength that are influenced by welding parameters. They also tested the peel strength, the results of which are shown in Figure 8(c) and (d). When the shear strength and peel strength reach the peak value, the corresponding welding parameters belong to two intervals, indicating that the monitoring of weld quality can not only depend on a single property. Therefore, the research on the optimum value of shear strength and peel strength in ultrasonic metal welding and how to select a suitable parameter to achieve the optimum value of both shear strength and peel strength will become the research focus of future process optimisation.
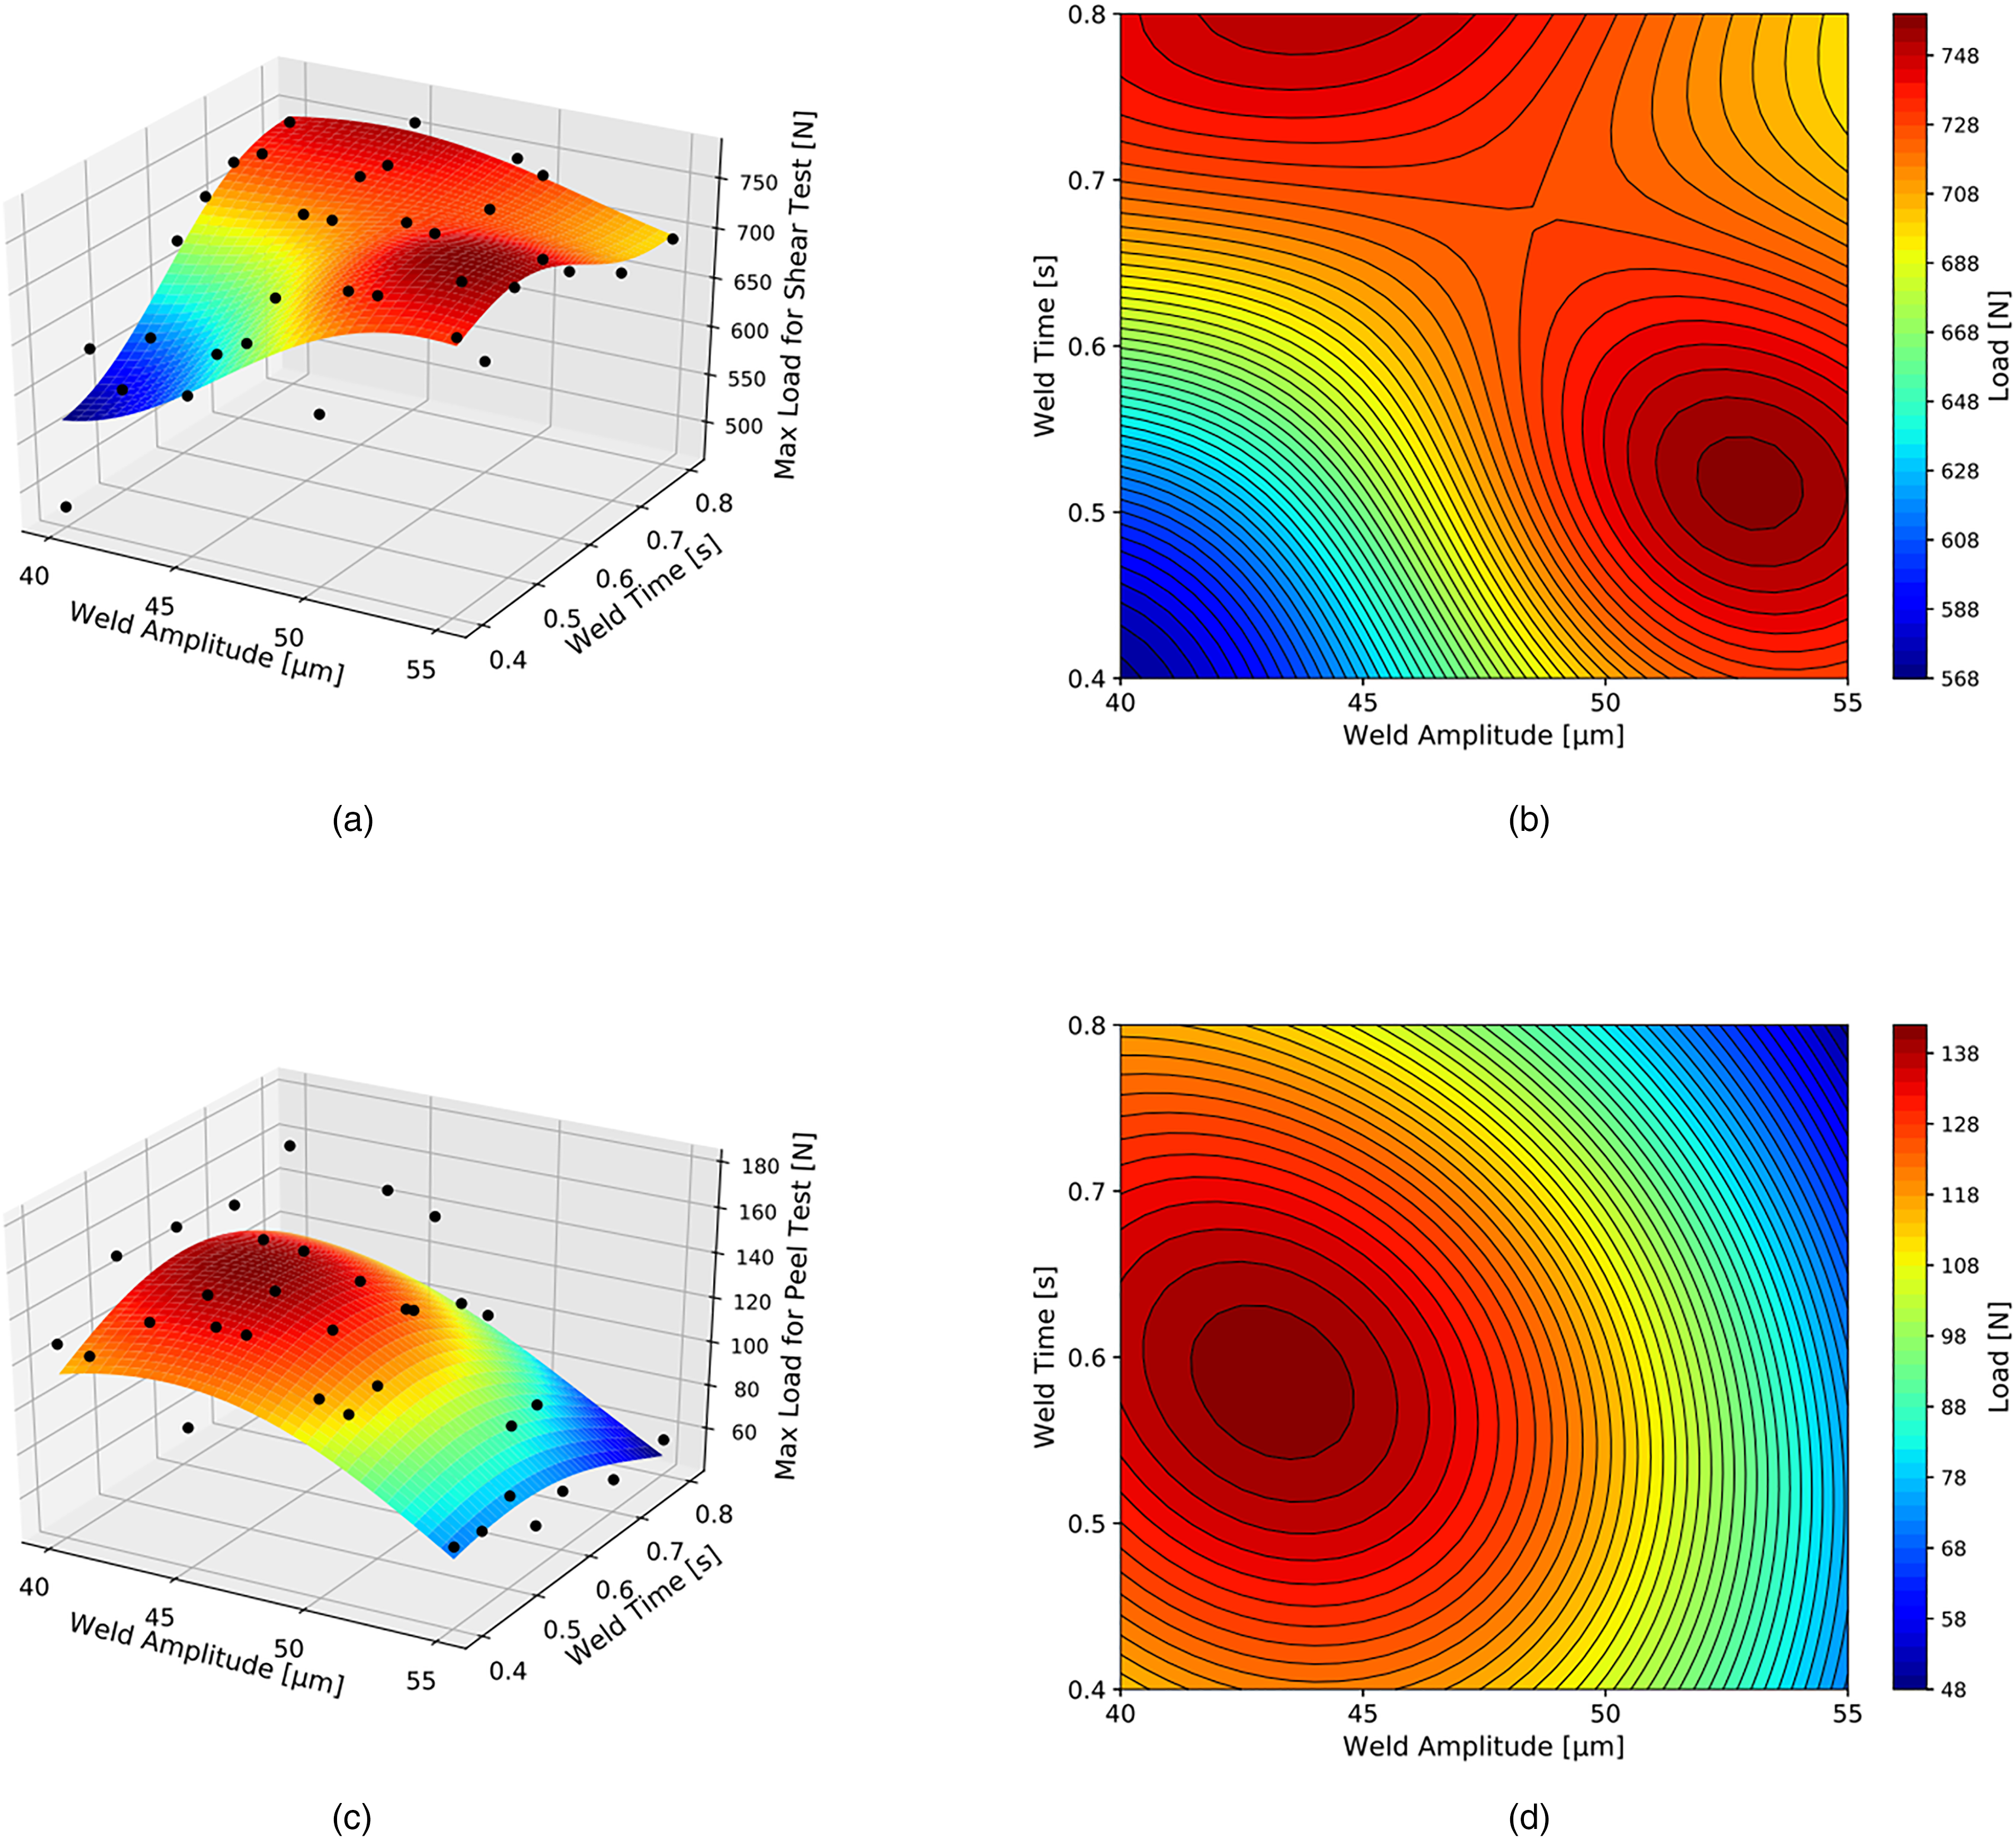
Response surfaces obtained by SVR-RBF: (a) response surface for the shear strength, (b) contour of the shear strength, (c) response surface for the peel strength and (d) contour of the peel strength. 72
Kim et al. 73 carried out T-peel (TP) test on ultrasonic metal spot welding joints of dissimilar materials. The welded joints were divided into five classes through the maximum peel load and joint fracture: namely, clear interface separation, Interfacial separation with partial adhesion, partial interfacial separation with tear, partial circumferential fracture with tear, circumferential fracture with full button. They also investigated the influence of WP and WT on peel strength. Based on the load-displacement curve shown in Figure 9, the quality of the welded joints can be preliminarily judged in combination with the fracture of the joints. In Figure 9(a), the weld quality is good, while in Figure 9(b), the weld quality is estimated based on the maximum peel load. However, the evaluation on whether the welding joints are under weld condition or over weld condition, needs to also check on the condition of peel fracture.
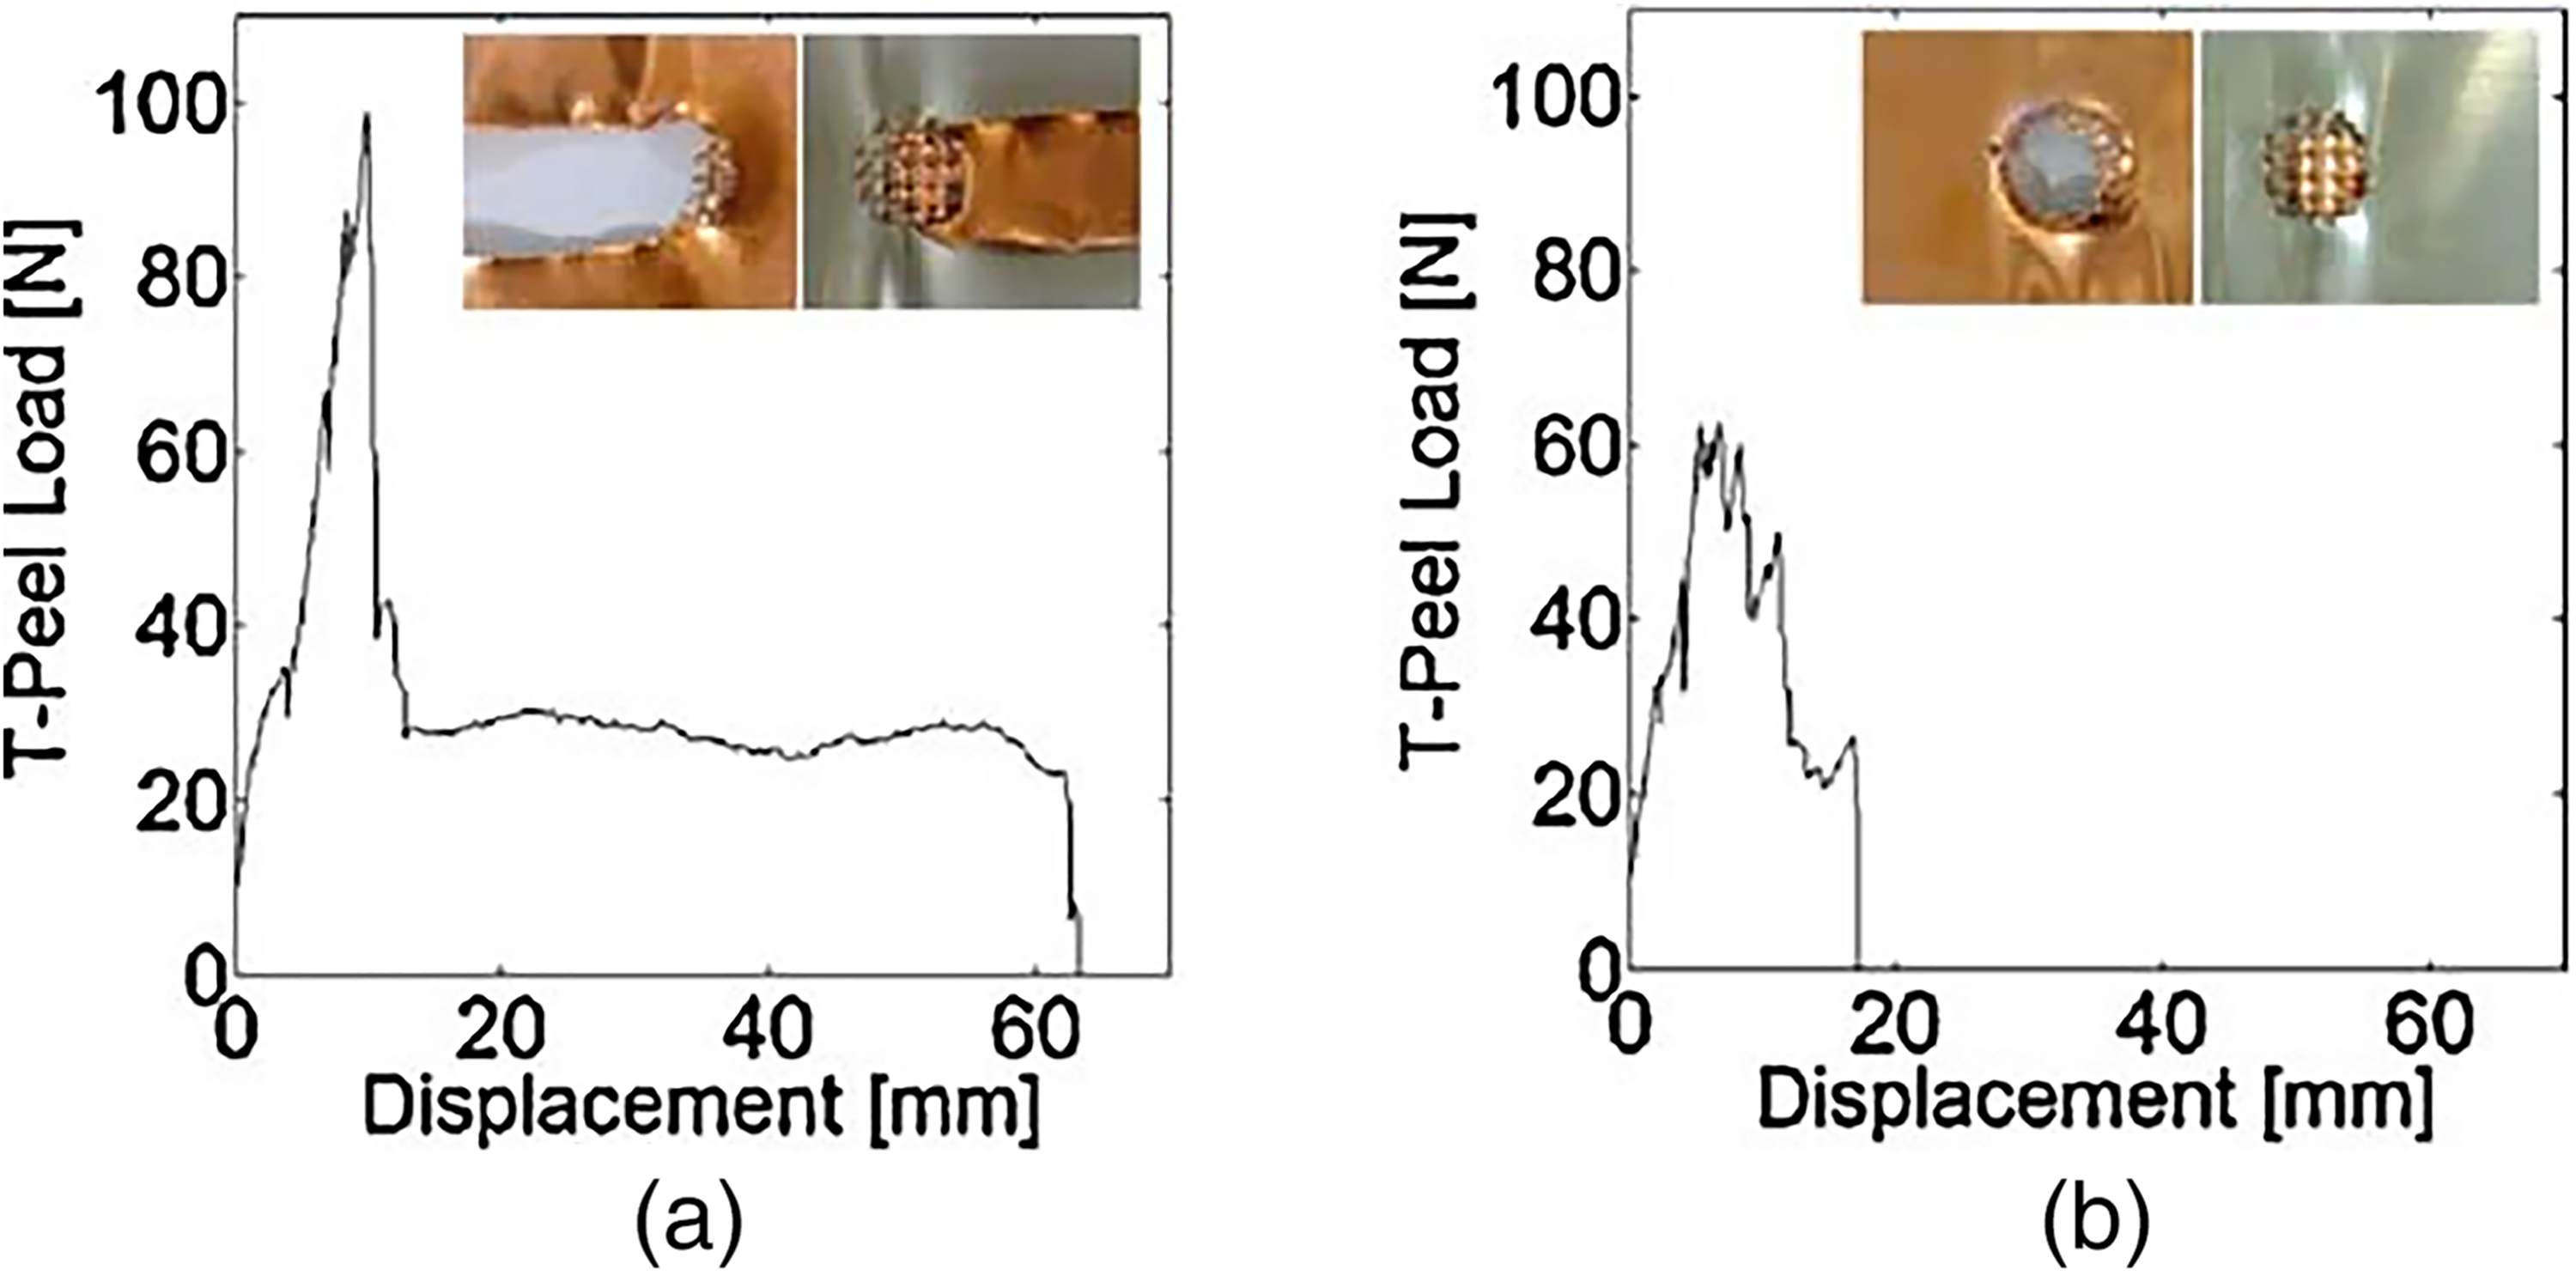
Load–displacement diagram and failure mode of T-peel test: (a) good weld condition and (b) over weld condition. 73
Yang et al. 34 examined the effects of welding energy on the mechanical properties of ultrasonic welded pure copper sheets and measured the Vickers hardness test of different areas of weld joints under different energies. As shown in Figure 10(a), with the input of welding energy, a downward trend of the energy of the welded joint is seen, which is presumably resulted from annealing softening due to frictional heat generation and a decrease in weld dislocation density during welding. Liu et al. 74 investigated the effect of WT on the mechanical properties of ultrasonic welded aluminium-copper dissimilar metals. As shown in Figure 10(a), the hardness of the weld joint is higher than that of the base metal, and the hardness of the weld joint increases as the WT increases. They then conducted morphology analysis of the alloy and proposed that the increase in hardness was due to the production of intermetallic compounds in welding. Intermetallic compounds are hard and brittle, the appearance of which will greatly undermine the performance of weld joints.
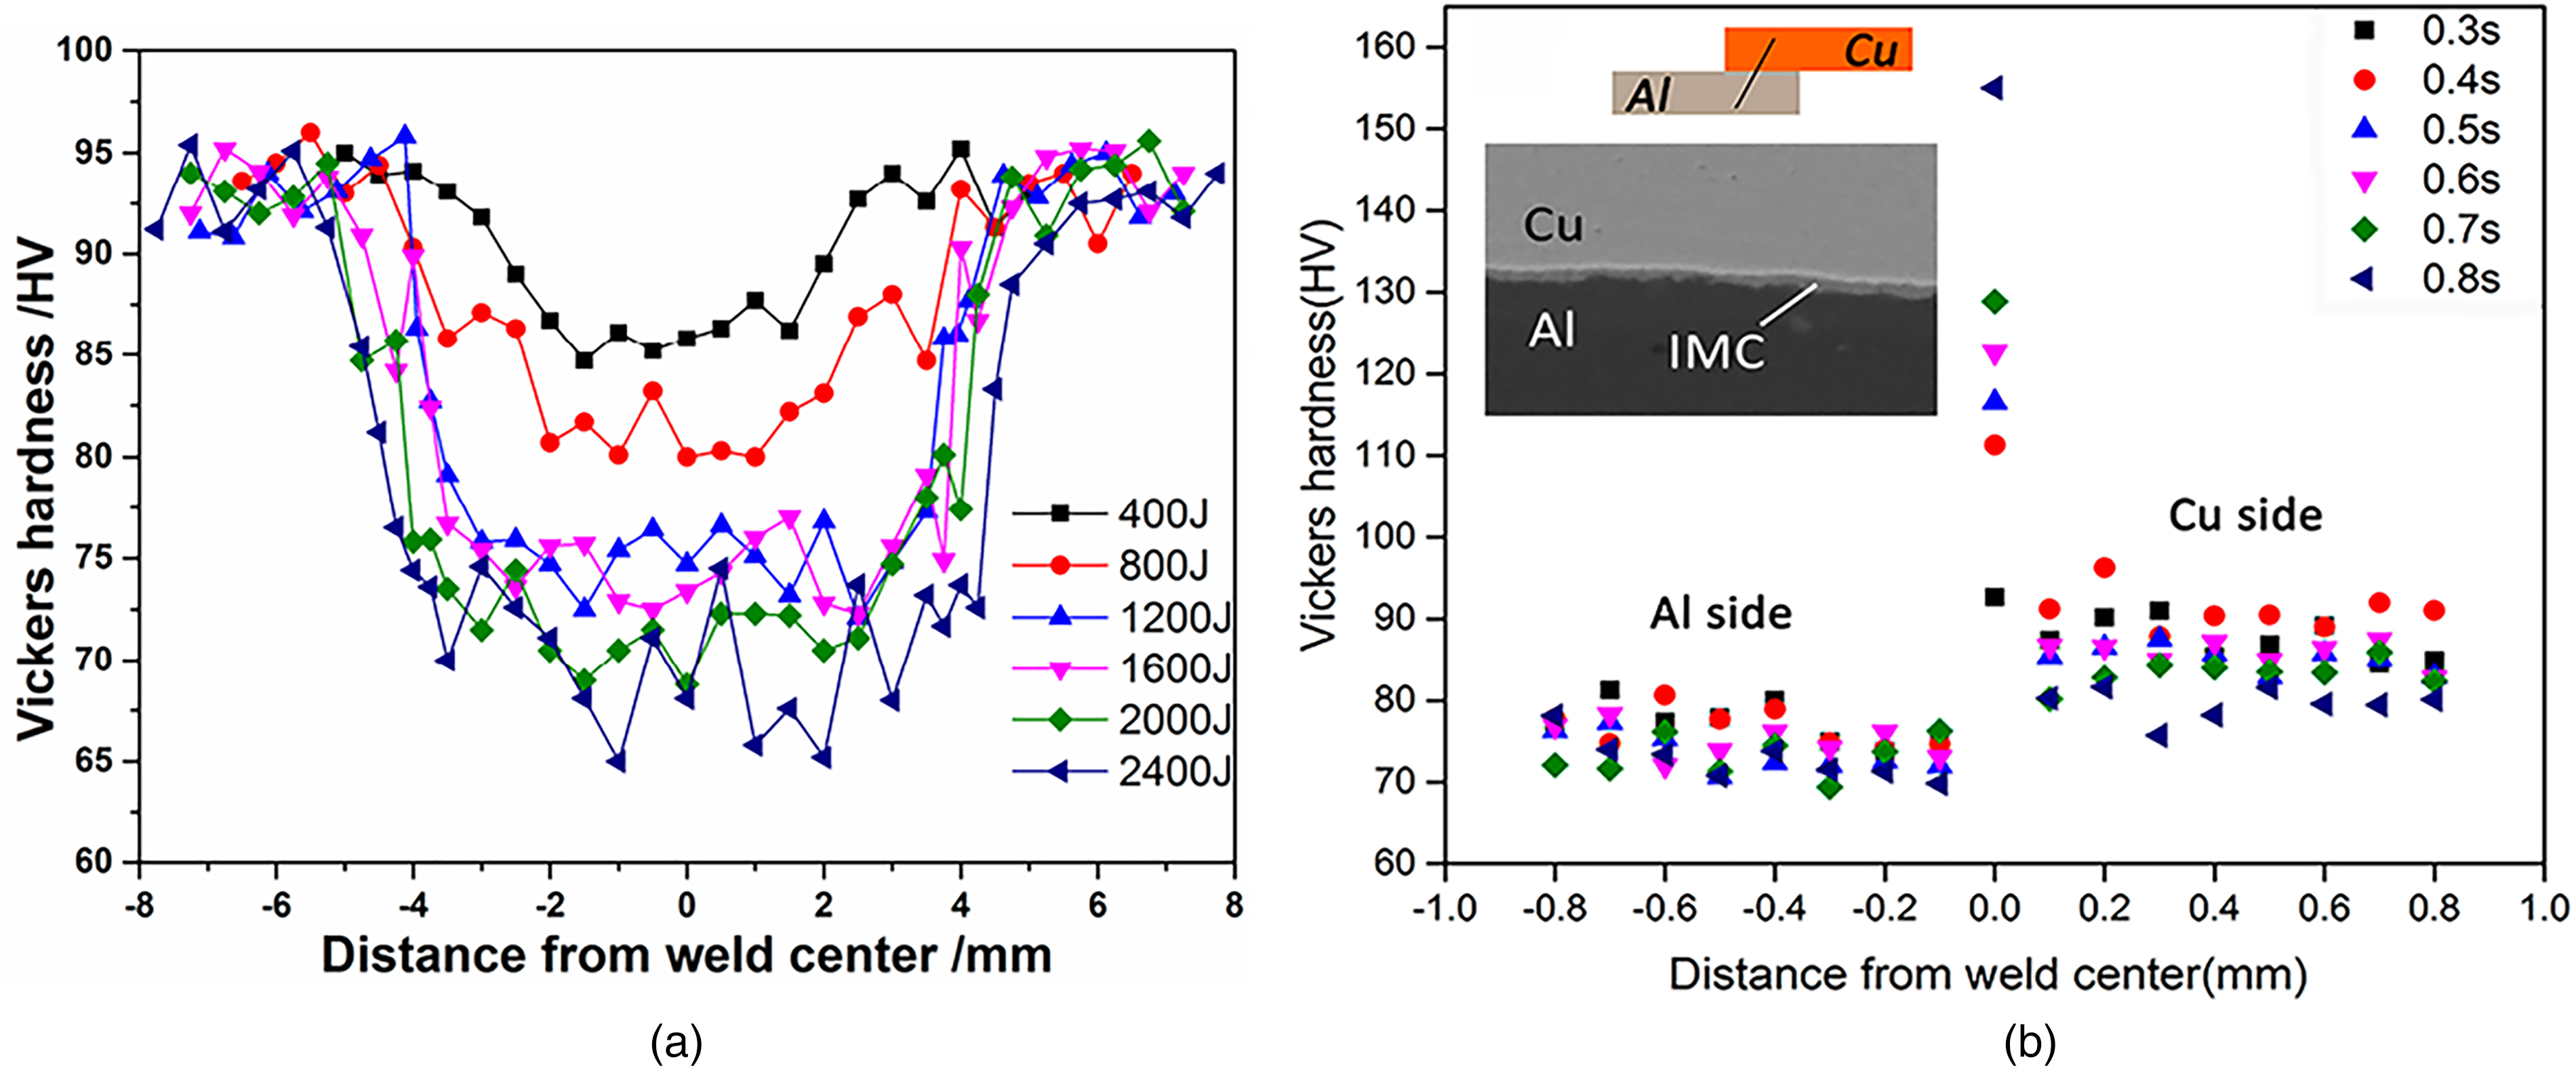
For ultrasonic welding, the welding area of most joints will be softened. When the hardness of welding area increases or even exceeds that of base metal, it is necessary to consider whether intermetallic compound has been generated in the welding process. As the hardness of the weld joint could be either higher or lower than that of the base metal, it is difficult to evaluate the weld quality via hardness alone. Additionally, it is necessary to combine other test methods such as morphology and composition analysis to make the evaluation more comprehensive.
Microstructure of weld joints
Many test methods can be used to observe the microstructure and morphology of weld joints, but the focus of each method is different. Metallographic microscopes can be used to observe diffusion behaviour, plastic deformation, effective thickness, bonding area, recrystallisation grain and bonding mechanism of joints. Lee et al.
22
defined the four characteristics for which weld joints can be evaluated about weld quality as follows:
Bonding density: the proportion of the bonding area to the whole welding interface. Post-weld thickness: the average thickness of the top material after welding. Weld nugget size: The total width of all welds below the horn. Thermo-mechanically affected area (TMAZ) size: the entire width of the thermos-mechanically affected area outside the weld metal.
Although the properties of these four kinds of ultrasonic weld joints are defined in this paper, the standard of each property of an ideal weld joint is not given and can be only roughly divided according to the properties of the weld joints, so they can only be categorised through qualitative study, rather than through quantitative analysis of the performance of weld joints.
As shown in Figure 11, it can be observed through metallographic morphology that discontinuous bonding occurs at the interface during under-welding, and there is no discontinuous bonding during good welding and over-welding. However, with the increase of welding parameters, the degree of sheet thinning at weld joints also deepens. It can also be seen that with the increase of welding parameters, the deformation of the sheet is aggravated. In the over-weld state, there is a serious warpage deformation of the plate and a serious degree of thinning of the upper plate.
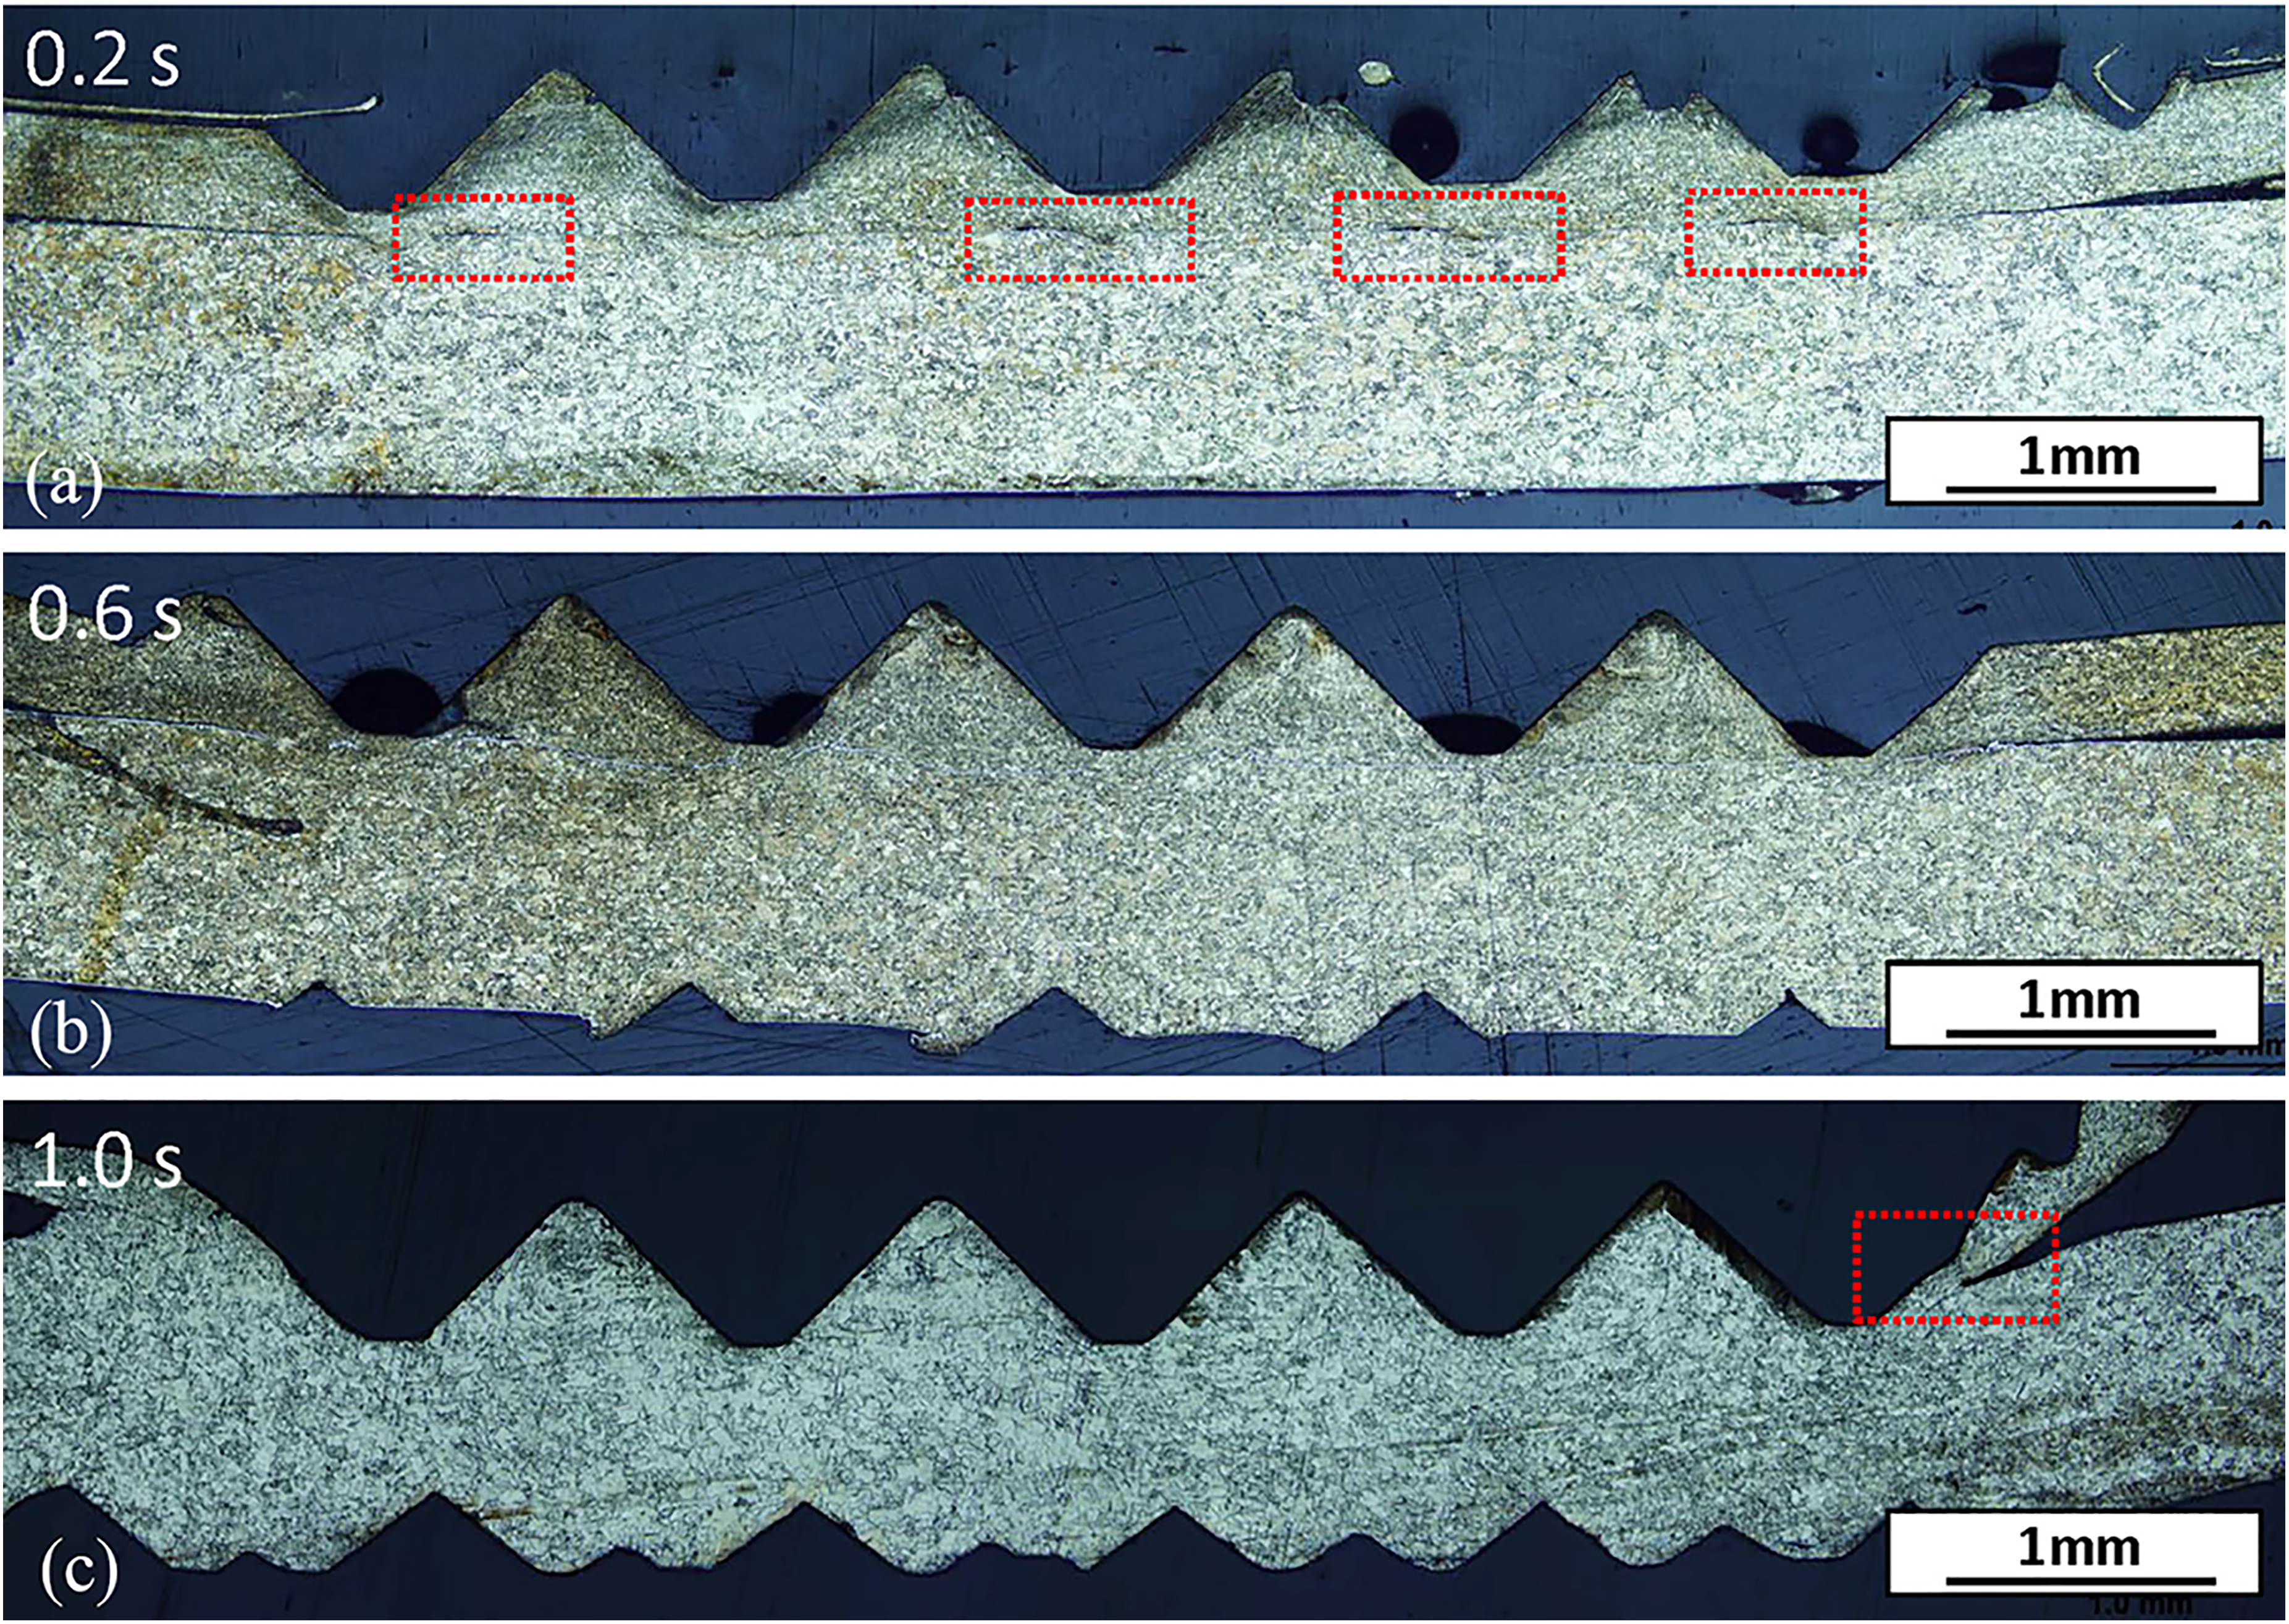
Optical images of Cu- and Ni-plated Cu weld cross-sections produced with a pressure of 50 psi, with increasing welding times (0.2 s, 0.6 s and 1.0 s): (a) poor-connected, (b) well-connected and (c) over-connected. 22
Obviously, during metallographic observation for same metal ultrasonic welding joint, it is difficult to identify plastic flow and diffusion of weld joint. It is also difficult to detect the diffusion and bonding of weld joint by other testing methods. Lee et al. 22 proposed that nickel plating can be used on the surface of copper base metal. After welding, the plastic flow and diffusion can be judged by observing the nickel plating layer. However, nickel plating may result in changes in joint conditions, so can be only adopted in experiments. It may also result in inaccuracies in final observations due to poor metal properties. Li et al. 63 proposed that it is not easy to evaluate the degree of diffusion between metal joints such as Ni–Ni, and the mixed diffusion of Ni can be judged by checking the distribution of oxygen element through energy dispersive spectroscopy (EDS), which has been proved to be effective.
Ward et al. 75 observed the base metal and ultrasonic weld joints of ultrafine grain nickel using transmission electron microscopy (TEM) as shown in Figure 12(a) and (b). The influence of ultrasound on grain size is huge, which can increase the grain size by several times and cause micropores near grain boundary. The change of microstructure has intuitive expression to the joint quality after welding. The grain growth will undoubtedly affect the quality of weld joint, and the micropores near grain boundary will cause stress concentration, contributing to the decrease of shear strength and hardness.
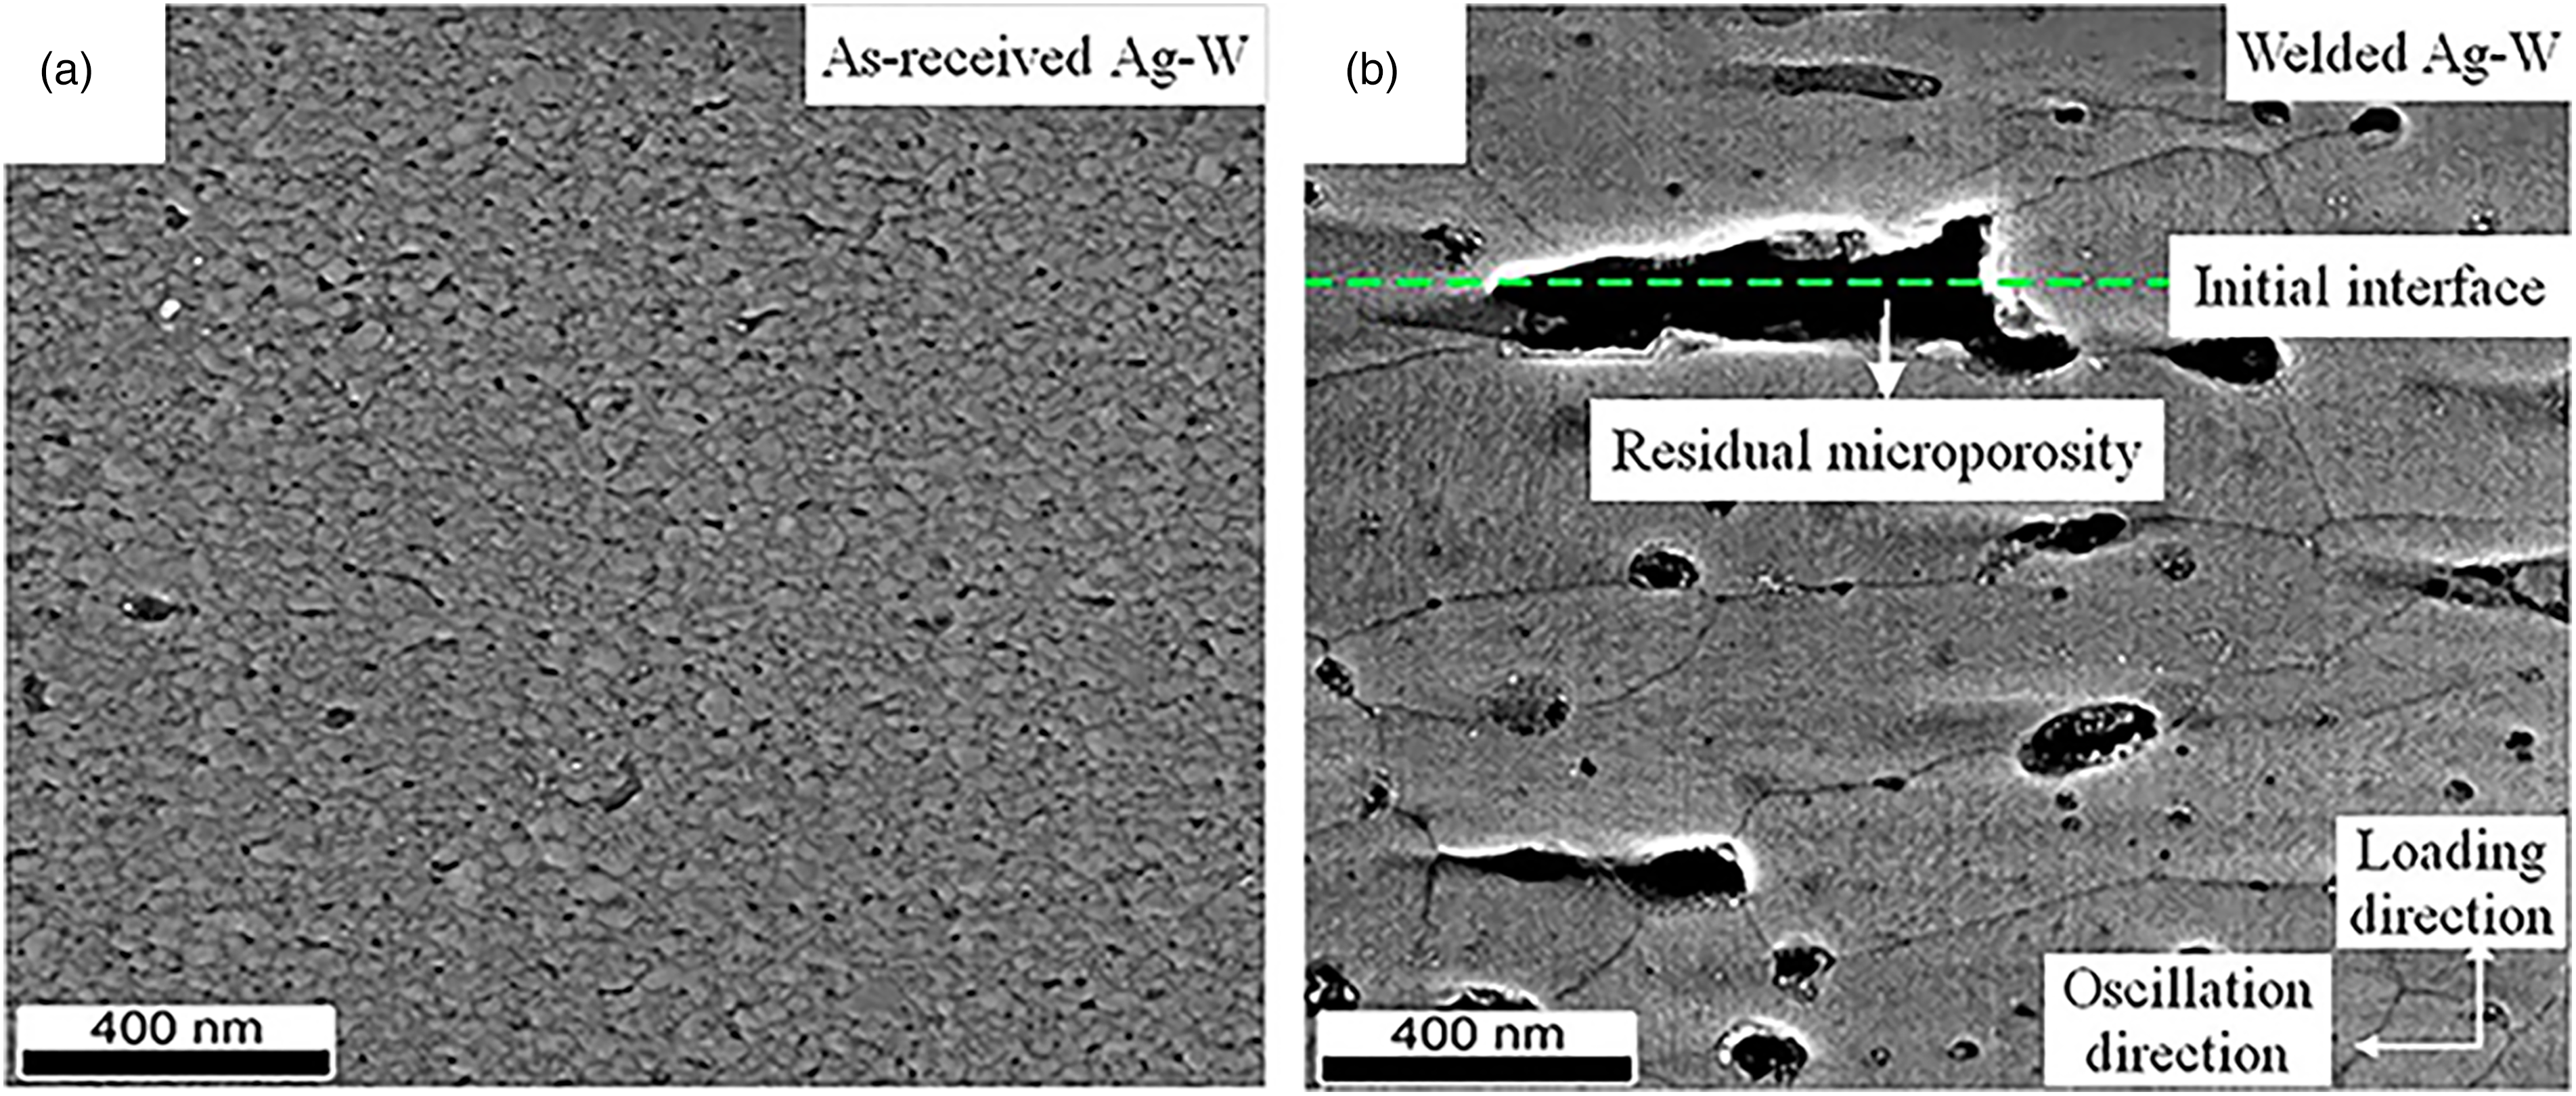
STEM secondary electron micrographs of: (a) the as-received coating and (b) the welded material. 75
Scanning electron microscopy (SEM) was used to observe the morphology of ultrasonic weld joint and fracture, and component analysis was carried out in combination with the cross-section of EDS interface of joint. Xie et al. 76 used ultrasonic welding to join aluminium solid sheet with nickel foam and observed the weld joints. As shown in Figure 13, the SEM photograph can clearly show the joint interface of aluminium and nickel foam, and the mechanical lock occurs at some area of the welding interface. EDS spot scanning was carried out to obtain the distribution of elements where the interface was tightly bonded, so as to judge whether there was intermetallic compound formation. Even when the interface is tightly bonded and the foam structure is compacted seriously, there is no brittle intermetallic compound that is very likely to appear in fusion welding.
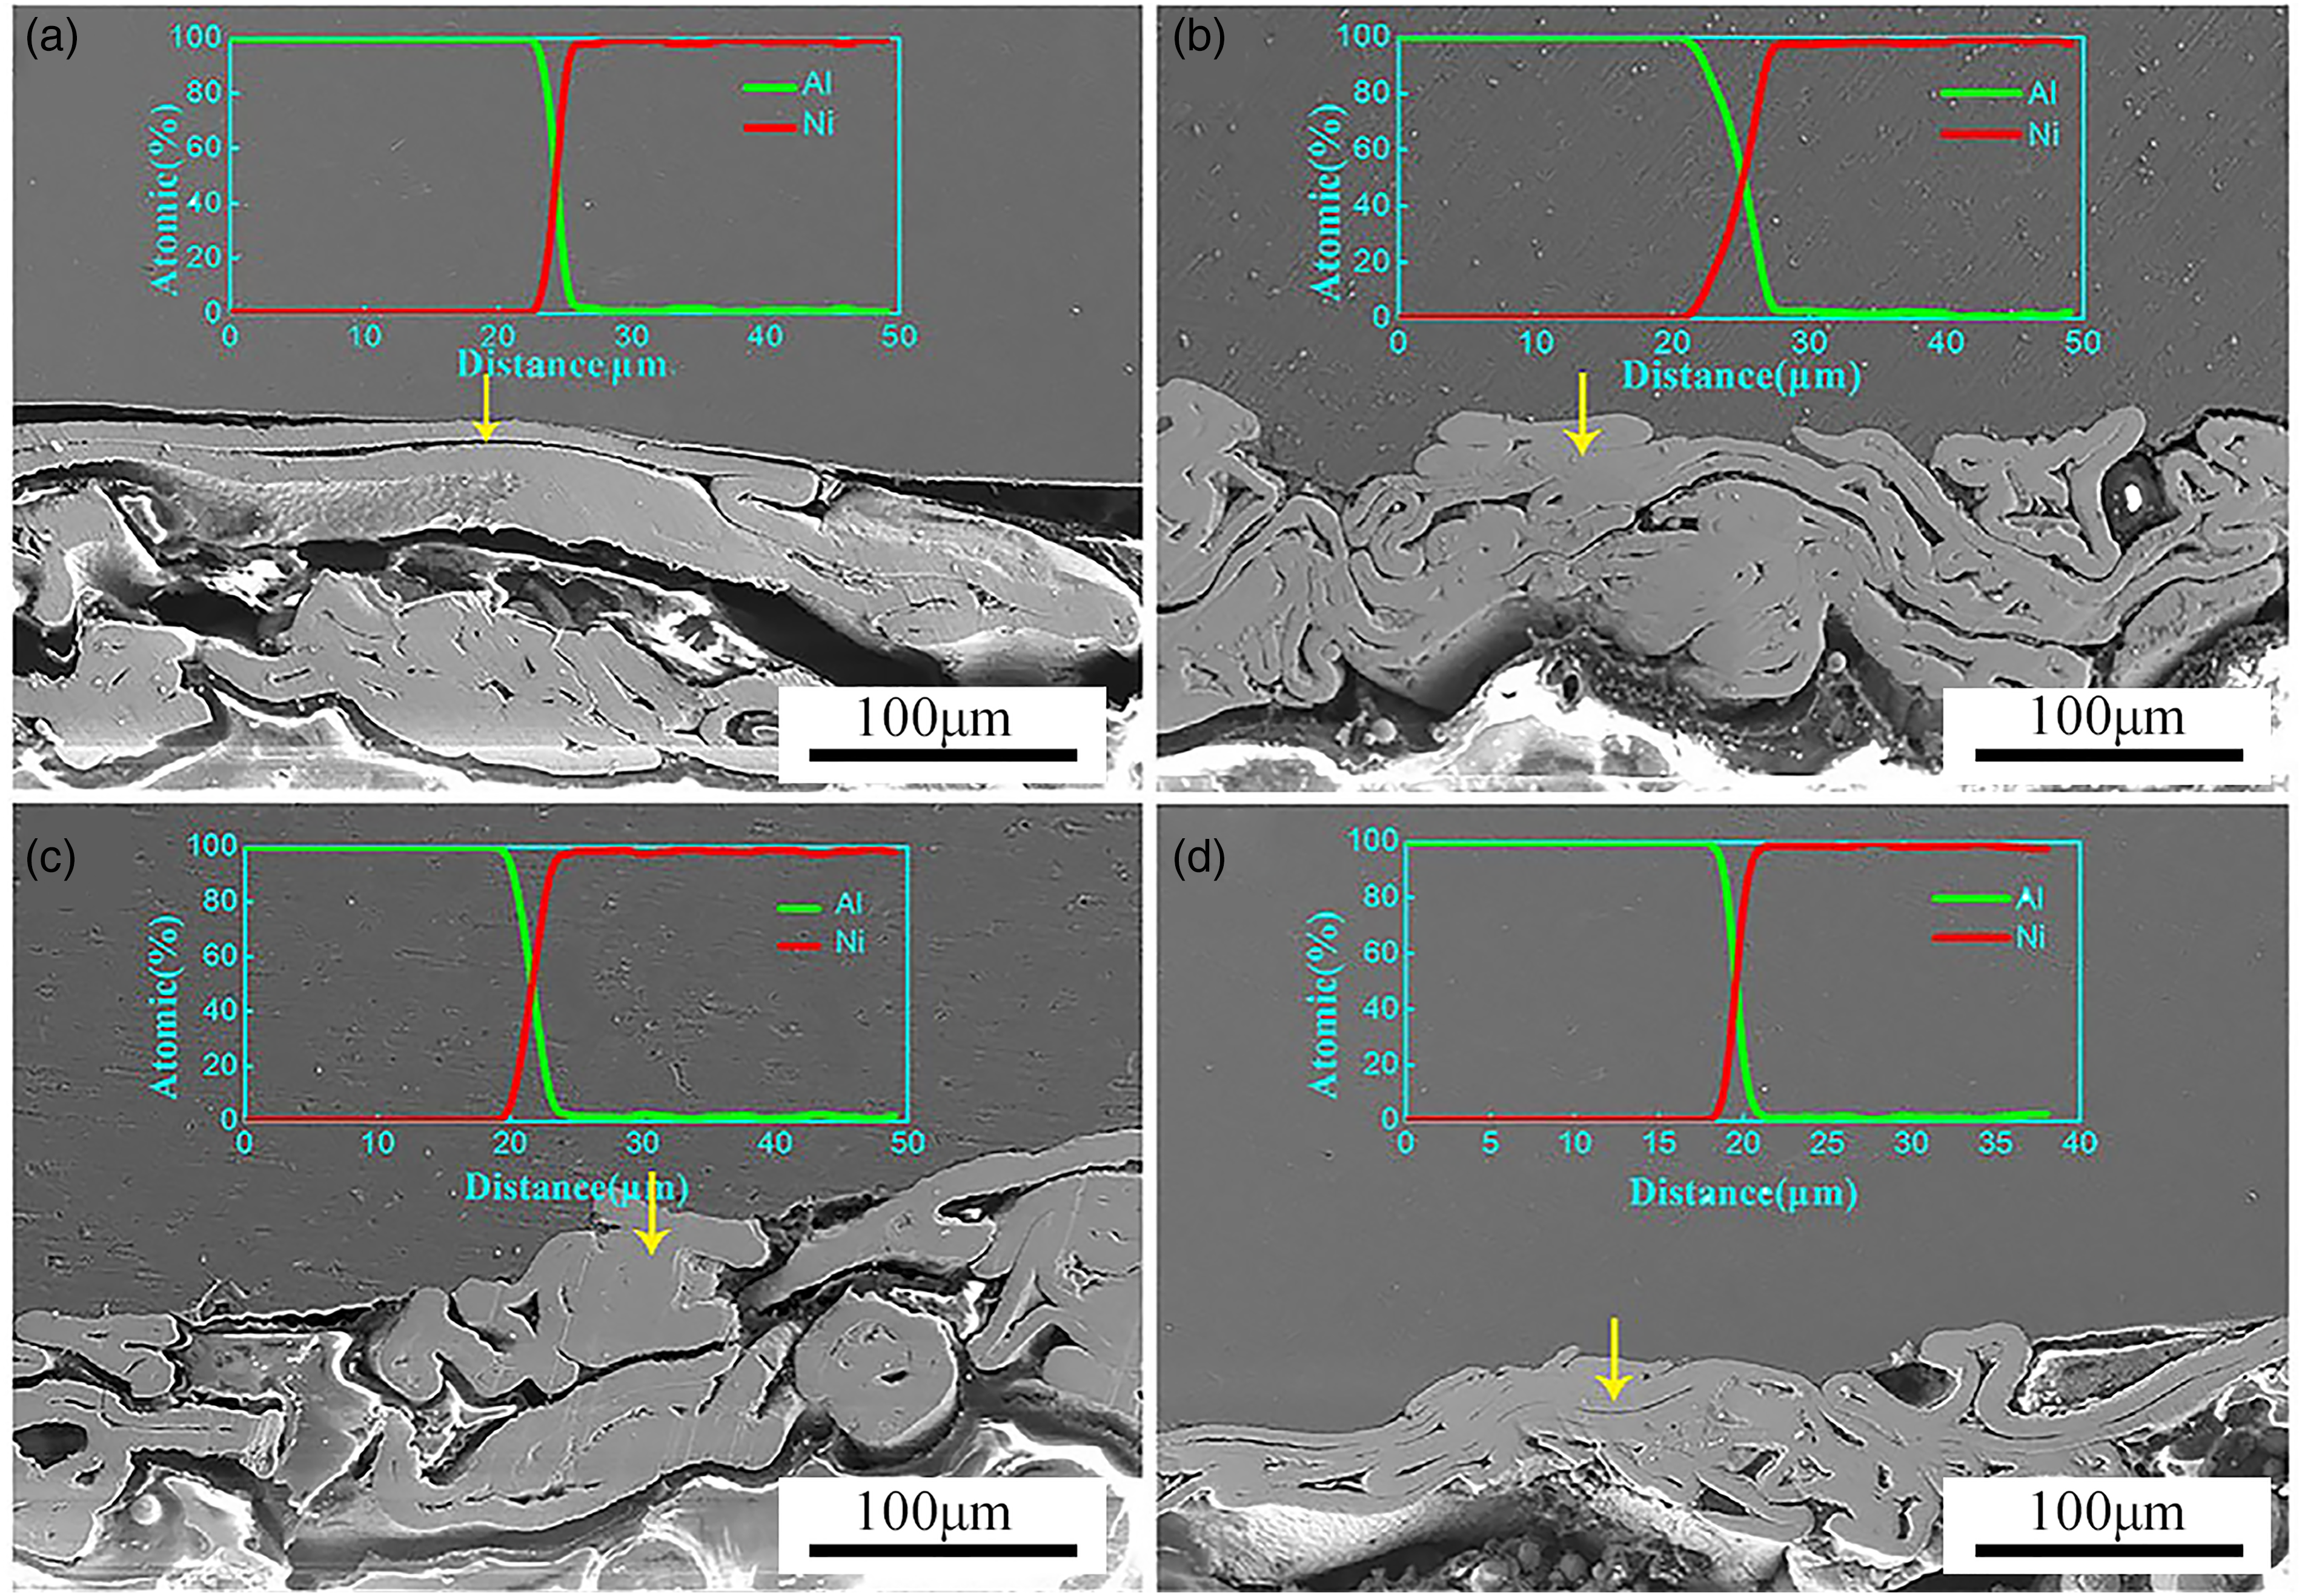
SEM images of the Al/Ni foam weld interface at different welding energies and EDS line scan results (yellow arrows show the scanning direction): (a) 10 J, (b) 30 J, (c) 50 J and (d) 70 J. 76
Luo et al. 77 scanned and photographed ultrasonic weld joints of Ni-coated Cu sheet using SEMs, as shown in Figure 14. It can be clearly observed that the interface belongs to the state of discontinuous bonding, and the part that is effective interlocked is scanned. As shown in Figure 14(a), Ni–Ni bonding is obviously formed, and copper diffusion occurs. The surface of the weld joint was scanned, and Cu–Cu bonding and Ni layer disappeared in some areas. Part of the algorithm can be used to calculate the thickness of the Ni–Ni bonding and compare it with the Ni coating when it is not welded. The thinning amount of the Ni coating can be obtained to estimate the welding stage and evaluate the weld quality, which, however, is not quantifiable, and the workload of scanning and measuring all parts of the joint using SEM and EDS is enormous.
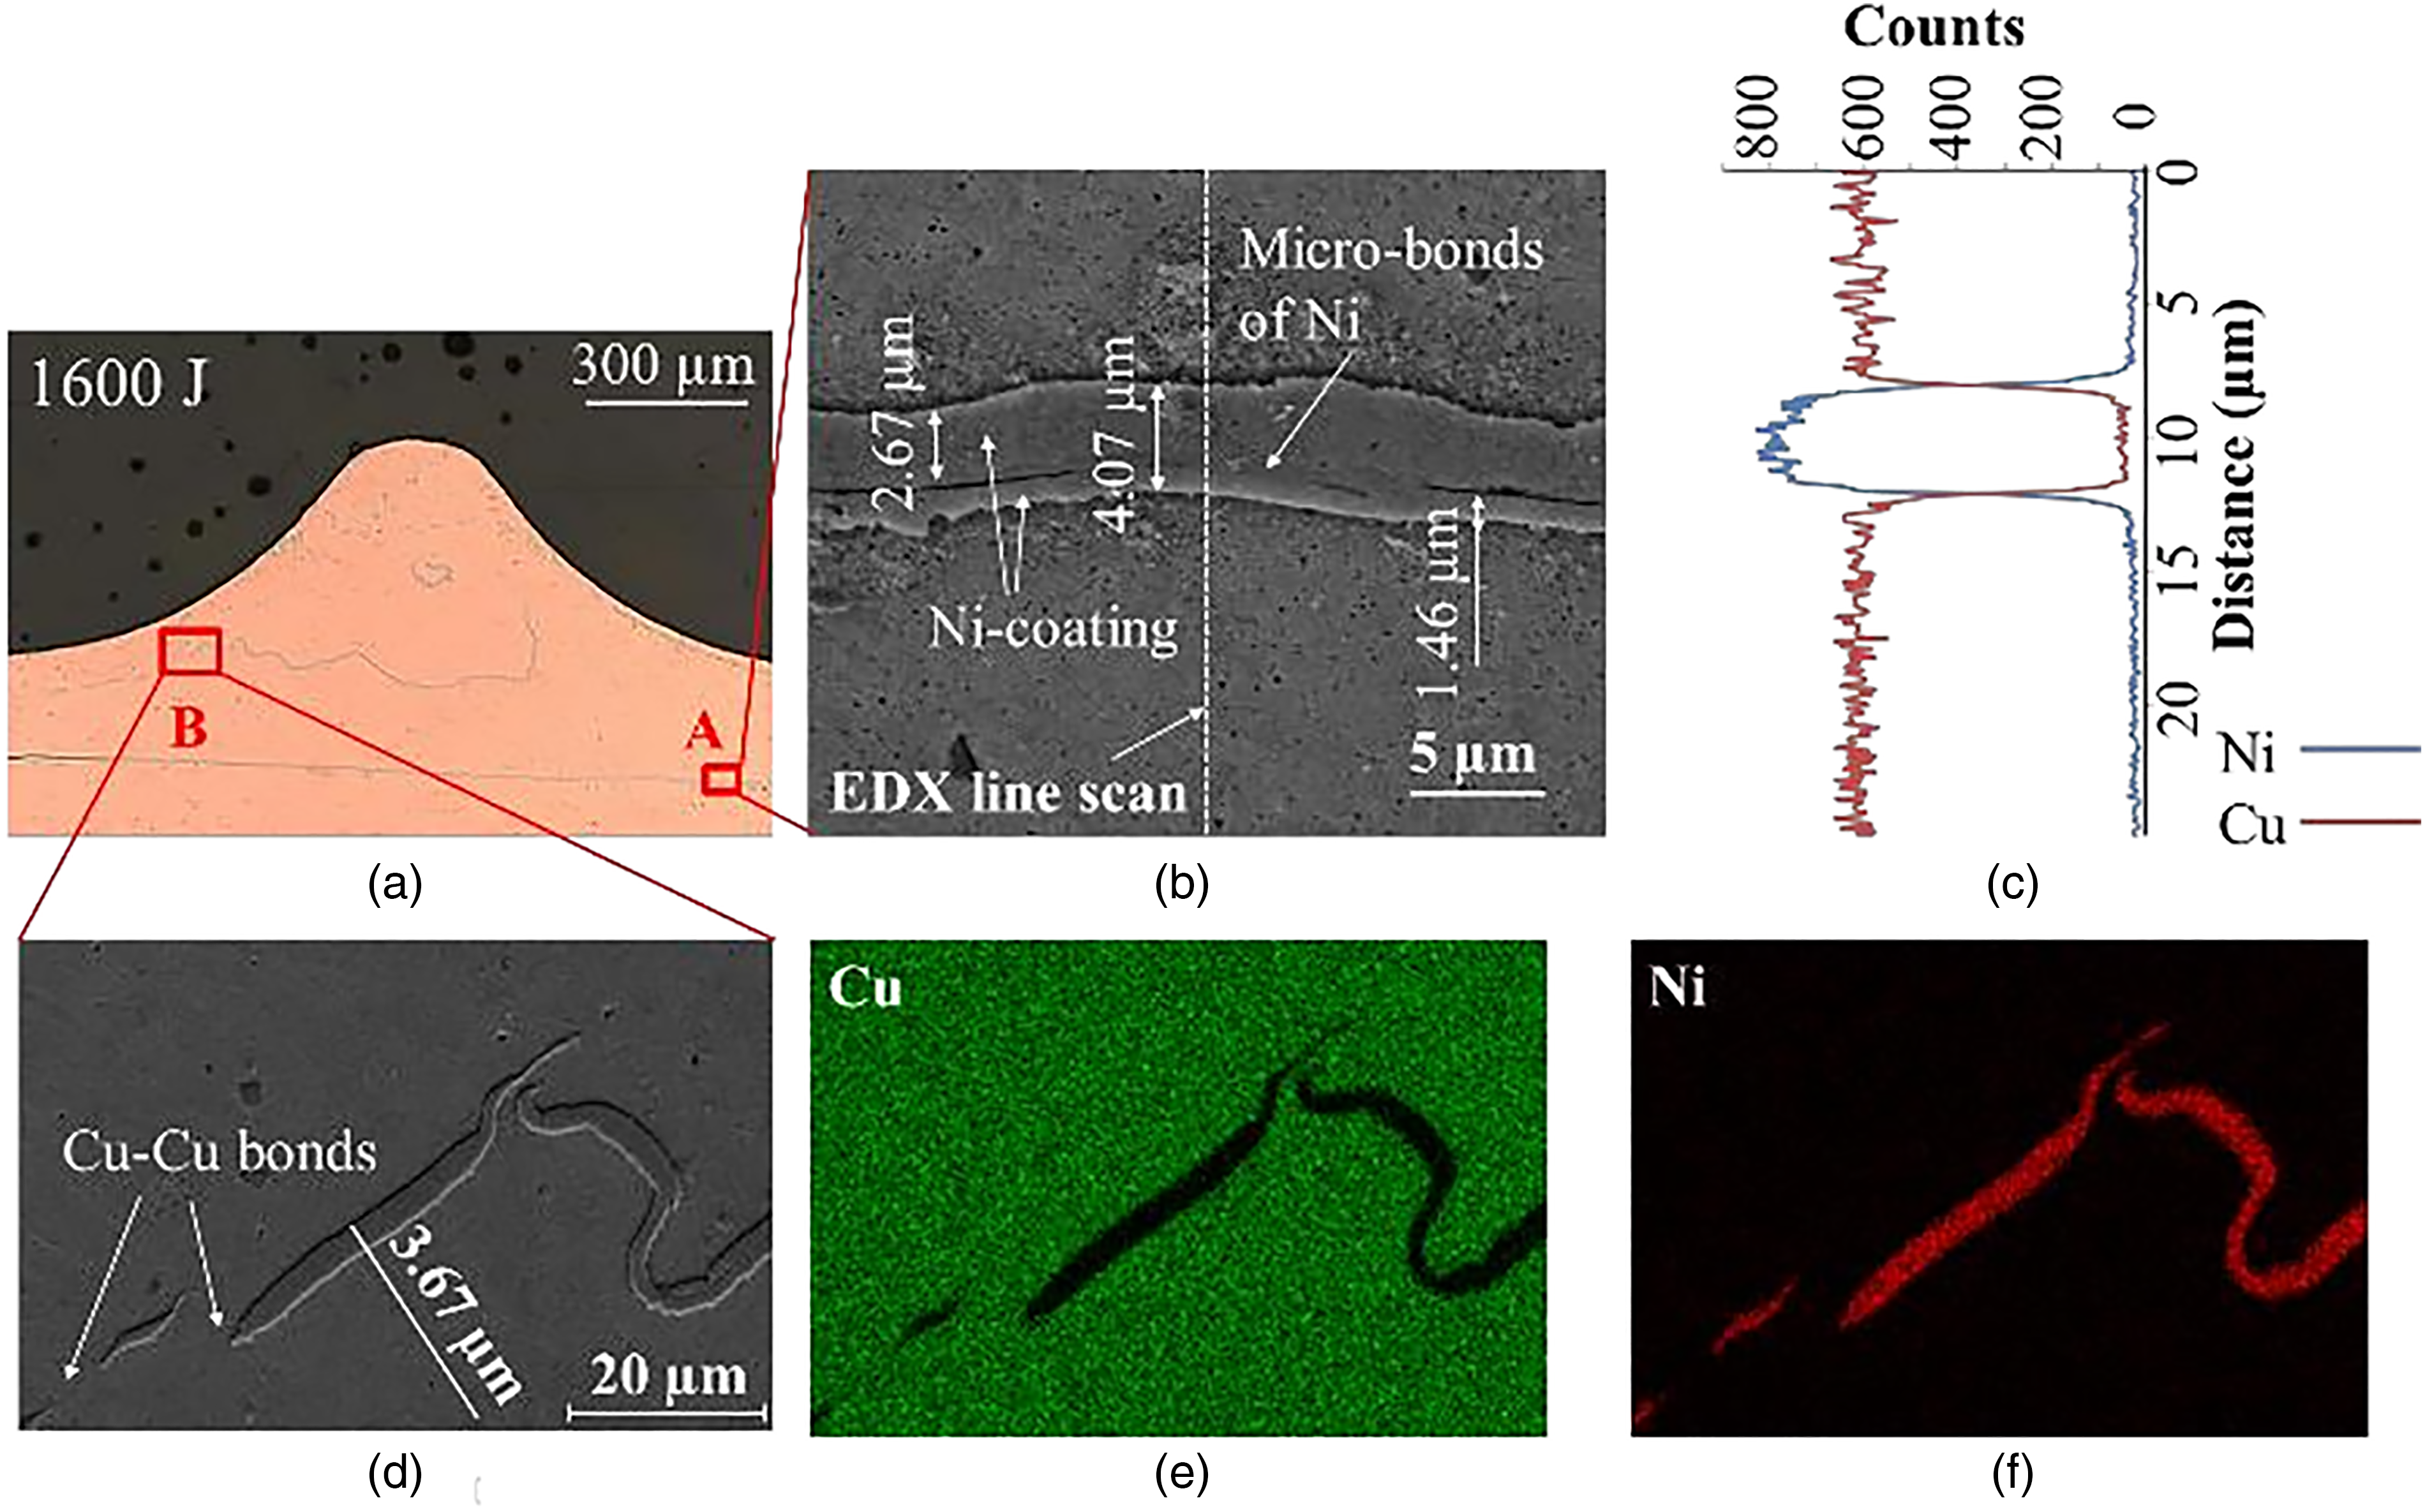
The sample welded at 1600 J: (a) optical microscope image, (b) SEM image at region A, (c) EDX composition scan by SEM along the dashed line in (b), (d) SEM image at region B, (e) EDX composition mapping for Cu and (f) EDX composition mapping for Ni. 77
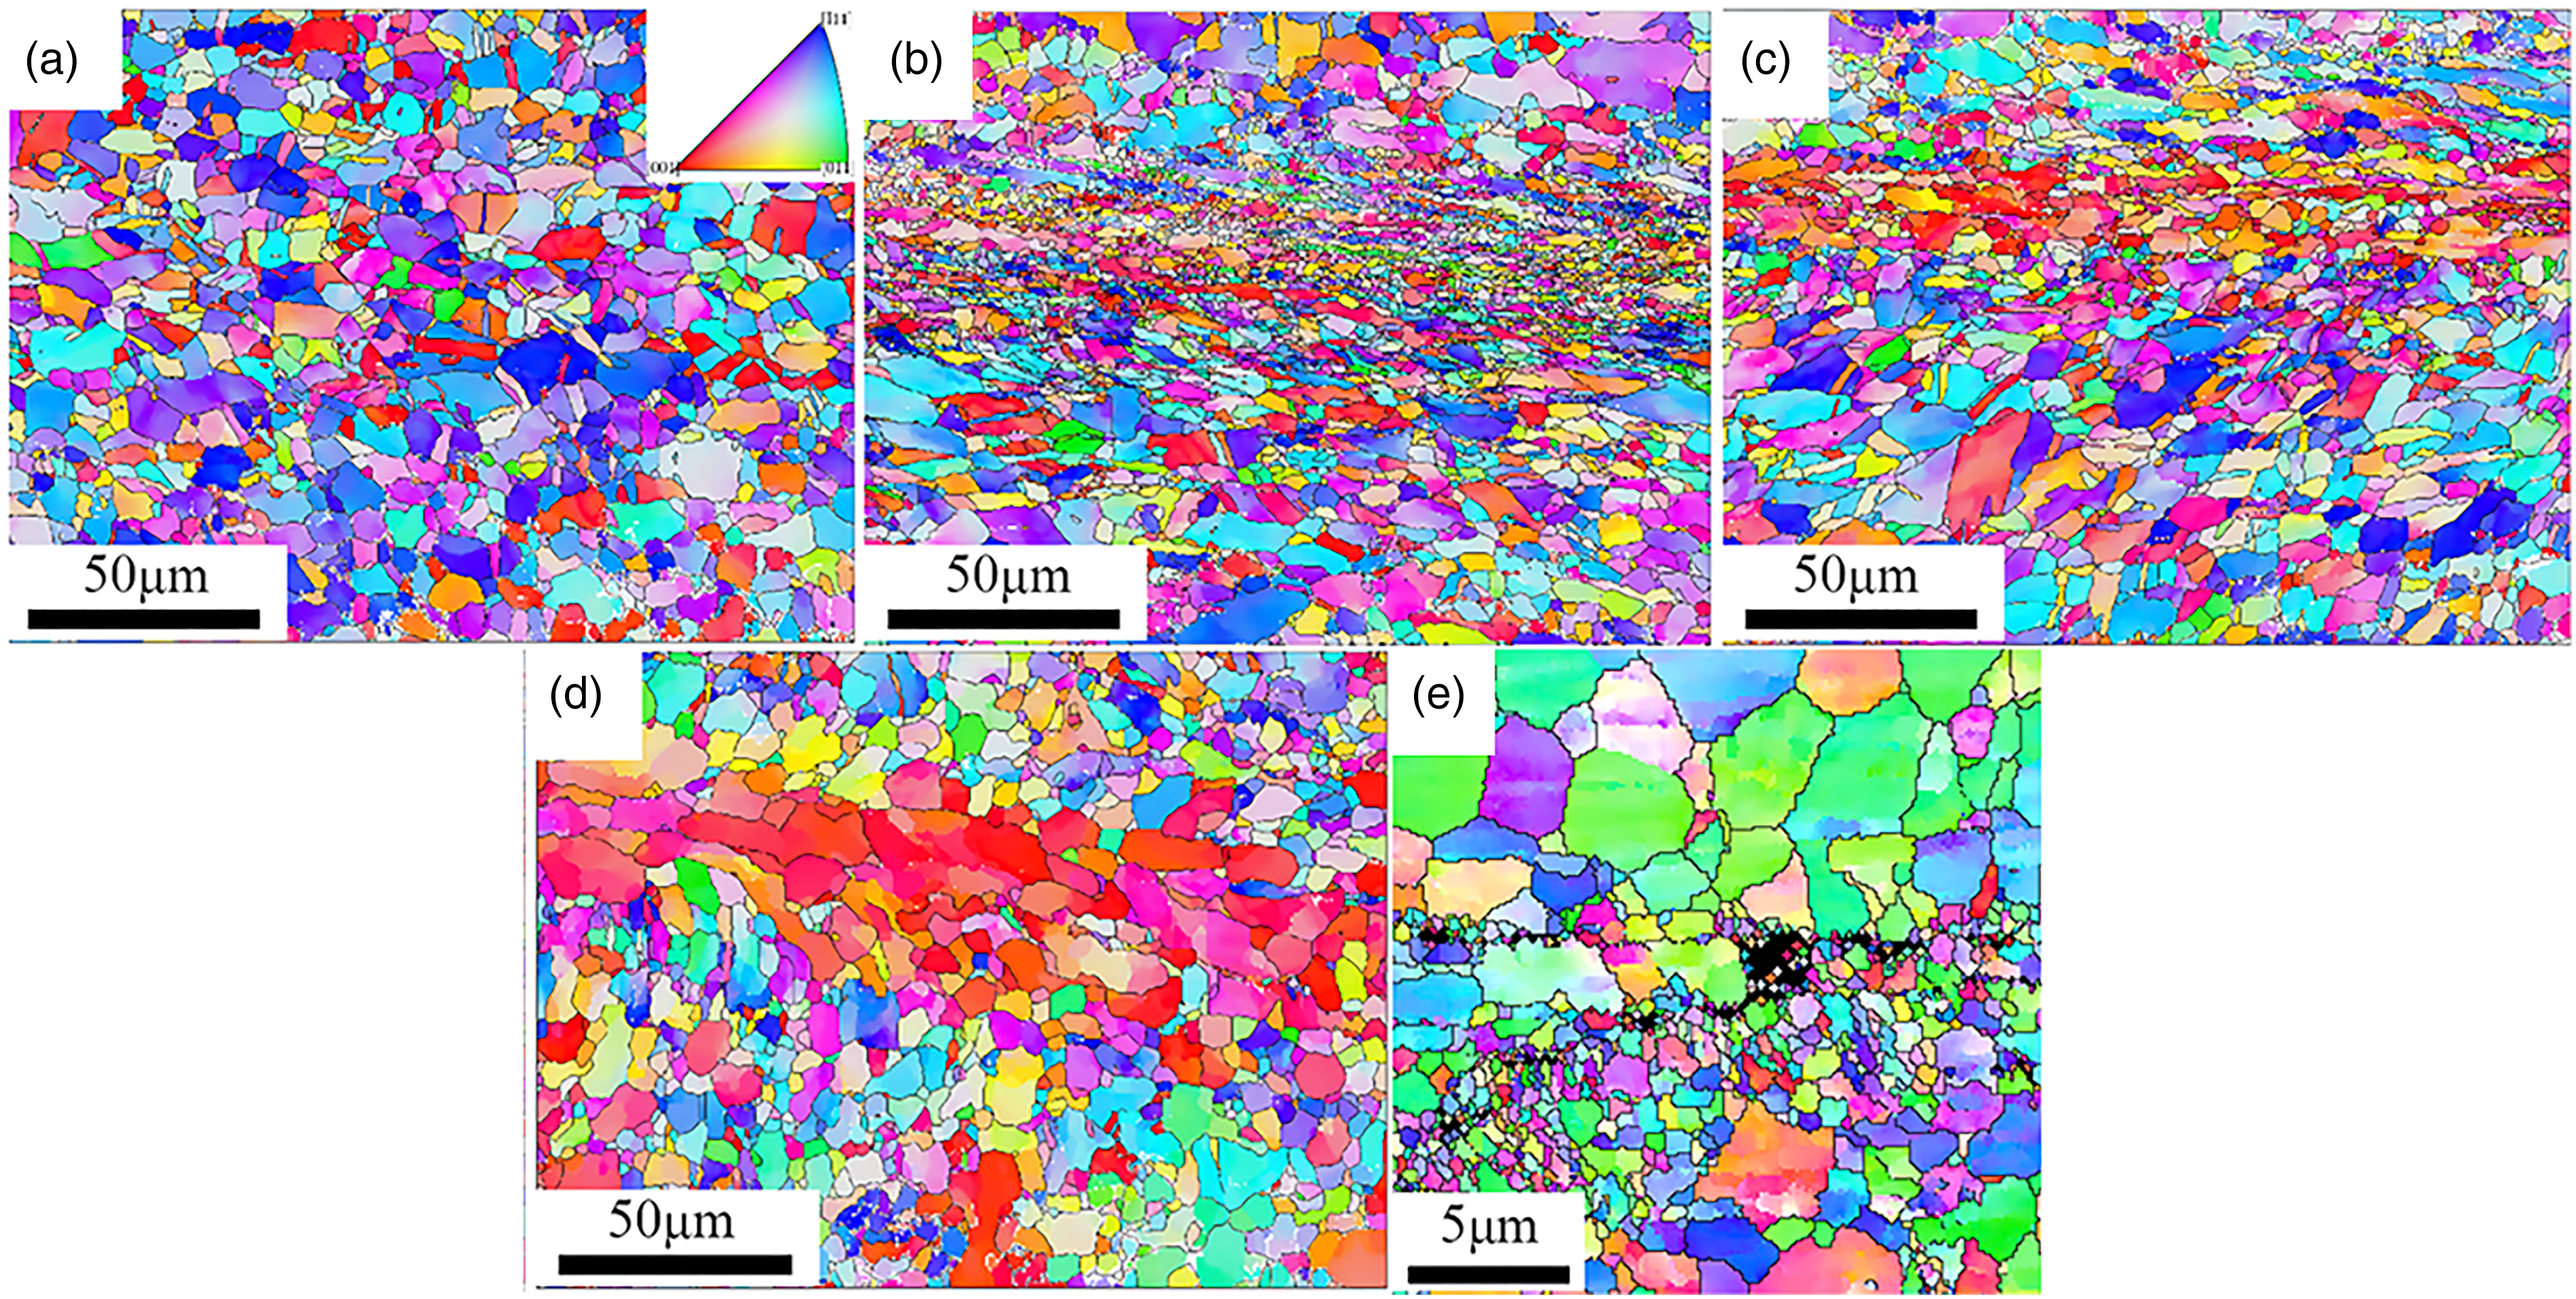
Electron backscatter diffraction (EBSD) can be used to observe the grain size of ultrasonic weld joints and the holes appearing in the weld. Ultrafine grain nickel was ultrasonically welded by Shayakhmetova et al., 78 and weld areas were examined via EBSD analysis and microhardness. The microhardness decreased in the welding area, which may be caused by pores in the weld joint, which was confirmed by EBSD test. Grain growth in the interface zones was observed by EBSD. Yang et al. 34 also put forward the view that, with the input of welding energy, the grain in welding undergoes first decrease and then increase. Under the condition of high energy input, the grain in welding will increase to exceed the size of base metal. The grain polishing is due to dynamic recrystallisation. As the energy input continues, the recrystallised grain will continue to grow, as shown in Figure 15.
Electrical properties of weld joints
At present, ultrasonic metal welding is mostly used to connect the battery foil, and the high resistance of the joint will increase the energy loss, hinder the efficiency of the battery pack. Thus, the change of resistivity is also the key to evaluate the quality of ultrasonic welding. Resistance is the performance index of the joint, and the increase of resistance is caused by multiple defects.79–82 Das et al. 83 studied the characteristics of resistance and temperature raise caused by charge and discharge of ultrasonic weld joints of different materials. The results show that there is a positive feedback relationship between resistance and temperature, that is, when the resistance increases, the temperature will increase during charging and discharging, and the temperature will further increase the resistance, resulting in the overall performance degradation. Therefore, it is very important to measure and control the resistivity of ultrasonic weld joints.
Xie et al. 76 performed resistivity measurements of ultrasonic welded joints. The results show that the resistance at the joint is higher than that of the unwelded material. As shown in Table 1, the resistance of the under-welded and over-welded joint is higher than that of the well-welded joint, that is, the increase of the joint resistance can be minimised by appropriate welding parameters.
Results of the resistance measurements. 76
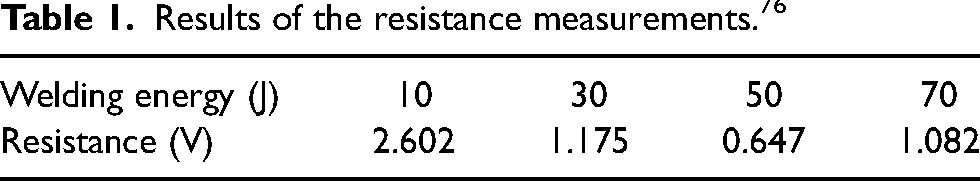
The study by Shin et al. 64 showed that the configuration of ultrasonic weld joints can also impact the joint resistivity. When there is an unbonded area at the interface of the joint, the resistance at the joint will rise. Therefore, the resistivity can also be one of the monitoring indexes for measuring the quality of the ultrasonic weld joints. It can also become an index for non-destructive testing of the ultrasonic weld joints.
Non-destructive testing
The reason for the difficulty in using traditional non-destructive testing in ultrasonic metal weld quality testing is that the welded workpieces are mostly thin sheets and wires, and the welding area size is limited. Moreover, for ultrasonic welding, the quality of discontinuous connection of weld may be higher than that of complete bonding of joints.
A new ultrasonic imaging system with sub-millimeter resolution was designed and established by Jia et al. 84 By leveraging the difference of aluminium–copper wire expansion coefficient, the weld specimen is thermally loaded and the specimen is free to expand without restriction. The difference of aluminium–copper expansion will cause the phase difference of the signal collected by the ultrasonic measurement system, as shown in Figure 16. The area without phase difference is the area with effective bonding.
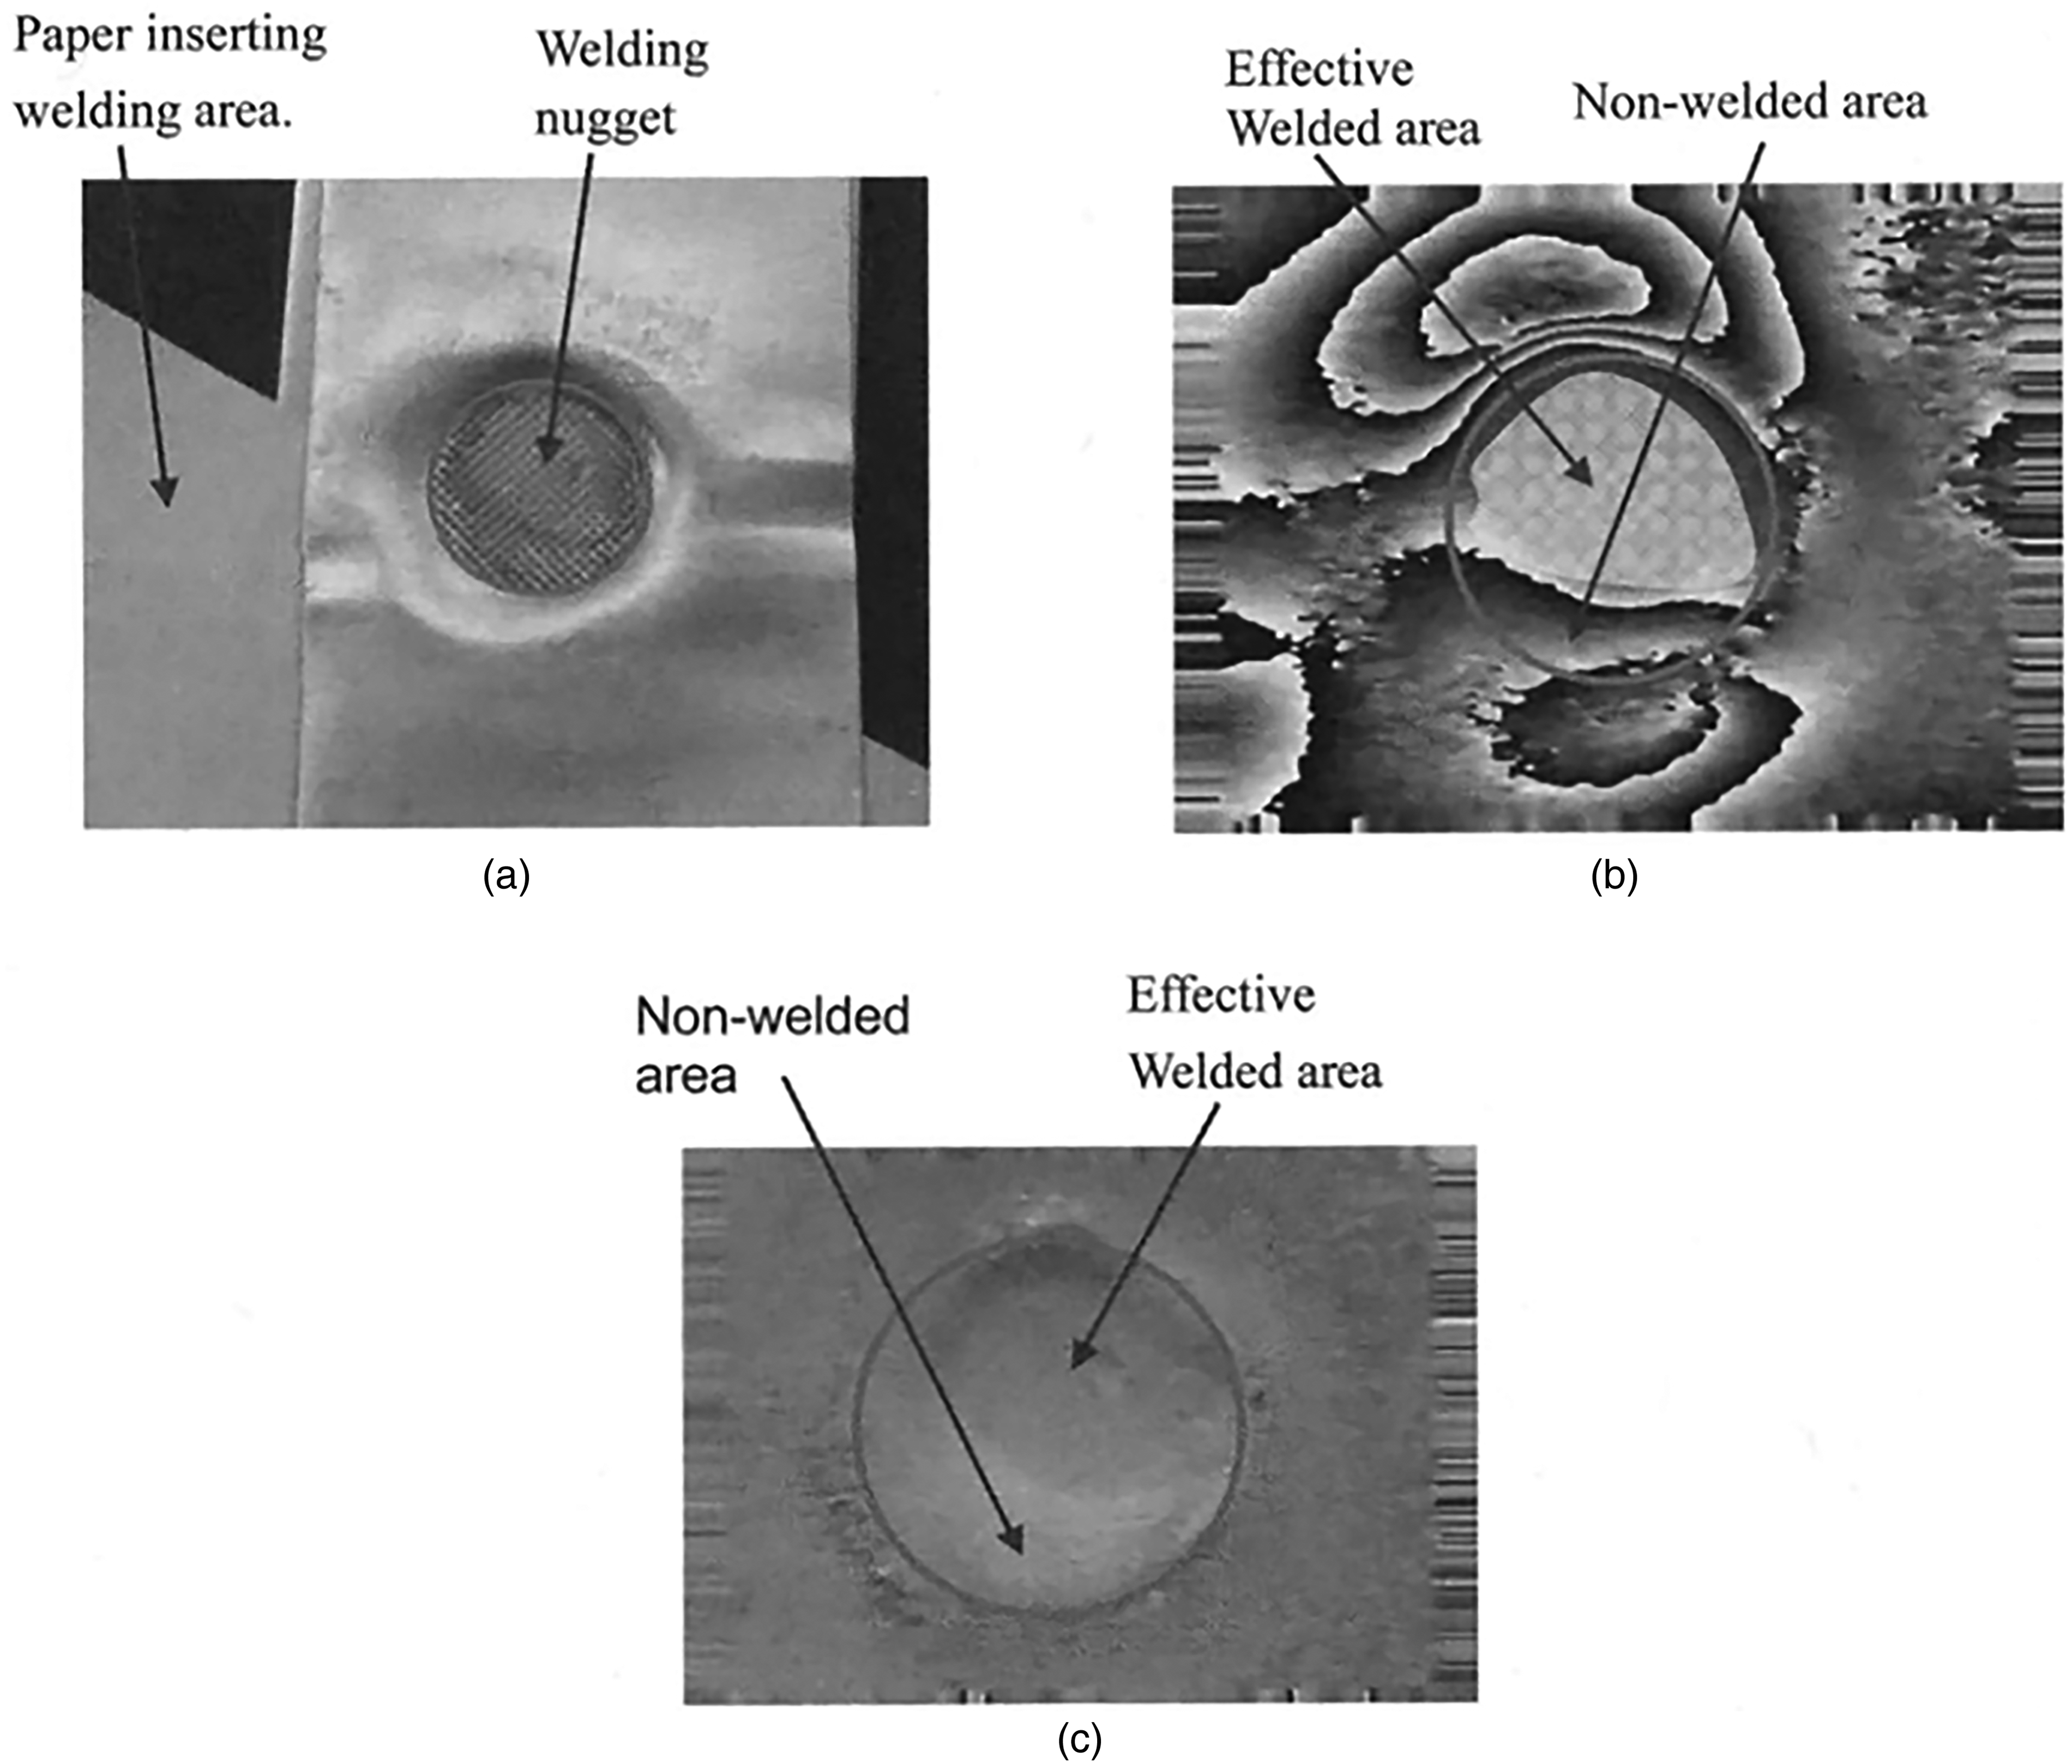
Graph of the results of the system's monitoring of samples: (a) check using paper, (b) result of heavy thermal loading and (c) result of light thermal loading. 84
Finite element simulation is used to verify the accuracy of detection, and the calculation results are consistent with the experimental results. The temperature of the results obtained in the finite element simulation is 40 °C, while the temperature of the actual results is 17 °C. Although the system is proved to be quick and sensitive, the technology needs to be further improved. When the welded material is the same, the deformation degree is the same under the condition of thermal loading, and the phase difference may not occur. Thus, welding joint condition cannot be detected. When the joint is under welded, the test method shows good results. However, there will be over-welding of ultrasonic welding joint, under which condition, the effective connection range of joint becomes larger, and the mechanical property is reduced due to excessive thinning of specimen. The joint quality may be erroneously judged as good through this method. In addition, it is difficult to use this test method which is sensitive in complex environment.
Microscopic imaging of aluminium/fibre-reinforced polymer composite ultrasonically welded joints using three-dimensional X-ray microscopy (XRM) was conducted by Staab et al. 85 Compared with TEM and SEM, XRM can use mathematical algorithm to create a virtual 3D model of the specimen without destroying it and can obtain any virtual sample cross-section for non-destructive testing of weld joints, as shown in Figure 17. In addition, they quantified the quality of the weld by comparing different algorithms and derived the effect of welding parameters on porosity.
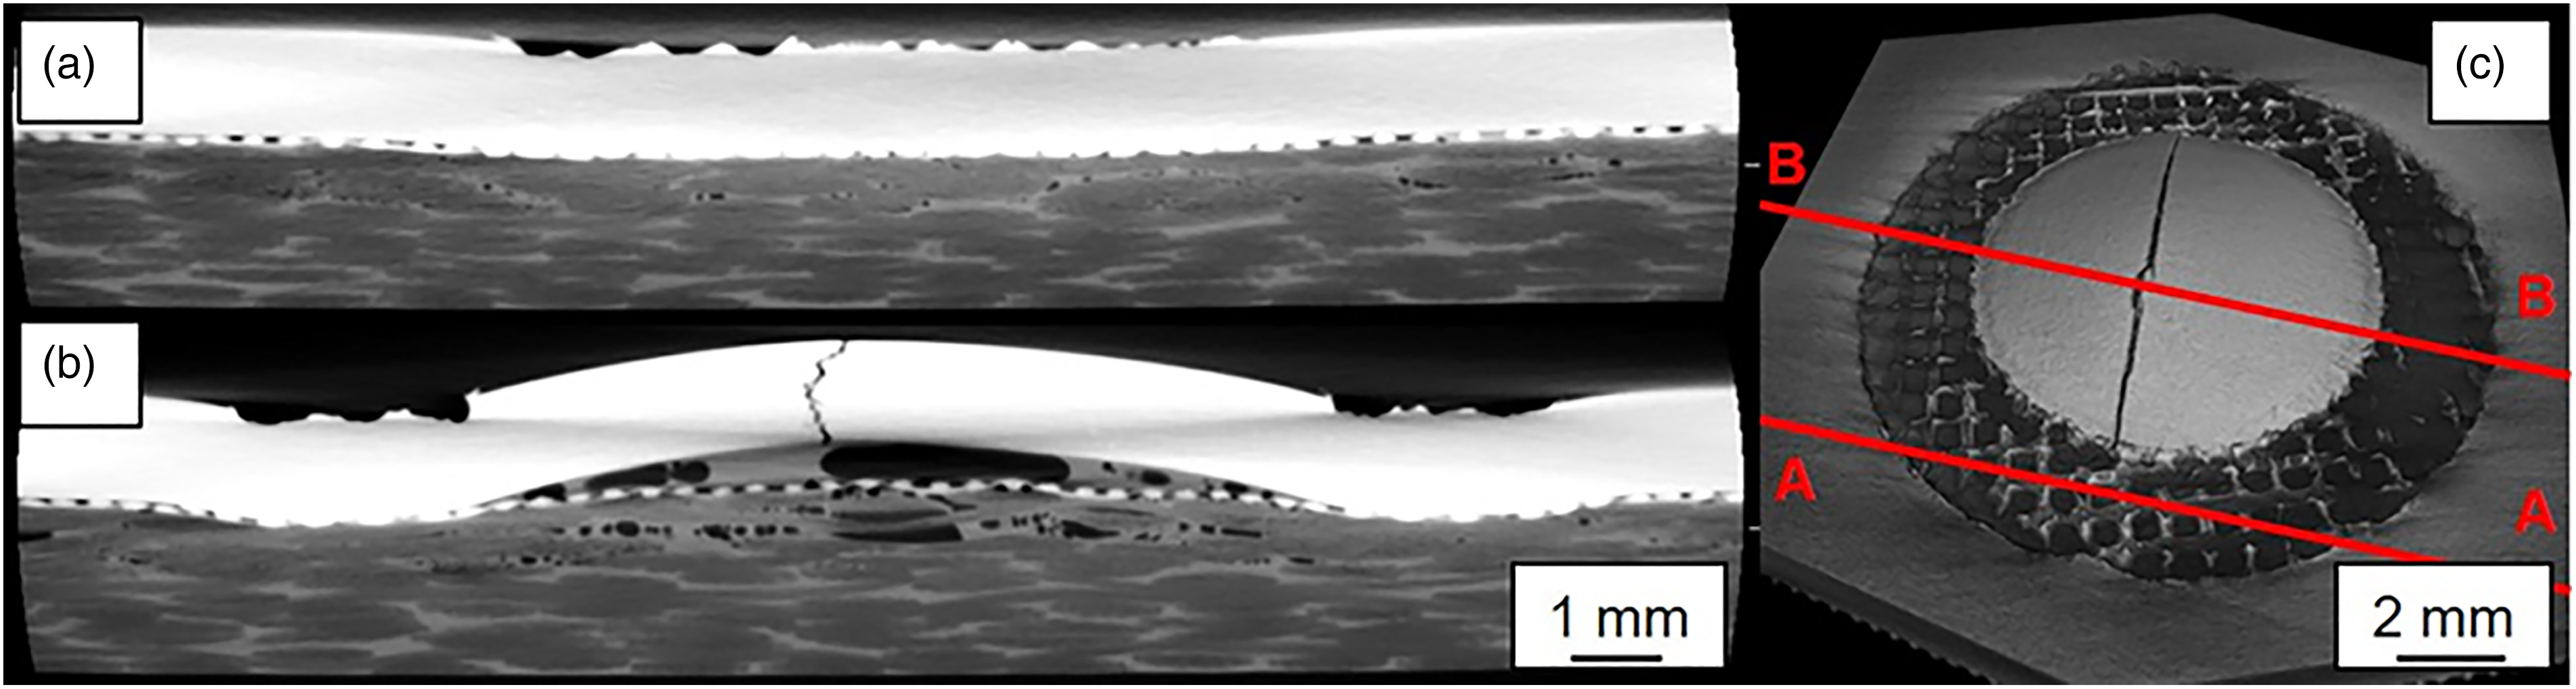
The images of the X-ray microscopy at the weld: (a) A-A cut, (b) B-B cut along the joining area of a specimen welded with non-suitable parameters and (c) overview of the specimen. 85
Ultrasonic welding, as solid state welding, rarely needs to observe the grain change, XRM, as a non-destructive testing means of ultrasonic welding joint, is very suitable, and can even replace TEM and SEM to a certain extent. Its 3D virtual model can include all sections, which is not possible for other microstructural test methods. Thus, the quantitative and qualitative analysis of weld joint can be achieved only through XRM. However, due to the same contrast ratio, there may be calculation difficulties for ultrasonic weld joints of the same metal.
Ma and Zhang 58 used confocal laser scanning microscope (CLSM) and finite element simulation to quantitatively calculate the plastic deformation of multi-layer ultrasonic weld joint, and divided the welding stage according to the microstructure. With the work hardening and acoustic softening caused by the input of ultrasonic energy, it is feasible to establish the relationship between plastic deformation and weld quality. The CLSM is able to perform non-destructive measurement of the tooth mark depth of the joint surface and the shape change caused by plastic deformation. The measurement position and the obtained measurement data are shown in Figure 18. However, the relationship between the calculation of plastic deformation and the weld quality obtained from the surface measurement data in this way is always indirect, so the connection quality of the weld joints cannot be directly reflected.
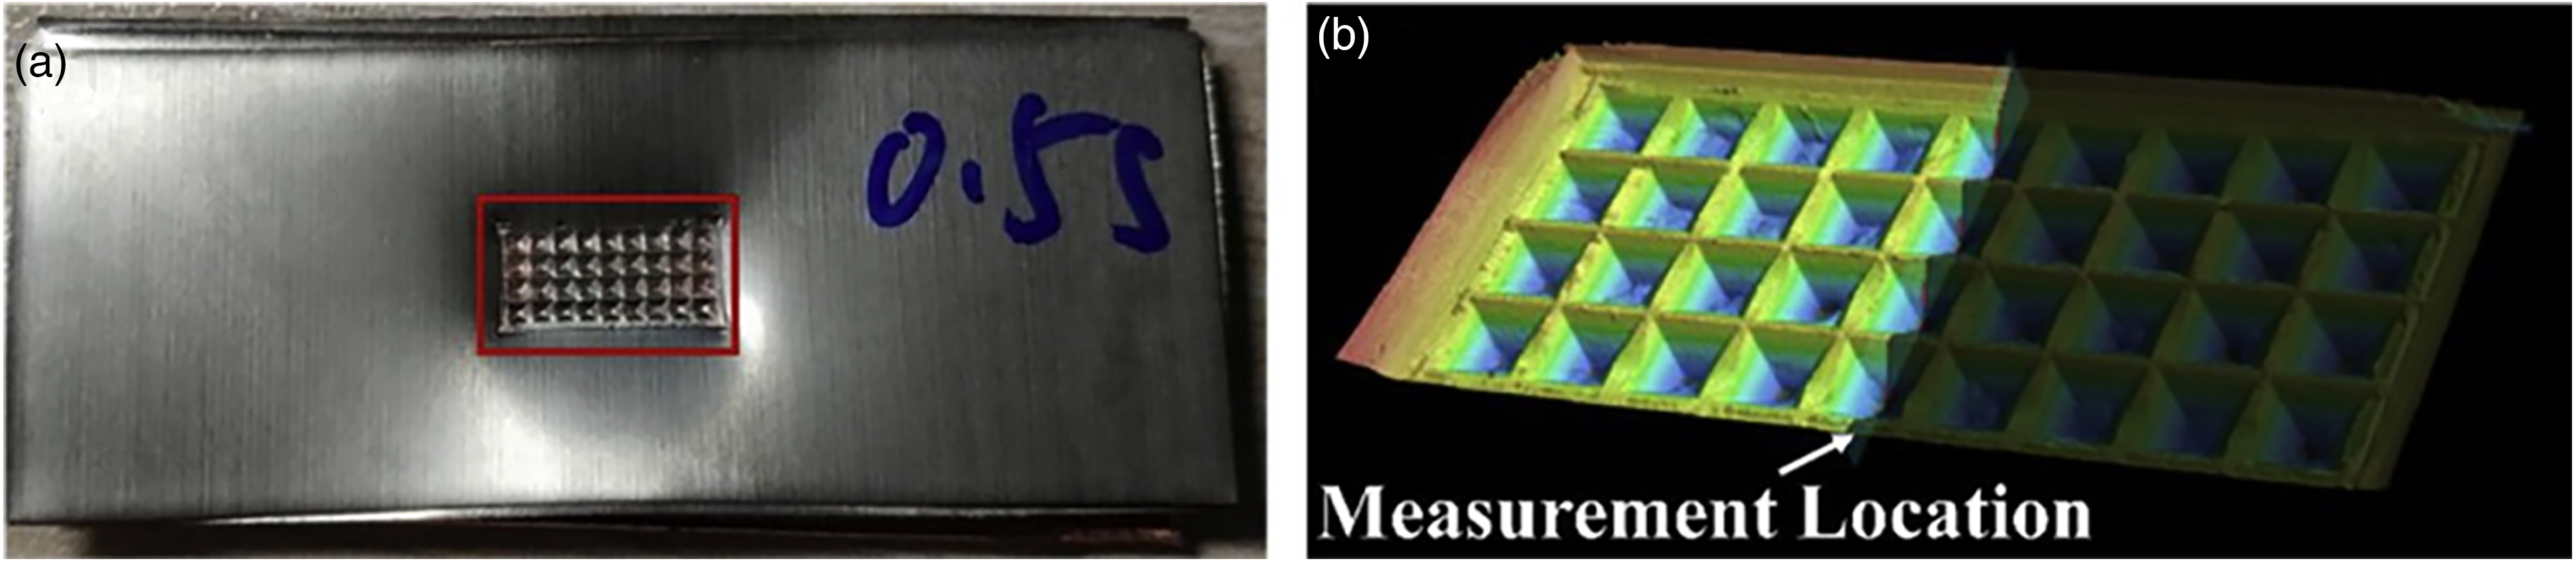
The ample at 0.5 s welding time: (a) welding sample and (b) measurement location. 58
In general, when ultrasonic metal welding specimens are subject to destructive testing in non-in-situ testing, the testing process is relatively perfect at present, but no conclusion can be drawn on the analysis after testing. There is no unified standard for weld quality, and there is still a long way to go to achieve its quantitative analysis. The problem of ultrasonic non-destructive testing for metal welding lies in the lack of testing methods. According to the previous research results, it can meet most of the requirements to use 3D X-ray microscope for non-destructive testing of specimens. However, in the long run, the penetration effect of radiation is limited, and the attenuation is serious. When ultrasonic welding can weld thick sheets, the effect of using XRM may deteriorate. More exploration should be made in finding a non-destructive testing method that can tailor to the requirements of ultrasonic metal welding. Although non-in situ testing can detect specific defects, there are still some problems. Specifically, defects such as cracks, shrinkage holes, weak weld can be detected by multiple means such as metallographic microscope and SEM. However, these are destructive testing, and can only apply to two-dimensional detection.2,38,42,54,86–89 That's why the accuracy is not very high. Although some three-dimensional non-destructive testing means will improve the accuracy of defect detection, the costs go up accordingly.84,90–93 Moreover, the size of the specimen is specially restricted in currently known non-destructive testing methods for ultrasonic medal welding.
Welding quality monitoring based on machine learning
Ultrasonic metal welding is widely used in welding of battery electrodes. Its welding window is relatively small, so its process parameters have great influence on the weld quality. Parameter optimisation and online monitoring of welding process require a large number of experimental parameters, so the application of data sets and machine learning models can play significant role in reducing the workload of experiments and achieving accurate prediction of weld quality. Compared with the traditional mathematical statistics, the machine learning method has better performance in dealing with a large number of non-linear data and can deal with the relationship between multiple input parameters and multiple response values. Its accuracy of prediction is gradually improved with the growing amount of training data, which is suitable for the prediction of ultrasonic weld quality. With the development of ultrasonic metal welding in various fields, online monitoring of weld quality becomes the key to the application of the technology in production. The flexibility of machine learning can well handle the complex input–output relationship, and real-time quantitative feedback of weld quality.
Current development of ultrasonic welding in machine learning mainly focuses on: first, modelling of prediction of weld quality and tool surface state; and second, comparing the prediction precision of these models.
Prediction of weld quality
The prediction of ultrasonic metal weld quality is mostly about the prediction of the shear strength and peel strength after welding. In the actual production process, destructive testing of finished products is required to obtain both shear and peel strengths. The weld quality of finished products can be predicted using machine learning, which is underpinned by the training of data. The error rate of prediction can be less than 1% if the machine learning model is appropriately selected. In turn, the results of machine learning can be applied to process optimisation, and the optimal solution of input parameters can be obtained through prediction of weld quality, which saves the time of searching for the optimal process parameters. This is especially suitable for ultrasonic welding technology due to its high sensitivity to process parameters.
Zhao et al. 94 probed into the effect of welding parameters on tensile strength of ultrasonic spot welding joints of aluminium and steel using machine learning, discovering that the relationship between welding parameters and tensile strength is non-linear. Therefore, the artificial neural network (ANN) model without explicit formula is selected and optimised by genetic algorithm (GA). There is a high correlation between its predicted results and the measured values, on the basis of which the influence of welding parameters is explored. Prior to this, 17 they tried to use the machine learning method to analyse the tensile strength of the ultrasonic weld joints of magnesium alloy and titanium alloy. The model they selected was ANN, and the WP has the biggest influence on the tensile strength of the joints. In this paper, the most significant effect on the tensile strength of aluminium and steel ultrasonic weld joints is the WT. The welding parameters are intercorrelated, and the optimal interval of residual parameters will change when a parameter changes, which is similar to the results obtained in the previous literature. Using machine learning method, the process parameters of ultrasonic spot welding are optimised, and the workload needed for experiments is reduced. More attention is paid to exploring the influence of welding parameters on the tensile strength.
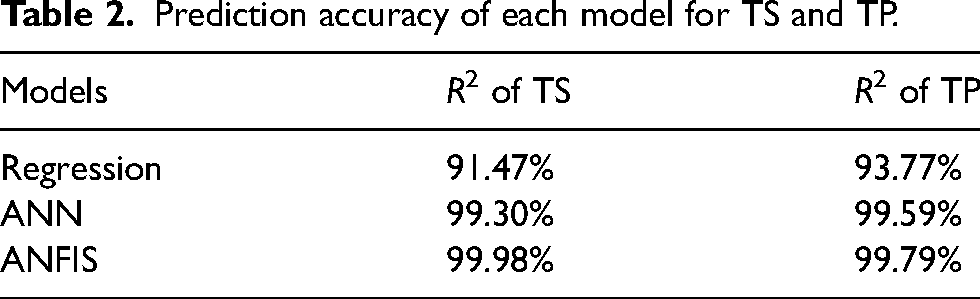
Satpathy et al. 95 employed the method of machine learning to predict the strength of aluminium-copper dissimilar metal ultrasonic weld joints. Three machine learning models are selected, namely regression, ANN and adaptive neuro fuzzy inference system (ANFIS). The input parameters are WP, WT and amplitude (A), and the output parameters are joint TS and TP. Based on the experimental variance analysis, the WP has great influence on TS and TP, and the modelling prediction results show that ANFIS model is most reliable, as shown in Table 2. Each group of experimental data is repeated for six times to eliminate the anomalies and instabilities in the experimental process, so as to improve the prediction accuracy. The same experimental conditions can be executed well in the specific parameter range. However, in the actual production process, the anomalies and instabilities cannot be eliminated, and the actual weld quality of the work pieces cannot be accurately predicted by the model.
Prediction accuracy of each model for TS and TP.
Meng et al. 72 used machine learning to optimise the shear strength and peel strength of ultrasonic metal welding joints. The support vector machine (SVM) algorithm was selected, and different kernel functions were compared. Apart from the comparison of prediction results, the response surface method was also used to compare the prediction results of shear strength and peel strength. With same parameter range, the shear strength and peel strength reach the optimal interval in different range. To maximise the composite strength index, the researchers made a simple composite calculation for the two strengths to determine the optimal interval of both parameters. The compound calculation was performed with normalised sum, which provided a very good idea. From the results presented, the shear strength obtained two local maximum values on the response surface, and the peel strength only one. The welding parameters of optimal compound strength were predicted and obtained by the machine learning model and compared with experimental results. Among them, the support vector regression radial basis kernel function and Gaussian process regression radial basis kernel function are more accurate in prediction. However, there is still room for further optimisation, since the SVM algorithm is still low in accuracy compared with the ANN models used in other papers.
Mongan et al. 96 used a hybrid machine learning model to predict the shear strength of ultrasonically welded aluminium alloy joints. GA and ANN were combined to reduce the main defects of ANN algorithm and optimise the convergence path. The input parameters are welding energy, WP and amplitude, and the output parameter is shear strength. To ensure the authenticity of prediction, the model can be applied to manufacturing, and the peak power is added as process feedback to form closed-loop prediction. Experimental analysis of variance shows that amplitude is the main influencing factor on shear strength, which is different from the results published by other scholars. The authors speculated that it was related to the interplay between the material and the input parameters. Data were extracted from Figure 19, showing that the Pearson correlation coefficient (PCC) for the open-loop prediction, closed-loop prediction of 0.87 and 0.92 respectively based on the Lap Shear Strength (LSS) measurement, as shown in Figure 20. The accuracy of the closed-loop prediction, as is demonstrated, was better than that of the open-loop prediction, so using machine learning to predict the shear strength of weld joints is feasible in real production.
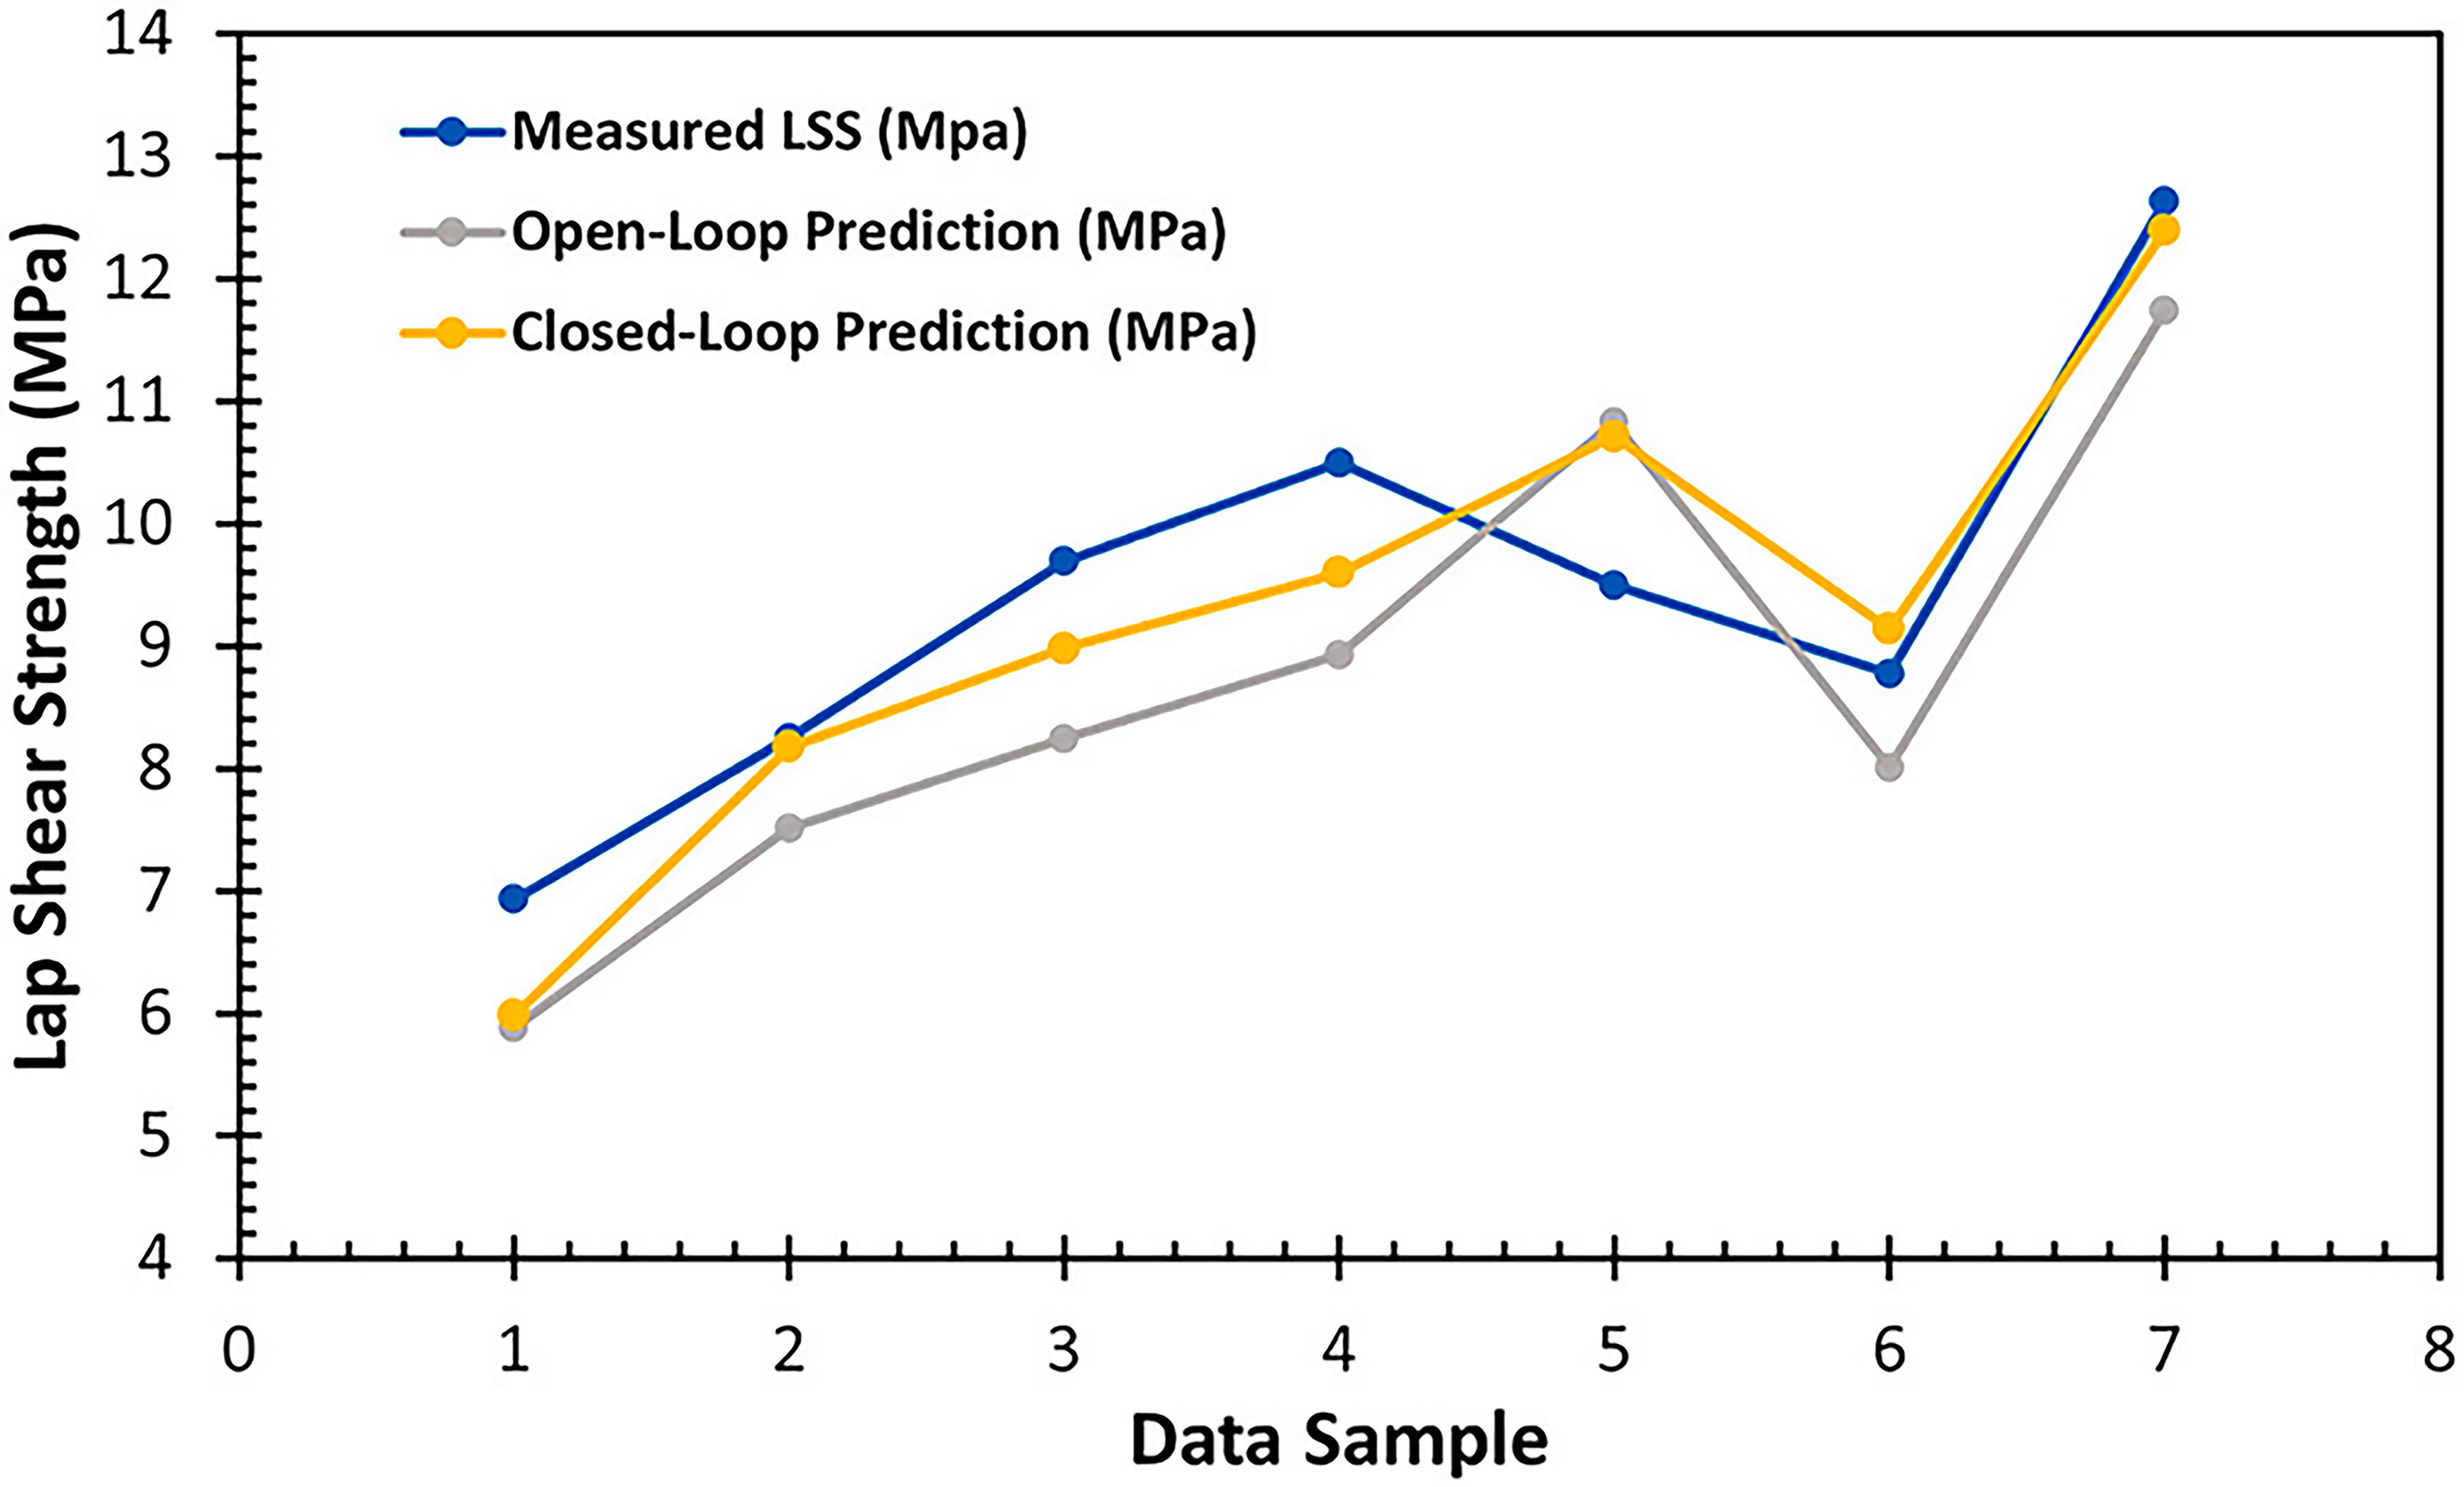
Comparison of open-loop prediction, closed-loop prediction and LSS measurements. 96
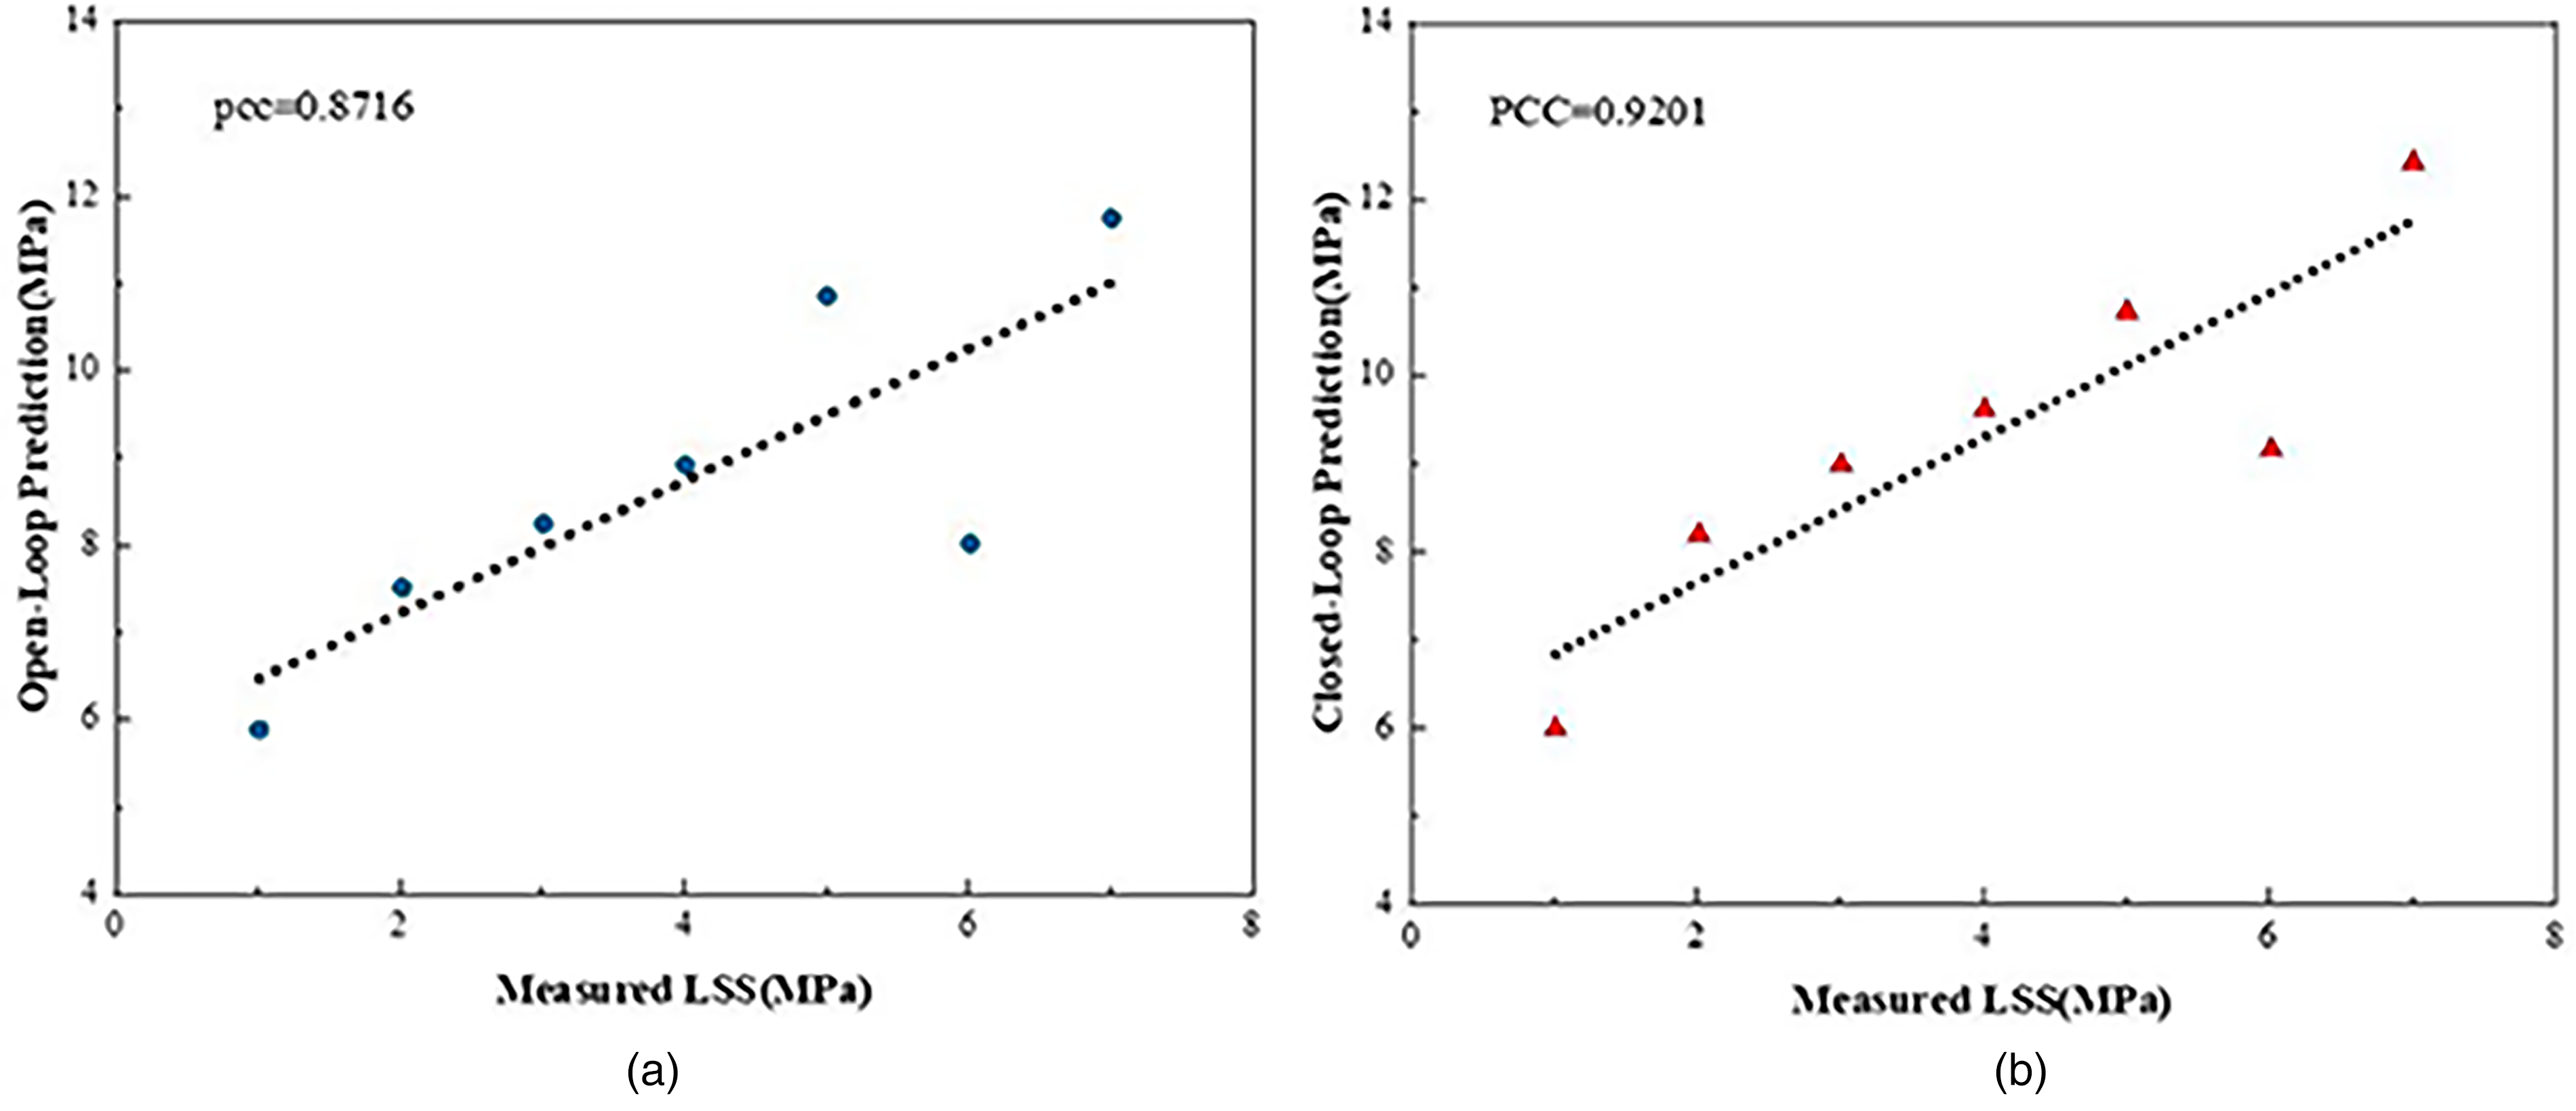
Prediction accuracy: (a) regression analysis between open-loop predictions and LSS measurements and (b) regression analysis between closed-loop predictions and LSS measurements.
Although closed-loop prediction improves the accuracy of the model, there is still room for improvement, and additional process parameters can be included to provide more information about the welding process or to adjust the machine learning model.
Tool state modelling
The wear degree of tools is a major influencing factor in ultrasonic welding. If direct monitoring is adopted in the production process, the production process will be stopped and the time cost will be increased. If the tool surface state is modeled by means of indirect monitoring and machine learning, the offline monitoring of tool surface state can be realised, the service life of the tool can be estimated and the production cost can be reduced.
Nazir and Shao 62 modeled the surface of welding horn and anvil, collected their displacement signal, power curve of welding machine, acoustic emission signal and sound signal, extracted representative characteristics from them, adopted linear discriminant analysis (LDA), quadratic discriminant analysis (QDA), logistic regression, k-nearest neighbours, SVM, naive Bays, decision tree, random forest, gradient boosting and extra tree, and compared the prediction results to draw a conclusion. Figure 5, for example, shows that the optimal models of different eigenvalue prediction results are different. In terms of tool surface wear state, it is more clearly classified by the characteristics of displacement signal and acoustic emission signal. The discrepancy in different states is obvious, and the separation of sound signal and power signal is worse than the above two signals. Compared with the high-resolution measurement of tool surface, using sensors can shorten the downtime. However, the system is developed based on this can only classify the status of the tool and cannot simulate its remaining use time, which has been already pointed out by the author, who also mentioned that the real-time condition of the tool surface cannot be predicted. Compared with the direct measurement of the tool surface, the measurement data used is more likely to be influenced by other factors, undermining the accuracy of the prediction results.
Chen et al. 97 conducted spatiotemporal modelling of the anvil surface, the data of which was measured by laser scanning confocal microscope. A model was built combining multi-task learning and spacetime kernel method (STK-MTL) to solve the problem of data shortage. It was then compared with space-time kernel based single task learning (SK-STL), space-time kernel based single task learning (STK-STL) and space kernel based multi-task learning (SK-MTL). The results show that STK-STL makes more accurate prediction when the data is sufficient, but the precondition is that the availability of target data has to exceed 80%. In reality, the measurement cost of anvil surface data is very high; the data is limited; and it is difficult to meet the requirement for more accurate prediction by STK-STL. In contrast, when the data is missing, STK-MTL gives a more accurate and stable performance. Based on the representation of the four models shown in Figure 21, STK-MTL is optimal in terms of accuracy and stability, on the basis of which, further improvement can be made. When the data availability is less than 80%, STK-MTL is used for anvil surface state prediction, and when the data availability is more than 80%, STK-STL is used for prediction, because at this point, the prediction accuracy of STK-STL is significantly increased, and the combination of the two models may further improve the accuracy and stability.
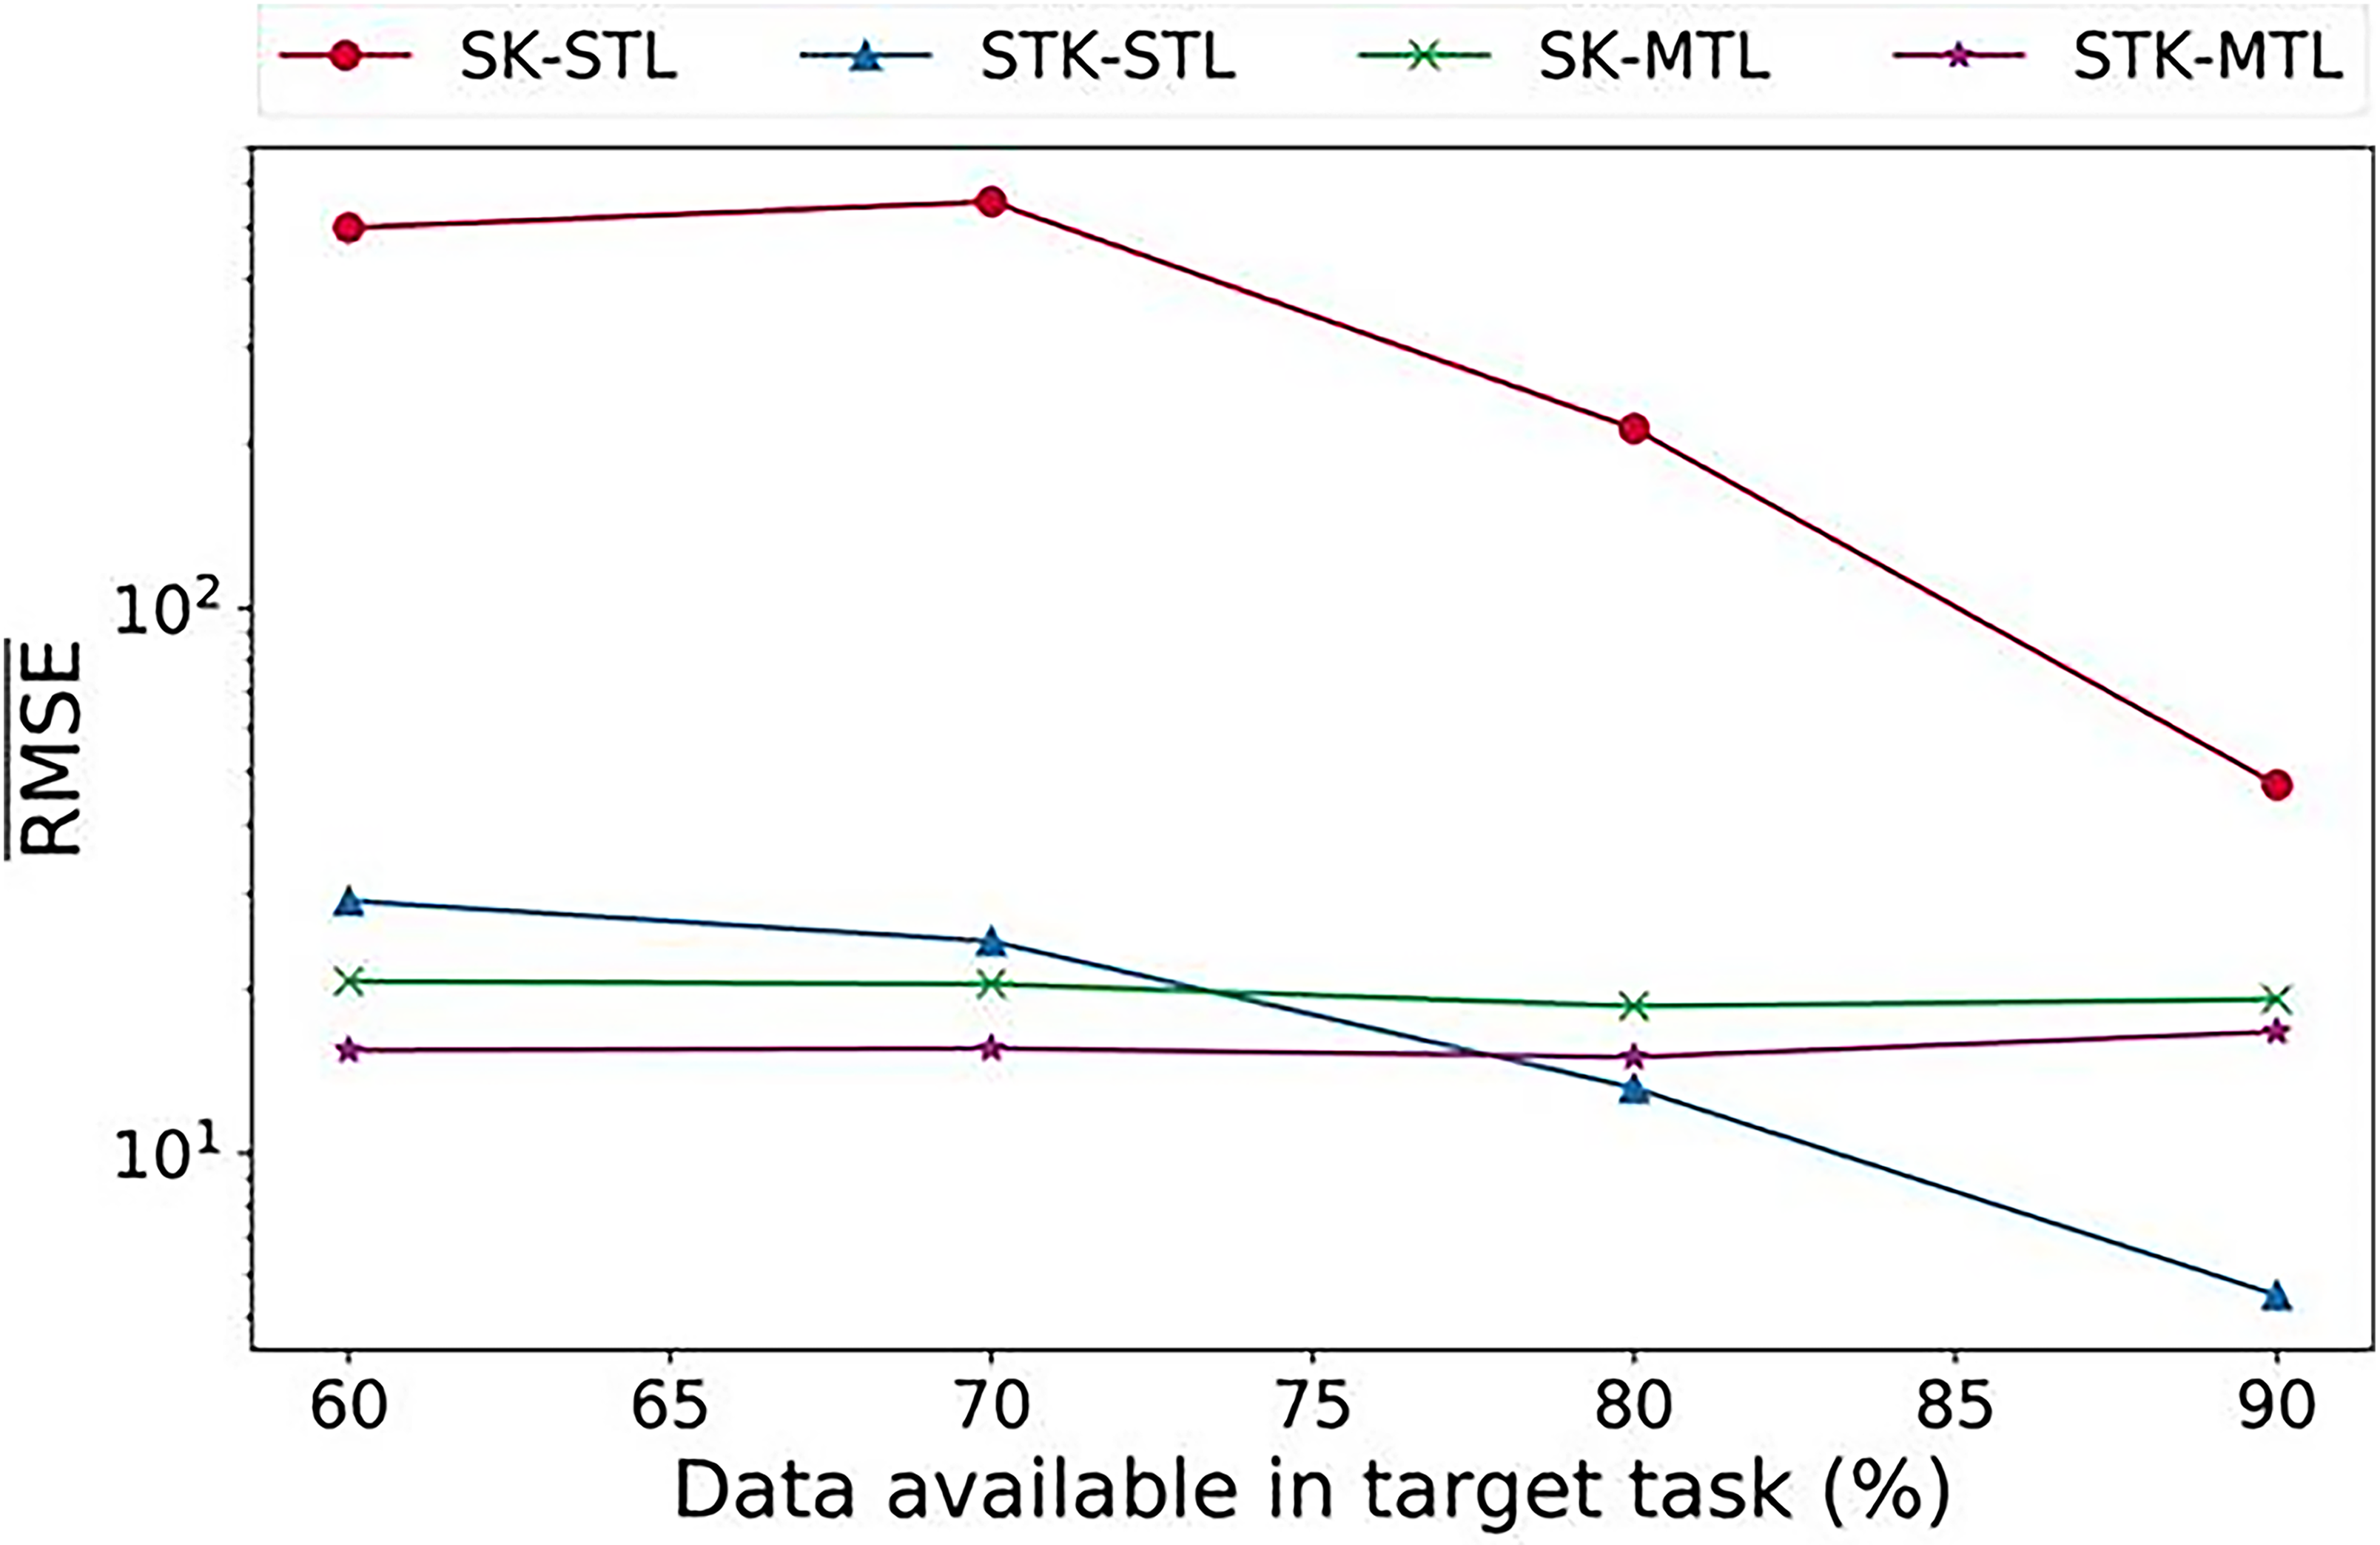
Comparison of prediction accuracy of models with different data amounts. 97
The selection of machine learning model and input parameters can both influence the precision of prediction results. The influence of different models and input parameters on the prediction precision of weld joint tensile strength is shown in Table 3.
Impact of different models and input parameters on the prediction accuracy of the tensile strength of welded joints.
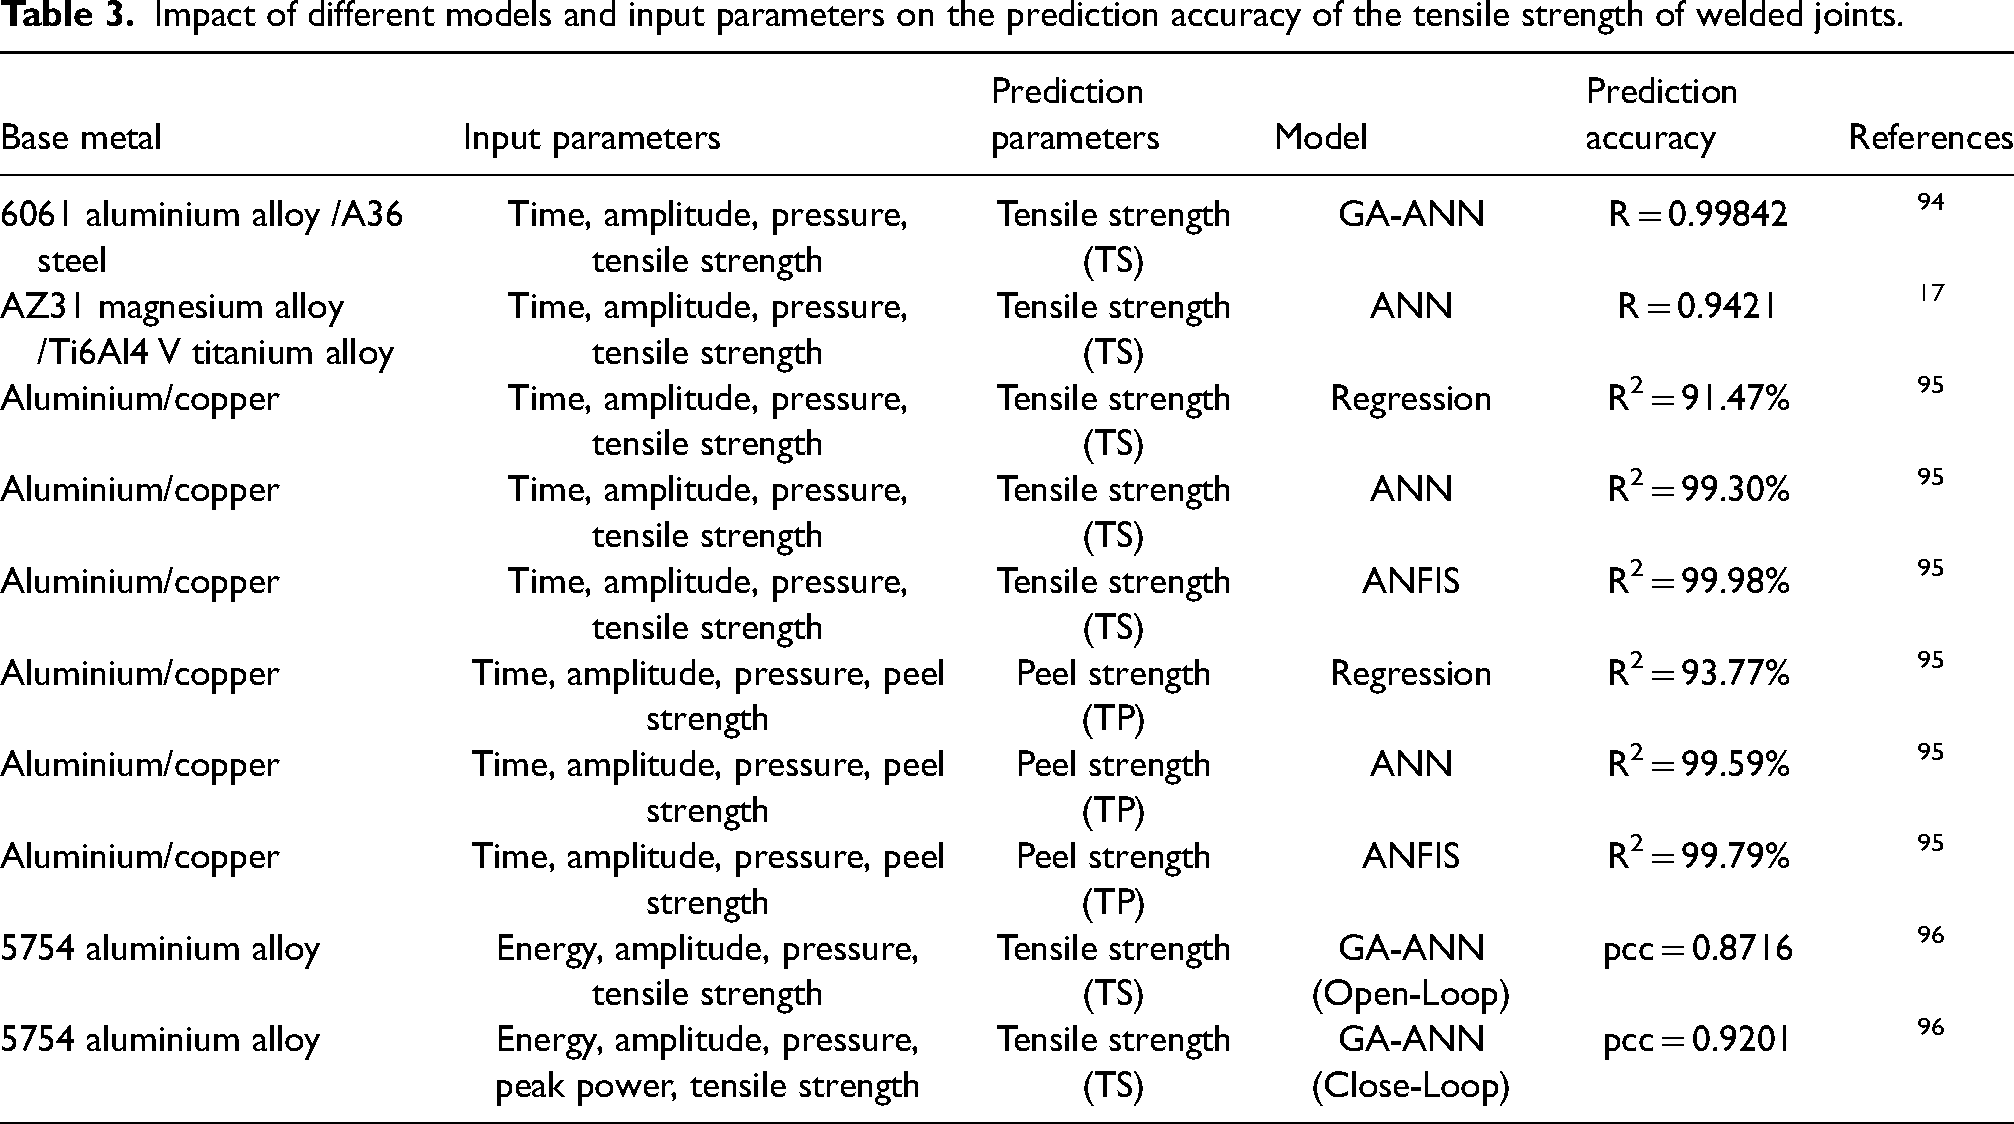
As of now, the most precise prediction model is ANFIS. In addition, the adoption of a composite model, that is, the use of GA in path optimisation can help increase the efficiency of the prediction model. The closed-loop prediction can improve the prediction accuracy of the model. However, there has been few research in this area, and peak power is the only kind of negative feedback signal.
Conclusion and scope for future research
This paper summarises the previous research results of joint quality monitoring in ultrasonic metal welding by in-situ test (online monitoring) and non-in-situ test, involving the quality prediction of weld joints using machine learning method, and compares the prediction accuracy of different models.
The online monitoring of ultrasonic metal welding joint quality is still in its infancy and mainly studied form two dimensions: welding process signal acquisition and welding horn and anvil surface state monitoring, which can predict the weld quality of workpiece. Most of current research focuses on establishing the relationship between process parameters and the mechanical properties of weld joints. The machine learning method is used to process and analyse the huge amount of data generated. However, the transverse comparison of the effect of process parameters on the joint performance is lacking, and there is only a single way in evaluating the mechanical properties. It is necessary to increase macroscopic, mesoscopic and microscopic observation and analysis, conduct quantitative evaluation of weld quality on multiple scales, and compare how the process parameters can reflect the weld quality, so as to improve online monitoring accuracy of weld quality.
Compared with online monitoring, non-in-situ is a relatively more mature testing technology in monitoring the quality of ultrasonic metal welding joints. At present, some scholars have classified and defined the quality of ultrasonic welding in the field of mechanical properties, but the definitions are not standardised. Although ultrasonic welding has the characteristics of both solid state welding and pressure welding, the welding window is small. That's why traditional evaluation methods of solid state welding and pressure welding cannot be used. Further exploration and improvement are needed for the development of a quality evaluation system for ultrasonic welding. In addition, the non-destructive testing of ultrasonic welding is limited by the size of the welding area, making it difficult to follow the traditional path. Update of non-destructive testing equipment and the introduction of advanced technical means such as industrial CT, 3D X-ray, etc., may solve this problem.
Machine learning can effectively facilitate the analysis and prediction of the quality of ultrasonic weld joints. Based on previous research results, the complicated dynamic between welding parameters of ultrasonic welding makes the algorithm of ANN better in quality analysis and prediction. Proper selection of machine learning model, optimisation of convergence path through integrating with other algorithms, and addition of process parameters to form closed-loop prediction will improve the prediction accuracy of weld quality. Process parameter can indicate the changes that could happen in the welding process, and further explorations should be made about the effects of process parameter selection and combination on the precision of the machine learning model.
Footnotes
Acknowledgements
This work was supported by the National Natural Science Foundation of China (Grant No. 51905358), Natural Science Foundation of Hebei Province (Grant Nos. 2020210095, E2020210077 and E2019210159).
Declaration of conflicting interests
The authors declared no potential conflicts of interest with respect to the research, authorship and/or publication of this article.
Funding
The authors received no financial support for the research, authorship and/or publication of this article.