
Abstract
This study advances the understanding of cleantech commercialisation by adopting a market validation approach to analyse equity capital’s role in navigating the ‘Valley of Death’. Focusing on the three core financial milestones – revenue generation, profitability and retained earnings – we investigate 354 UK cleantech firms over 10 years and employ Cox proportional hazard models to explore whether equity capital speeds or slows the achievement of these three financial milestones. We conclude that equity capital-backed firms are slower across the Valley of Death. We discuss the implications of our findings for cleantech firms and those seeking to support the financing of cleantechs.
Introduction
The International Energy Agency (2021) identified that net-zero emissions will be possible by 2050 with a major acceleration in cleantech innovation. Unfortunately, nearly half of potential cleantech innovations are hindered at the demonstration or prototype stage, often unable to develop and scale their business (Ghosh and Nanda, 2010; IEA, 2021). This transition from prototyping to scaled-up commercialisation is characterised as the ‘Valley of Death’ (Auerswald and Branscomb, 2003; Dean et al., 2022; Frank et al., 1996; Markham et al., 2010; Markham, 2002). A central challenge in crossing the Valley of Death is the presence of financial gaps (Murray, 1994). Consequently, cleantech firms are often advised to make use of equity capital. Such capital is advantageous because it is ‘patient’ finance; ready to fund a nascent or scaling cleantech through the rigours of achieving revenues, building profitability and developing financial sustainability (Bocken, 2015; Owen et al., 2018). However, few studies have examined how equity capital contributes to cleantech performance, even though it is difficult to see how the precepts of the 2015 Paris Agreement will be achieved without cleantechs scaling up their business. Indeed, Owen et al. (2021: 1169) points out that ‘There has been a limited amount of research in the area of early-stage Cleantech SME impact investment’. Equally, the role of equity finance in supporting young cleantechs remains contentious. The presence of long investment lead times, sunk costs, high capital requirements, information asymmetries, demand uncertainties and the under-pricing of social and environmental benefits (Cowling and Liu, 2021; Cumming et al., 2016; Wilson et al., 2018) have led some to critique the value of equity capital in supporting cleantech entrepreneurs to cross the Valley of Death (Gaddy et al., 2017; Lahr and Mina, 2016; Van den Heuvel and Popp, 2023).
This article explores these issues and asks: Does equity finance help cleantech firms navigate the valley of death more speedily than non-equity financed firms? A cleantech firm is a private for-profit enterprise focused on developing and commercialising technologies that promote clean energy solutions. These firms aim to enhance energy efficiency, reduce environmental impact and support sustainable practices through innovations in energy generation, storage, transmission and management (Gaddy et al., 2017). Cleantech firms are pivotal in addressing global environmental challenges by providing cleaner, more efficient alternatives to traditional energy sources. We see equity capital as risk capital provided by business angels, governments, venture capitalists and equity crowdfunders. Our starting point for defining the Valley of Death is to see it as a series of acute innovation management stages and recognise that a central challenge is funding finance gaps (Auerswald and Branscomb, 2003; Cowling et al., 2021b; Gbadegeshin et al., 2022; Markham et al., 2010).
Our central focus, however, following on from Osawa and Miyazaki (2006) and McMullen and Dimov (2013), is first to appraise the journey across the Valley of Death through a market validation lens where the central challenges are to achieve market visibility, traction and acceptance. Our proxies for these key stages are three critical financial milestones across which equity capital may, or may not, assist a new cleantech to traverse the Valley of Death. The first of these is for the cleantechs to generate revenues. This is an important end to the start-up phase because it demonstrates that they can create and deliver a product and capture customer value (Teece, 2010). Paying customers is central to delineating entrepreneurial opportunities from business ideas (McMullen and Dimov, 2013; Shane and Venkataraman, 2000). Having sales does not necessarily signal market traction or business viability. A second challenge, facing any start-up, is to move from the first sale to scaling. The problem with scaling being that costs often outstrip revenues; consequently, another critical financial milestone is the business’s ability to break-even in that the customer is willing to pay more than the costs of producing a product or service. Achieving profitability, though, does not necessarily account for prior losses. Our third and final milestone – where we see that the business is viable and sustainable – is if it can generate retained earnings (Da Rin and Hellmann, 2020; Osawa and Miyazaki, 2006; Storey and Greene, 2010).
This article offers two contributions. First, it refines prior conceptual understandings of the Valley of Death. Although there has been no agreed conceptualisation of the Valley of Death, prior literature has pointed to this as a pivotal journey for technology-orientated firms as they seek to turn inventions into commercialised products and services and the importance of entrepreneurial finance. In this study, our novelty is approaching the Valley of Death from a market validation perspective and seeing it as a journey across three vital financial milestones. This approach has practical implications as it affords scholars and practitioners a tractable market validation model of the Valley of Death. Our second contribution is to extend the empirical evidence on the relationship between equity capital and cleantechs. Much of the available literature focuses on accessing equity capital, investor returns or the wider impacts of equity capital on job creation and gross value added in a given economy (Bertoni et al., 2011; Samila and Sorenson, 2010). By comparison, while studies have examined the relationship between equity capital and cleantechs at the industry level, few studies have examined the impact of equity capital on individual cleantechs, and none, to our knowledge, have investigated if equity capital accelerates or retards the achievement of key financial milestones across multiple types of equity capital provider (venture capitalists, business angels, governments or crowdfunders).
Our empirical research focuses on all 354 cleantechs incorporated in the United Kingdom in 2011/2012 and follows them for a decade to ascertain if and when they achieved the financial milestones. The United Kingdom is a suitable country for understanding the contribution equity capital can make to cleantechs because, except for 2013 and 2016, it had the highest level (millions of US dollars) of equity investments in Europe from 2011 to 2021 (OECD, 2024). We employ a Cox proportional hazard approach to account for temporality. The article is structured as follows. The next section examines the Valley of Death and develops our hypotheses. We then turn to our methodology and explain our choice of Cox regression modelling to investigate the relationship between the use of equity capital and vital events along the Valley of Death. We then present our results, discuss their implication and finally, offer concluding remarks.
Background and hypotheses
Resource-based conceptualisations of the Valley of Death
There is no agreed definition of the Valley of Death (Gbadegeshin et al., 2022). 1 Nonetheless, the extant literature focuses on two main aspects. The first is to see the Valley of Death as an innovation management stage to be overcome by the technology-orientated business as it transitions from turning an idea into a commercialised product or service (Gbadegeshin et al., 2022). Crossing the Valley of Death involves a journey from initial R&D through to the development of a functional prototype (proof of concept/minimum viable product), business and product development and production and marketing (sales and commercialisation) (Auerswald and Branscomb, 2003). Markham et al. (2010) also discussed the innovation management challenges facing a new business crossing the Valley of Death – defined as the space between opportunity discovery and product development – again as a series of management stages encompassing discovery, pre-new product development, development and commercialisation.
Beard et al. (2009) and Hartley and Medlock III (2017) further refined these approaches by arguing that it was important to delineate why the Valley of Death is a valley. Both studies offer theoretical insights into the challenges faced by new firms in securing necessary funding during critical development stages. A valley implies not only a decline to a base but also that there are relatively high points with relatively fewer challenges. Beard et al. (2009) decompose the Valley of Death into three stages: basic research (stage 1), invention to innovation (stage 2) and commercialisation/diffusion (stage 3). They argue that the ‘ends’ of the valley (stages 1 and 3) are relatively less of an issue because the entrepreneur may be able to self-finance using for example, personal savings, insider finance sources such as family, friends and fools, and use public sources of funding such as government grants, to fund stage 1. In contrast, for stage 3, entrepreneurs can rely on business revenues and profits to sustain their business. Therefore, these scholars suggest that the Valley of Death is particularly acute in the second stage from invention to innovation. The other main feature of the Valley of Death literature is to see the journey from invention to innovation as being marked by a dearth of financial resources that may see the new business perish, with closure rates being greater than 80% (Marmer et al., 2011; Romme et al., 2023; Song et al., 2008). Frank et al. (1996: 61) held that ‘The valley of death occurs when the developer of a particular technology has successfully demonstrated the efficacy of the technology but is unable to obtain financing for the scaleup and manufacturing process’. Beard et al. (2009: 345) argued, ‘For there to be a “valley” in the innovation sequence, we must observe a shortfall of funding at an intermediate stage that is more systematic and profound than the shortfall to either side of the intermediate stage’. Others, meanwhile, have suggested that the Valley of Death is typified by ‘an extended period of negative net cumulative cash flow’ (Norberg-Bohm, 2000: 126) while others suggest that it ‘is a situation when new businesses cannot break-even’ (Gbadegeshin et al., 2022: 1).
In summary, the tendency in earlier theoretical studies has been to give primacy to resource acquisition and mobilisation in conceptualising the Valley of Death. Although there is limited empirical testing, there are good reasons for stressing inputs rather than outputs and means rather than ends. After all, assembly, configuring and using resources can be a source of competitive advantage (Barney, 1991; Clough et al., 2019; Penrose, 1959). However, one challenge with this approach is that it gives primacy to means-based questions such as ‘where’, ‘how’, ‘when’ regarding how to locate, acquire and mobilise resources rather than goal or ‘end’ based questions that focus on ‘why’ based questions. We see this as an issue because, for example, at the revenue generation stage, what distinguishes a new venture from a nascent venture is not whether an individual has recognised an opportunity nor if they conducted activities such as building a working prototype, profiled customer demand, or if they sought out and accessed equity finance; rather, if they have made an actual sale to a paying customer (Gartner, 1988; Davidsson, 2023; McMullen and Dimov, 2013; Shane and Venkataraman, 2000).
A market validation conceptualisation of the Valley of Death
We seek to reconceptualise the Valley of Death as a market validation approach involving achieving start-up, scale-up and sustainability. A stimulus for this being Osawa and Miyazaki’s (2006) earlier model (Figure 1) that suggested that, over time (horizontal x-axis), there were five key Valley of Death stages: research, development, product launch, success as a new product and success as a business while, on the vertical y-axis, they depicted cumulative profits/losses. They identified that initial losses were limited between the R&D and technology transfer periods but deepened with product launch and became even steeper as the product progressed to commercialisation. Only when the product successfully scales up can it be regarded as having climbed out of the steep Valley of Death (success as a business).
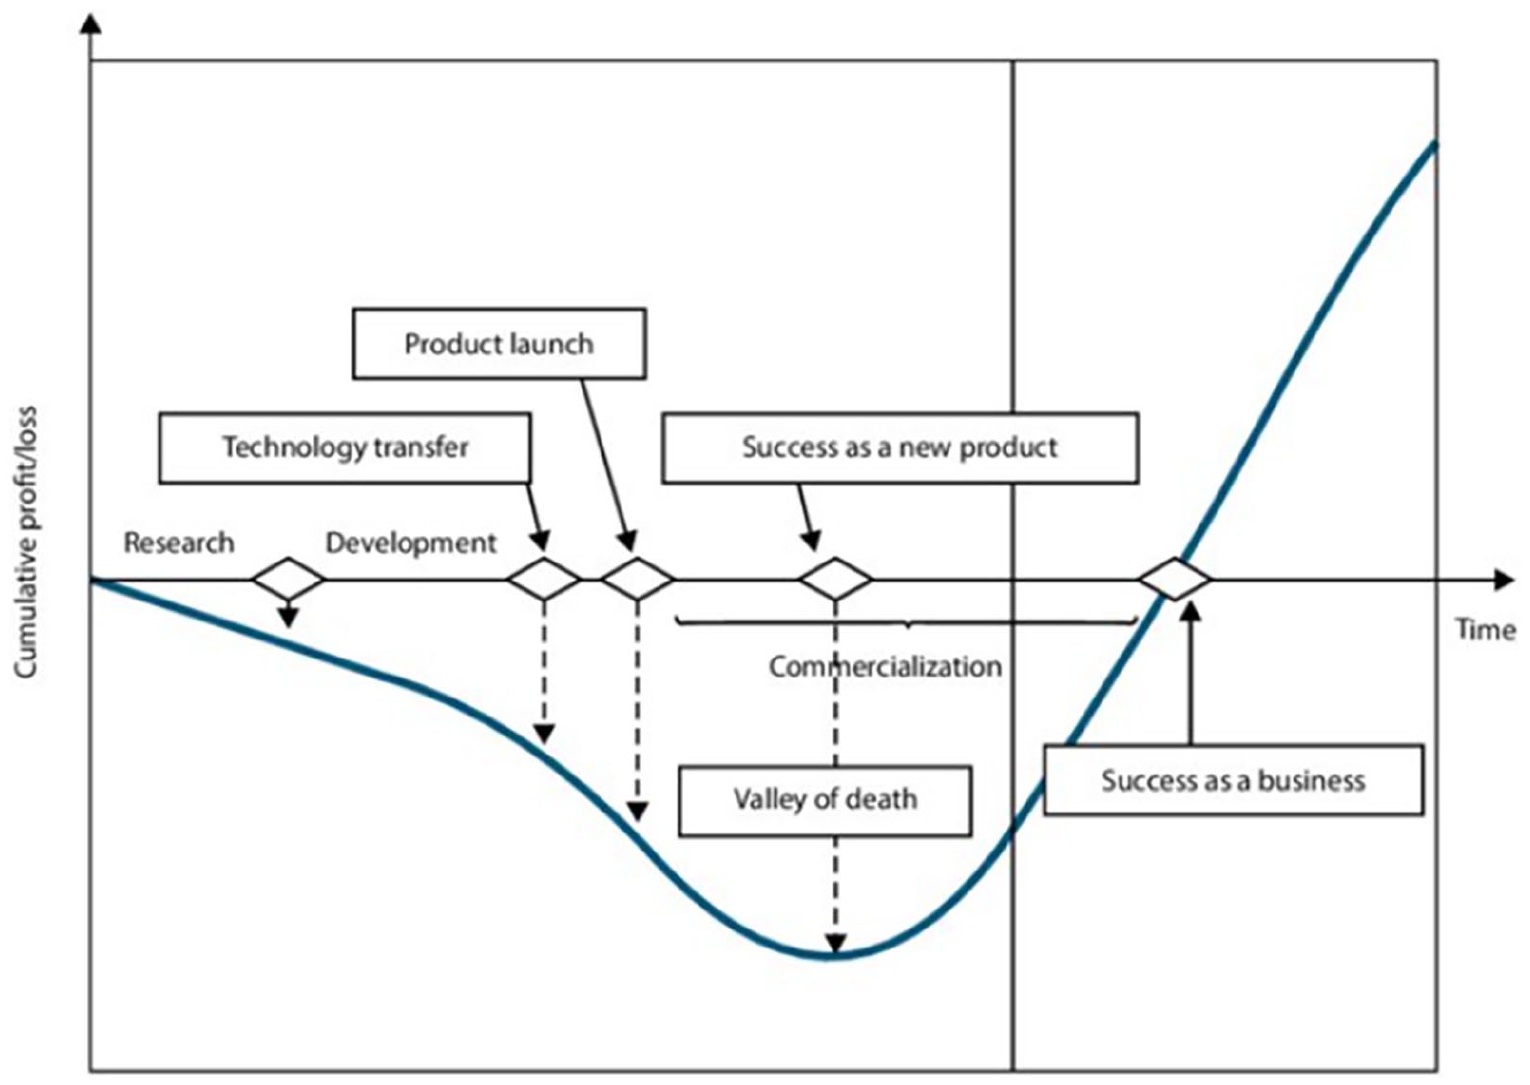
Osawa and Miyazaki’s (2006) Valley of Death.
McMullen and Dimov (2013) also identified the need for greater clarity about how entrepreneurs form new ventures. Indeed, there is significant evidence that it involves a range of supporting activities such as opportunity recognition, setting boundary conditions, for example limited liability status, articles of association, and collecting and configuring human, social or financial resources (Davidsson, 2023; Katz and Gartner, 1988; Penrose, 1959; Storey and Greene, 2010). Equally, there is further evidence that shows that the sequencing of these actions may be non-linear, have different start points so, for instance, an entrepreneur may decide to set up a business after receiving a financial windfall rather than discovering an opportunity, and reflect differences in resource availability (Carter et al., 1996; Davidsson and Gruenhagen, 2021; Lichtenstein et al., 2007). However, McMullen and Dimov (2013: 1494) are clear that ‘there is no entrepreneurial opportunity without customer demand. The entrepreneur can be in the right place at the right time, but what makes this place and time “right” is the presence of a customer who is willing and able to pay the entrepreneur’s asking price’. Such views chime with academic (Brush et al., 2008; Katz and Gartner, 1988; Müller et al., 2023) and practice-orientated studies (Blank, 2001; Ries, 2011) that see that the goal of venture development is market validation, first through market visibility and then through market traction and onto being sustainable in a given market. Consequently, in Figure 2, we model three crucial market validation steps across the Valley of Death. The first of these is generating revenues. This is crucial because it provides a tangible external verification of organisational emergence. It signals that there has been a shift from opportunity discovery to opportunity exploitation (Davidsson, 2023; Gartner, 1988; McMullen and Dimov, 2013; Shane and Venkataraman, 2000).
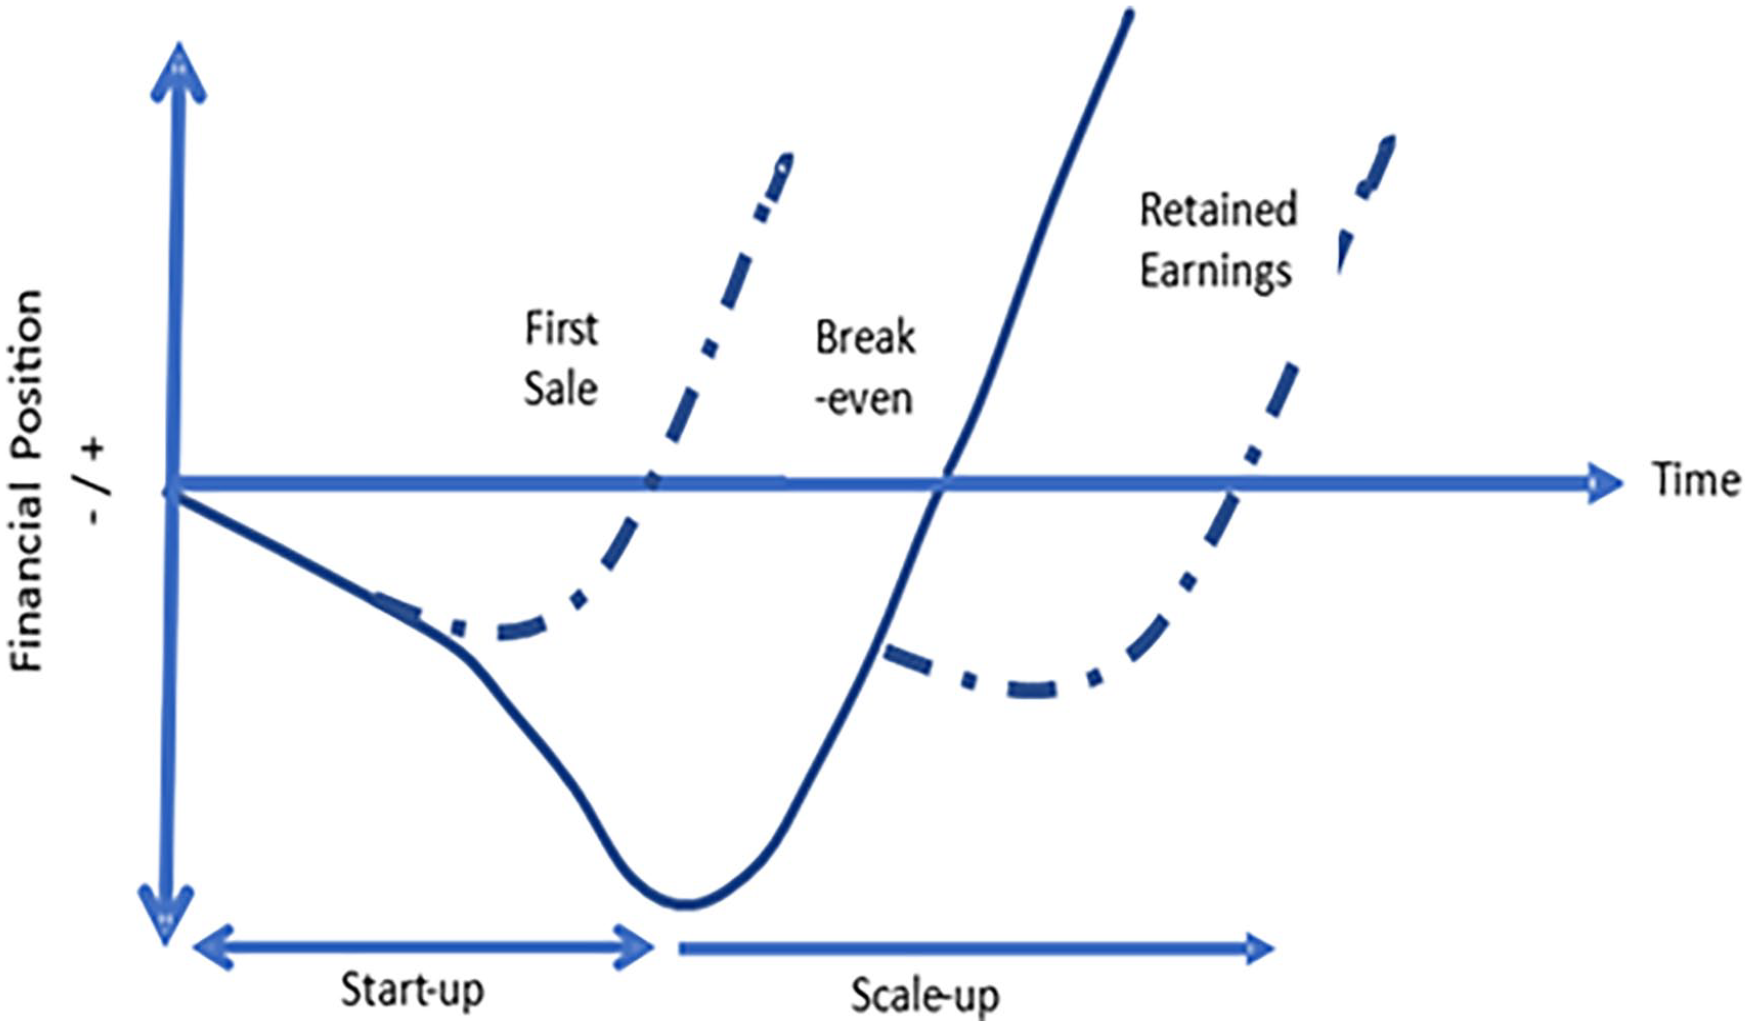
The three financial milestones across the Valley of Death.
Generating revenues is, of course, a significant event in any start-up. It is particularly challenging for many cleantech start-ups. One reason being the low appropriability of cleantech technologies. As Arrow (1962) originally suggested – and was echoed by Mazzucato (2011) – the profit motive alone is likely to lead to under investment in R&D. This relates to the fact that environmental resources lack well-defined property rights and often have public good characteristics that make it difficult to, inter alia, exclude others (Cumming et al., 2016; Owen et al., 2018). Thus, if the social value of R&D activities exceeds the private value – particularly if rival cleantechs can easily realise knowledge spillover benefits – the net result may be that cleantechs may operate in emerging industries, where they have to sell what may be an unproven technology and sell in what can be thin, or nascent, markets (Islam et al., 2018). Moreover, regardless of the resource profile of the entrepreneur and their ability to pool sufficient insider sources of finance such as personal savings, 3Fs (family, friends and fools) soft loans or grants, cleantechs, even with external funding, face a significant, uncertain and financially demanding journey to first sales (Criscuolo and Menon, 2015; Nanda et al., 2015). This is acute for ‘hardware’ or ‘deeptech’ cleantechs because they may seek to develop new, often radical, technical innovations to environmental challenges (Brown et al., 2007; Gaddy et al., 2017; Romme et al., 2023). Hardware cleantechs may face heightened uncertainty, significant persistent costs and fragile or weak customer demand, particularly if the policy context provides opaque signals (Cowling and Liu, 2021; Nemet et al., 2018; Romme et al., 2023).
Although reaching the revenue event is undoubtedly problematic for many start-ups and cleantechs, Figure 2 suggests that the Valley of Death is essentially a scale-up challenge. There are some stylised features that any business attempting to scale faces when moving from a first sale to becoming a profitable business. A central trial is that while it is possible to discount core costs such as the entrepreneur’s labour costs, and fund the business through revenues, many scale-ups find that revenues are often too limited to cover total costs (Da Rin and Hellmann, 2020). Research has also identified many reasons for an inability to break-even and reach profitability. These include stretched or incomplete entrepreneurial teams, an inability to synchronise cost-effectively internal resources, and a failure to adequately expand sales reach through new products or services and/or new markets (Coviello, 2019; Hellmann and Kavadias, 2016; O’Reilly and Binns, 2019; Piaskowska et al., 2021). As before, our concern is not with the modalities of start-up or growth per se but how speedily a business can reach profitability. Again, reaching profitability is testing for cleantechs. Although relative to hardware cleantechs, software cleantechs may face fewer scale-up issues because of falling digital costs (Ewens et al., 2018) and the close to zero marginal costs of some services (Lerner and Nanda, 2020), the general picture is that many cleantechs have to refine or repurpose their revenue-generating minimum viable product.
As Figure 2 shows, leaving the Valley of Death is when a business has a positive net income after paying all its costs and dividends. Reaching this retained earnings event is – in terms of accountancy metrics – significant because it signals that the business has reached a position where it is able – if it so chooses – to repay funders. For cleantechs, retained earnings also represent a business milestone: for the first time, they potentially have access to internal funding sources to fund future growth, deal with market vicissitudes and signal that they have reached some level of market acceptance.
Hypotheses
For our hypotheses, our starting point is that to voyage across the difficult Valley of Death, it is advisable for any cleantech to access equity capital. This reflects that the presumption in some of the literature on the Valley of Death is that the core challenge for the entrepreneur is accessing equity capital; not whether this capital speeds firm outcomes such as generating revenues or profits. Accessing equity capital is seen as difficult because equity capital providers operate a ‘high risk, high return’ business model and, therefore, only a tiny percentage of candidate entrepreneurial firms receive equity capital. Gompers et al. (2020) show that the percentage of US firms that receive venture capital is less than 1%, while other evidence suggests that only around 3% of firms receive equity capital from business angels (Mason and Harrison, 2015). An extensive literature has detailed the challenges entrepreneurs face such as homophilic biases, extensive due diligence and the ways in which they can signal their worth through, for example, team background, market size, growth and traction and the likelihood of achieving a high internal rate of return (Bernstein et al., 2017; Gaddy et al., 2017; Gafni et al., 2021; Gompers and Wang, 2017; Gompers et al., 2020; Li and Zhou, 2023; Mason and Stark, 2004).
There are grounds for suggesting that equity capital – particularly venture capital – leads to superior outcomes. Lerner and Nanda (2020) distinguished between venture capital and non-venture capital-backed US firms finding that about half of US firms that reach IPO are venture capital-backed, but these firms are more likely to spend more on R&D and developing innovations than non-venture capital-backed firms. Such findings chime with other evidence that equity capital has positive economic impacts (Gornall and Strebulaev, 2021) in terms of speeding sales and employment growth (Puri and Zarutskie, 2012) and employment and aggregate income (Samila and Sorenson, 2011; Wright et al., 2015). Kerr et al. (2014) show similar positive impacts of business angel finance such as employment growth. However, while better capitalised businesses can afford to make mistakes (Ries, 2011), there are several reasons for being hesitant about whether equity capital speeds cleantechs journey across the Valley of Death. So, for instance there is the mixed extant empirical evidence on whether equity capital promotes firm performance milestones. A meta-analytic review identified that the impact of venture capital finance on firm performance was limited, dissipated once the industry was controlled for, and was largely driven by the positive, but highly unlikely, impact of funded firms achieving an IPO (Rosenbusch et al., 2013). Similar diverse findings also pertain to other forms of equity capital (Fraser et al., 2015) such as business angel (Croce et al., 2021; Levratto et al., 2018; Lodefalk and Andersson, 2023), equity crowdfunding (Eldridge et al., 2021; Walthoff-Borm et al., 2018) and government-backed finance (Brander et al., 2015; Cumming et al., 2017). Furthermore, besides internal issues such as heightened technical uncertainty, information asymmetries and low appropriability, cleantechs face high levels of market uncertainty. While there is some evidence from China that equity capital supports cleantechs (Cailou and DeHai, 2022), Gaddy et al.’s (2017) US evidence shows that – relative to software (digitech) and medical firms over the period 2006–2014 – cleantechs were riskier investments and offered lower returns. In terms of outcomes, cleantechs returned less to investors (both cash-on-cash multiples and IRR), were less likely to be acquired and were least likely to enjoy an IPO exit. Gaddy et al. (2017) blamed these poor performance outcomes on the illiquidity of cleantech investments, the need for significant capital and potential purchaser reluctance. Therefore, they argued that equity capital was the wrong model for cleantechs. Similarly, Van den Heuvel and Popp (2023) examined the contribution of venture capital to cleantechs but over a longer period (2000–2020).
A further reason for hesitancy is that – despite the premise that equity capital is additive to cleantechs because it provides financial resources and ‘softer support’ such as advice, assistance, contacts and expertise – the presumption is that equity providers are better at resolving adverse selection issues related to identifying and selecting the most promising ventures. Although equity providers have a range of both informal and formal mechanisms for resolving adverse selections ranging from simple hunches to elaborate ones due to diligence procedures (Courtney et al., 2017; Croce et al., 2017; Gompers et al., 2020; Mason and Harrison, 2015; Mason and Stark, 2004; Metrick and Yasuda, 2010), cleantechs typically operate in highly uncertain environments, with long lead times and potentially thin markets. This makes it difficult to resolve adverse selection issues and suggests whether equity providers can successfully identify and select the most promising firms (Amit et al., 1998; Glücksman, 2020; Howell, 2020; Welter et al., 2023). Moreover, equity finance has been found to ‘. . .create a false sense of security and reduce the need to focus on close customer interaction and fast revenue generation’ (Rosenbusch et al., 2013: 339). Adding to the potential for ‘mission drift’ (Cetindamar et al., 2017) is that equity providers are often focused on a harvest exit route to realise a capital gain. An exit may not be realisable in the anticipated time frame or conflict with the interests of the funded cleantech. Equally, to resolve moral hazard issues, the equity provider may impose additional monitoring costs that may, in turn, add to a sense of mission drift. In contrast, following the precepts of the pecking order hypothesis (Mac an Bhaird and Lucey, 2010; Vanacker and Manigart, 2010), only those firms that require equity finance will seek such funding. This implies that more promising cleantechs do not need equity finance because they have a surer route to revenue generation, profitability and retained earnings. Being without equity finance may also reduce the likelihood of mission drift, reduce monitoring costs and crystallise the importance of goal attainment.
In summary, although we can see why equity capital can generally promote firm-level performance, other evidence and prior specific research on cleantech exit outcomes paints a sorry picture. Thus, we argue that cleantechs with access to equity capital will experience slower milestone achievement speeds. Although we recognise that, in broad terms, there are differences in the investment amounts likely to be committed, at different stages and have different priorities (crowdfunders may have altruistic reasons while government funding may be related to employment creation), we still see that all of these forms of equity capital aim to be both ‘patient’ and ‘smart’. Crucially, each form is also representative of a high-risk, high-return business model where the aim is to fund a limited number of newer firms in the expectation that one will turn out to be a ‘home run’ (Da Rin and Hellmann, 2020; Storey and Greene, 2010). Accordingly, for our hypotheses, given the broad similarities in equity finance and because we reconceptualise the Valley of Death as three financial milestones (Figure 2), we see our hypotheses as global and exploratory. Hence:
H1: Equity financed cleantech firms take a longer time to achieve first revenues than non-equity funded firms.
H2: Equity financed cleantech firms take a longer time to achieve profitability than non-equity funded firms.
H3: Equity financed cleantech firms take a longer time to achieve retained earnings than non-equity funded firms.
Data and methods
Data
The data on cleantech firms were sourced from Crunchbase because as a well-respected source of investment and funding information on private firms (Dalle et al., 2017; Eldridge et al., 2021; Kuckertz, 2021). There were two key parameters. First, from Gaddy et al. (2017), we identified and filtered firms in the energy efficiency, renewable energy/energy generation, recycling and waste management and transportation sectors. Second, given our research questions, we specifically focused on UK firms incorporated in 2011/2012. We manually checked each firm to ensure they met the sectoral and age criteria; this realised 354 UK-based cleantech firms. We then sought to collect data on these firms over ten years (2011/2012–2021/2022). Based on prior research, we judged that a decade is suitable for studying early-stage cleantech firms in their attempt to cross the Valley of Death. Schoonhoven et al. (1990) found that the average time to ship in the early semi-conductor industry was 21 months. Toroslu et al. (2023), for the renewable energy and ICT sectors, showed that the average time to profitability in technology-orientated businesses was 31 months. However, while Crunchbase is valuable in terms of whether cleantech firms received different types of equity capital, it is less helpful in providing information on revenues, profitability and retained earnings. Subsequently, based on company registration numbers, we turned to the Bureau van Dijk/Moody’s FAME database. Scholars widely use this database because it contains all of the source information from the UK’s Companies House on company incorporations (Walsh and Cunningham, 2024; Walthoff-Borm et al., 2018). Again, while these FAME data are useful, one weakness is that it has incomplete financial information on smaller UK businesses since these are often exempt from providing full accounts. First, we obtained a list of all cleantech firms incorporated in the United Kingdom in 2011 and 2012 from Crunchbase. We then retrieved their company registration numbers from Companies House. Using these registration numbers, we collected financial statement variables for a 10-year period from the FAME database. For any missing data, we utilised the services of CRIF Vision-Net, a private firm with access to the original documentation submitted to Companies House, to manually collect the missing variables. We manually reviewed the data from these disparate data sources to collate, triangulate and ensure the accuracy of the data on all the 354 cleantech firms.
Measures
We use three dependent variables. The first ‘event’ variable takes 1 if a business reaches its first sale in a given year over the 10-year window (IFREVENUE) and 0 if it does not. We repeat this for our further two Valley of Death measures: IFPROFIT (Yes = 1; No = 0) and IFEARNINGS (Yes = 1; No = 0). The average time to revenue, profitability and retained earnings were 42, 78 and 91 months, respectively.
The primary independent variable is if a business RAISED_EQUITY (Yes = 1; No = 0). This variable is a composite of four constituent variables that identify if a cleantech raised Venture Capital (VC: Yes = 1; No = 0); Business Angel (BIZANGEL: Yes = 1; No = 0); Crowdfunding (CROWD: Yes = 1; No = 0); and local and national government (GOVERN: Yes = 1; No = 0) funding.
In terms of control variables, we make use of three main variables. The first is a set of six geographic markers drawn from the FAME database: LONDON, SOUTH, EAST, NORTH, WEST and OTHER UK. 2 Our second control variable is sector. Our definition uses the standard first proposed by Gaddy et al. (2017) and adopted by a range of other cleantech studies (Harrer and Owen, 2022; O’Reilly et al., 2023; Owen et al., 2018). Cleantechs are classified into ENERGY EFFICIENCY, RENEWABLE ENERGY, RECYCLING AND WASTE MANAGEMENT and TRANSPORTATION.
Our final control variable is Hardware (HARDWARE: Yes = 1; No = 0 = SOFTWARE). Hardware is an important differentiator among cleantech firms, as they often have significant upfront capital requirements for manufacturing, prototyping, materials and equipment. These are distinct from cleantech SOFTWARE firms, which have been previously found to have iterated and scaled more easily without equity capital (Owen et al., 2021; Portincaso et al., 2021). Hardware development usually has longer cycles due to the physical nature of product development, which can lead to a longer period before reaching profitability (Mazzucato and Semieniuk, 2018). Investors may also have different perceptions of hardware versus software, often viewing hardware as riskier and slower to market. This can affect the availability and terms of equity capital, with investors tending to prefer software firms (Lerner and Nanda, 2020). Equity firms usually have less appetite for hardware firms because they typically have specific market risks, including production risks, supply chain complexity and the need for safety and regulatory compliance, which can affect financing requirements and timelines. These constraints mean equity investors sometimes exit their investments before realising growth opportunities (Farre-Mensa et al., 2020). Therefore, it is important to control for differences between hardware and software firms to determine if there is a significant difference in reaching the financial milestones.
Estimation strategy
Our key empirical concern is to establish if firms that have raised equity capital are faster or slower in attaining three critical financial Valley of Death milestones (revenue, profitability and retained earnings). Following on from summary statistics (Table 1 below), we tested H1–H3 using Cox proportional hazards models (Tables 2–4). These are commonly used to assess negative events such as morbidity, reflecting the medical roots of these types of models. However, our focus is on positive events and, in particular, our focal interests are in the likelihood of revenues (H1), profits (H2) and retained earnings (H3) occurring at any point. Cox models have previously been used to investigate time-to-event models in entrepreneurship (Cowling et al., 2024; Momtaz, 2021), survival and growth in new ventures (Puig et al., 2018), modelling VC exits (Giot and Schwienbacher, 2007) and in predicting SME failure (Gupta et al., 2017). The core advantages of a Cox model over other standard regression approaches such as linear or probit regression models are that it can handle censored data, time-varying covariates and does not make strong assumptions about the baseline function.
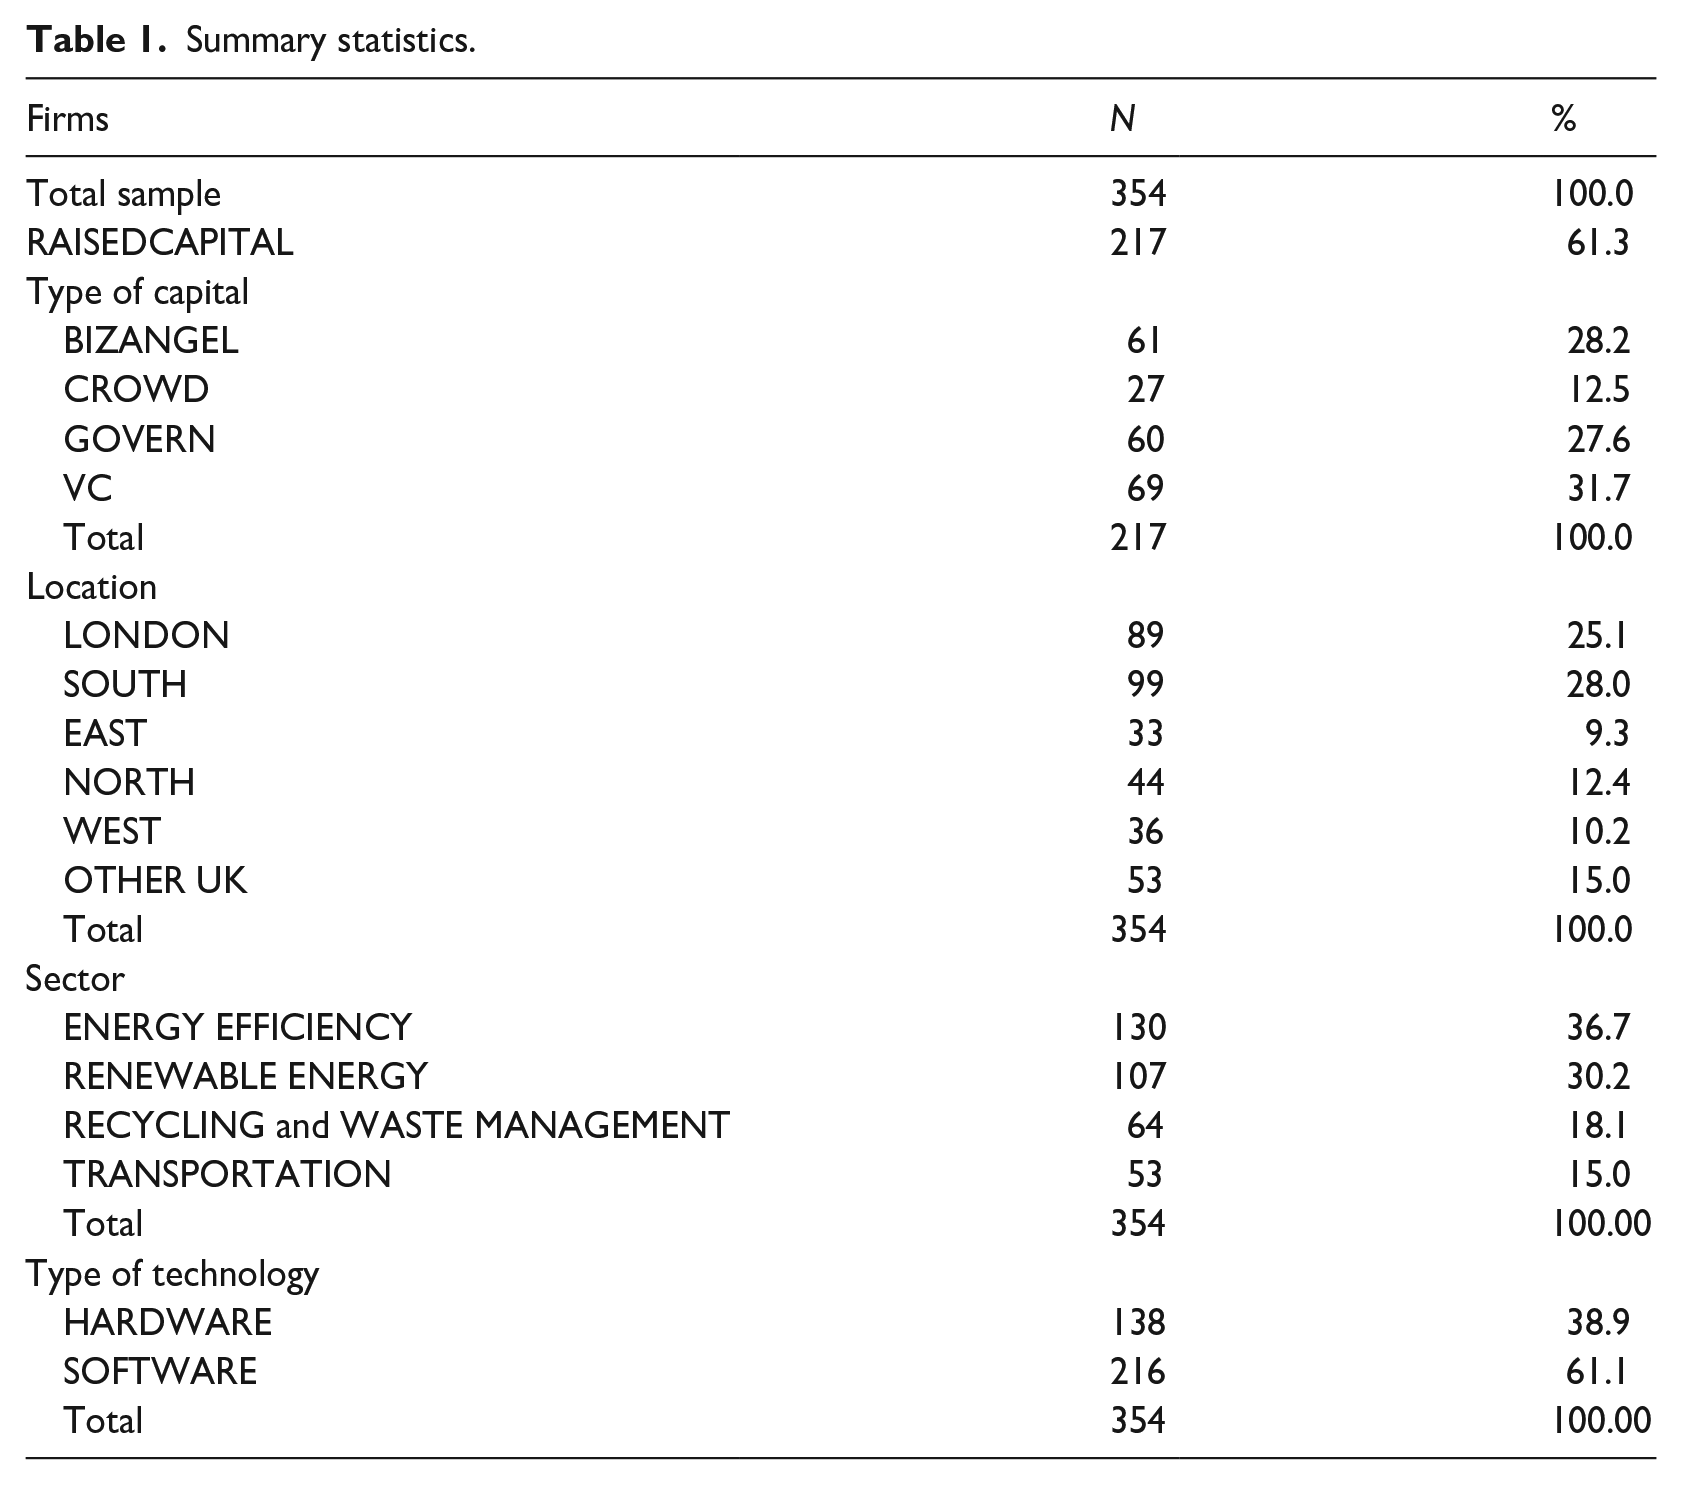
Summary statistics.
Cox proportional hazards ratios for revenue milestone.
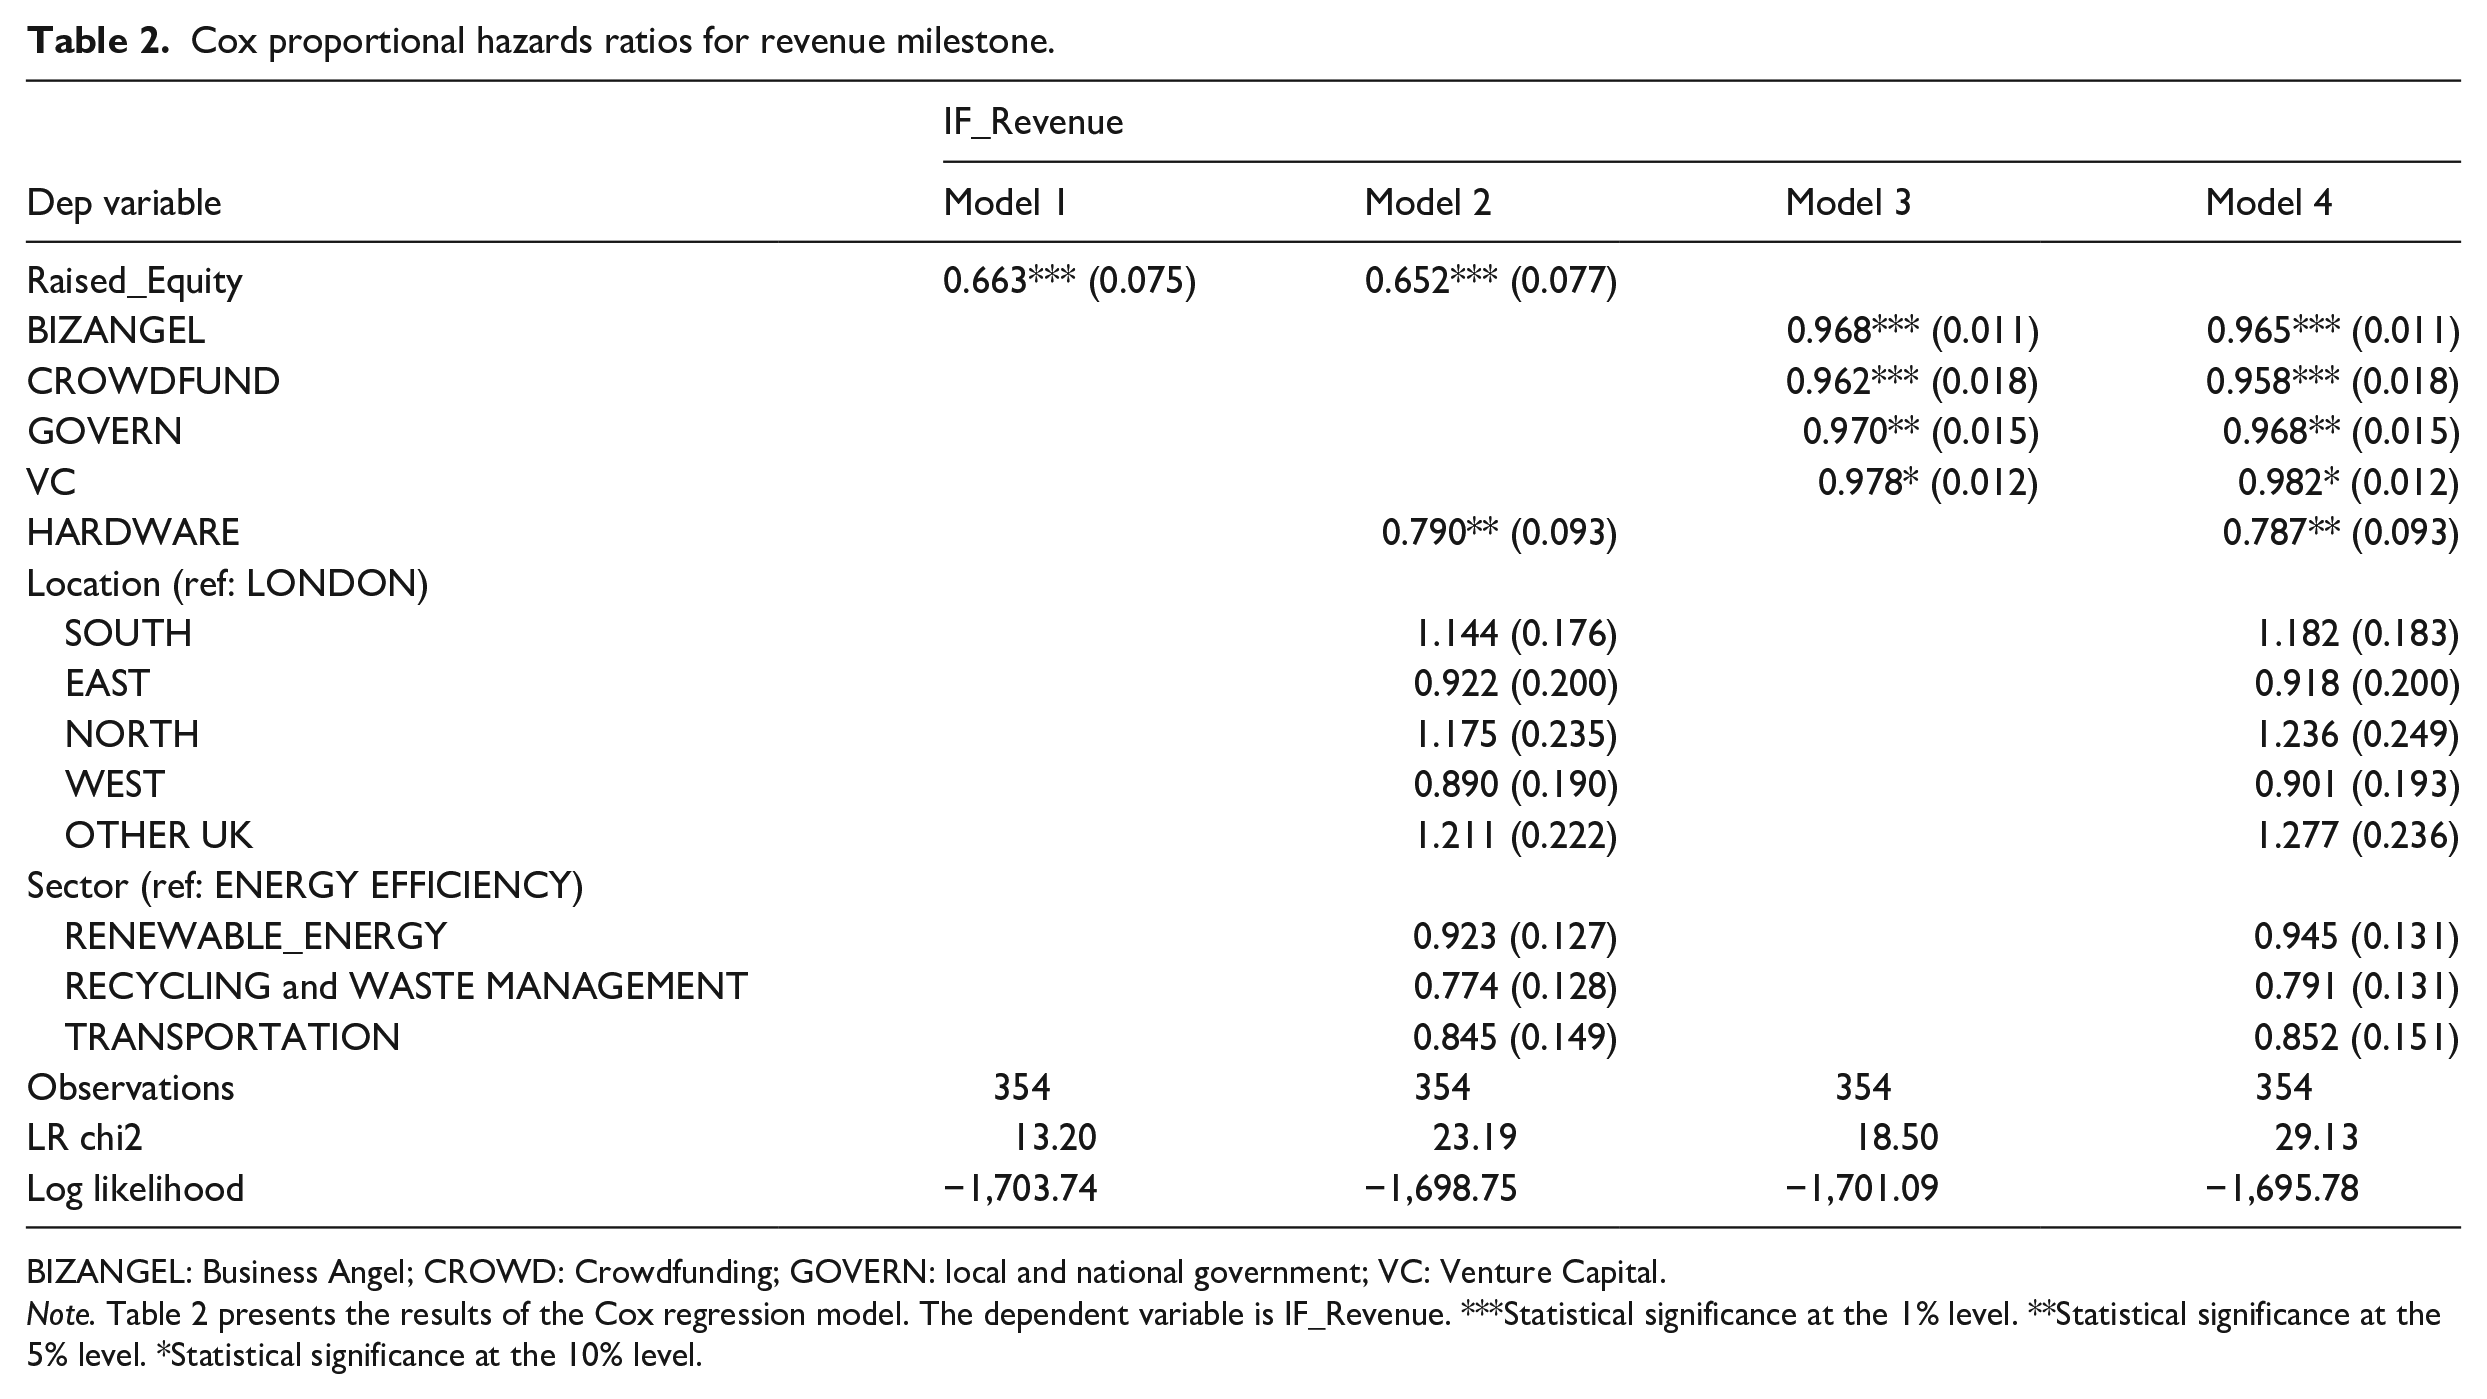
BIZANGEL: Business Angel; CROWD: Crowdfunding; GOVERN: local and national government; VC: Venture Capital.
Note. Table 2 presents the results of the Cox regression model. The dependent variable is IF_Revenue. ***Statistical significance at the 1% level. **Statistical significance at the 5% level. *Statistical significance at the 10% level.
Cox proportional hazards ratios for profitability milestone.
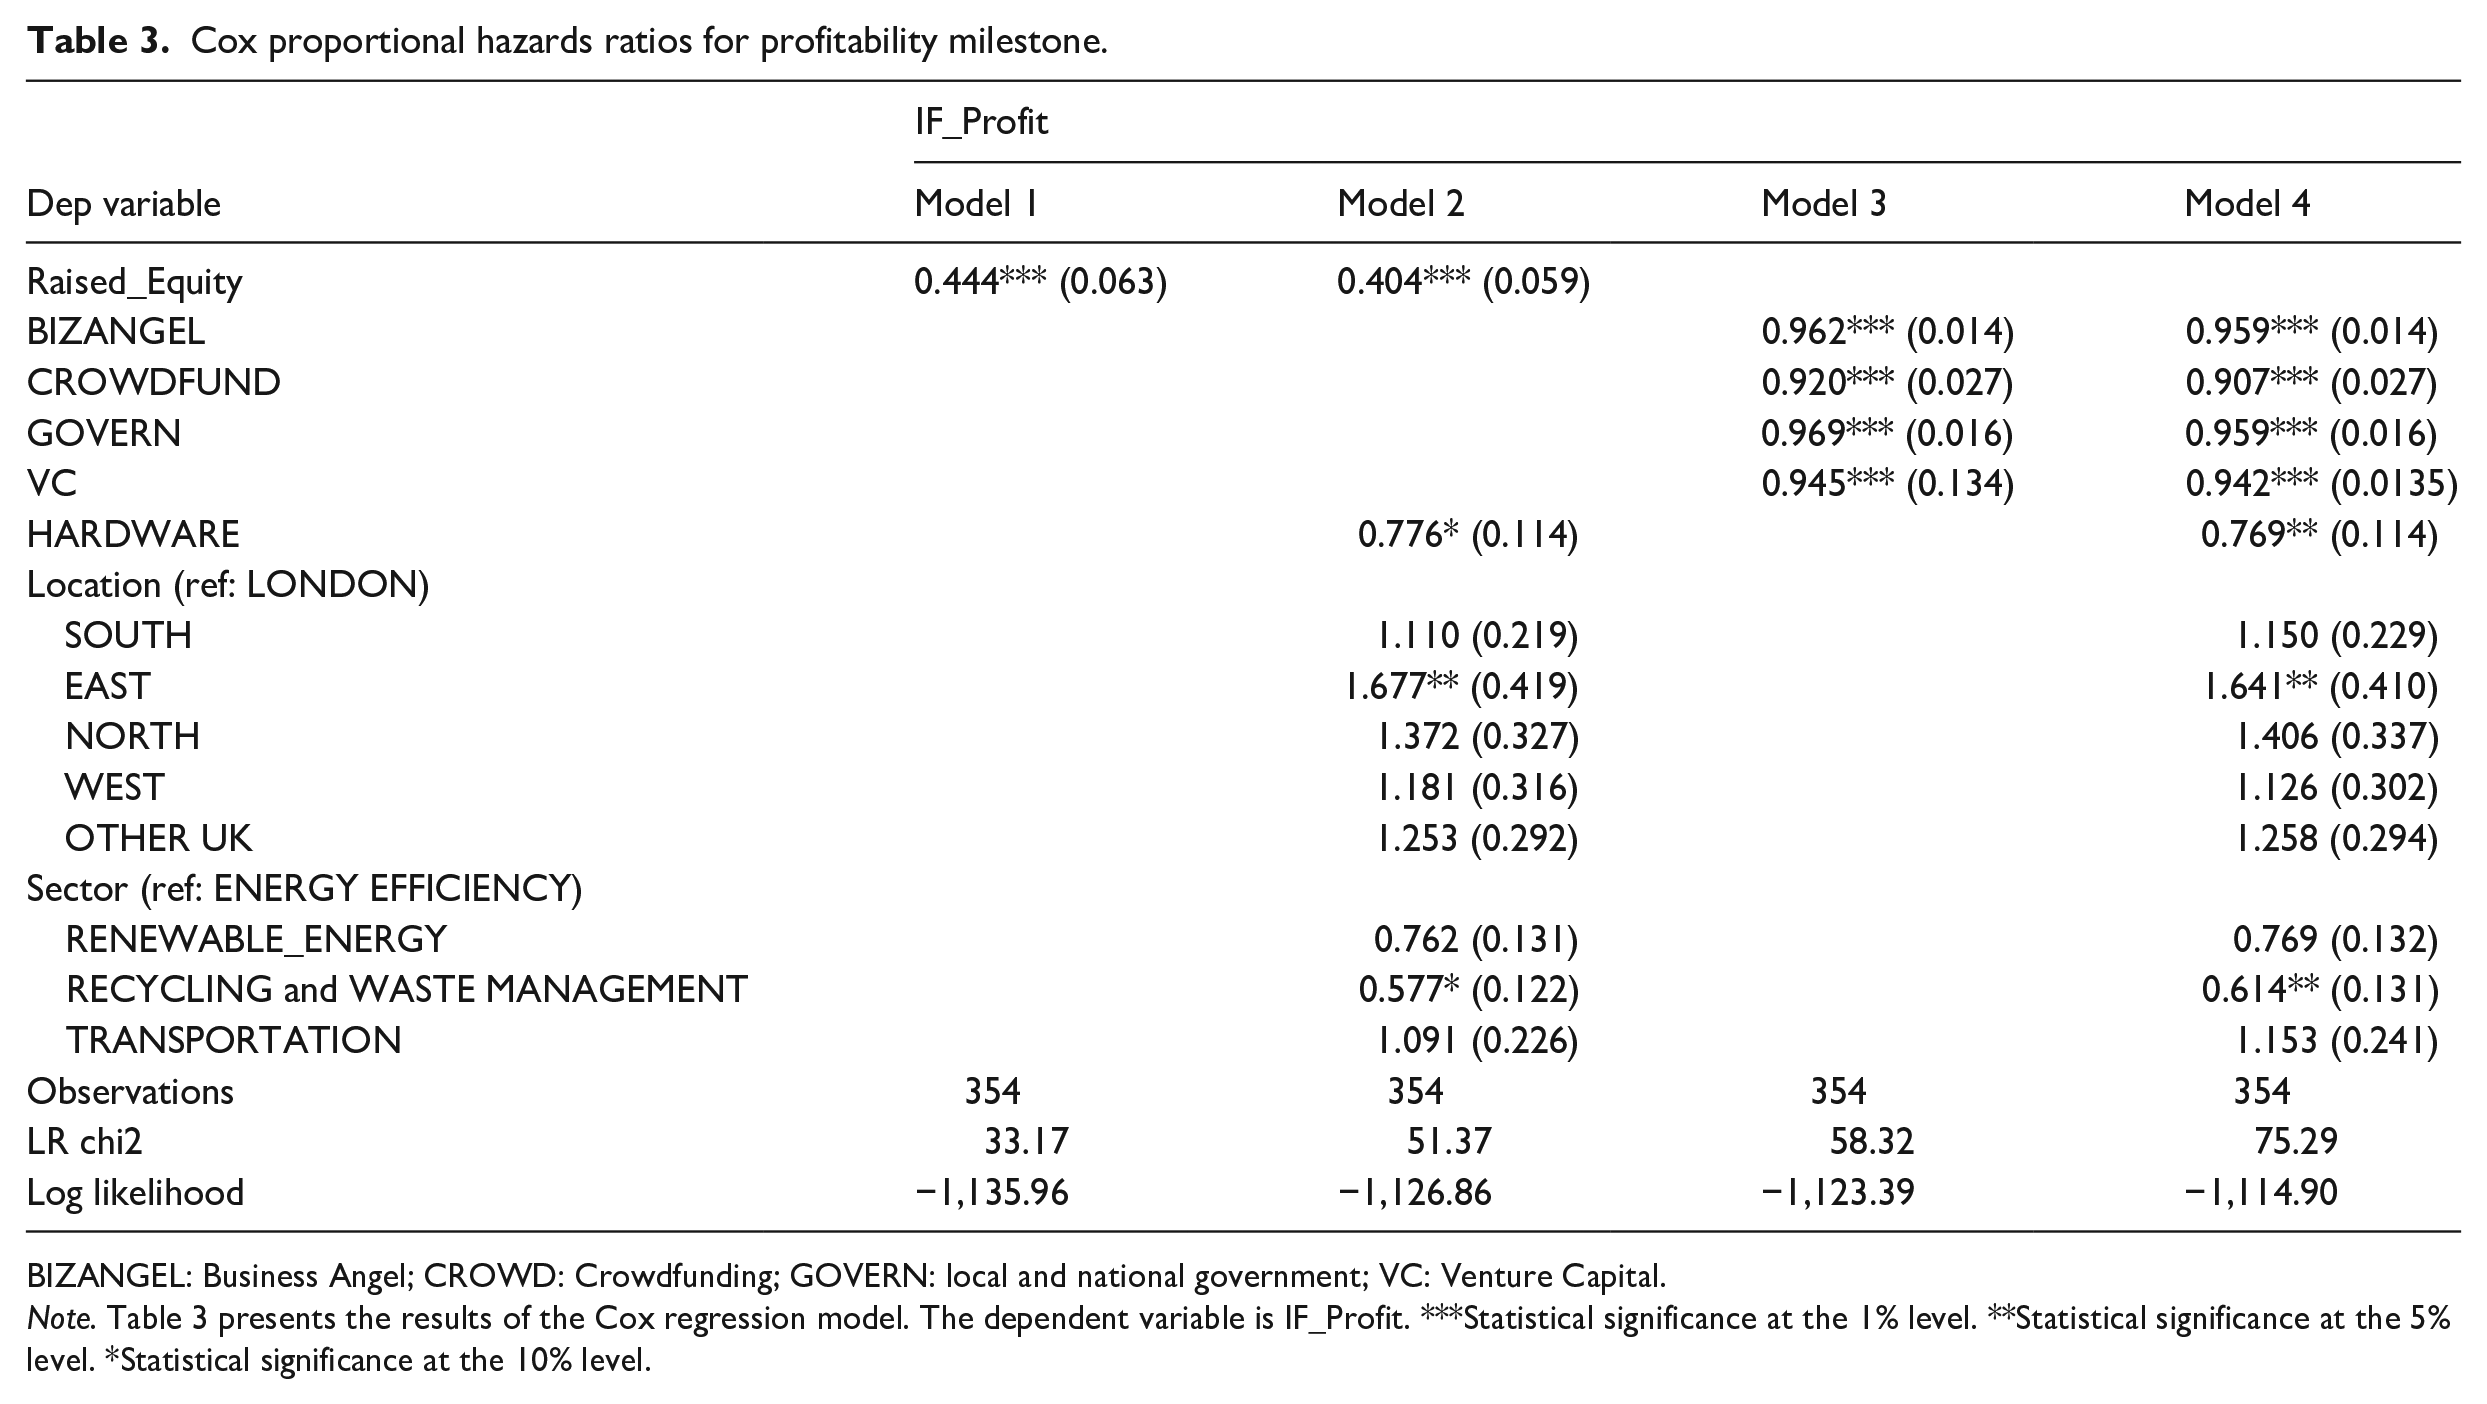
BIZANGEL: Business Angel; CROWD: Crowdfunding; GOVERN: local and national government; VC: Venture Capital.
Note. Table 3 presents the results of the Cox regression model. The dependent variable is IF_Profit. ***Statistical significance at the 1% level. **Statistical significance at the 5% level. *Statistical significance at the 10% level.
Cox proportional hazards ratios for retained earnings milestone.
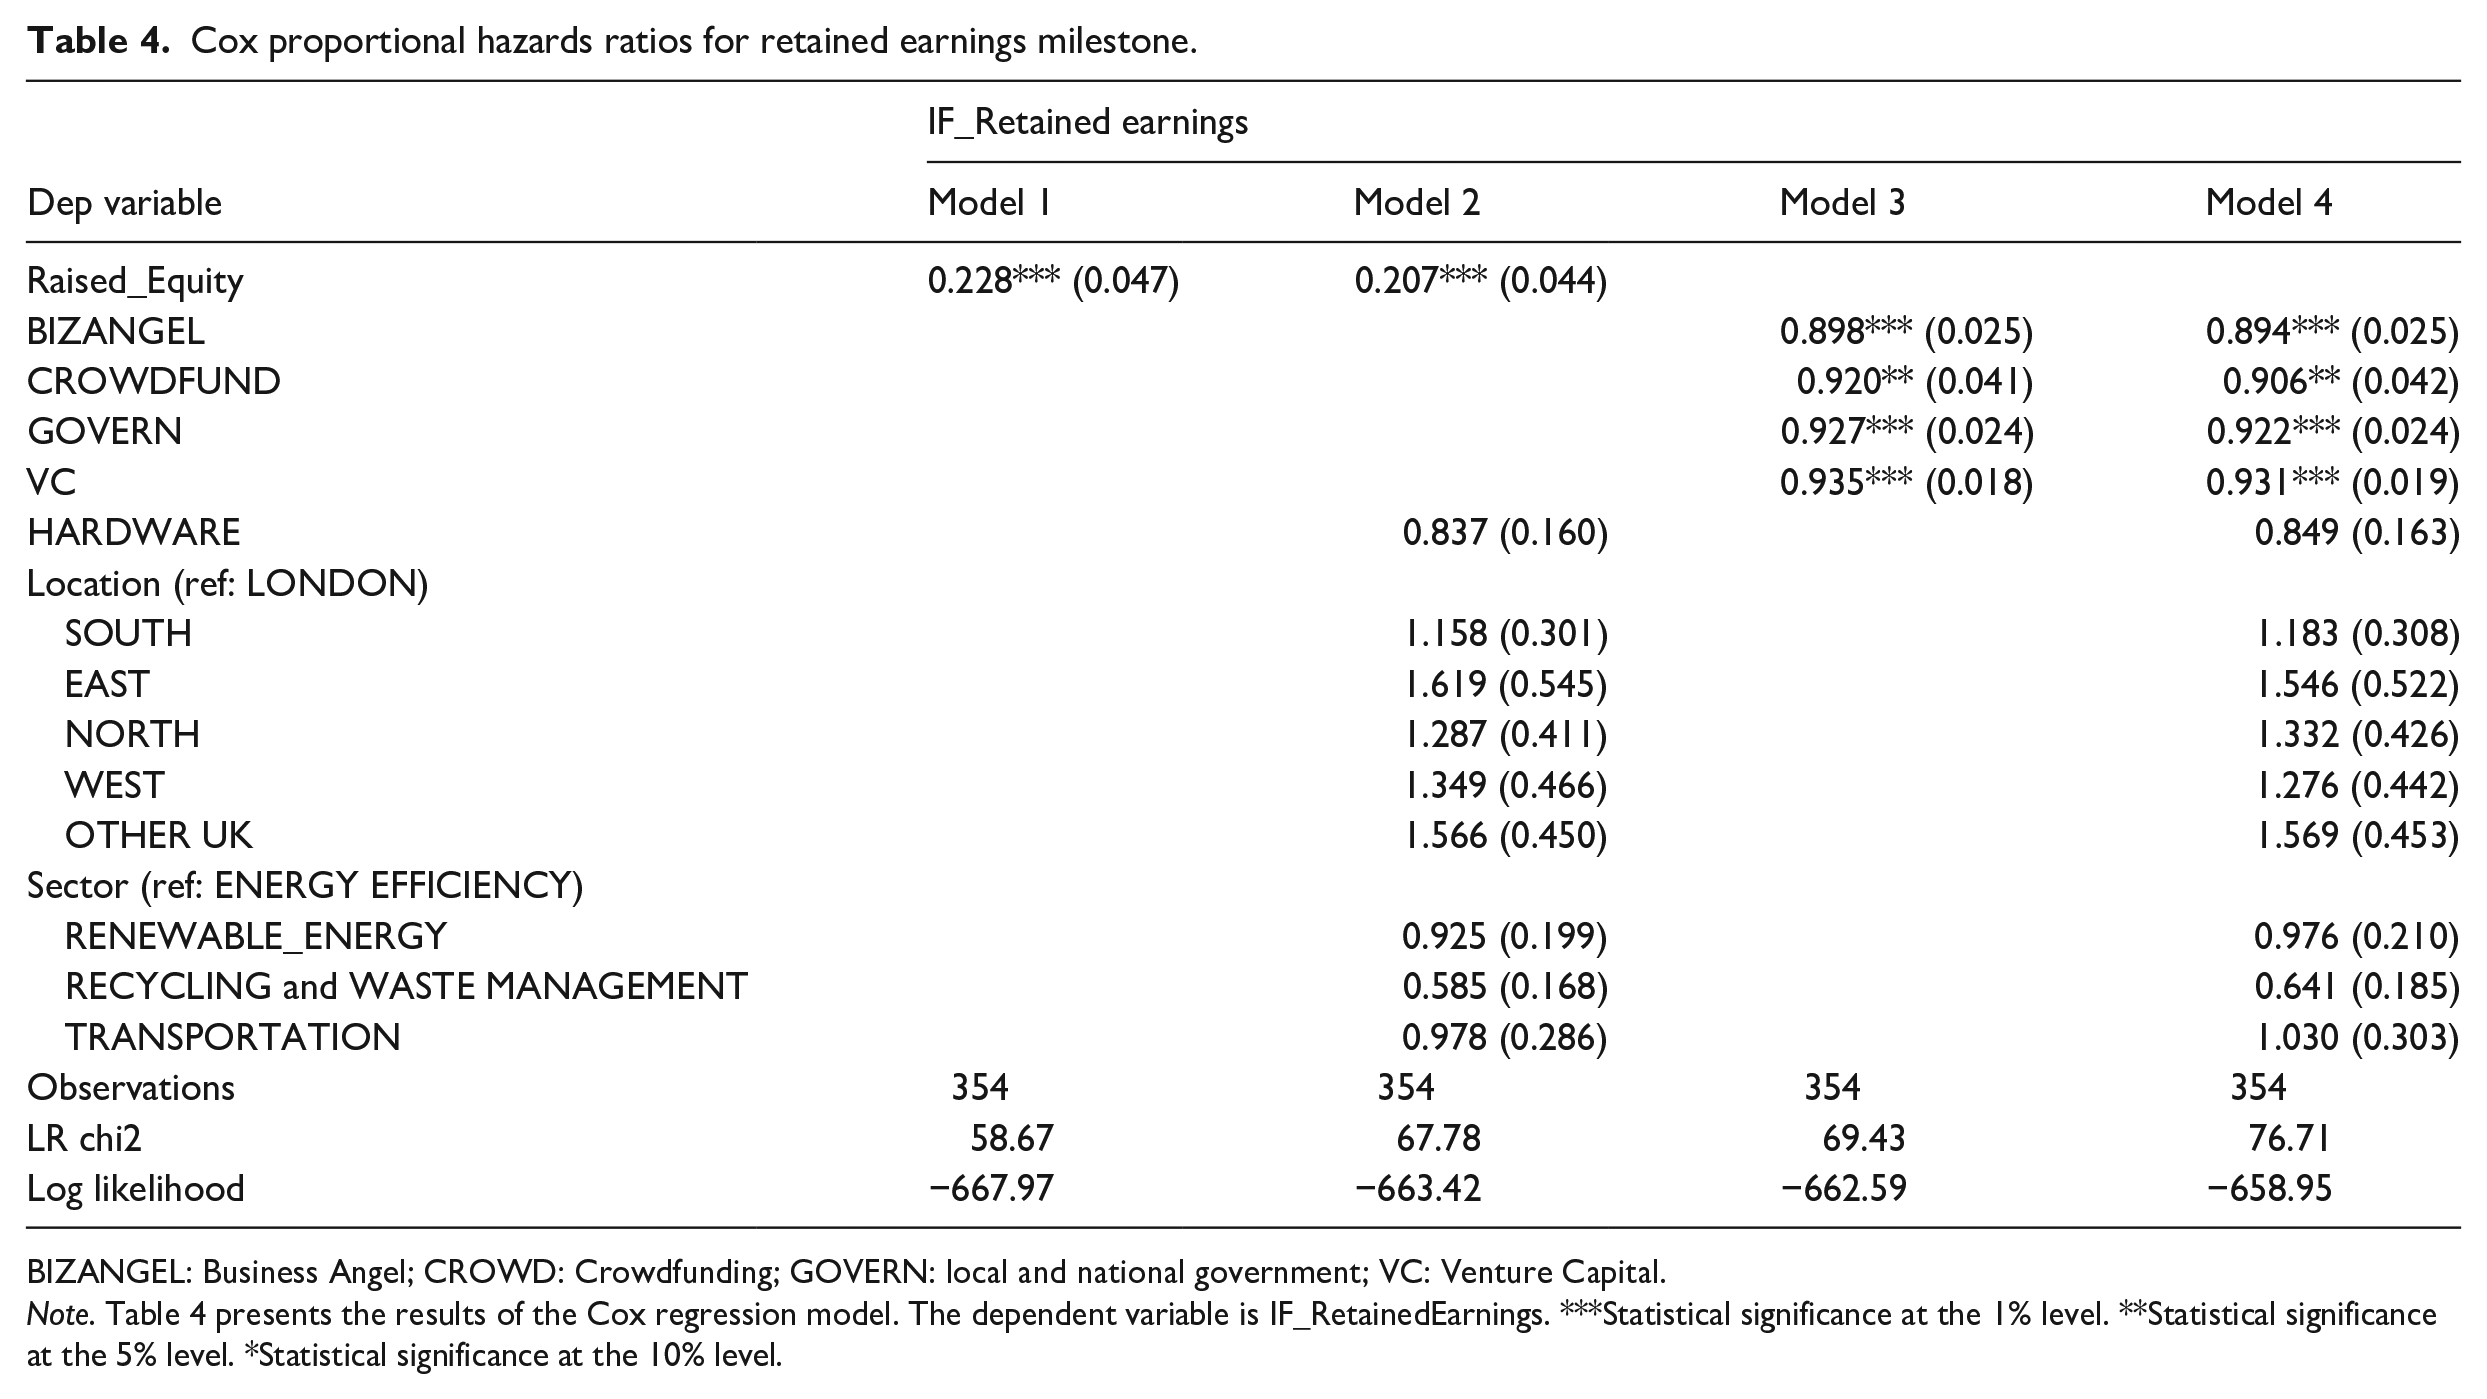
BIZANGEL: Business Angel; CROWD: Crowdfunding; GOVERN: local and national government; VC: Venture Capital.
Note. Table 4 presents the results of the Cox regression model. The dependent variable is IF_RetainedEarnings. ***Statistical significance at the 1% level. **Statistical significance at the 5% level. *Statistical significance at the 10% level.
As is standard with Cox models, our model is represented by h(t, X) = h0(t)exp(β1 X1 + β2 X2+. . .+β p Xp). In this representation, h(t, X) is the hazard function at time t given covariates X. The term h0(t) is the baseline hazard function at time t, representing the hazard when all covariates are equal to zero, serving as a reference point. The exponential function exp(β1X1 + β2X2 + . . . + βpXp) represents the linear combination of p covariates (X1, X2,. . ., Xp) weighted by their respective coefficients (β1, β2,. . .,β p ). The hazard function (h(t, X)) estimates the likelihood of the ‘event’ happening at time t, given the covariates X. The covariates (X1, X2,. . ., Xp) are the independent variables included in the model. We identify four models for each key financial milestone across the Valley of Death (Tables 2–4). The equations for these models are as follows: Equation (1) (Model 1) tests the potential determining effect of equity capital: h(t,X) = h0(t)exp(β1 Raised_Equity). Equation (2) (Model 2) tests equity capital and the controls: h(t,X) = h0(t)exp(β1 RAISED_EQUITY + β2 HARDWARE + ∑β i Locationi + ∑β j Sectorj). Equation (3) (Model 3) examines the constituent sources of equity capital (VC, BIZANGEL, GOVERN, CROWD): h(t,X) = h0(t)exp(β1 VC + β2 BIZANGEL+β3 GOVERN+β4 CROWD). Finally, Equation (4) (Model 4) adds control variables: h(t,X) = h0(t)exp(β1 VC + β2 BIZANGEL + β3 GOVERN + β4 CROWD + β5 HARDWARE + ∑β i Locationi + ∑β j Sectorj).
In summary, Model 1 tests the potential determining effect of equity capital, Model 2 examines HARDWARE and includes location and sector controls. Model 3 examines the constituent sources of equity capital (VC, BIZANGEL, GOVERN, CROWD); and Model 4 adds HARDWARE and control variables.
Results
To provide context for our analysis, we begin by discussing the summary statistics of our independent variables. Table 1 shows that 61% raised equity capital, with 31.7% using VC, 28.2% BIZANGEL, 12.5% CROWD and 27.6% GOVERN funding. Over half of the sample is in London and the South, with the remainder in the East, North, West, Scotland, Wales and Northern Ireland. Broadly, two sectors (energy efficiency and renewable energy) represent two-thirds of the cleantechs, with the other third comprising the other two sectors (recycling and waste management and transportation). Hardware firms were less common than software firms but accounted for nearly 4 in 10 cleantechs.
Cleantechs that have raised equity capital generally take longer to reach all three milestones across the Valley of Death. Figure 3 shows that equity capital-funded firms take an average of 50.7 months to attain revenue, compared with almost 35.4 months for non-equity capital-funded firms. Similarly, equity-funded firms take 95.5 months and 111.5 months to attain profit and retained earnings milestones, compared with almost 60.7 months and 70.9 months, respectively, for non-equity-funded firms.
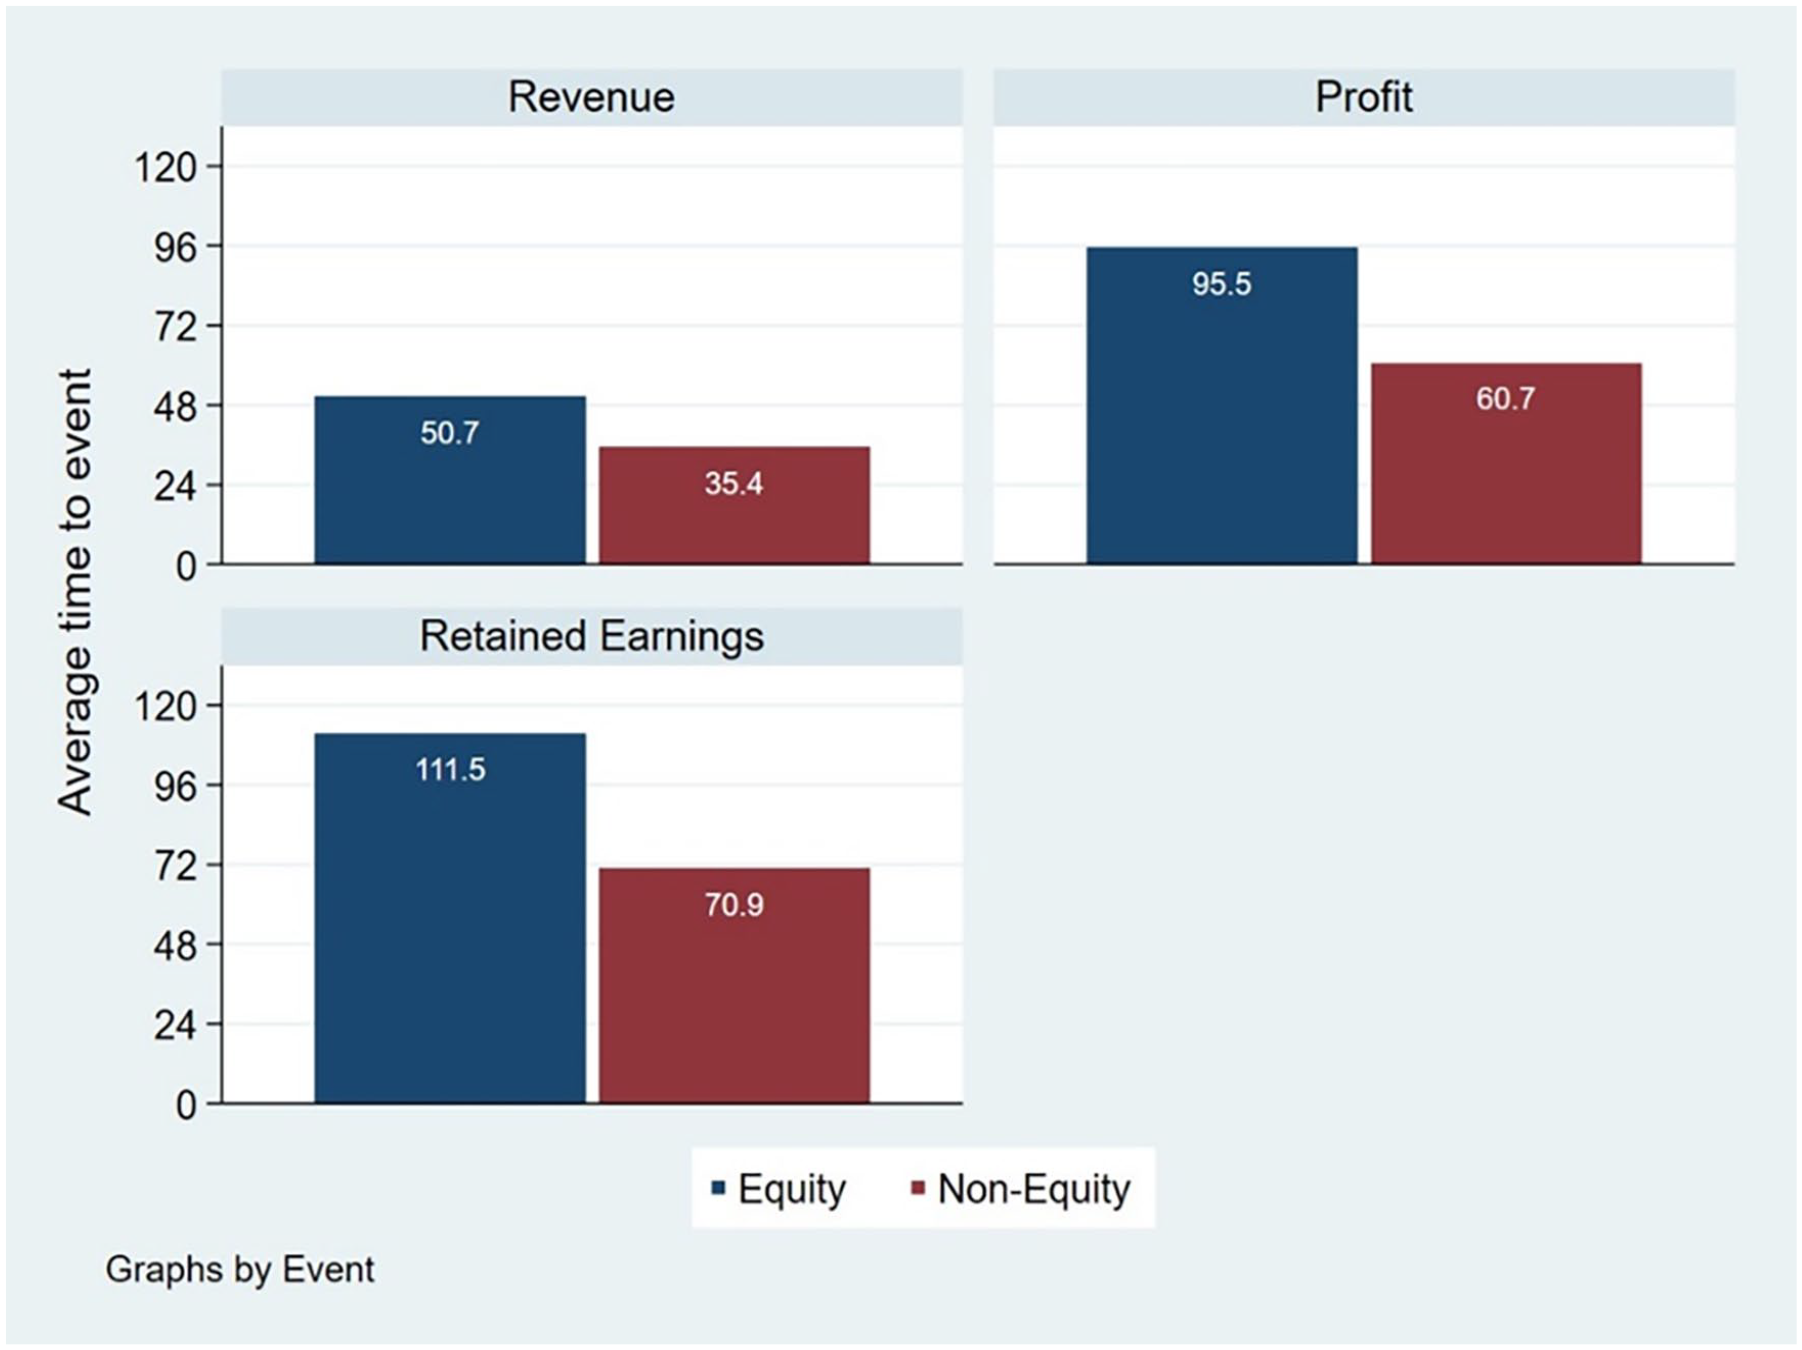
Average time (months) to achieving financial milestones for equity and non-equity capital-funded businesses.
Figure 4 shows the time to an event decomposed into different types of equity capital. It shows that ANGEL and CROWDFUND backed firms take relatively longer than firms financed by all other types of funding to attain all three milestones. Figure 4 also shows that GOVERN backed firms reach the retained earnings and profit milestones before firms financed by other types of equity, while VC backed firms attain the revenue earnings milestone before firms financed by other forms of equity. In all cases, non-equity-backed firms attain these milestones in a shorter timeframe.
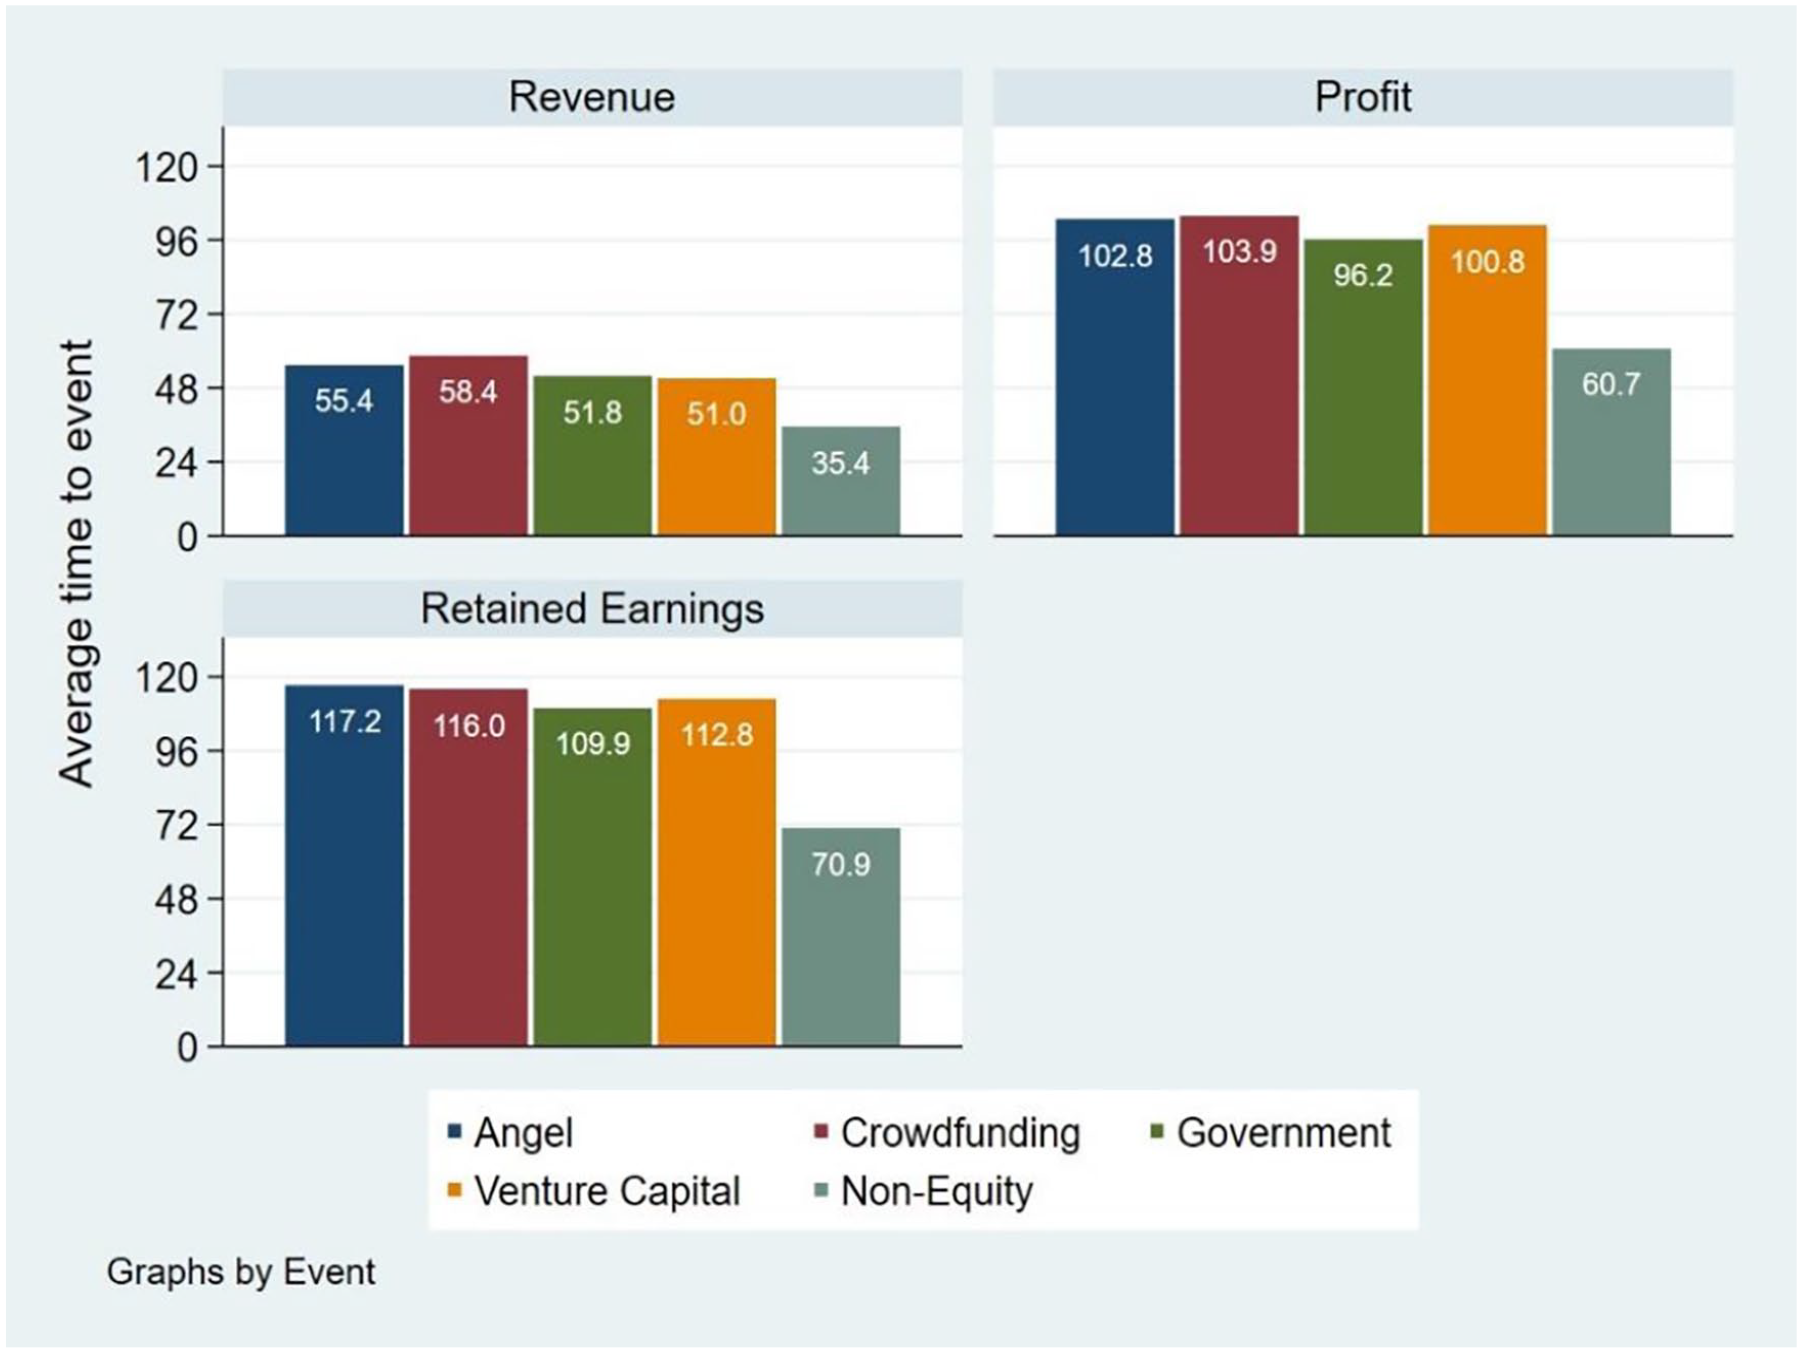
Average time to achieving financial milestones by type of equity capital.
Kaplan–Meier estimates (Figures 5–7) show that for firms that raised equity capital (blue curve), the probability of reaching all three financial milestones decreases more steeply and consistently over time. As Figure 5 shows, a higher proportion of non-equity financed firms reach the revenue milestone as time goes on. We find the same for the profitability milestone at an even greater speed (Figure 6). For example, in year four, the probability for firms that did not raise equity capital is approximately 0.75, meaning that approximately 25% of those firms have reached profitability. By contrast, for equity-financed firms, the probability is 0.90, indicating that approximately 10% have reached profitability by that time. Similarly, for retained earnings, equity-financed firms are slower in achieving this milestone (Figure 7).
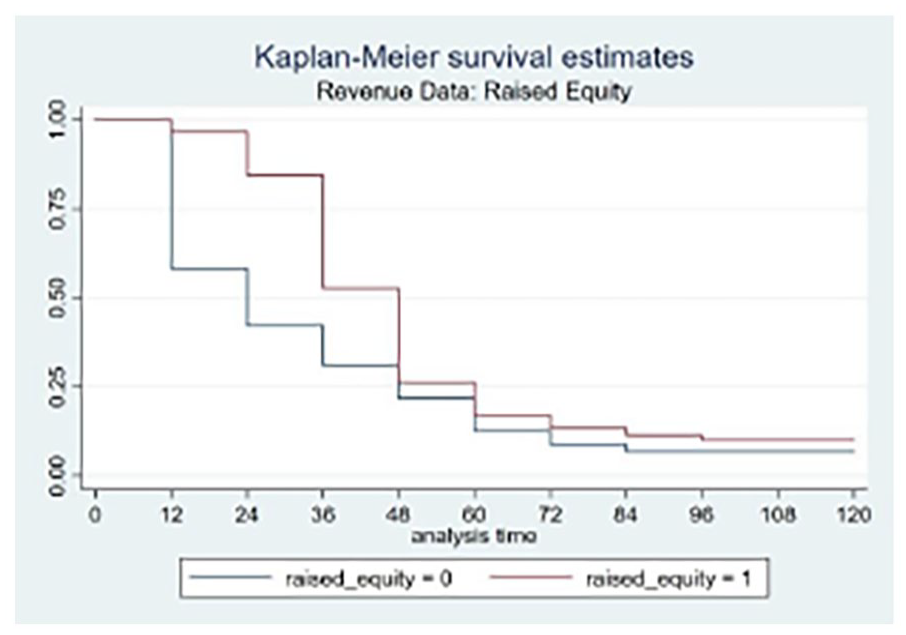
Speed with which cleantech firms achieved the revenue milestone.
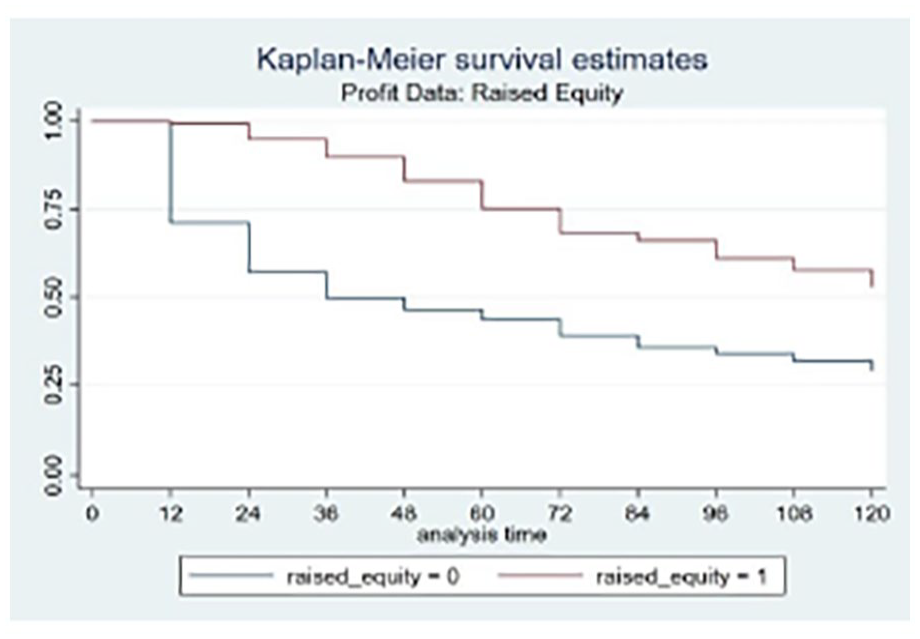
Speed with which cleantech firms achieved the profitability milestone.
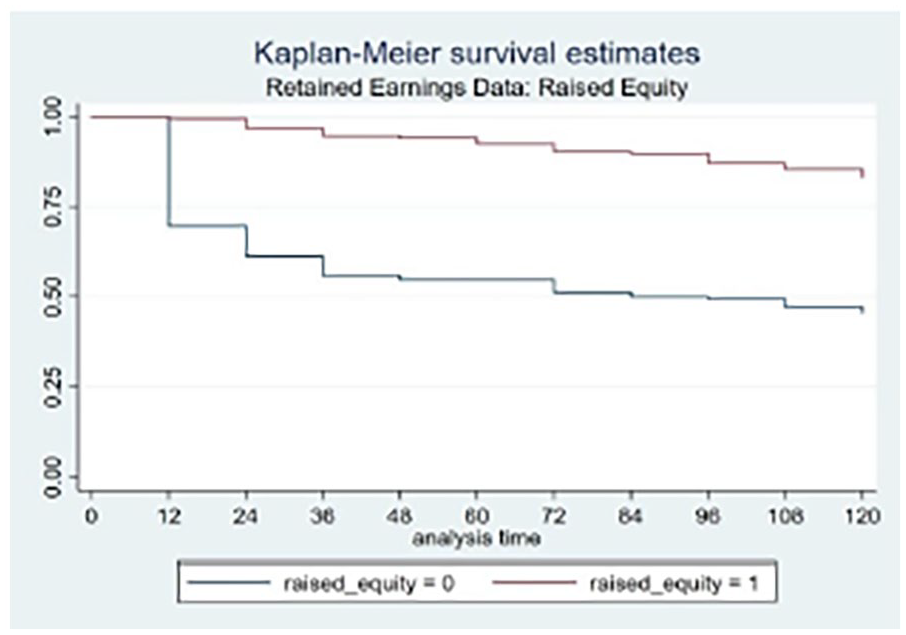
Speed with which cleantech firms achieved the ‘retained earnings’ milestone.
Results of Cox proportional hazards models for revenue, profitability and retained earnings milestones are presented in Tables 2–4, respectively. Model 1 shows that equity capital-funded businesses are slower to attain all three financial milestones. Firms that have raised equity funding are 34% less likely to achieve revenue, 56% less likely to achieve profit and 77% less likely to have retained earnings than non-equity funded cleantechs. This result remains consistent in model 2 with the addition of HARDWARE and control variables. HARDWARE cleantechs are 21% and 22% less likely than their SOFTWARE counterparts to reach the revenue and profit milestones, respectively.
Disaggregated by type of equity capital, Model 3 shows that, for all types of funding, equity-backed firms are less likely to reach each of the three milestones. The magnitude, significance and direction of these results remain consistent with the addition of the HARDWARE and control variables in Model 4. Again, HARDWARE firms are less likely to reach the revenue and profitability milestones than SOFTWARE firms. With respect to location and sector control variables – except for EAST and RECYCLING and WASTE MANAGEMENT and only for profitability (Table 3) – there are no other significant findings. 3
Robustness tests
To assess the robustness of our results, we ran a series of tests to assess their validity. One of the advantages of our research design is that we can minimise left-hand censoring issues because all cleantech firms in our sample were born in 2011/2012. However, we may face right-hand censoring issues – despite the length of time we track the cleantechs – because it may take longer to achieve the financial milestones. This may result in biased estimates of the function and inaccurate estimates of standard errors. Consequently, alongside our Kaplan–Meier event curves (Figures 5–7), we used standard log-rank tests to assess if there were significant differences in milestone probabilities between groups. We include log-rank tests to compare survival distributions across different cohorts. The log-rank test results indicated no significant differences in the survival distributions among the groups under study (p > 0.05), affirming the homogeneity of survival experiences across these cohorts.
A fundamental underlying assumption of the Cox model is the proportional hazards assumption, namely, that the hazards are consistent over time. To verify this assumption, we first calculated Schoenfeld residuals to examine the constancy of hazards over time. Our results revealed no apparent trends or patterns in the Schoenfeld residuals, suggesting that the proportional hazards assumption was not violated. This was further confirmed by a global test based on the Schoenfeld residuals, which yielded a p-value of 0.25, indicating no significant violation of the assumption at the conventional 0.05 significance level. Second, Martingale residuals were calculated to assess the model fit with the scatter plot of residuals against the predicted values, which displayed a random dispersion around the zero-line, indicating a good fit with no systematic deviations. Third, dfbeta residuals were examined to identify potential outliers. Our analysis found that all dfbeta values were within acceptable thresholds (<1), indicating that no single case unduly influenced the coefficient estimates. Fourth, p-values for individual covariates and the overall p-value associated with the test for proportional hazards were not statistically significant, further supporting the validity of our model. Finally, we ran probit models to assess if our results were sensitive to our estimation strategy. In summary, there is support for Hypotheses 1–3.
Discussion
Supporting cleantechs across the Valley of Death is critical because they can at least curb some of the significant challenges of anthropogenic climate change. Prior conceptualisations of the Valley of Death gave weight to funding and the innovation management challenges in crossing the Valley of Death. These are beneficial because they raise scholarly and practical questions about ‘how’, ‘where’ and ‘when’ technology entrepreneurs source, acquire and combine human, social and, in particular, financial resources (Clough et al., 2019).
We contribute to this debate by framing the Valley of Death as a ‘stretch goal’ (Locke and Latham, 2006) involving a long and challenging market validation journey to revenues, profitability and retained earnings. This modelling is helpful for both entrepreneurship scholars and practitioners in several ways. For scholars, while we concur that resource acquisition and mobilisation are important inputs into organisational emergence and development, our approach suggests that the focus for understanding technological commercialisation should be orientated towards outcomes such as revenue generation or profitability. Giving primacy to ends over means reflects that entrepreneurial endeavours, such as starting or growing a business, are action-orientated (Davidsson, 2015; McMullen and Shepherd, 2006) and require setting and achieving goals (Locke and Latham, 1990). This does not deny means, or the symbiotic relationship between ends and means, in entrepreneurial contexts. Indeed, many of the recent advances in entrepreneurship thinking have come about because of new means and specifications such as effectuation where the focus, inter alia, is on resources ‘in hand’ as a stimulus for venture creation or new methodologies such as the lean start-up approach which emphasise the rapid iteration of new means combinations. However, this should not discount the importance of goal-directed action. New and developing ventures need their ‘North Star’ (Ries, 2011) because goal-directed behaviour prompts better task commitment and performance, particularly in settings where goals are hard to achieve. Equally, modelling the Valley of Death as a market validation journey rather than a technological or funding problem resonates with many prevailing conceptual understandings of entrepreneurship that emphasise the centrality of an exchange, the scaling up of these exchanges and the economic sustainability of a business. This reasoning, therefore, suggests that conceptualisations of the Valley of Death as resource acquisition (e.g. equity funding), assembly (e.g. an entrepreneurial team), and configurations (e.g. a marketing and sales team, a product launch) or acquiring resources (e.g. equity funding) are incomplete indicators of travel across the Valley of Death.
Seeing the Valley of Death through a market validation lens also highlights where the Valley of Death is at its deepest. It can be tempting, particularly with cleantechs and given the difficulties they have in, inter alia, developing a minimum viable product, iterating any new product or service, or even establishing a new market, to see that the biggest challenge facing cleantechs is reaching revenue. However, one benefit of our approach is that it firmly sites the critical juncture facing any cleantech as a scaling challenge. Integral to this is the recognition of costs – costs in the challenges inherent in acquiring further resources and their effective synchronisation within the firm. However, from a market validation perspective, building revenues remains central. Giving primacy to revenues reflects the adage that while costs are certain, revenues are uncertain. Accordingly, the pivotal task for many newer firms remains the need to expand market reach at a level that proves sustainable in the short (profitability) and longer-term (retained earnings).
We also see that positioning the Valley of Death as a market validation stretch goal has two practical benefits for technology-orientated firms such as cleantechs. First, because we adopt a market validation approach that focuses on ends rather than means, this tends to raise different types of problem framing for entrepreneurs. For example, if a problem is framed as a means-based question such as ‘where’, ‘how’ and ‘when’, a potential answer may be how to locate, acquire and mobilise resources. While this has its place, one danger is that proposed solutions may discount market need, the building of a product or a service with no commercial application and the consequent need, and time required, to iterate a product or a service so that it has commercial applicability. In contrast, if the problem is framed as achieving an ‘end’ such as generating revenue or getting to profitability – ‘why’ type questions – the entrepreneur can work to identify ways of locating and deploying resources to achieve market-based solutions. Second, entrepreneurs creating and running technology-orientated firms can often become distracted by technical challenges and developing ways of combining and using resources so, they can lose sight of their primary goals. One advantage of the three milestones is that they give a ready guide to venture progress. Focusing on ends prevents mission drift because it reinforces goal commitment and attainment (Delmar and Shane, 2003; Greene and Hopp, 2018).
In addition, we offer a further contribution when empirically assessing if equity capital accelerated or retarded the achievement of the three key milestones. Equity capital ought to help cleantechs. Although we did not hypothesise for any differences between the four types of equity capital, an expectation may have been that, for example, business angel or crowdfunding finance may have supported the faster achievement of revenue generation. Likewise, as VC is often available at later stages (Series A), it might have been anticipated that it could have accelerated scaling and financial sustainability. However, prior evidence has suggested issues with Gaddy et al. (2017) suggesting that equity capital was the wrong finance model for cleantechs. The key finding from the Cox proportional hazards approach was that equity capital-backed cleantechs – regardless of the type of equity finance used – are slower in earning revenues, reaching profitability, and accumulating retained profits than cleantechs not financed by external equity capital. While finding – as might be anticipated – that Hardware struggled more than Software cleantechs and some regional differences, our results have implications for cleantechs and equity finance providers. Cleantechs may seek to pause and reflect on the value of equity finance, particularly as it can take time to source and receive such funding. It would appear that the potential benefits do not readily channel into the speedier achievement of fundamental financial goals. It would, therefore, appear that such funding is not a panacea and potentially reinforces the importance of adopting a market validation approach to crossing the Valley of Death. These findings may occur because equity finance involvement might lead to mission drift, conflicts around goals and exit pathways and monitoring burdens. For equity providers, there is little evidence that the range of informal and formal due diligence mechanisms employed results in reducing adverse selection problems and, with these, being able to source and select promising cleantechs. Traditionally, many equity capital providers focus on lowering moral hazard issues through term sheets and convertible participating preference share arrangements (Arcot, 2014). Accordingly, much of the time such providers spend is on managing existing investments towards an exit. However, our findings suggest that equity providers need to re-balance the time and effort between adverse selection and moral hazard issues.
Following Gaddy et al. (2017) and Van den Heuvel and Popp (2023), our study raises uncomfortable issues for policymakers. In other industries, equity capital provides economic benefits (Lerner and Nanda, 2020). Our evidence, however, identifies that government-backed equity capital does not speed venture outcomes, regardless of the type of equity capital. Van den Heuvel and Popp (2023) suggest that one of the malaises facing cleantechs is the thinness of their markets and the limited exit opportunities. This suggests, therefore, that if policymakers wish to address climate change, there is a need for them to provide clear and certain regulatory frameworks and create and sustain market demand (market making) (Mazzucato, 2011) rather than simply address market failures (market fixing) as our evidence suggest that different types of equity capital do not speed the achievement of financial milestones. Additionally, creating and sustaining market demand for cleantech products through public procurement policies, incentives for private sector adoption and support for innovation ecosystems can play a pivotal role. Furthermore, initiatives that focus on enhancing the infrastructure and capabilities of cleantech firms, such as funding for research and development, support for commercialisation efforts and facilitating access to international markets, are essential. Policymakers should also consider creating platforms for collaboration between cleantech firms, research institutions and large corporations to drive innovation and market penetration. This approach can better support cleantech firms in their critical growth phases and contribute more effectively to addressing climate change.
There are limitations to this study. We could not test the mechanisms by which equity-backed firms are slower in achieving critical financial metrics. Future research could explore and assess possible reasons. We see research in this area would be particularly fruitful because, alongside this study, there is other evidence (Gaddy et al., 2017; Van den Heuvel and Popp, 2023) to show that the relationship between cleantechs and equity provision has not led to the usual benefits associated with equity finance. Moreover, although firm-to-revenue timelines were shown to be under 3 years (Toroslu et al., 2023), because we confine ourselves to all cleantechs incorporated in 2011/2012 and follow them for a decade, this period may be too short. Equally, our sample is confined to the United Kingdom and our findings may not be generalisable to other regions where different regulatory, economic and market conditions prevail. Besides our call for more work on the mechanisms preventing equity capital from realising its full potential among cleantechs, future research could explore a range of pertinent areas. For example, assessing and tracking how entrepreneurial goals change across the Valley of Death would be helpful to tease out the relationship between goal setting and attainment. A further area of interest may be to focus on how technology firms in other sectors fare as they attempt to travel across the Valley of Death. This research might again examine relative speeds for achieving market validation but also look more closely – as we are unable to do so given our data – at entrepreneurial human and social capital. A further research direction is to examine the demand conditions facing cleantechs, particularly in relation to incentives and issues such as tax incentives, feed-in tariffs and carbon pricing.
Conclusion
Within this article, we reconceptualise the understanding of the Valley of Death. This is an important endeavour as journeying from start-up to scale-up and onto financial sustainability is a primary challenge for new and young technology-orientated firms. In particular, it remains a formidable testing challenge for cleantechs and has been made more acute by the need to address and resolve the climate emergency. This study, therefore, sets out a market validation approach to the Valley of Death that highlights the importance of achieving three key financial goals and, in so doing, enhances current understandings of the Valley of Death. Empirically, the article examined whether equity finance propelled or retarded the achievement of these three key goals. Our evidence emphasised the difficulties for equity finance providers seeking to support cleantechs in the United Kingdom. It indicated the need for both cleantechs and equity finance providers to carefully evaluate potential synergies and advantages from accessing and providing such support.
Footnotes
Funding
The author(s) received no financial support for the research, authorship, and/or publication of this article.