
Abstract
Research and Development (R&D) investment is seen as a fundamental driver of high-tech small and medium-sized (SME) firm performance. However, the same driver may be constraining growth among non-high-tech SMEs as it increases the level of risk faced by such firms. We challenge this argument by examining the relationship between R&D intensity and performance among non-high-tech SMEs. While the size of R&D investments is, by definition, limited in the non-high-tech sector, our study shows that such investments are important for non-high-tech firms. There is, however, an inverted U-shaped relationship between R&D intensity and performance among non-high-tech SMEs. Furthermore, increased internationalization leads non-high-tech SMEs to exploit their R&D investment more effectively to enhance firm performance, provided that R&D investment levels exceed a critical threshold.
Introduction
It is acknowledged that small to medium-sized enterprises (SMEs) play a critical role in economic and employment growth in developed countries (European Commission, 2015). However, the focus of both policy makers and SME scholars has been on the innovation and economic performance of high-tech SMEs and the role that technology plays in facilitating this process (Hoffman et al., 1998; Jones, 1999; Nunes et al., 2012; Von Tunzelmann and Acha, 2005). High-tech SMEs are seen as more capable than non-high-tech SMEs of succeeding in highly competitive environments owing to their adaptability, innovativeness and quick response times (Del Monte and Papagni, 2003; Lee, 2009).
Among the fundamental drivers of high-tech SME performance, SME scholars see research and development (R&D) investment as crucial (Ren et al., 2015; Stam and Wennberg, 2009). R&D investments enable SMEs to create new products, develop efficient processes and stimulate strategic cooperation (De Jong and Freel, 2010). There is the contention that small firms that thrive through R&D-driven release of innovative new products will increase their chances of survival and growth (Laforet, 2009). Interestingly, this very same driver of SME performance is seen as restricting growth in non-high-tech SMEs (Müller and Zimmermann, 2009; Nunes et al., 2012), which mainly comprise ‘mature’ industries such as food processing, furniture and publishing and print (Hirsch-Kreinsen et al., 2006; OECD, 2015). For instance, Nunes et al. (2012) argue that there is a negative linear relationship between R&D intensity and growth in non-high-tech SMEs, because R&D investment can increase the level of risk faced by SMEs as it adds to the challenge of obtaining finances and managing R&D investment efficiently. It is also argued that SMEs tend not to have the means to invest in R&D activities (Avermaete et al., 2003) or cannot always transform R&D into effective innovation (Laforet, 2009). If R&D investments are made in sectors that have limited technological intensity, these investments can easily be copied by competitors (Del Monte and Papagni, 2003; Lee, 2009). There are also suggestions that non-high-tech SMEs opt to substitute R&D by innovation management practices such as human resource management (HRM), teamwork and cooperation with external partners. They may also focus, to a greater extent, on customer- and market-driven innovations (Som, 2012), which demand less investment and bear less uncertainty (e.g. Rammer et al., 2009). As these studies show, R&D intensity in non-high-tech SMEs is seen to impair firm performance (De Jong and Marsili, 2006; Del Monte and Papagni, 2003).
However, there is evidence to suggest that non-high-tech SMEs invest in R&D to help them move away from the ‘commodity trap’, where products can only compete on price (Von Tunzelmann and Acha, 2005). The need for non-high-tech SMEs to upgrade their capabilities tends to be driven by globalization processes through rapid advancements in technology and easy product imitation (Evers, 2011). Perhaps not surprisingly, labour-intensive non-high-tech firms are gradually being replaced by non-high-tech firms emphasizing high-value added niches with investments in highly skilled labour, advanced machinery and R&D (Hansen and Winther, 2014). Hence, it is crucial for non-high-tech SMEs to develop capabilities and competencies for competitive advantage (Love and Roper, 2015). This can include product development via customer involvement, informal business ties, acquisition of knowledge capability and R&D collaborations (Whittaker, 2016). For instance, Grimpe and Sofka (2009) demonstrate that low-tech innovativeness is stimulated by the combination of R&D investments and collaboration with customers in domestic and international markets. Non-high-tech SMEs build, leverage and mobilize their networks to acquire domestic and foreign market knowledge, know-how, technological capabilities, finance and resources that they do not possess. It has also been shown that non-high-tech SMEs have technology strategies that enable them to access external knowledge. For instance, their presence in clusters, including technology centres or participation in international R&D networks, can facilitate the upgrading of firm capabilities (Hervas-Oliver et al., 2012b; McEvily and Zaheer, 1999; Teixeira et al., 2013). Consequently, we see it as significant to address the role of R&D intensity in the performance of non-high-tech SMEs and to assess the extent to which this relationship is influenced by the international activities of non-high-tech SMEs.
Our contributions to the SME performance literature are twofold. First, we clarify the role of R&D intensity in the performance of non-high-tech SMEs. We demonstrate that R&D investment has both a positive and a negative effect on firm performance in non-high-tech SMEs. The U-shape relationship between R&D investment and SME performance challenges the argument that R&D investments restrict growth in non-high-tech SMEs owing to increased risk and the imitability of the technological investment (Del Monte and Papagni, 2003; Lee, 2009; Nunes et al., 2012). While the size of R&D investments is, by definition, limited in the non-high-tech sector, our results show that such investments are still important for non-high-tech firms. We demonstrate that R&D investment is conducive to the performance of these SMEs until an optimum level is reached, after which there are diminishing returns.
Second, we emphasize the significance of international activities in accentuating the implications of R&D investment for performance in non-high-tech SMEs. The focus of analyses of non-high-tech SMEs has been on innovation via alternative means to R&D investment, such as teamwork and HRM practices (Rammer et al., 2009). As the competitive advantage of non-high-tech SMEs is rarely linked to technological developments, the orientation of these firms to access R&D knowledge internationally to achieve market success remains under-researched (exceptions include Evers, 2011; Hervas-Oliver et al., 2012a; Teixeira et al., 2013). We demonstrate that a non-high-tech SME’s degree of internationalization (DOI) can enable it to better exploit R&D investments for higher performance. Non-high-tech SMEs can differentiate products through the creation of unique, intangible knowledge-intensive offerings that are facilitated by technological developments in international markets (Evers, 2011).
Theory and hypotheses
R&D intensity and non-high-tech SME performance
There is a plethora of studies in the SME performance literature that demonstrate the positive influence of R&D investment on the productivity and growth of SMEs. For instance, R&D expenditure can contribute to increased growth of SMEs, given their capacity to diversify their activities (Rogers, 2004). They can increase firm capacity to absorb knowledge created from the relationships forged with external organizations and the capacity to use that knowledge to increase firm performance (Cohen and Levinthal, 1990). However, these investments are shown to be more effective in achieving productivity gains in high-tech sectors than in non-high-tech sectors (Ortega-Argilés et al., 2010). The over-concentration of SME research on technology-intensive and new technology-based sectors is seen as justified given the employment potential (Colombo and Grilli, 2007; Hoffman et al., 1998; Santarelli and Vivarelli, 2007), as well as the greater capacity for internal organization, strategic flexibility and the establishment of strategic cooperation networks with shared resources that high-tech SMEs possess in comparison to non-high-tech SMEs (Eisingerich et al., 2009; Kindström and Kowalkowski, 2009; Nunes et al., 2012). R&D expenditure helps reduce the risk associated with SME growth as these firms engage in strategic networks that complement their knowledge (Rickne, 2006). For instance, Raymond and St-Pierre (2010) argue SMEs innovate in product development and fabrication by adopting advanced manufacturing technologies in order to reduce their operational costs, increase their productivity and the quality of their products and services. Furthermore, investment in R&D can facilitate the absorption and utilization of knowledge obtained from external relationships to increase firm performance (Gilsing et al., 2008).
To our surprise, the positive effect of R&D investment on performance is not confirmed in non-high-tech SMEs (Del Monte and Papagni, 2003; Lee, 2009). In fact, the SME performance literature shows R&D investment to restrict growth in non-high-tech SMEs. It is argued that innovations resulting from R&D investments of non-high-tech SMEs are relatively easily imitable by rivals and serve as ineffective barriers to market entry (Nunes et al., 2012). Non-high-tech SMEs find investments in R&D costly and risky (Rammer et al., 2009). R&D projects demand financial commitment, exert pressure on profits and imply risk on firm survival. Information asymmetries, high management costs and challenges in financing continuous R&D activities can lead to non-high-tech SMEs refraining from or investing occasionally in such activities (Hall, 2002). Alternatively, they can drive such SMEs to emphasize the management of innovation processes and network competences (Ritter and Gemünden, 2004).
The extant literature lacks explorations of the extent to which R&D investment matters for the growth of non-high-tech SMEs. It assumes that there exists a linear and boundless relationship between R&D investment and SME performance. In other words, as SMEs make R&D investments, they increase their costs and exposure to risk, and diminish the possibility of diversifying activities. This can mean limited impact of R&D on growth of non-high-tech SMEs (Nunes et al., 2012). Non-high-tech SME growth tends to be associated more with organizational and market innovations than with the product and production process (Eisingerich et al., 2009; Lee and Lim, 2009). We challenge this view to suggest that R&D intensity can have positive implications up to a point for non-high-tech SMEs. We elaborate upon our reasoning below.
Hypotheses
The SME performance literature offers theoretical and empirical support for a negative relationship between R&D investment and non-high-tech SME performance. However, the arguments rest on the assumption that there exists a linear relationship. For instance, Nunes et al. (2012) find a negative linear relationship between R&D intensity and growth in non-high-tech SMEs. We challenge this assumption to propose that there may be a saturation point above which an increase in R&D investment does not add to SME capability to perform well. We focus on two rationales supporting the possibility that too much R&D investment may be an impediment to SME performance. Drawing on the resource-based view (RBV), we argue that non-high-tech SMEs investing in R&D may be subject to time compression diseconomies or exhibit diminishing returns (Dierickx and Cool, 1989). This implies that the more non-high-tech SMEs extend their stock of R&D know-how, the more likely they are to accumulate R&D marginal know-how. The contention in RBV is that competitive advantage arises from technological and organizational capabilities (Harrison, 2003; Teece et al., 1997). In other words, competitive advantage and performance results are a consequence of firm-specific resources and capabilities (Barney, 1986). Hence, non-high-tech SMEs seek complementary assets to enhance learning capabilities and to boost innovation performance and growth (e.g. Wu, 2012). However, time and resource constraints in developing these capabilities internally would increase a firm’s needs to collaborate to access complementary technologies and a wider scale and scope of assets (Teece, 1992). Cooperation with other firms and knowledge centres would allow small firms to complement their resource endowments, and thus overcome, at least partially, small-size related burdens (Nieto and Santamaría, 2010). However, not all collaborations will make an equal contribution to developing capabilities, and firms may not be able to effectively select and manage collaborations. Collaborations require time, energy and attention to establish and maintain, and because these are limited, they involve costs. There are inherent limitations in human capital and the associated acquisition of tangible and intangible resources as the number of collaborations increase. The resource investments and collaborations are likely to become progressively less efficient as the commitments necessary to acquire new knowledge increase with the scope of search efforts (Wales et al., 2013). In other words, the effort associated with establishing and maintaining collaborations can result in diminishing or negative returns to capability development (McFadyen and Cannella, 2004). Furthermore, as the scope of the search efforts increases, SMEs are more likely to encounter knowledge sources with which they do not share commonality, leading to an increase in assimilation costs (Wales et al., 2013). Consequently, we expect R&D investments to initially enhance non-high-tech SME performance with diminishing returns up to a point (Erden et al., 2014). Beyond this threshold, a greater share of R&D investment is expected to reduce a non-high-tech SME’s performance. Hence, we propose the following:
The moderating role of the DOI
Many SMEs rely on network linkages such as R&D cooperation and research joint ventures to access information and resources not available internally to gain a competitive advantage having a greater ability to rely on external networks (Nooteboom, 1994) and to create innovative alliances (Van Dijk et al., 1997). These networks may either be built, initially, domestically and, subsequently, extended to foreign markets (Johanson and Vahlne, 1990) or established in foreign markets in the early years of firm inception (Oviatt and McDougall, 1994). There is abundant evidence of the role of networks and the benefits accrued from internationalization among high-tech SMEs (Crick and Spence, 2005; Filatotchev et al., 2009; Ojala, 2009). What is less clear in the literature is the effect international R&D networks, in particular, have on non-high-tech SMEs. This is problematic as engagement in international R&D networks can have positive implications for SME performance (Fryges, 2009; Pangarkar, 2008). Non-high-tech SMEs can fill their technological gap through collaborations with external partners, such as technology intermediaries, to attain a competitive advantage Hervas-Oliver et al. (2012a); Spithoven and Knockaert (2012).
International business studies demonstrate that geographic expansion is one of the most important paths for firm growth (Lu and Beamish, 2006). It is an important growth strategy, in particular, for SMEs that seek to leverage core competencies in different markets (Zahra et al., 2000). In the light of growing connectedness and exchange between different actors in an innovation system, non-high-tech SMEs face the increasing necessity of assessing and adopting external knowledge (Som et al., 2015). These SMEs also rely on network linkages to mobilize, accumulate and develop resource stocks for a competitive advantage participating in a learning process with co-located firms and supporting organizations in the same regional area or via international networks to improve their knowledge base (Teixeira et al., 2013; Tsang, 2002). As organizational learning theory suggests, this learning can stimulate and even intensify product innovation (George et al., 2005; Zahra and George, 2002). It can also help SMEs overcome resource limitations that frequently constrain their growth (Zhou et al., 2007). As the international scope broadens, firms are provided with more opportunities to leverage their strategic resources while diversifying market risks (Barkema and Vermeulen, 1998). Given the distributed nature of knowledge base in non-high-tech SMEs, 1 the ability to manage and effectively coordinate network relations across company borders is a central precondition for successful non-high-tech innovation strategies (Hirsch-Kreinsen, 2008). Hence, we argue that there may be greater performance implications of R&D investments for non-high-tech SMEs that are looking to augment these investments through international collaborations.
Non-high-tech SMEs may seek support from technology intermediaries that can help ‘build the ability to scan the market for technology and to absorb the knowledge and technology acquired’ (Spithoven and Knockaert, 2012: 379). They can also participate in formal international R&D networks to accelerate their pace of innovation, stay abreast of technological and market trends and develop new products (Teixeira et al., 2013). For instance, non-high-tech SMEs have been shown to benefit from access to technology centres 2 to complement their limited R&D capabilities in non-high-tech clusters (Hervas-Oliver et al., 2012b). Similarly, Evers (2011) demonstrates that proactive engagement in R&D activities adds value to the products of newly internationalizing non-high-tech SMEs. This is owing to the need to compete on the basis of differentiated products that offer value through innovative technology and product design despite the non-high-tech nature of the business. Being hands-on in R&D on food quality and new product development enables internationalizing SMEs to address the changing and evolving nature of the seafood processing market. As these studies illustrate, internationalization allows SMEs to better exploit and appropriate benefits that accrue from technological investment (Lu and Beamish, 2006; Musteen et al., 2010; Pangarkar, 2008). Rather than serving as a substitute for R&D intensity, DOI can complement the influence of R&D intensity on the performance of non-high-tech SMEs. Consequently, we propose the following moderating role for DOI.
Research method
Sample
We used data from the 2013 Flash Eurobarometer Survey on Investing in Intangibles: Economic Assets and Innovation Drivers for Growth (European Commission, 2013a) to test our hypotheses. This survey is designed to probe investment in a range of intangible assets, including R&D investment, of European firms. The Eurobarometer data were collected by Taylor Nelson Sofres (TNS) Opinion & Social Network in all 28 member states of the European Union at the request of the European Commission. A computer-assisted telephone interviewing (CATI) technique was used to gather survey data. Respondents were called on both fixed lines and mobile phones via random digit dialling (RDD) of existing seed numbers. These seed numbers provided a working block of telephone numbers, which were subsequently stratified by the Nomenclature of Territorial Units for Statistics (NUTS2) regions and urbanization levels. For example, in Germany the seed numbers are stratified by 39 Regierungsbezirke and the urbanization levels across these government regions. Thus, we could employ a multi-stage random probability sampling design. All variables pertain to 2011 with the exception of the dependent variable of firm performance, which relates to 2013.
Our sample consists of SMEs operating in areas as wide as manufacturing (42.4%) and services (57.6%). Manufacturing firms operate in industries such as machining, outerwear, metal structures and furniture. Service firms operate in industries such as wholesale and retail, transportation and storage, and food services and accommodation. Although SMEs from all 28 European Union (EU) member countries are represented in the sample, the national sample sizes vary from 11 (Cyprus) to 61 (Spain). The final sample for the analysis totals 947 firms. The sample is characterized by SMEs that generate, on average, 48.7% of their total turnover from outside their home country. From the turnover generated in 2011, SMEs invested, on average, 2.8% in R&D and 3.4% in marketing.
Variables
Dependent variable
To assess firm performance, we use a devised measure which captures the benefits that accrue to the firm as a result of investment in intangible assets using a 2-year time lag. Several scholars contend that the effect of investment in intangibles on firm performance can only be observed after a certain time lag (Falk, 2012; Fryxel, 1990). Exceptions to this commonly accepted view include Huang and Liu (2005) who find a significant linear and quadratic relationship between R&D investment and firm profit as an indicator of firm performance in the focal investment year. We align ourselves with Falk (2012) to examine the impact of R&D investment on firm performance using a two-year time-lagged performance measure relative to the R&D investment’s year.
In accordance with Das et al. (2009) and Shankar (2012), firm performance is captured by four survey-based ordinal indicators – turnover, profit margin, market share and overall value of the company. In accordance with aspiration-driven decision-making by organizations (e.g. Greve, 1998), all four indicators are considered to reflect short-term changes in firm performance (Ho et al., 2005). We execute a categorical principal component analysis (CATPCA) – a nonlinear equivalent of principal component analysis (PCA) – to create a Likert scale from a series of Likert-type items in the survey. This enables us to examine the validity of constructing ‘firm performance’ from four Likert-type items. The CATPCA resulted in values that were well above the critical thresholds: (1) percentage of variance of 69, (2) eigenvalue of 2.78 and (3) four component loadings of
Independent variable
To assess R&D intensity, we use a devised measure that captures the firm’s ratio of R&D investment to its total turnover (see Titus et al., 2017; Tyler and Caner, 2016). This measure is reflected in two ordinal variables – in particular, internally sourced R&D investment and externally sourced R&D investment. We compute class means 3 for all seven categories to operationalize R&D intensity. We average internally resourced R&D investment and externally resourced R&D investment only for cases that exhibit valid values for both constituting variables. In line with the widely accepted method in strategic management (Haans et al., 2016), we also include a linear and a squared term to allow for an inverted U-shaped impact of R&D intensity on firm performance.
Moderating variable
To assess DOI, we use a devised measure that captures the firm’s ratio of foreign sales to total sales (see Cerrato et al., 2016; Chen and Tan, 2012). This measure is calculated as the percentage of the company’s turnover in 2011 generated from sales in countries outside their home country. It is reflected in a ratio variable that ranges from 10% to 100%.
Control variables
Previous research has identified several variables that might potentially affect firm performance and, hence, need to be systematically controlled for. First, several works report industry-related variables to affect performance (Hawawini et al., 2003; Li, 2005; Roquebert et al., 1996). Therefore, we control for the finding that R&D investment in a post-economic crisis period can create more value for firms in the services sector. We incorporate an industry-related dummy variable that distinguishes firms operating in the services category from those operating in the manufacturing category. Second, business group membership can affect performance (e.g. Lu and Yao, 2006). About 28.1% of our SMEs belong to a business group, and 71.9% are described as standalone companies. We control for business group membership by using a dummy variable that discriminates between business group companies and standalone companies. Third, firm age is often linked to firm performance (Qian et al., 2008). About 12.1% of our sampled SMEs are established between 2007 and 2012, whereas the remaining 87.9% are established prior to 2007. We, therefore, control for firm age by incorporating a dummy variable that distinguishes SMEs established prior to 1 January 2007 from those that are founded between 1 January 2007 and 1 January 2012. This particular time period corresponds to the distinction made by the European Commission (2011) between young and old firms. 4 Fourth, firm size, as represented by the number of employees, is found to positively affect performance (e.g. Goerzen and Beamish, 2003; Ho et al., 2005; Naik, 2014). We control for firm size by incorporating the number of full-time equivalents that a firm provides for. Fifth, marketing investments in brand image and reputation can affect performance as it shapes a firm’s positioning in various stakeholder groups (Brown et al., 2006). We control for marketing intensity by incorporating a firm’s ratio of marketing investment in brand image and reputation to its total turnover. In addition, we include both a linear and a squared term to allow for an inverted U-shaped impact of marketing intensity on firm performance (Peng et al., 2014). Finally, we control for different propensities to innovate in the EU-28 by adding country dummies.
Analysis
We use a hierarchical multiple regression to test our hypotheses, which is a fitting model owing to (1) our measure of metric predictor variables using different participants, (2) the interval scale used to measure our dependent variable and (3) the need to incorporate moderator effects, polynomials and relevant control variables (Hair et al., 2010). In particular, we apply the following specification of a regression model:
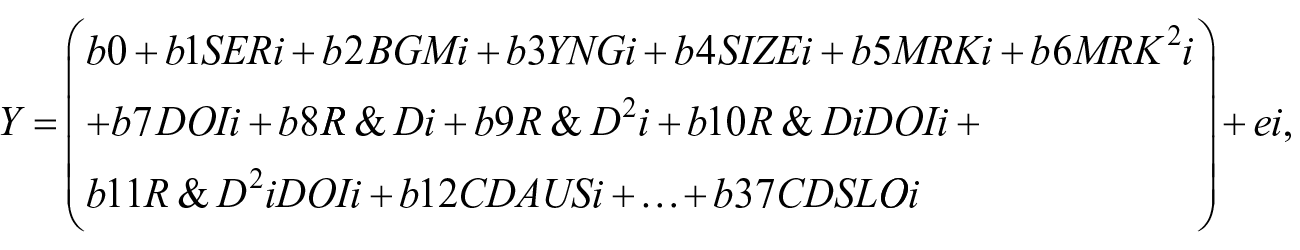
where Y represents firm performance, and R&D and DOI are R&D intensity and DOI, respectively. The remaining variables – services (SER), business group membership (BGM), young age (YNG), firm size (SIZE), marketing intensity (MRK) and country dummies (CD) – represent the control variables.
To correct for the skewness of the data, we apply log-transformations to firm size, marketing intensity and R&D intensity. Specifically, we add a constant (+1) to the log-transformations to incorporate their zero values in the analysis. To eliminate multicollinearity between linear and quadratic terms, as well as between the interaction terms and their components, we mean-centre the higher order and interaction terms prior to computation (Afshartous and Preston, 2011). We find that all regression models including the model that incorporated polynomial and moderator terms exhibit variance inflation factors (VIFs) < 5. Thus, multicollinearity is perceived not to be an issue in our model.
Results
Means, standard deviations and correlations are presented in Table 1.
Summary statistics and correlations.
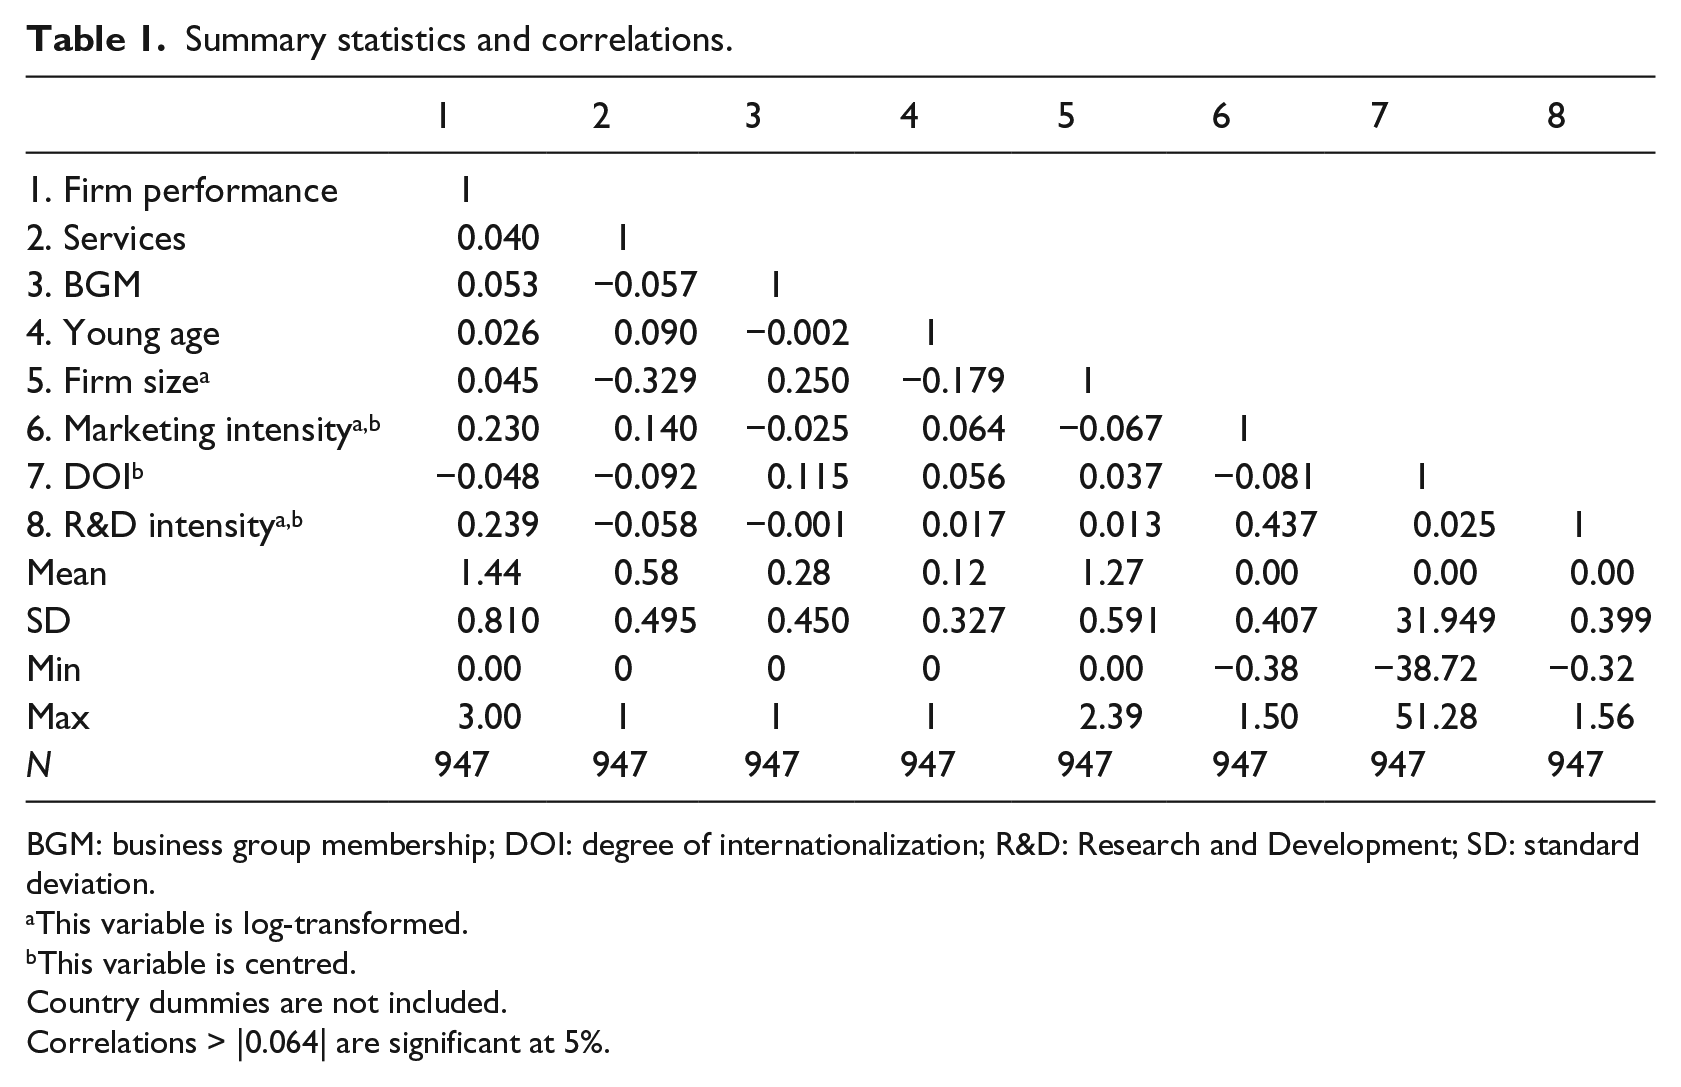
BGM: business group membership; DOI: degree of internationalization; R&D: Research and Development; SD: standard deviation.
This variable is log-transformed.
This variable is centred.
Country dummies are not included.
Correlations > |0.064| are significant at 5%.
As can be observed, correlations among the predictor variables take on low-to-moderate values. Since no correlations exceeding 0.70 are observed, the VIF findings of the absence of multicollinearity are confirmed.
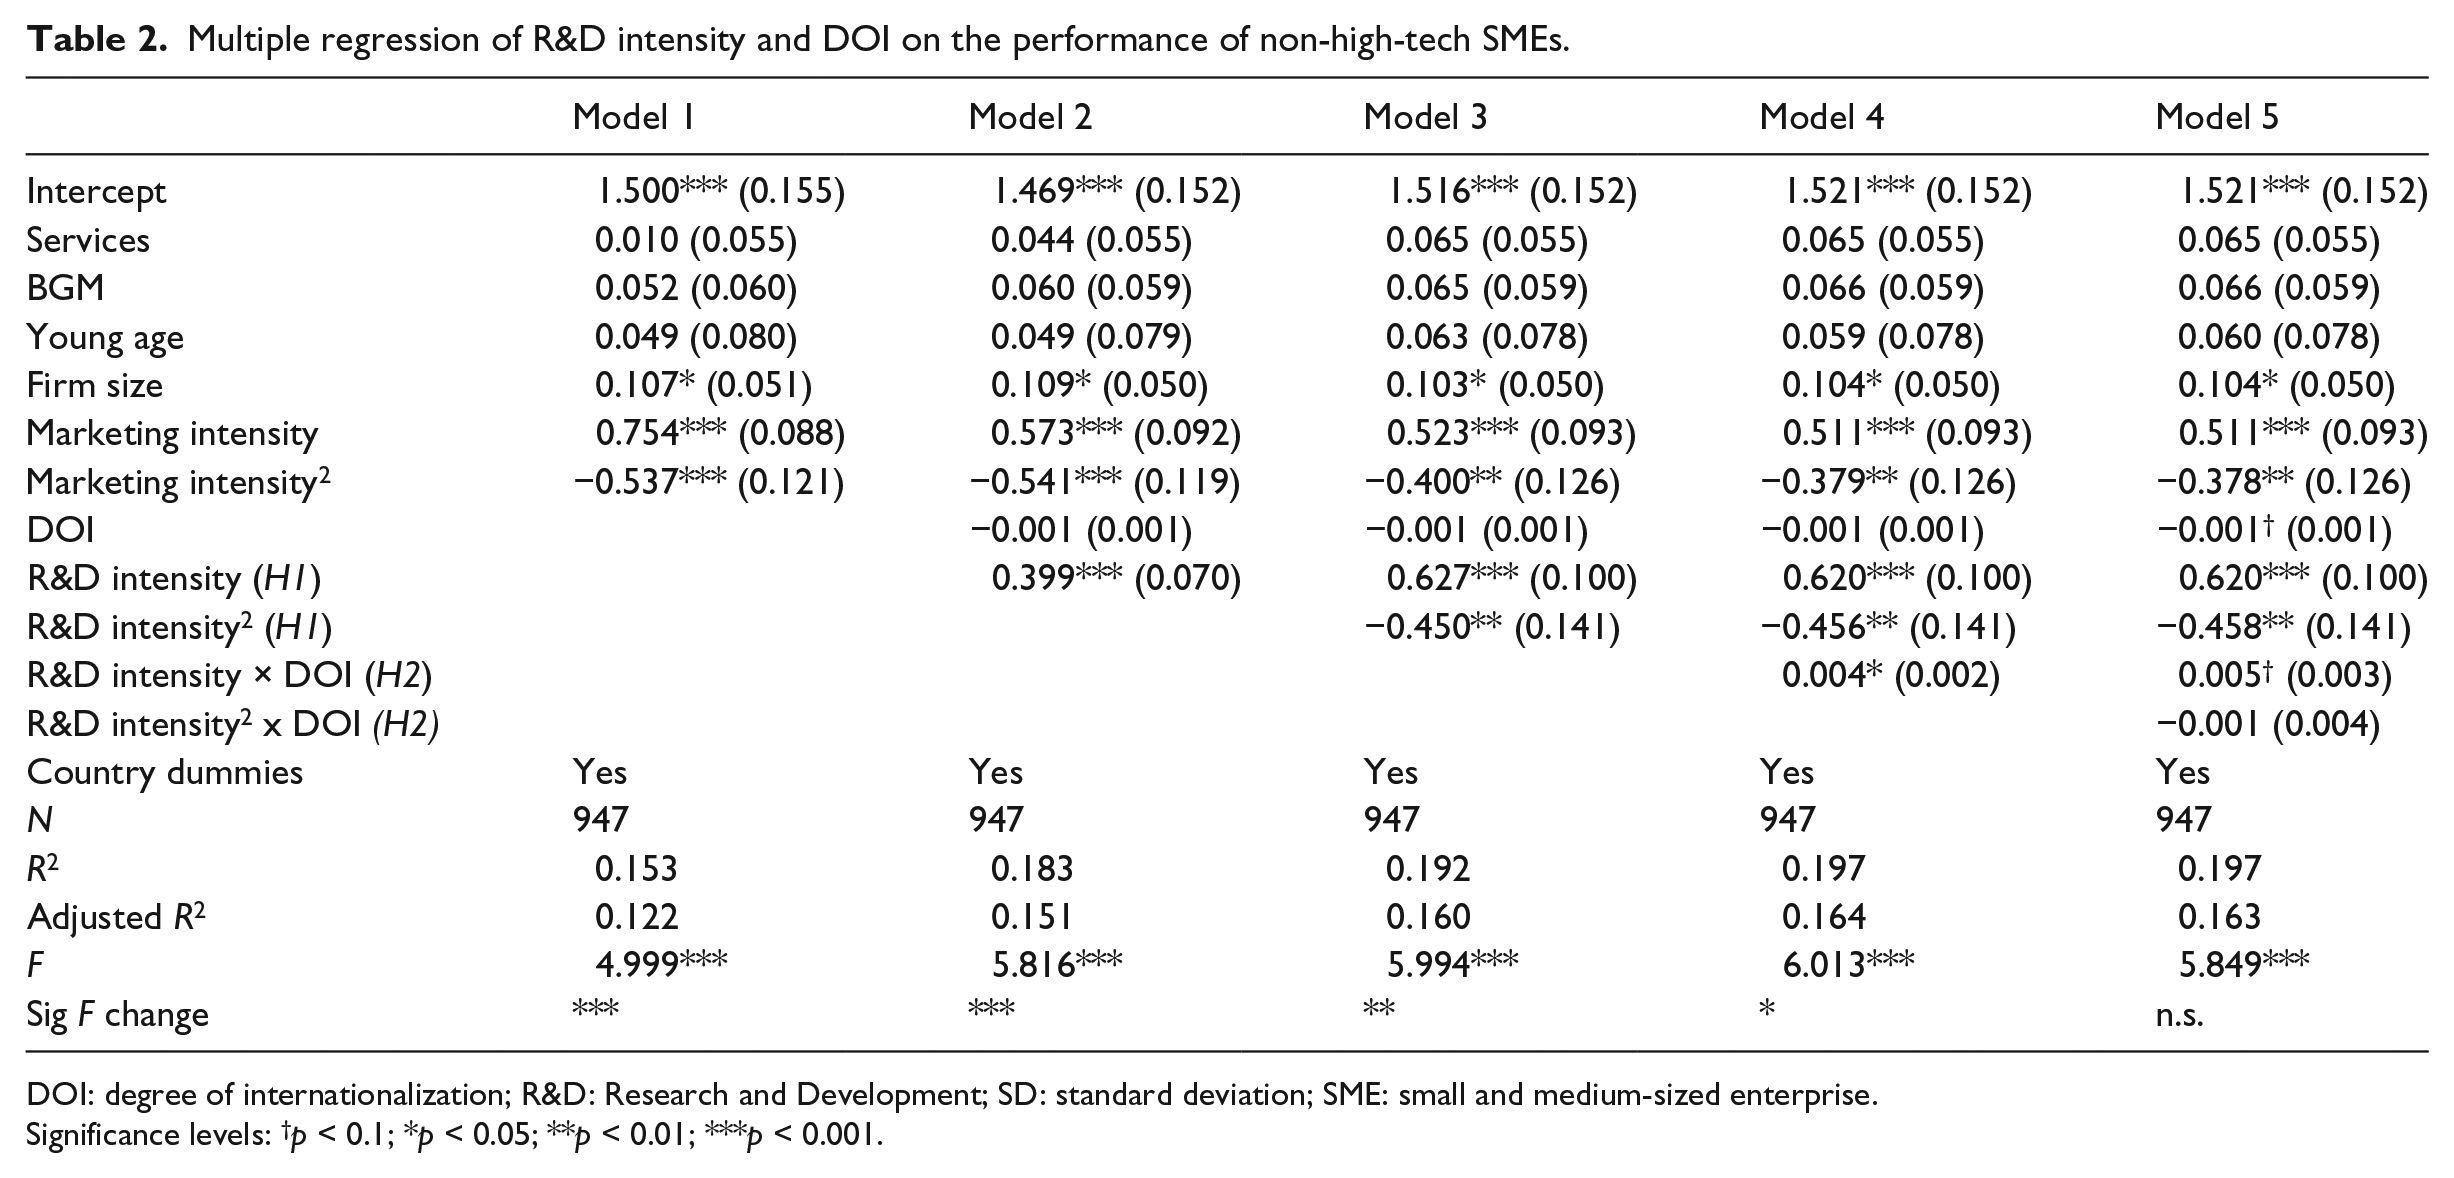
The results of the multiple regression analyses are provided in Table 2, and the corresponding graphs depicting the effects of R&D intensity and DOI on the performance of non-high-tech SMEs are shown in Figures 1 and 2. Model 1 incorporates the control variables and represents our baseline model. Model 2 adds the linear predictor variables to assess the main effects. Model 3 includes the quadratic R&D intensity term. Furthermore, in Models 4 and 5, we add linear and quadratic interaction terms of DOI. Model 5 represents the fully specified model, incorporating all controls, (non-)linear predictor variables and the interaction terms.
Multiple regression of R&D intensity and DOI on the performance of non-high-tech SMEs.
DOI: degree of internationalization; R&D: Research and Development; SD: standard deviation; SME: small and medium-sized enterprise.
Significance levels: †p < 0.1; *p < 0.05; **p < 0.01; ***p < 0.001.
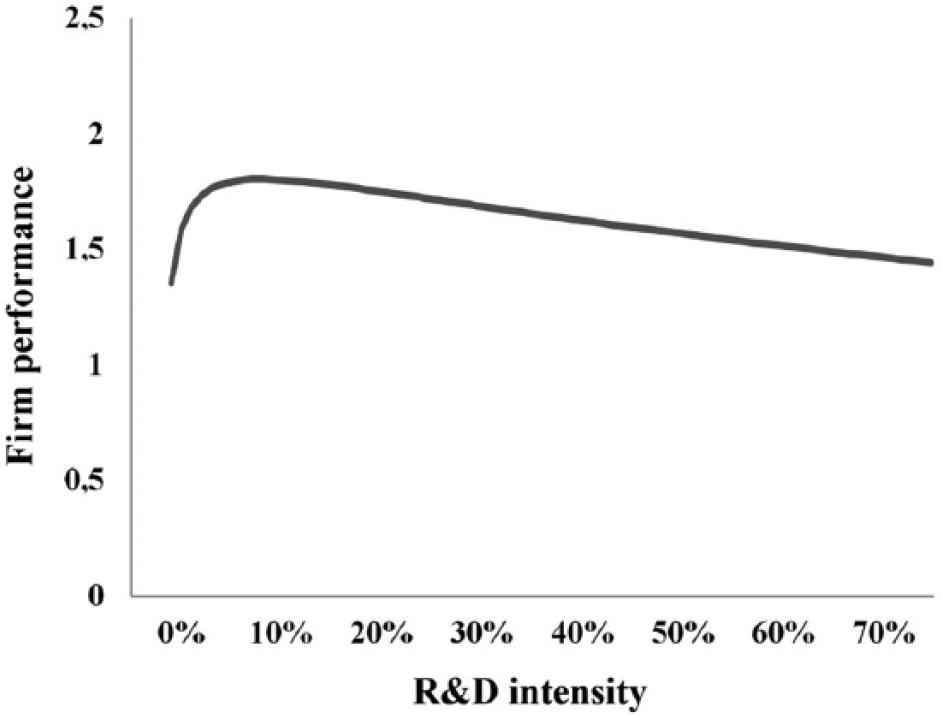
The effect of R&D intensity on the performance of non-high-tech SMEs.a
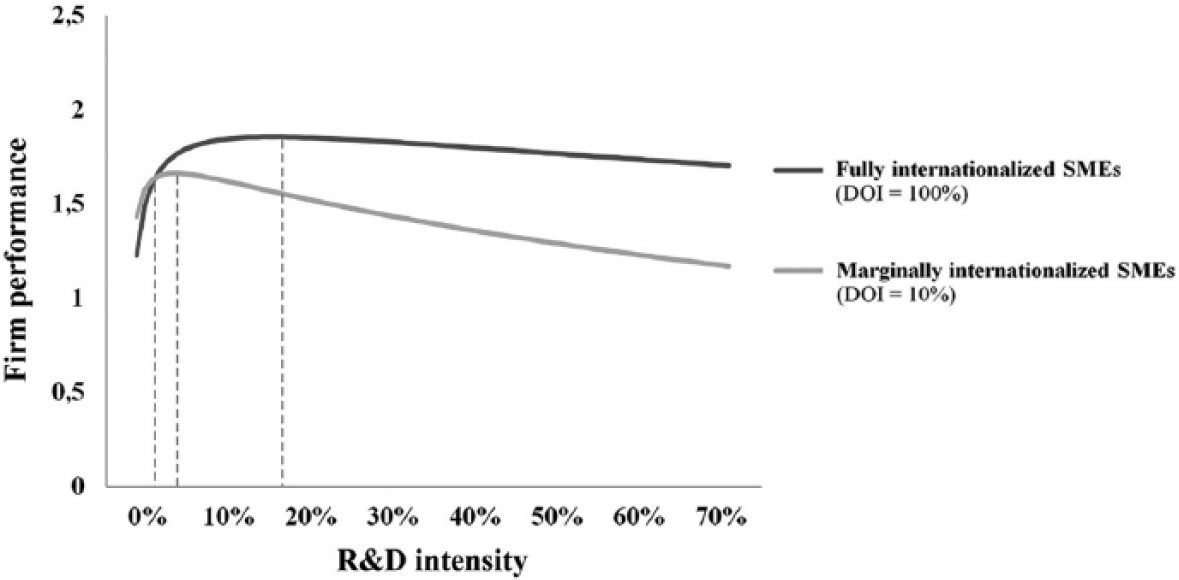
The effect of R&D intensity and DOI on the performance of non-high-tech SMEs.a
All models are statistically significant (p < 0.001) and, therefore, fit the data well. Overall, Model 3 represents a significant (p < 0.01) improvement over Models 1 and 2. In addition, Model 4 represents a significant (p < 0.05) improvement over Model 3, whereas Model 5 represents a nonsignificant improvement over Model 4 (p > 0.05). Consequently, we rely on Model 4 to test our hypotheses.
Hypothesis 1 predicts that R&D intensity has a negative and quadratic (inverted U-shaped) impact on firm performance. As shown in Model 2, the main effect of R&D intensity in Model 2 is significant (p < 0.001) as are the linear and quadratic terms of R&D intensity in Models 3 and 4 (p < 0.01). Moreover, the linear term is uniformly positive and the quadratic term is uniformly negative. Taken together, these results provide strong empirical evidence for the hypothesized inverted U-shaped relationship between R&D intensity and firm performance (see Figure 1). Therefore, Hypothesis 1 is supported. This implies that an optimum level of R&D intensity exists for non-high-tech SMEs at 9.8%. Thus, for firms with below-optimum R&D intensity levels, there may be substantial advantages in increasing their R&D investment. Conversely, for firms with above-optimum R&D intensity levels, there may be substantial disadvantages in increasing R&D investment.
Specifically, our firm size and linear marketing intensity variables show a significant positive impact on firm performance. In contrast, quadratic marketing intensity has a significant negative impact on firm performance. The country effects indicate that SMEs from the Czech Republic, Poland, Romania, Italy, Portugal and France show worse firm performance compared to Germany. These countries tend to exhibit less favourable structural conditions for conducting business (see the benchmarking exercise by the European Commission (2013b)).
Hypothesis 2 predicts that with increasing levels of DOI, the impact of R&D intensity on firm performance will be more positive. Higher levels of DOI will lift the entire R&D intensity curve upwards. As can be observed in Model 2, the main effect of DOI on SME performance is negative and nonsignificant (p > 0.05). More importantly, the results of Models 4 and 5 indicate that the interaction term including linear R&D intensity is positive and significant (p < 0.05), whereas the interaction term including quadratic R&D intensity is nonsignificant (p > 0.05). This implies that increasing DOI has a positive impact on the performance gains attributable to R&D intensity for non-high-tech SMEs.
Figure 2 provides further support for Hypothesis 2. With increasing DOI, the positive impact of R&D intensity on firm performance is stronger, provided that the R&D intensity levels exceed the critical threshold of 2.1%. Below this threshold, the negative direct effect of DOI overrides the positive moderation effect. Therefore, Hypothesis 2 is partly supported. This implies that, with increasing DOI, the advantages of increasing R&D intensity are enhanced for those SMEs who exhibit R&D intensity levels that exceed 2.1%. In addition, Figure 2 shows that the optimum firm performance level of fully internationalized SMEs requires a higher level of R&D intensity than that required by marginally internationalized SMEs (18.1 vs. 5.8%, respectively).
Robustness checks
We tested our data using several alternative specifications to verify the robustness of our results. The results of these tests were largely consistent with those presented in the main analyses and provided further support for the hypotheses. First, we checked whether the regression slopes prior to, and beyond, our turning points in the R&D intensity–performance relationship conformed to the predicted slopes of the curves (see Haans et al., 2016). Specifically, our inverted U-shaped model is built on the premise that two separate linear relationships between R&D intensity and firm performance exist: (1) a positive relationship before the turning point and (2) a negative relationship after the turning point. We checked for this by splitting the data into two sets by using the empirically determined regression coefficients of our optimal U-shaped model (Model 4) to compute the exact turning points. Next, we performed regression analyses on these two separate datasets and confirmed that (1) prior to the turning point, the relationship was positive and (2) beyond the turning point, the relationship was negative. These subsample findings provide additional empirical evidence for the existence of an inverted U-shaped relationship between R&D intensity and SME performance.
Second, we controlled for the finding that high-tech SMEs obtain performance benefits from R&D investment (Nunes et al., 2012) and the synergistic combination of R&D investment and internationalization (e.g. Lu and Beamish, 2006; Musteen et al., 2010; Pangarkar, 2008). Thus, we aimed to validate our results for all SMEs. First, we incorporated a dummy variable to distinguish high-tech SMEs from non-high-tech SMEs (e.g. Andries and Faems, 2013) by drawing on Eurostat’s (2014) NACE Rev. 2 distinction between high-tech or knowledge-intensive sectors and non-high-tech or non-knowledge-intensive sectors (see Table 3).
NACE code demarcation of (non-)high-tech SMEs.
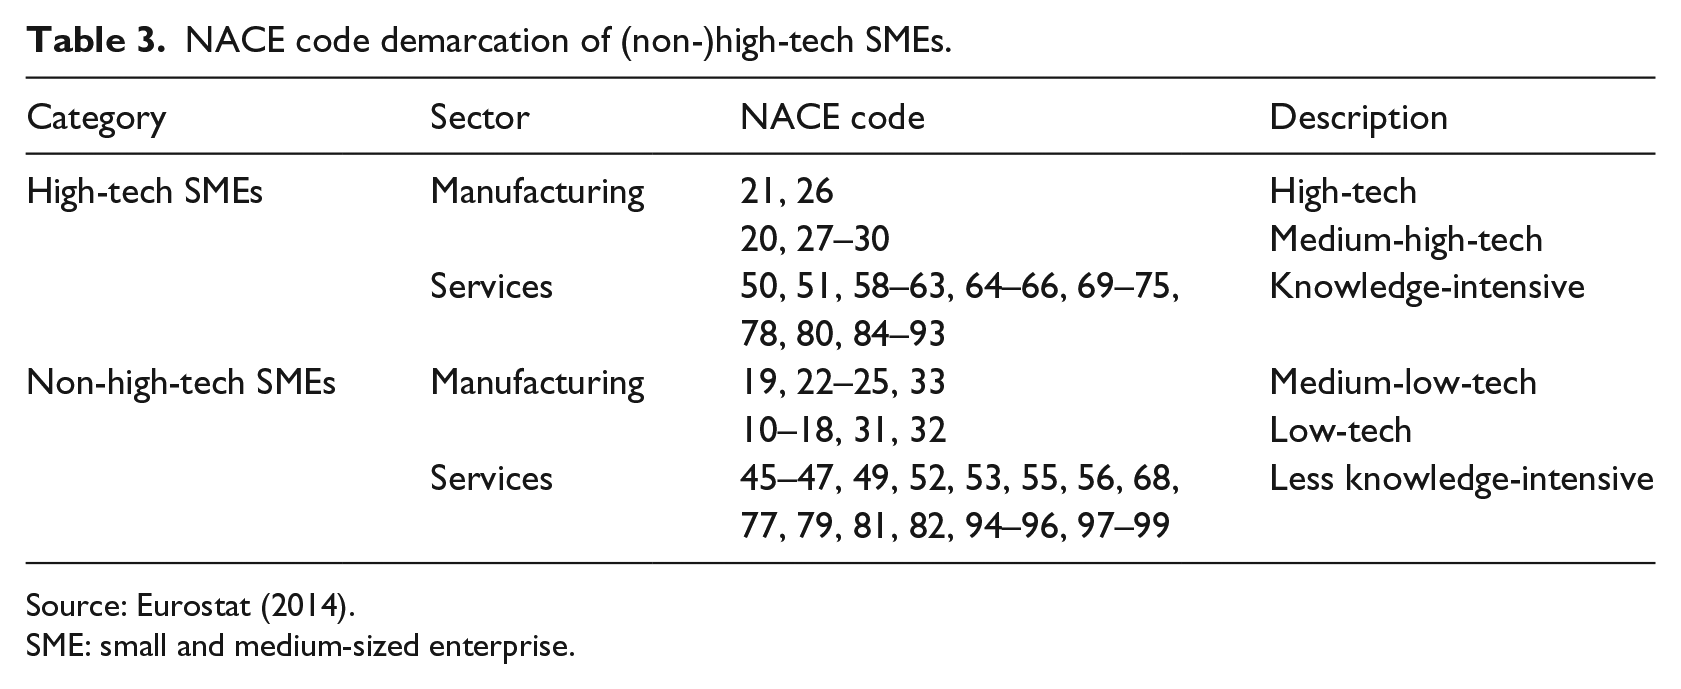
Source: Eurostat (2014).
SME: small and medium-sized enterprise.
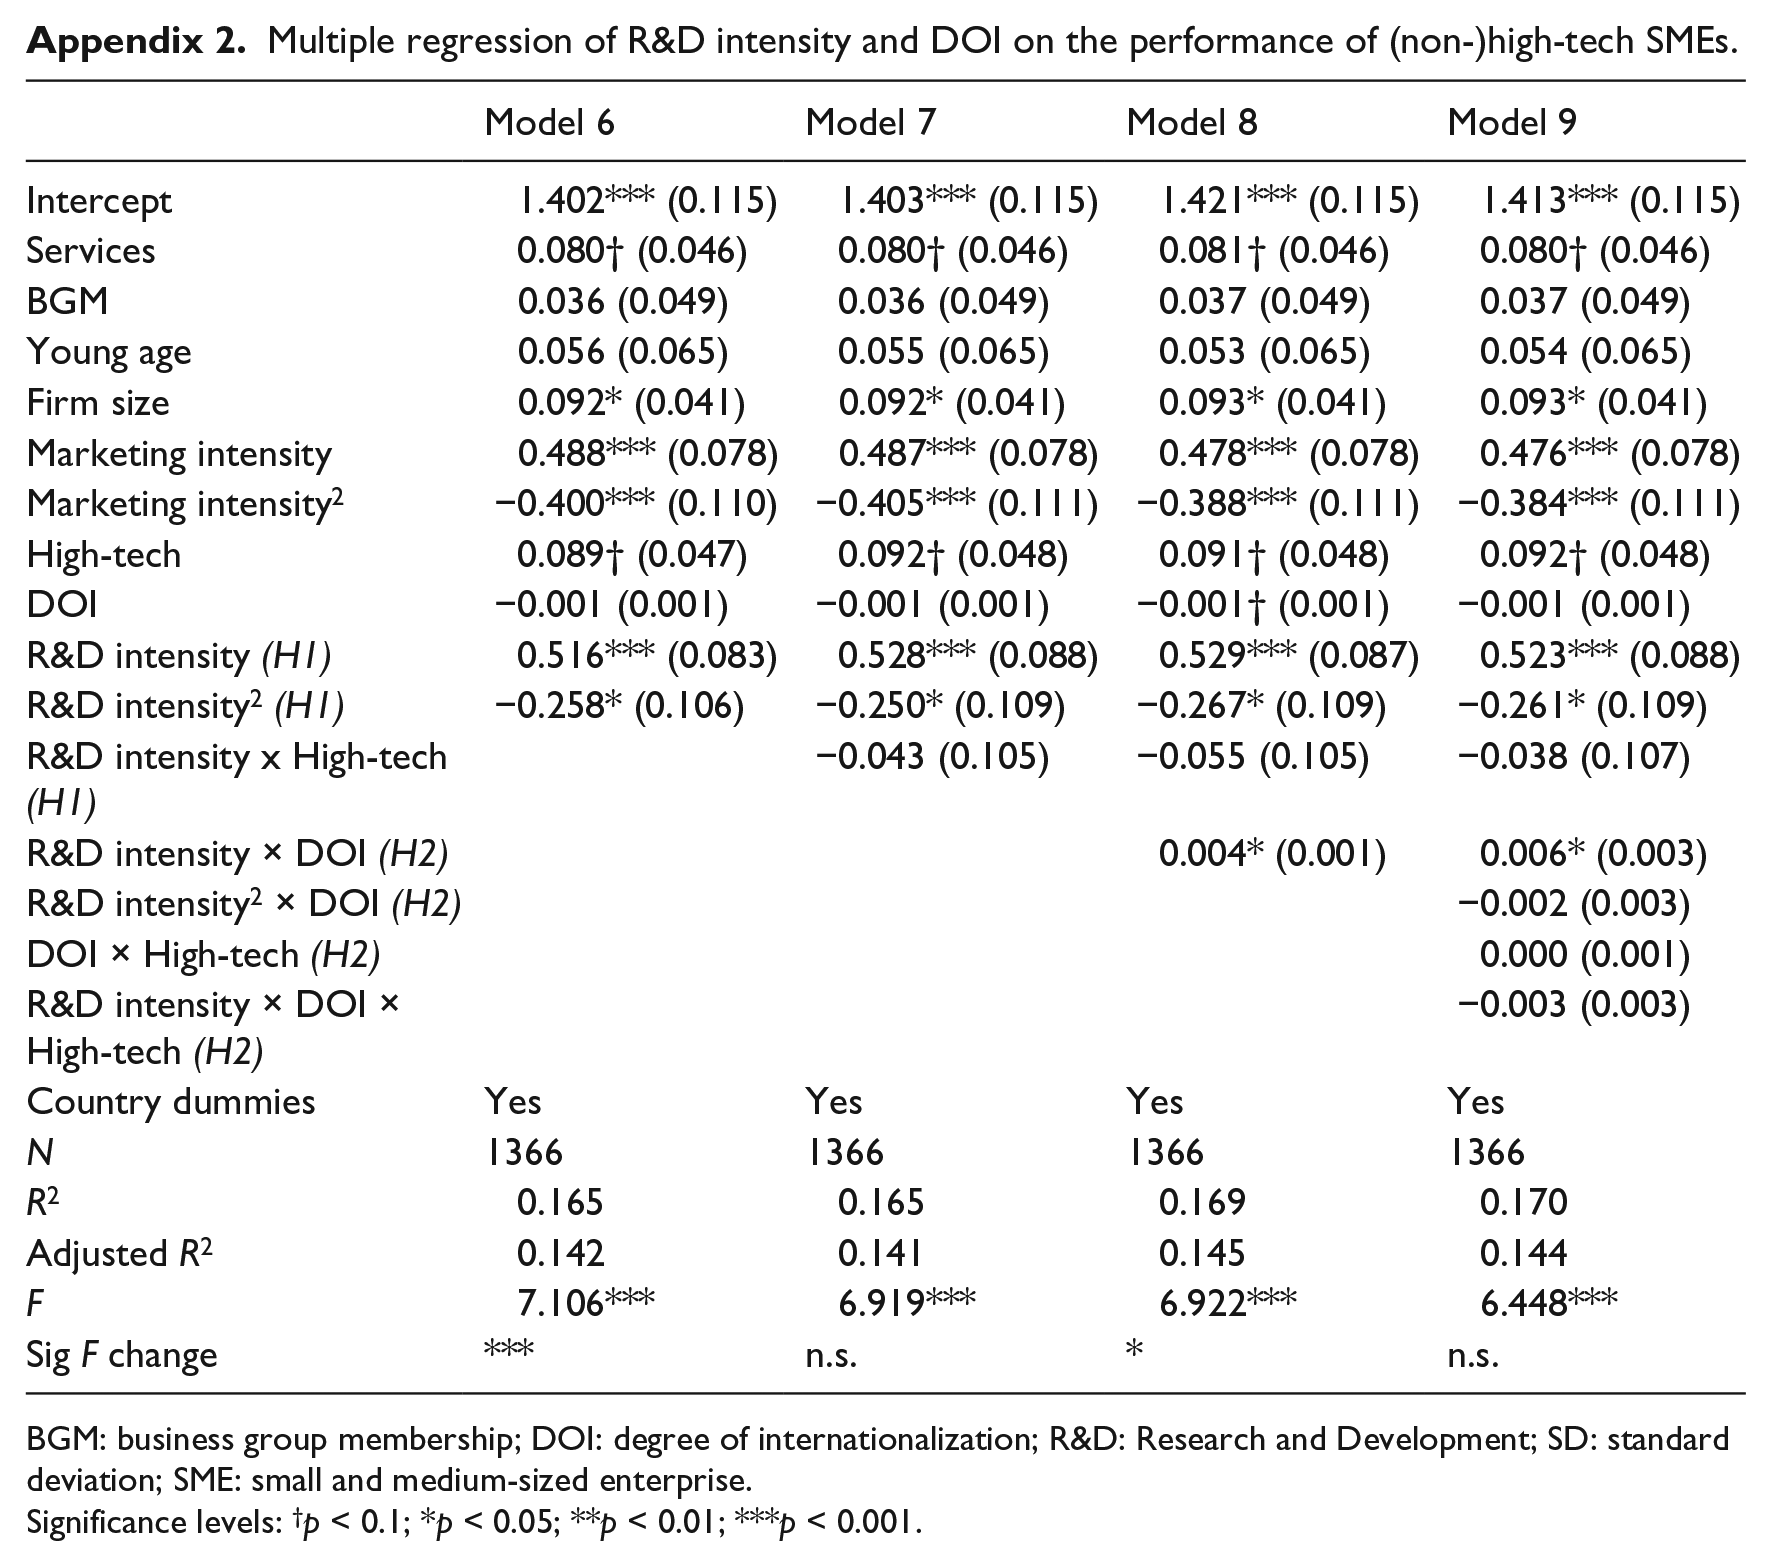
Subsequently, we added all 419 high-tech SMEs from Eurobarometer to our sample, totalling 1366 SMEs. Drawing on this sample and the construction of several interaction terms including a high-tech dummy, we tested our results for Hypotheses 1 and 2 (see Appendices 1 and 2). To test Hypothesis 1, we used Model 3 as the base model and added a linear high-tech term and an interaction term, including R&D intensity and high-tech (see Models 6 and 7). The results indicate that all directional and significant effects are similar to those in Model 3. Both high-tech main and interaction terms are nonsignificant (p > 0.05). Thus, we provide evidence for the existence of a similar inverted U-shaped relationship between R&D intensity and firm performance for high-tech and non-high-tech SMEs. To assess Hypothesis 2, we used Model 4 as the base model and included a linear high-tech term and interaction terms, including R&D intensity and high-tech, R&D intensity-squared and DOI, DOI and high-tech, and R&D intensity and DOI and high-tech (see Models 8 and 9). The results indicate that all directional and significant effects are similar to Model 4. All high-tech main and interaction terms are nonsignificant (p > 0.05). Thus, we confirm that with increasing DOI, the positive impact of R&D intensity on firm performance is stronger, provided that the R&D intensity levels exceed a critical threshold for both high-tech and non-high-tech SMEs.
As R&D intensity and DOI levels are both firm-specific strategic choices, we performed endogeneity tests of R&D intensity and DOI in relation to firm performance (Semadeni et al., 2014). This enabled us to check for the potential adverse effects of (1) reverse causation, (2) measurement error in variables, (3) autoregression and (4) omitted variables. These phenomena can lead to biased variable coefficients in regression models (Haans et al., 2016). Following Wooldridge (2009), we used two-stage least squares (2SLS) to test for endogeneity. This procedure involves the identification of multiple instrumental variables specific to the endogenous variables in the calculation of residuals, which are then regressed together with the optimal model variables on firm performance. Since the residuals were not (p > 0.1) related significantly to firm performance for each endogenous variable, we concluded that neither R&D intensity nor DOI causes endogeneity problems in our optimal regression model.
Fourth, we controlled for the location boundedness of marketing advantages (Banalieva and Dhanaraj, 2013) by regressing interaction terms, including marketing intensity and internationalization on SME performance. Model 3 is used as the base model. The results indicate that both interaction terms are nonsignificant (p > 0.05). This implies that marketing advantages are indeed location bounded, whereas R&D advantages are non-location bounded (Nocke and Yeaple, 2007) as is indicated by our optimal Model 4 (p < 0.05). Thus, we provide support for the superiority of R&D advantages in the internationalization context.
Finally, to correct for the effect of any outliers (data points with standardized residuals that exceed the threshold value of ±3 (Miocevic and Crnjak-Karanovic, 2011)), we performed casewise diagnostics for our regression models. The lack of outliers resulted in an empty casewise diagnostics table, indicating that our results were not driven by outliers.
Discussion
This study examines the role of R&D investment in the performance of non-high-tech SMEs to account for the ‘neglected’ non-R&D performers that are often subject to policy bias (Hervas-Oliver et al., 2011). Rather than arguing that non-high-tech SMEs resort to non-technological approaches to upgrade their performance (Piva and Vivarelli, 2002), we show that the technological approach through R&D explains the high performance of non-high-tech SMEs until an optimum level, and that this performance is strengthened by the international activities of such SMEs. Our findings contribute to SME performance debates in two ways. First, we challenge the predominant view in the field that R&D intensity is detrimental to non-high-tech SME performance. This has led us to hypothesize on a nonlinear R&D-based approach that non-high-tech SMEs take to achieve high performance. Second, we demonstrate that the positive impact of R&D intensity on the performance of non-high-tech SMEs is accentuated by their international network linkages. We elaborate on these contributions below.
First, while the size of R&D investments is, by definition, limited in the non-high-tech sector, our study shows that such investments are still important for non-high-tech firms. Product innovativeness among non-high-tech SMEs is significantly influenced by R&D investments (De Beule and van Beveren, 2012; Hervas-Oliver et al., 2011). Our study complements this argument by demonstrating an inverted U-shaped relationship between R&D investment and performance. Greater investments in R&D lead non-high-tech SMEs to improve their performance up until the critical threshold of 2.1%. Below this threshold, diminishing returns set in. This suggests that the more non-high-tech SMEs extend their R&D knowledge base beyond this threshold, the more likely they are to accrue R&D knowledge that has an increasingly marginal contribution. With the acquisition of new knowledge, resource investments and collaborations are likely to become progressively less efficient (Wales et al., 2013). SMEs may face constraints on human capital and complexity in managing increasing numbers of collaborations. Therefore, competitive advantage in non-high-tech SMEs does indeed require firm strategies that capitalize on R&D investments. This challenges the linearity assumption in the SME performance literature to deepen our knowledge of the critical role of R&D in low-technology sectors. Empirical findings in this area have been ambiguous regarding the magnitude of R&D activities, in particular, given that most samples are based only on high-tech SMEs (e.g. Del Monte and Papagni, 2003; Lee, 2009). Furthermore, R&D intensity is argued to hinder the growth of non-high-tech SMEs owing to increased risks and incapacity due to ‘liabilities of smallness’ or constrained endowment of tangible assets (Avermaete et al., 2003; De Jong and Marsili, 2006; Laforet, 2009).
Second, we demonstrate that non-high-tech SMEs seek technological developments in international collaborations to better exploit their R&D investments to attain higher performance. In line with more recent studies (Evers, 2011; Hervas-Oliver et al., 2012a; Teixeira et al., 2013), we confirm that the orientation of non-high-tech SMEs to access R&D knowledge internationally contributes positively to their performance. However, in contrast to these studies, we confirm a positive moderation effect of internationalization on the relationship between R&D investment and performance of non-high-tech SMEs. Non-high-tech SMEs can rely on international network linkages to access external sources of knowledge to complement their limited R&D capabilities (Hervas-Oliver et al., 2012a). Such firms are shown to compete on the basis of differentiated products that offer value through innovative technology and product design despite the non-high-tech nature of the business (Evers, 2011). They can seek support from technology intermediaries (Spithoven and Knockaert, 2012) and participate in formal international R&D networks (Teixeira et al., 2013) to upgrade their capabilities and accelerate innovation. The international networks of non-high-tech SMEs can compensate for a lack of knowledge capabilities, as well as leverage resources for knowledge of opportunities (Evers, 2011). This finding also clarifies the role of R&D networks in the international business literature in the performance of non-high-tech SMEs. Although there is a plethora of evidence for the role of networks and the benefits accrued from internationalization in high-tech SMEs (Crick and Spence, 2005; Filatotchev et al., 2009; Ojala, 2009), we know less about how international R&D networks influence non-high-tech SME performance.
Given our findings, we suggest that past contributions have overstated the lack of tangible resources of non-high-tech SMEs to build competitive advantage. Non-technological approaches alone cannot explain the performance of non-high-tech SMEs. We emphasise the role of R&D investment in a nonlinear relationship with non-high-tech SME performance. Non-high-tech SMEs seek complementary assets domestically and internationally to enhance their learning capabilities, increase their innovation performance (Wu, 2012) and mitigate their small-sized burdens up to a point. Beyond this point, diminishing returns set in owing to inefficiencies in the management of resources and collaborations (Wales et al., 2013). Consequently, our findings challenge the assertion that non-high-tech firms (Del Monte and Papagni, 2003; Lee, 2009) or non-high-tech SMEs (Nunes et al., 2012) do not obtain performance benefits from R&D investment due to imitability of their innovations or the substitution of R&D activity by alternative practices such as HRM, teamwork and collaboration with external partners (Rammer et al., 2009). This calls for a more eclectic theory building that considers both technological and non-technological approaches to explaining non-high-tech SME performance.
Conclusion
This study contributes to the literature on SME performance by demonstrating the significance of a nonlinear technological approach to assessing the performance of non-high-tech SMEs. We believe that this approach can be useful not only to academics but also to managers and practitioners. First, non-high-tech SMEs that operate internationally can reap substantial performance benefits if their executives decide to increase their R&D intensity to 5.8% and 18.1% for marginally versus fully internationalized SMEs, respectively. Beyond these critical thresholds, SME executives are encouraged to reduce their investments to the aforementioned levels. These implications are equally relevant for European policy makers who develop R&D support schemes such as the Horizon 2020, 5 since we show that only certain R&D intensity ranges of non-high-tech SMEs lead to increased firm performance with the potential to increase competitiveness of European firms, in general. Therefore, European policy makers are advised to tailor their R&D support schemes, so that they benefit firms maintaining an R&D intensity level proximate to, but not exceeding, 5.8 and 18.1% for the respective SMEs. This also suggests that European policy makers would benefit from terminating R&D support to non-high-tech SMEs that exhibit R&D intensity levels that exceed these critical thresholds.
Second, we show that the optimum level of R&D investment for fully internationalized SMEs requires a higher level of R&D investment than that required by marginally internationalized SMEs. This can be explained by the fact that fully internationalized SMEs are more directly exposed to global market pressures. Inherently, innovation is more fundamental to their survival than it is for marginally internationalized SMEs. This suggests that managers of firms that exhibit high rates of international exports could substantially boost firm performance by simultaneously maintaining high rates of R&D investment. Although low rates of international exports can lead to some performance gains attributable to R&D investment, the real performance potential of non-high-tech SMEs can be realized only if R&D investment and internationalization rates are combined synergistically.
Recommendations for future research
This study raises several potentially interesting questions for future research. First, given the historical bias in support for innovation towards technological innovation by high-tech SMEs (Love and Roper, 2015), it is worth continuing the line of research on non-high-tech SMEs. A question of relevance is how the innovations of non-high-tech SMEs are protected. For instance, European SMEs tend to use ‘secrecy, complexity of design, and lead-time advantage’ (Spithoven et al., 2010: 367) rather than patents as protection mechanisms due to the high costs associated with patent validation in Europe (Holgersson, 2013). In relation to this, it is also of significance to investigate which strategic protection and appropriability mechanisms are the most efficient and effective in protecting non-high-tech SME innovations from being copied by competitors? Second, given the line of demarcation drawn in the approaches advocated to achieving growth by high-tech and non-high-tech SMEs, it would be timely to examine which combinations of technological (R&D intensity) and non-technological approaches such as HRM practices to performance allow non-high-tech SMEs to attain a competitive advantage.
Limitations of the study
Some limitations need to be taken into account when considering our results. First, we conducted research on European internationalized SMEs operating in a non-high-tech setting, but we were not able to fully control for the percentage of cases per EU-28 country. This is due to the fact that Eurostat does not provide statistical information on the number of European non-high-tech and/or internationalized SMEs per EU-28 country. Although our sample does include cases from each EU-28 country, we recognize that we cannot ensure full representativeness. As a consequence, we need to exercise caution when generalizing our results as they may be more relevant for internationalized non-high-tech SMEs in over-represented than in under-represented EU countries. Future research should consider controlling for the percentage of cases per EU-28 country to increase sample representativeness and generalizability of the results. This requires an extensive effort from Eurostat since they are responsible for collecting statistical information on EU-28 topics and making it available to the broader public, including scholars.
Second, we examine firm performance with a two-year lagged variable but do not consider other performance variables that span multiple years, given the limitation of our dataset. We recognize that the performance implications of R&D investment cannot be fully grasped by our fixed performance variable. For instance, the performance implications of R&D projects exhibit varying time lags (1) among industries, (2) among firms within the same industry and (3) within firms (Naik, 2014). Future research should consider taking a longer time perspective and multiple year-lagged variables to more accurately assess the performance implications of R&D investment over time. This would also allow for more accurate assessment of the varying time lags among and within industries and firms.
Third, we examine firm performance by using a subjective composite variable, given the absence of objective measures of performance in our dataset. Future research should consider using both subjective and objective measures of firm performance, such as return on assets (ROA) and turnover growth (Miller et al., 2013), to increase validity (O’Sullivan and Abela, 2007). Although evidence suggests that subjective measures correlate highly with objective measures of firm performance (Subramanian et al., 2009), especially in the case of SMEs (Khan and Khalique, 2014), the adoption of both subjective and objective measures of firm performance is recommended to strengthen validity (O’Sullivan and Abela, 2007).
Finally, we examine R&D from a traditional ‘closed innovation’ perspective rather than from an ‘open innovation’ perspective. In an ‘open innovation’ perspective, R&D activities are still organized and exercised in-house, but it is acknowledged that (1) knowledge inflows accelerate innovation processes and (2) external knowledge outflows can serve the firm in the long term by stimulating future knowledge inflows (Chesbrough, 2003). We recognize that the traditional ‘closed innovation’ perspective is becoming increasingly unsustainable for SMEs (Wynarczyk, 2013). Hence, future research should consider the performance implications of R&D investment by discriminating between firms taking a ‘closed innovation’ versus an ‘open innovation’ perspective.
Despite the aforementioned limitations, we believe that our study contributes to an enhanced understanding of the effects of R&D investment and internationalization on the performance of non-high-tech SMEs. As our robustness checks confirm, non-high-tech SMEs, similar to high-tech SMEs, are able to synergistically combine R&D investment and internationalization to achieve superior firm performance. Contrary to the common belief, we show that non-high-tech SMEs are not the ‘black sheep’ of the SME performance debates.
Footnotes
Appendix
Multiple regression of R&D intensity and DOI on the performance of (non-)high-tech SMEs.
| Model 6 | Model 7 | Model 8 | Model 9 | |
|---|---|---|---|---|
| Intercept | 1.402*** (0.115) | 1.403*** (0.115) | 1.421*** (0.115) | 1.413*** (0.115) |
| Services | 0.080† (0.046) | 0.080† (0.046) | 0.081† (0.046) | 0.080† (0.046) |
| BGM | 0.036 (0.049) | 0.036 (0.049) | 0.037 (0.049) | 0.037 (0.049) |
| Young age | 0.056 (0.065) | 0.055 (0.065) | 0.053 (0.065) | 0.054 (0.065) |
| Firm size | 0.092* (0.041) | 0.092* (0.041) | 0.093* (0.041) | 0.093* (0.041) |
| Marketing intensity | 0.488*** (0.078) | 0.487*** (0.078) | 0.478*** (0.078) | 0.476*** (0.078) |
| Marketing intensity2 | −0.400*** (0.110) | −0.405*** (0.111) | −0.388*** (0.111) | −0.384*** (0.111) |
| High-tech | 0.089† (0.047) | 0.092† (0.048) | 0.091† (0.048) | 0.092† (0.048) |
| DOI | −0.001 (0.001) | −0.001 (0.001) | −0.001† (0.001) | −0.001 (0.001) |
| R&D intensity (H1) | 0.516*** (0.083) | 0.528*** (0.088) | 0.529*** (0.087) | 0.523*** (0.088) |
| R&D intensity2 (H1) | −0.258* (0.106) | −0.250* (0.109) | −0.267* (0.109) | −0.261* (0.109) |
| R&D intensity x High-tech (H1) | −0.043 (0.105) | −0.055 (0.105) | −0.038 (0.107) | |
| R&D intensity × DOI (H2) | 0.004* (0.001) | 0.006* (0.003) | ||
| R&D intensity2 × DOI (H2) | −0.002 (0.003) | |||
| DOI × High-tech (H2) | 0.000 (0.001) | |||
| R&D intensity × DOI × High-tech (H2) | −0.003 (0.003) | |||
| Country dummies | Yes | Yes | Yes | Yes |
| N | 1366 | 1366 | 1366 | 1366 |
| R 2 | 0.165 | 0.165 | 0.169 | 0.170 |
| Adjusted R2 | 0.142 | 0.141 | 0.145 | 0.144 |
| F | 7.106*** | 6.919*** | 6.922*** | 6.448*** |
| Sig F change | *** | n.s. | * | n.s. |
BGM: business group membership; DOI: degree of internationalization; R&D: Research and Development; SD: standard deviation; SME: small and medium-sized enterprise.
Significance levels: †p < 0.1; *p < 0.05; **p < 0.01; ***p < 0.001.
Funding
The author(s) received no financial support for the research, authorship and/or publication of this article.