
Abstract
Recognition that children's views should be respected has increased since the United Nations’ publication of the Convention on the Rights of the Child. This study explored whether preschool children's drawings and descriptions of themselves “talking to someone” differed for children with speech sound disorder (SSD) compared to children with typically developing speech. Participants were 78 children matched for age and sex and divided into two groups (SSD and Typical) based on percentage of consonants correct on the Diagnostic Evaluation of Articulation and Phonology. The SSD group was significantly more likely to self-report some difficulty talking but did not differ from the Typical group on how they felt about their talking or on developmental maturity for drawing human figures. Analyses applying a focal points approach showed a significant difference in participants’ portrayal of “body parts” but no difference for “facial expressions,” “talking and listening,” “relationships and connections” (number of people and conversational partner/s) and “sense of self.” Children with SSD were more likely to accentuate ears in their drawings, while typically developing children were more likely to accentuate hands. In sum, drawing and describing “talking” did not differentiate SSD and typically developing children, but enabled understanding of how individual children conceptualize and represent communication with others.
Introduction
Childhood is a time to learn to talk. Since the publication of the Convention on the Rights of the Child (CRC, United Nations, 1989), there has been increased recognition that children should be given the opportunity to have a say in their own lives and to support adults to better understand children's perspectives on matters that affect them (Holliday et al., 2009; Lundy, 2007; McLeod, 2018). The views of children have become significant in research with studies examining the perspectives of children to encourage a more holistic understanding of the topics that concern them (e.g. Barblett et al., 2023; Einarsdottir et al., 2009; Harrison, 2014; McCormack et al., 2022; Washington et al., 2024). Children should be considered valuable members of communities, and their thoughts should be listened to. However, even children who are competent communicators may not be comfortable or able to talk about matters that concern them (Dockett and Perry, 2007; McCormack et al., 2010; Roulstone and McLeod, 2011).
While researchers have established the importance and value of including children's perspectives in their research, doing so in a respectful way must also be considered. Article 13 of the CRC (United Nations, 1989) states that: The child shall have the right to freedom of expression; this right shall include freedom to seek, receive and impart information and ideas of all kinds, regardless of frontiers, either orally, in writing or in print, in the form of art, or through any other media of the child's choice.
When children draw, they can transform a blank piece of paper into a representation of something real or imagined, carefully planning the entire drawing process, sometimes even before beginning their drawing (Harrison, 2014, 2025; Wright, 2010). Children also can alter their drawings to suit a purpose, improvising and changing the meaning in their drawings as they describe their drawings to adults (Wright, 2010). Eisner (2002) argues that “What is important is often exaggerated, what is important is often made more visible, what is important secures a prominence on the paper that confers on it the significance they want to express” (p. 113). Although researchers suggest that drawing is an appropriate, child-friendly way of gaining an understanding of children's perspectives validity and reliability of the interpretation of children's drawings rests on how adults collect and analyze them (Dockett and Perry, 2007; Holliday et al., 2009; McCormack et al., 2022). It is therefore important that children are asked to assist in the interpretation of their drawings to allow researchers to understand the intended meanings (Dockett et al., 2009).
Often, children's drawings have been analyzed using one or more of three approaches: developmental, psychological, and meaning-making approaches (Holliday et al., 2009; McCormack et al., 2022; McLeod et al., 2025). Developmental approaches are used to analyze the developmental level of a child by interpreting the sophistication of their drawing. Tools such as the Goodenough Draw a Man approach (Goodenough, 1926) and the Who Am I? (de Lemos and Doig, 1999) have been used to identify children's developmental level, giving children a score to indicate their ability in drawing body parts and facial features. Psychological analyses aim to find internal meanings in children's drawings and have often been used during art therapy and by psychologists and counsellors to determine emotions, attachment relationships, and even personality traits (Fury et al., 1997; Harrison, 2025). For example, a psychological approach was used to analyze drawings for children who had cancer where drawing was “used as a form of symbolic communication and at times [children] used drawing as a means to help ‘discover’ difficult issues in a ‘safe’ way” (Rollins, 2005: 212). Meaning-making approaches aim to consider children's perspectives through the construction of their thoughts, feelings, and experiences (Dockett and Perry, 2007; Holliday et al., 2009; McLeod et al., 2025). The importance of listening to a child's “voice” during their drawing as well as their explanation of their drawing is important when analyzing children's drawings in terms to ensure researcher interpretation is limited (Coates, 2002; MacDonald, 2009). Cox (2005) supports the use of children's descriptions when analyzing their drawings suggesting that “talk and drawing interact with each other as parallel and mutually transformative processes” (p. 123). When analyzing children's drawings, identification of focal points assists in listening to children's meanings in their drawings (Holliday et al., 2009; McCormack et al., 2022). Focal points are the points of interest in the drawings and include the “color, shape, direction of movement, placement, number of repeated objects, and missing items” (Furth, 2002: 35). Focal points identified in drawings of talking in the Sound Effects Study Drawing Protocol (McCormack et al., 2022) informed the current study (e.g. Body parts and facial expressions, Talking and listening, Relationships and connection).
Some children have difficulty with speech and language skills, and this can impact participation, friendships, education (including literacy and numeracy), and enjoyment of school (McCormack et al., 2011; McLeod et al., 2019). It is beneficial to understand and listen to children's perspectives and insights about talking and listening. While drawings may be an effective and appropriate means to respectfully listen to both typically developing children and those children with communication difficulties, no studies have been undertaken to determine whether children with SSD and children who have typically developing speech describe and create different drawings about their talking.
Aim
The aim of this study was to explore drawings and descriptions about talking with someone for 4- to 5-year-old children with SSD and a matched sample of typically speaking children. It was anticipated that the results from this study would enable a greater understanding of how children conceptualize their talking. Specifically, the aim was to determine whether children with SSD draw and describe their talking differently from children with typically developing speech.
Method
Ethical approval
Ethical approval was received from the Charles Sturt University Ethics in Human Research Committee (2007/211, 2007/212, 2011/181). Parental consent was gained before contact was made with a child, and child assent procedures were also followed. Confidentiality of each participant was ensured using code numbers and pseudonyms that allowed the researcher to include direct comments made by children during the investigation. Within the transcripts of the sessions, any identifying information was replaced with general terms (e.g. name of a friend in a drawing was replaced with “a friend” in the transcript).
Participants
Identification of participants
The participant pool consisted of 181 children (females = 65, males = 116) who participated in the Sound Effects Study (N = 157 primarily with SSD, McCormack et al., 2022) and the Talking about Talking Study (N = 24 primarily with typically developing speech, Wilkin, 2013). SSD and Typical participants were identified using percentage of consonants correct (PCC) scores from the Diagnostic Evaluation of Articulation and Phonology (DEAP, Dodd et al., 2002). Children were categorized as having moderate to severe SSD (DEAP standard score = 0–3; n = 97) or typical speech (DEAP standard score ≥ 7; n = 46). The 37 participants (25 males, 12 females) whose DEAP standard score fell within the mild to moderate range for PCC (standard score = 4–6) were excluded. Of the remaining participants, 143 created a drawing. Fourteen children did not draw a picture of themselves talking to someone (e.g. they drew a dog, spots, or a car) and were excluded from the potential participant sample, along with seven participants who drew a person but indicated they were not talking to someone in their drawing. The majority of these children who did not draw talking were from the SSD group (n = 19) and the absence of communication in these drawings may suggest discomfort or negative feelings about talking.
The remaining 122 participants were considered for creating matched pairs by sex and age (within two months), with speech skills (SSD versus Typical). The children's drawings and accompanying descriptions were not consulted when matching the participants. Thirty-nine pairs matched for age and sex were identified (19 females, 20 males). Forty-four participants (34 males, 10 females) were unable to be matched for sex and age (within two months) and were excluded.
Participant characteristics
Participants were 78 4- to 5-year-old Australian children comprising 39 matched pairs with one participant with SSD (DEAP standard score of 0–3) and one who had typically developing speech (DEAP standard score of ≥7). Children's average age was 54.3 months (SD = 3.7, range = 48–64 months), with 40 males (M = 54.4, SD = 3.8, range = 48–64 months) and 38 females (M = 54.0, SD = 3.6, range = 48–63 months). English was the first language of all participants. All participants scored within normal limits on the Oromusculature Sequenced Movements subtest of the DEAP (Dodd et al., 2002). Most (n = 74, 94.9%) participants with SSD and all of the typically developing participants scored within normal limits on the Oromusculature Diadochokenesis subtest of the DEAP (Dodd et al., 2002). Most (n = 65, 83.3%) participants’ hearing was screened using an audiometer with the pass level set at 40 dB at 1000, 2000, 4000 Hz to accommodate the background noise in the early childhood environment (McLeod et al., 2017). Hearing screening was passed by 16 (51.6%) children with SSD and 24 (70.6%) children with typical speech. Participants who did not pass the hearing screening test were referred for an audiological assessment, and the outcome of further hearing assessment was not available. None of the children had a cochlear implant or wore hearing aids.
Instruments
Speech assessment
The DEAP (Dodd et al., 2002) was administered by a speech-language pathologist (SLP) to assess the speech skills of the children. The 50-word Phonology subtest was used to assess children's production of English consonants and vowels enabling calculation of PCC to identify the two participant groups.
Sound Effects Study Drawing Protocol
The Sound Effects Study Drawing Protocol (McCormack et al., 2022) was used to provide a standard protocol for eliciting drawings from children. Participants were asked to “draw a picture of yourself talking to someone.” The protocol also included questions asked at the completion of the drawing. For example, “Who is in the drawing?,” “Do you usually like talking to this person?,” and “What are you saying/talking about?.”
Perspectives about talking instruments
Two self-report instruments were used to gain the participants’ perspectives about talking. The Communication and Attitude Test for Preschool and Kindergarten Children who Stutter (KiddyCAT, Vanryckeghem and Brutten, 2006) and the Speech Participation and Activity Assessment of Children (SPAA-C, McLeod, 2004). The KiddyCAT was originally designed for children who stutter; however, it has been used for children with SSD and typically developing children (Johannisson et al., 2009; McCormack et al., 2019). Administration of the KiddyCAT involved eliciting yes or no responses to a series of 12 questions regarding the participants’ perception of their speech, including: “Do words sometimes get stuck in your mouth?; Do you like to talk?; Are words hard for you to say?.” Responses to the 12 KiddyCAT were tallied to generate a score between 0 and 12: the higher the score, the more perceived difficulty the child expressed about their talking.
After the completion of their drawing participants were asked one question from the SPAA-C: “How do you feel about the way you talk?” and were asked to indicate one of five emoji responses:  happy, in the middle, sad, O another feeling, or? don’t know. While most children only indicated one response at the conclusion of the drawing task, five participants indicated more than one response. The researchers used the descriptions that accompanied the children's drawings to allocate one category for their response (i.e. if a child circled the and but stated “mostly I’m happy,” this would be categorized as happy).
Procedure
All children were given a child-friendly explanation of the research process before being asked to provide their assent to participate. Data collection took place within early childhood education settings, in a quiet room when possible. Most of the research (n = 157) was conducted by one SLP with the remainder (n = 24) being conducted by a team consisting of an SLP, student SLP, and education student. The second SLP was the reliability judge during assessments conducted by the first SLP. Data collection lasted between 1 and 1.5 h and consisted of a speech assessment using the DEAP (Dodd et al., 2002), the KiddyCAT (Vanryckeghem and Brutten, 2006), which was completed before the drawing task so that the participants were directed to think about their speech, the drawing task (McCormack et al., 2022), the SPAA-C question (McLeod, 2004), and other tasks including assessments of hearing, oromusculature, and language. For the drawing task, participants were provided with 10 Faber Castell colored markers, a white piece of A4 paper, and were asked to “draw yourself talking to someone.” During the drawing task the researcher did not engage in any discussion with the participants unless it was instigated by the child. While the participants drew their picture, the researcher drew a replica of the drawing, making notes on where the participants started, and the sequence in which they drew the picture. Once the drawings were complete, the researcher asked each participant a series of questions about their drawing (e.g. “Who is in the drawing?”; “How do you know this person (i.e. friend, brother etc)?”; “What are you/they doing?”; “What are you saying/talking about?”) and the SPAA-C question “How do you feel about the way you talk?.” The drawing process was audio/video recorded to ensure participants’ meanings of their drawings were captured. Recordings were played back after the assessment and transcribed verbatim. Transcripts were used during analysis so the participants’ intentions and meaning were less likely to be misinterpreted.
Reliability
The first author re-analyzed 10% of the drawings by children with SSD (n = 8). Inter-judge reliability on 376 data points was 90.2%. Intra-judge reliability was undertaken by the first author to ensure reliability 10 months later to ensure consistency. Intra-judge reliability on 376 data points was 92.2%.
Data analysis
KiddyCAT and SPAA-C
Responses on the child self-report measures, KiddyCAT and SPAA-C, were analyzed using t-test and chi-square to compare perceptions of talking for participants identified in the SSD and Typical groups.
Who Am I?
The developmental level of participants’ drawings was assessed using the Who Am I? (WAI, de Lemos and Doig, 1999) which was originally developed for Australian preschool-aged children's drawings. The WAI? applied a 4-point score from immature/scribble (1) to realistic/in correct proportions (4) drawing. All of the drawings were independently scored by a qualified teacher who had undertaken reliability training in scoring the WAI. Comparisons were undertaken using t-test and chi-square analysis.
Focal Points
The participants’ drawings and transcripts of their description of the drawing, responses to the questions, and the notes and replica drawing made by the researcher, were considered in relation to focal points relating to children's drawing of talking. Specifically, the six focal points described by Holliday et al. (2009): “facial expressions, accentuation of body features, portrayal of talking/listening, colours used, conversational partners, and sense of self” (p. 258) and the adaptation of the six focal points described by McCormack et al. (2022): “body parts and facial expressions, talking and listening, relationships and connection, positivity, negativity, and no talking” (p. 713). In the current research, further adaptation of the six focal points related to how children draw and describe their talking were identified: (a) body parts; (b) facial expressions; (c) talking and listening; relationships and connections described by (d) number of people in drawings; (e) conversational partner/s; and (f) sense of self. Body parts referred to accentuated or out-of-proportion body features (Furth, 2002), such as the mouth and the ears that are crucial in communication. Facial expression captured children's feelings about talking, and a 0/1 score was coded for: happy face, sad face, and other face (e.g. described by participants as “grumpy,” “crazy,” “mad,” etc.). It was possible for children's drawings to receive more than one score as one figure's expression could be happy, while another sad. Talking and listening was indicated by sound waves, speech bubbles or written words to portray a conversation (cf. McLeod et al., 2025), and by the positioning of conversational partners (e.g. leaning towards one another). Relationships and connections was coded by the number of people in the drawing (including the child) and the conversational partner/s (e.g. mother, father, friend) named by the child. Sense of self was coded for the image of the child, giving consideration to size differentiation and detail (Furth, 2002). For example, a drawing of the self that is much smaller and with less detail than others may indicate a diminished sense of self (Furth, 2002).
Results
Perceptions of talking
KiddyCAT (Vanryckeghem and Brutten, 2006)
There were 77 valid participants who completed the KiddyCAT. On average, participants with SSD had higher mean scores (M = 3.39, SD = 2.15) than participants with typically developing speech (M = 2.31, SD = 2.37) t(77) = 2.10, p = 0.04. A higher mean score indicated a greater perception of difficulty with talking. While the majority of participants (SSD n = 22, 57.9%; Typical n = 33, 84.6%) reported having no/little difficulty talking, a number of participants identified themselves having some difficulty talking (SSD n = 13, 34.2%; Typical n = 4, 10.3%), and frequent difficulty (SSD n = 3, 7.9%; Typical n = 1, 2.6%). Chi-square analysis showed there was a significant difference in the distributions for the two groups (p < 0.05) (see Table 1). Children with SSD were more likely to rate themselves as having difficulty talking than typically developing children.
KiddyCAT (Vanryckeghem and Brutten, 2006) and SPAA-C (McLeod, 2004) scores for participants with speech sound disorder (SSD) (n = 38) and participants with typically developing speech (n = 39).
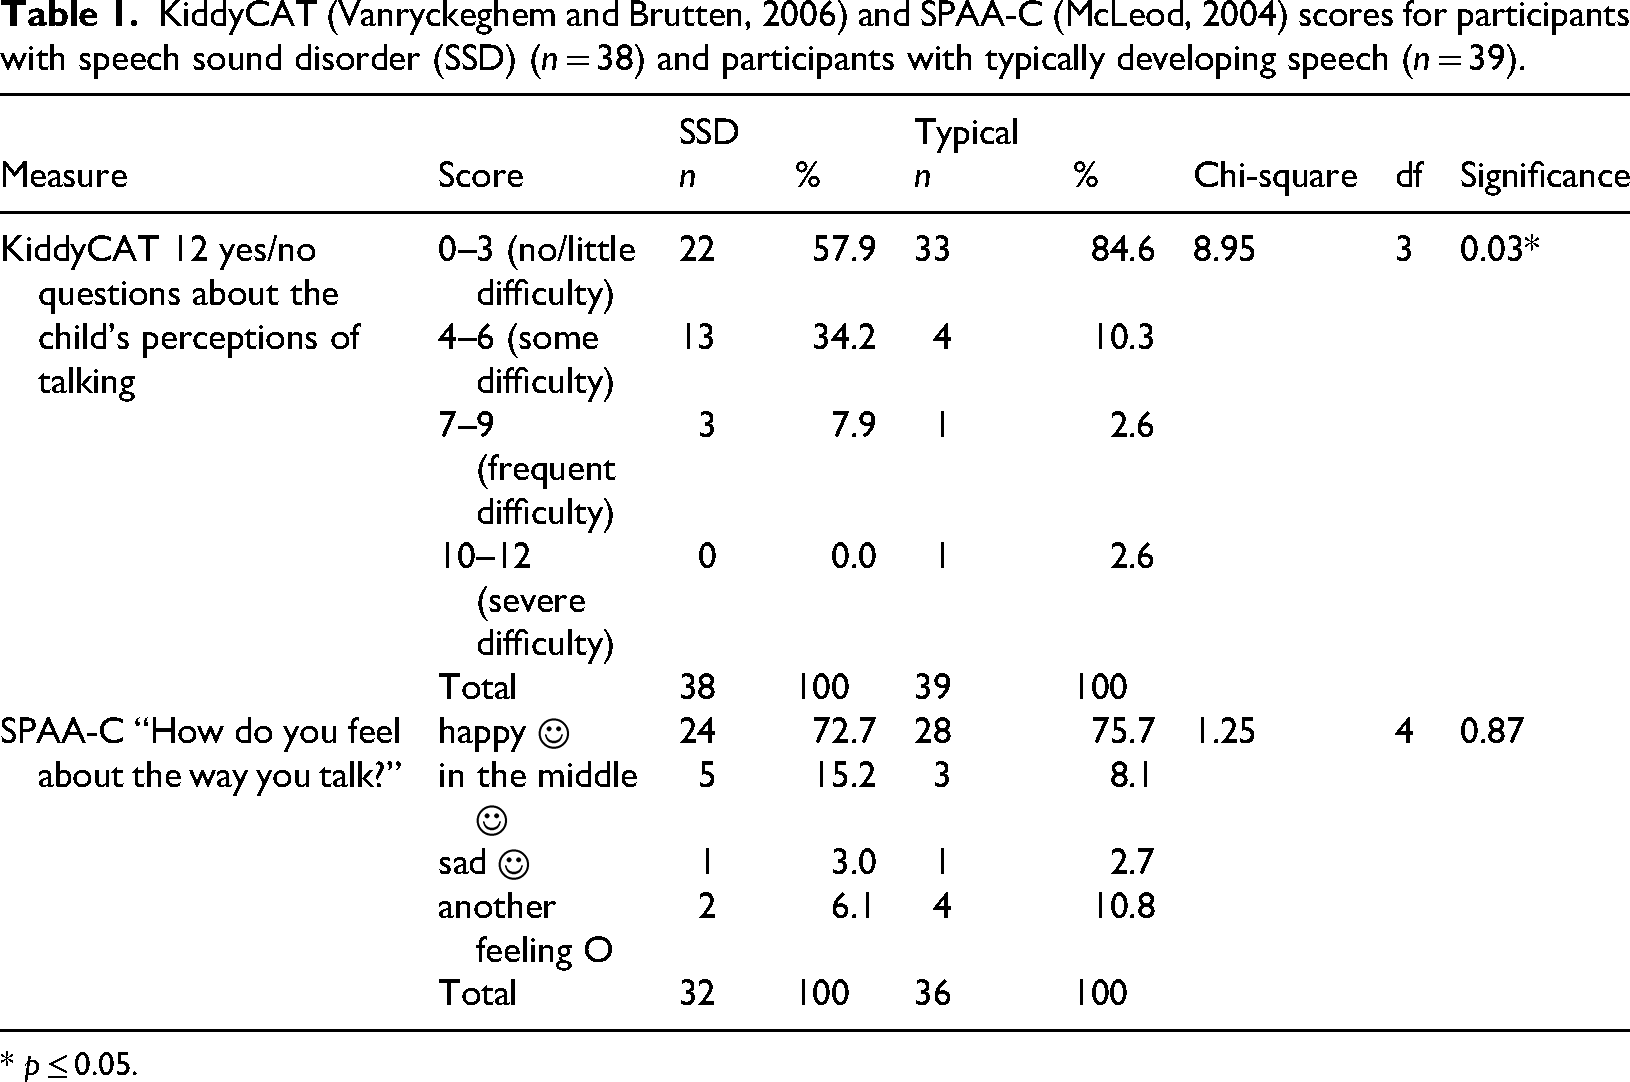
* p ≤ 0.05.
Speech Participation and Activity Assessment of Children, SPAA-C (McLeod, 2004)
Of 70 valid responses to the SPAA-C questions about their drawing, the majority of participants in both groups (SSD n = 24, 72.7%; Typical n = 28, 75.7%) were happy about their talking, with a small proportion who felt in the middle (SSD n = 5, 15.2%; Typical n = 3, 8.1%), or sad about their talking (SSD n = 1, 3.0%; Typical n = 1, 2.7%). Some participants reported another feeling (e.g. grumpy, mad, silly) (SSD n = 2, 6.1%; Typical n = 4, 10.8%). Chi-square analysis showed no difference in the distribution for the two groups (see Table 1).
Developmental analysis of the drawings (WAI?)
Results for the WAI? (de Lemos and Doig, 1999) overall score showed that the Typical group had a slightly higher average score (M = 2.5, SD = 0.5) than the SSD group (M = 1.9, SD = 0.6) and this difference was approaching significance, t(78) = −1.83, p = 0.07. Results presented in Table 2 showed that, for both groups, the majority of drawings (SSD n = 25, 64.1%; Typical n = 31, 79.5%) received a score of 2 (person incompletely drawn), which is a typical score for children between the ages of 4–5 years (de Lemos and Doig, 1999). More participants with SSD (n = 8, 20.5%) achieved a score of 1 than participants with typically developing speech (n = 1, 2.6%), while six participants (15.4%) in both groups received a score of 3, and 1 (2.6%) typically speaking participant obtained a score of 4. Chi-square analysis showed no significant difference in the distribution for the two groups.
Comparisons between developmental scores given to the drawings by participants with speech sound disorder (SSD) (n = 39) and participants with typically developing speech (n = 39).
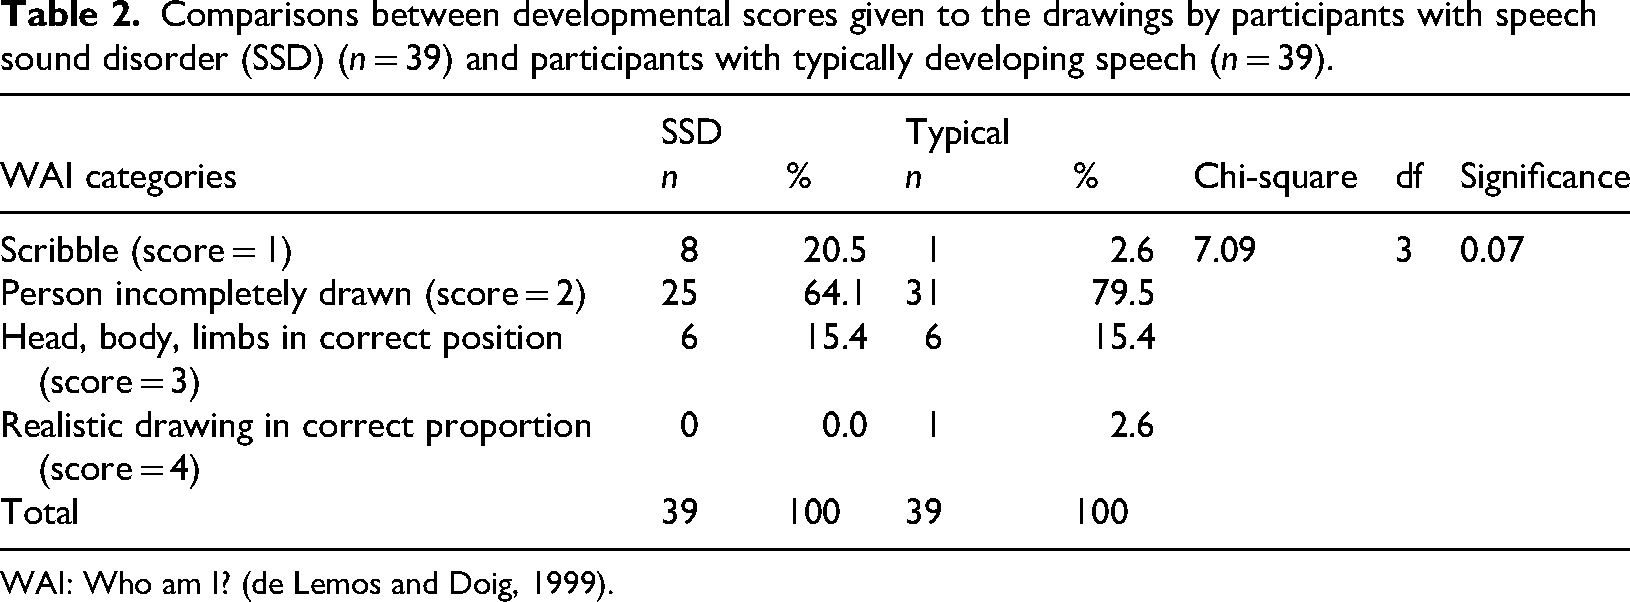
WAI: Who am I? (de Lemos and Doig, 1999).
Drawings of talking
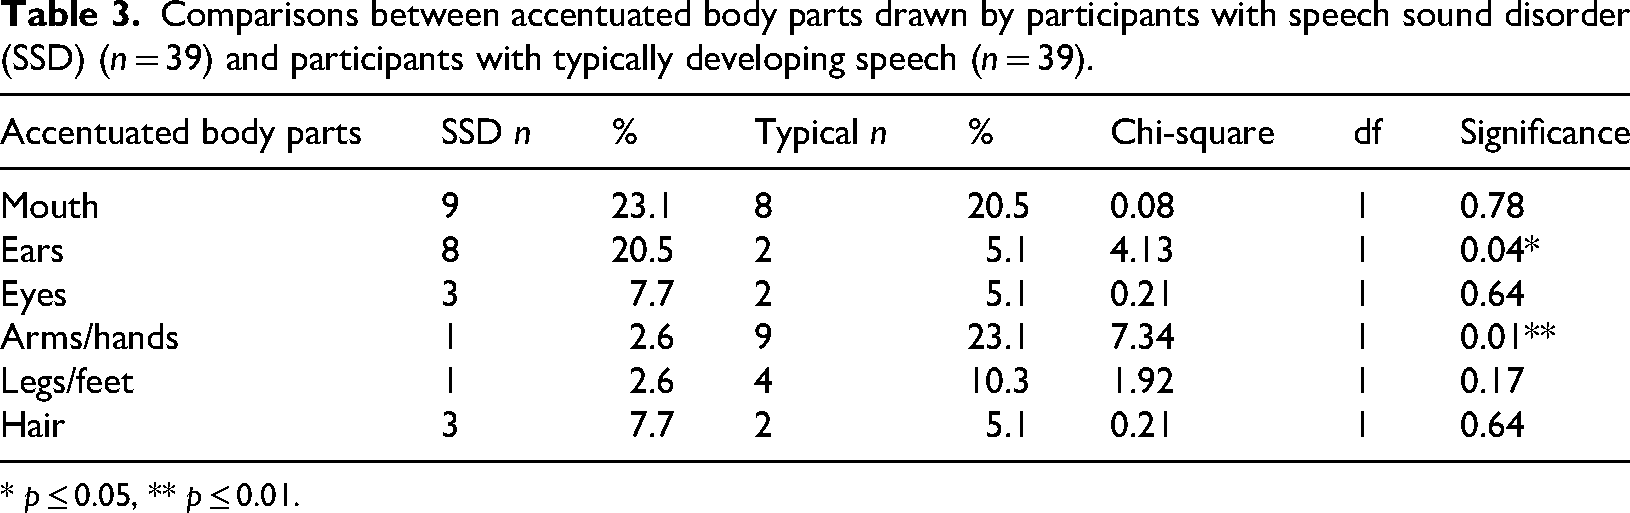
The children conveyed talking in a variety of ways. Children demonstrated their understanding of talking as requiring more than one person, with most children drawing two or more conversational partners in their picture. The participants described “talking” in their drawings in various ways including: “telling” someone something (e.g. “secrets”), “asking” (e.g. buying presents), “listening” (e.g. “so we can listen”) and “chatting” about a variety of topics such as “a big magical computer,” “a pony,” “summer and winter,” “the city,” or “nothing in particular.” While most of the children were satisfied with their completed drawings, several children continued to make changes and additions to their drawings (cf. Wright, 2010). For example, Figure 1 shows the drawing completed by Oscar, who had drawn two circles to represent faces each with two eyes and a smile. He was about to begin answering the researcher's questions when he laughed and said “Oh! I forgot the voice! I might put a little bit on top so that they know the mouth's open.” Oscar then picked up a marker and drew the orange lines on the top of the mouths, so they looked open. Children illustrated talking through the closeness or proximity of the figures in their drawings, accentuated body features associated with talking, such as mouths, ears, and some children included sound waves in their drawings (Figure 2). Some children described talking as an adult activity; for example, talking about “business” or “having a coffee.” Participants drew talking as part of physical activities; for example, “playing outside…whirling in my new hula hoop,” “playing with friends,” “climbing trees,” “running around at soccer,” and “roller-skating.”
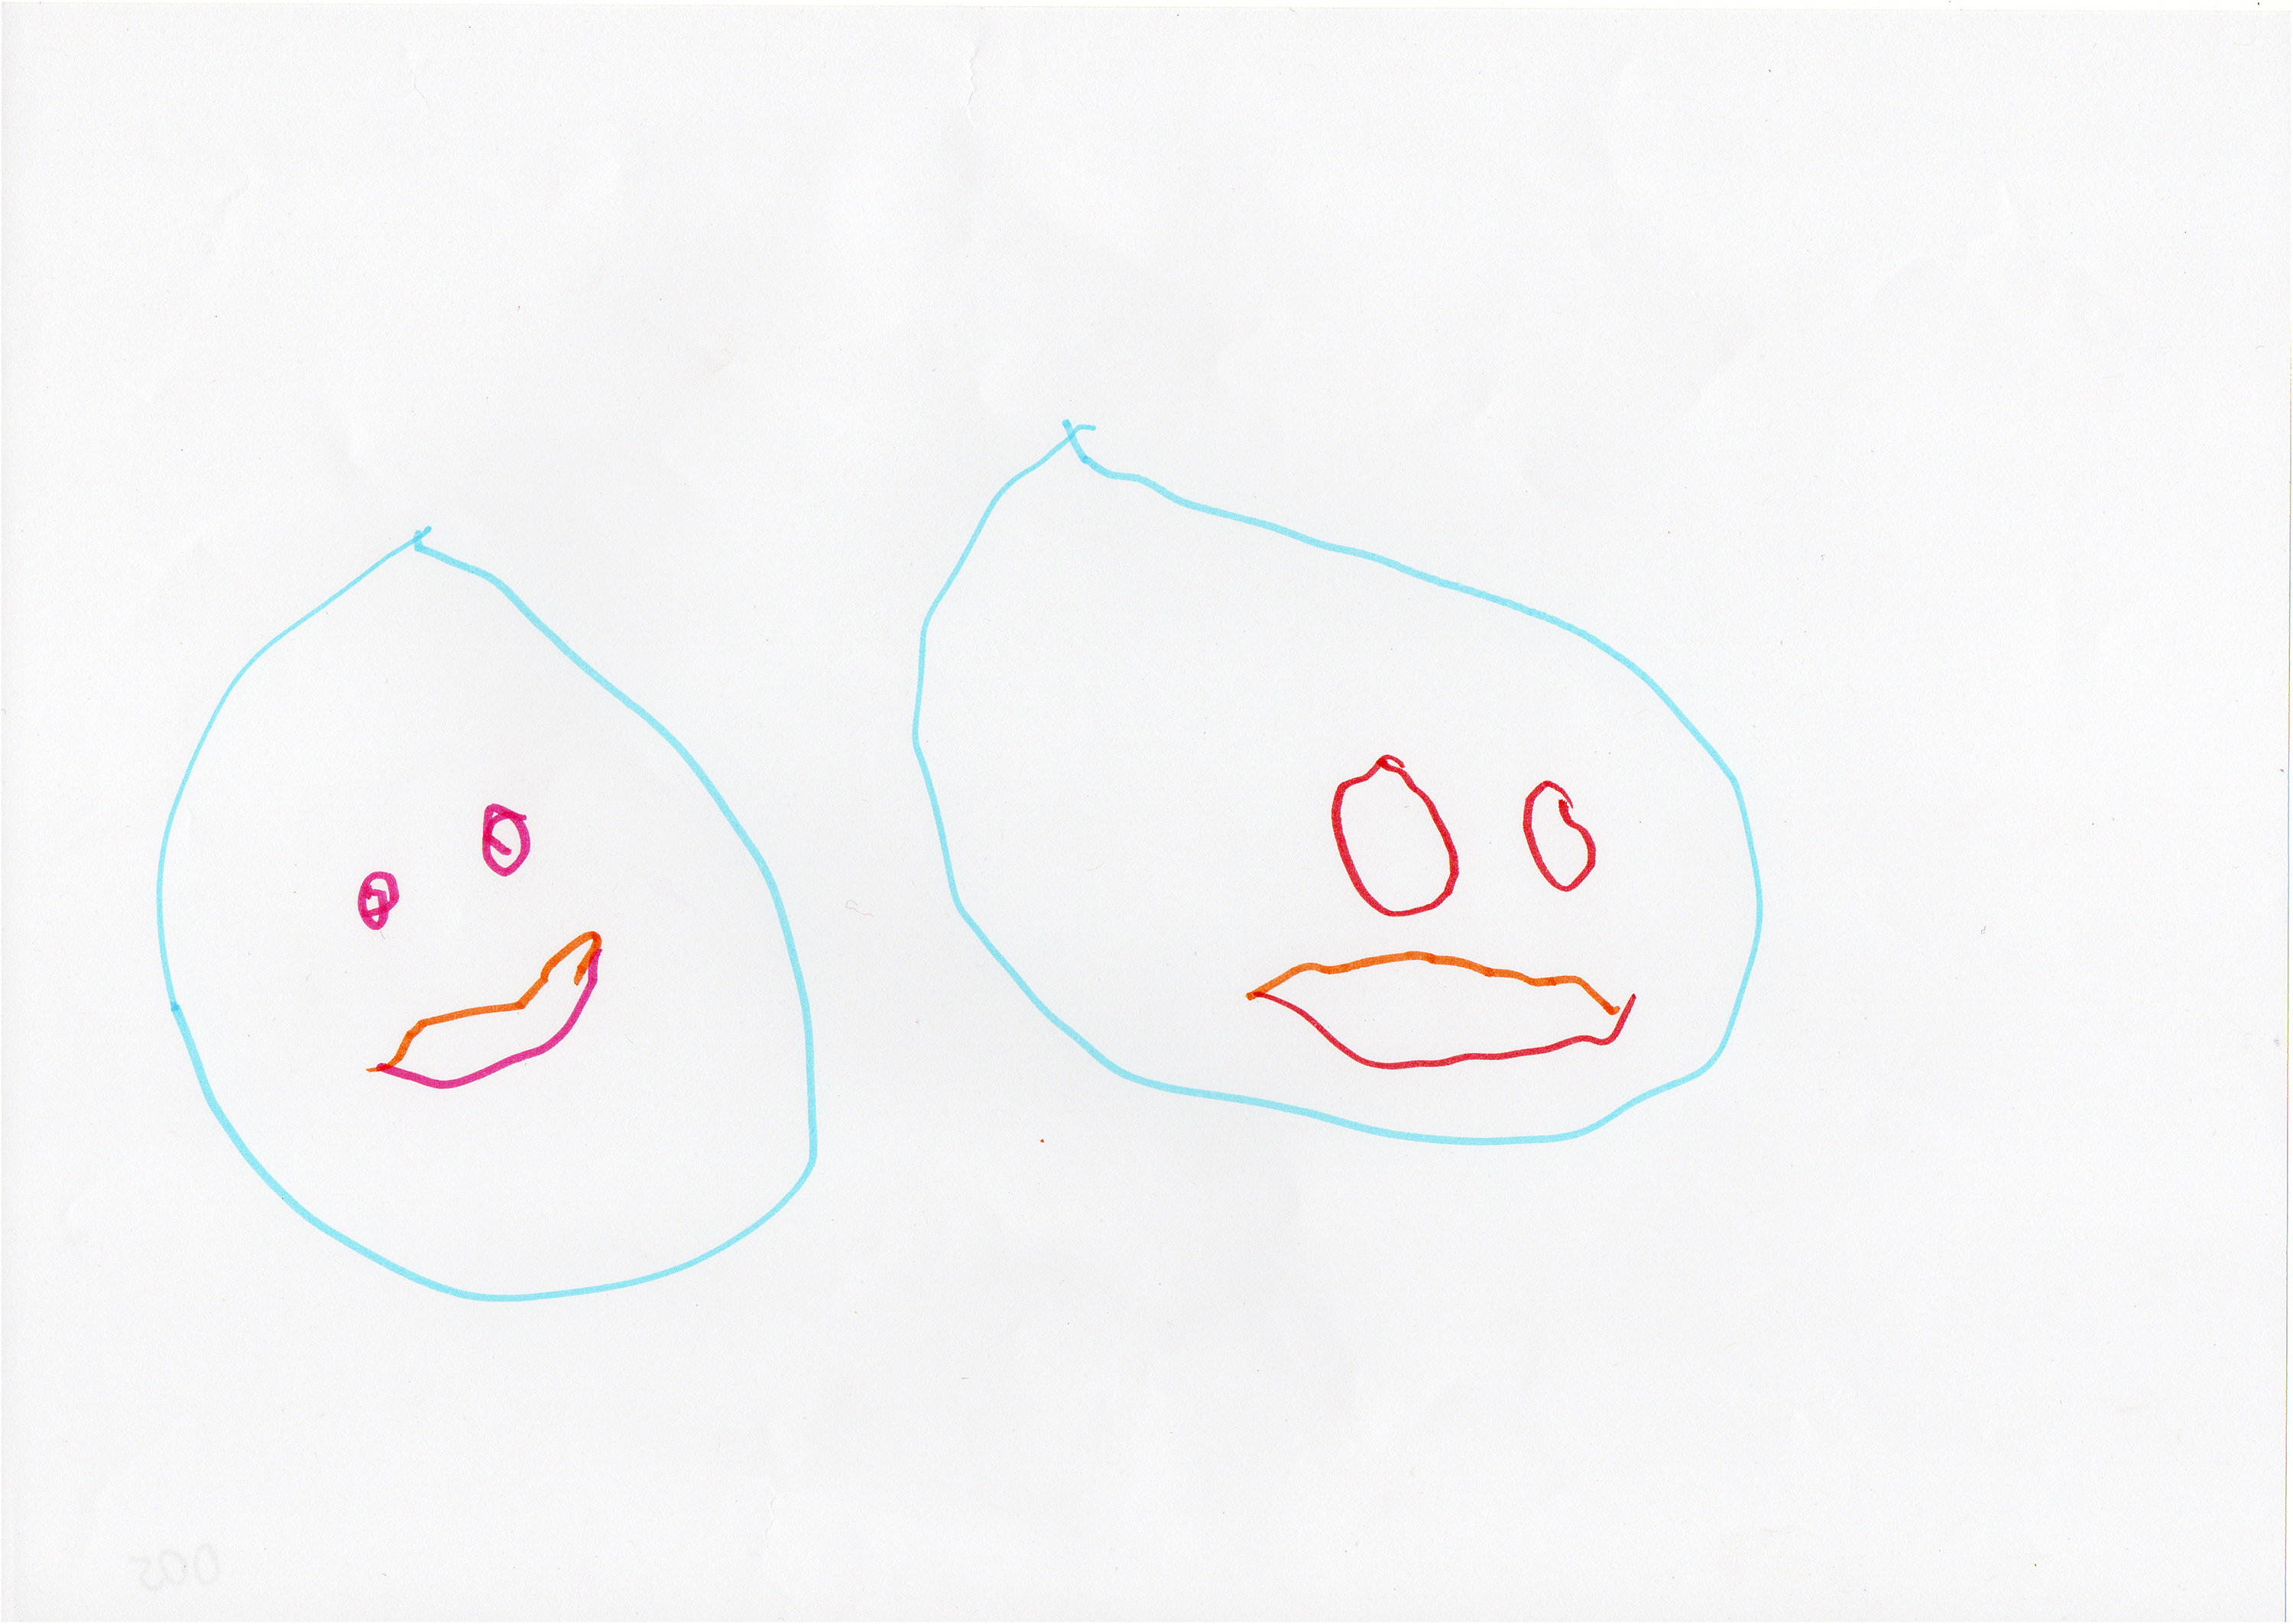
Oscar (Typical 4;7), on left, talking about going down a slide. After completing his drawing he said, “Oh! I forgot the voice! I might put a little bit on top so that they know the mouth's open” then drew the top of the lips in orange. © Permission to reproduce drawings is provided by Sharynne McLeod (2025).
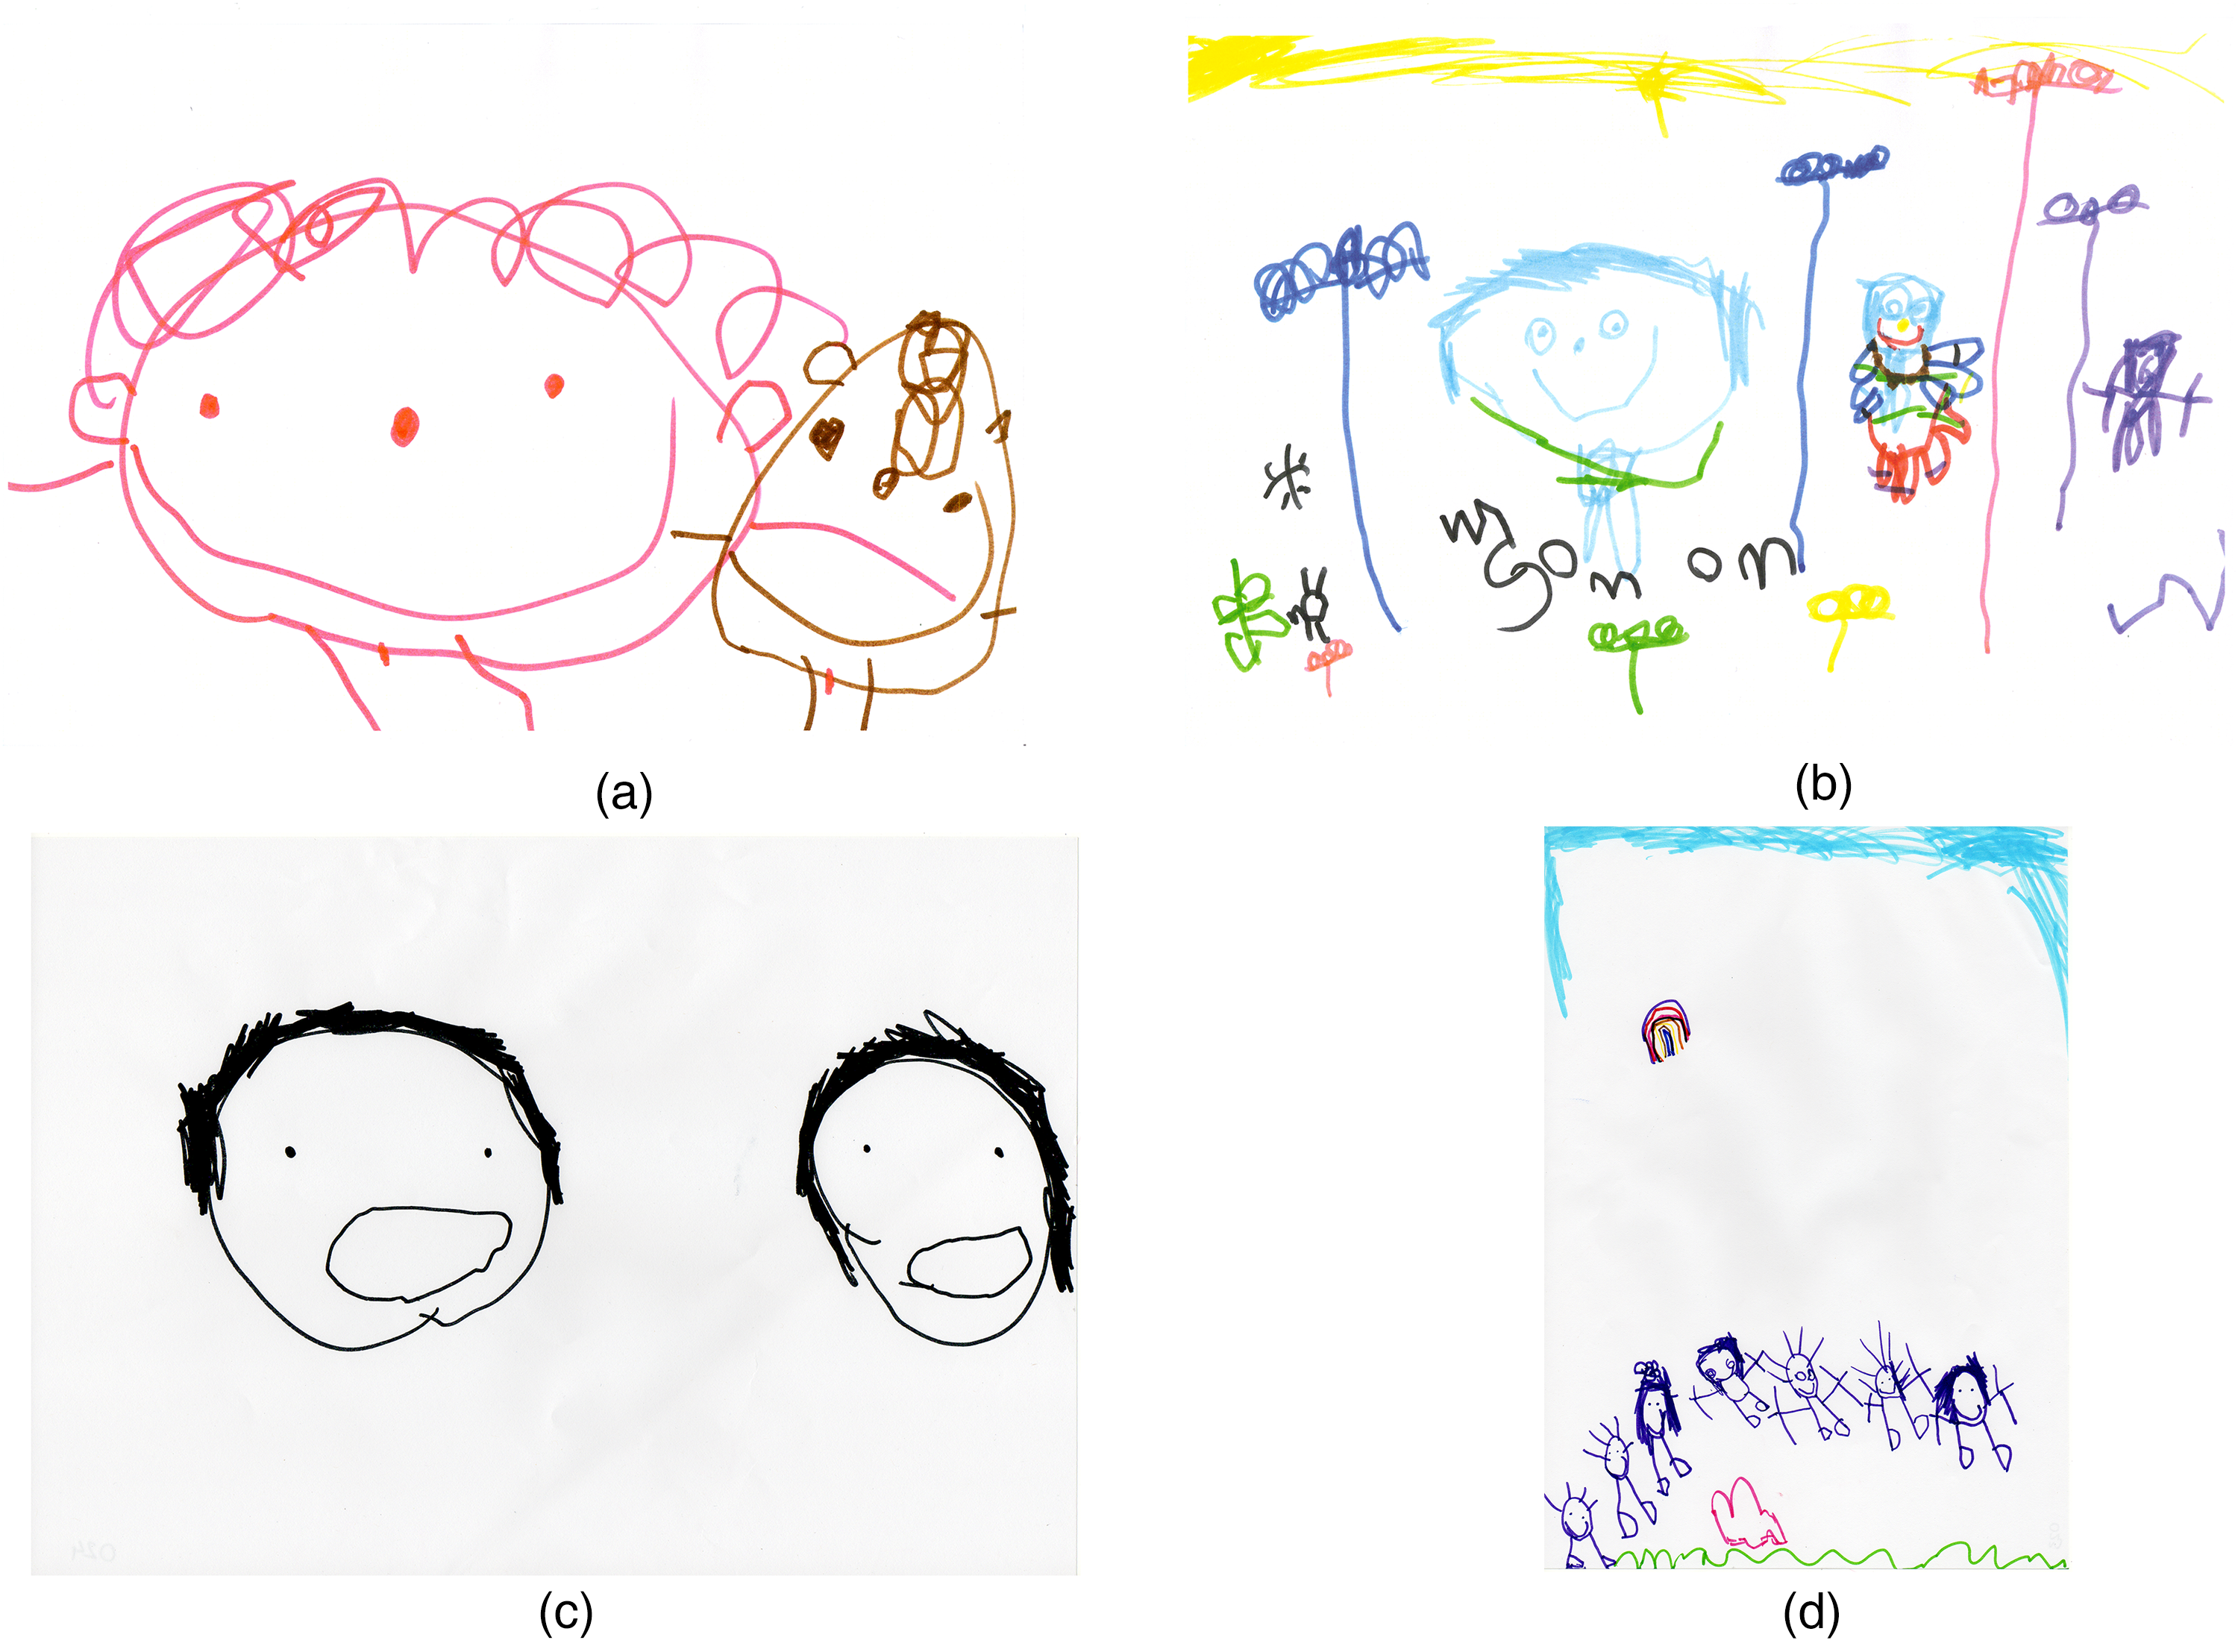
Examples of participants’ drawings of (a) listening, (b) chatting, (c) telling, and (d) asking. (a) Listening: Nadia (SSD 4;5) on left with her friend “[I need to] draw some ears on us so we can listen to what we’re saying.” (b) Chatting: Tessa (SSD 4;3) on left with the speech-language pathologist chatting about “nothing in particular.” (c) Telling: Louise (Typical 4;7) on left with her sister saying “Well… I tell her my secrets.” (d) Asking: Emma (Typical 4;4) third from left with her whole family saying, “I’m talking about… ‘what should we get for Dad?’.”
Focal point analysis of the drawings
Participants’ drawings were coded for six categories of focal points.
Body parts
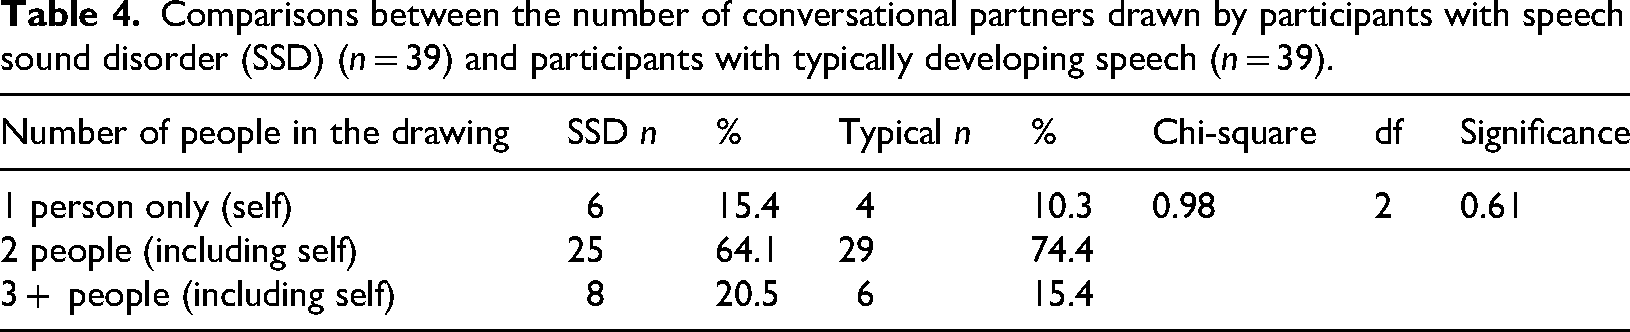
The body parts accentuated in the drawings are summarized in Table 3. Most of the body parts were accentuated by a similar number of participants in each group; for example, mouths (SSD n = 9, 23.1%; Typical n = 8, 20.5%), eyes (SSD n = 3, 7.7%; Typical n = 2, 5.1%), legs/feet (SSD n = 1, 2.6%; Typical n = 4, 10.3%), and hair (SSD n = 3, 7.7%; Typical n = 2, 5.1%). However, results showed a significant difference between the SSD and Typical groups for ears and arms/hands. Ears were accentuated by 8 (20.5%) participants with SSD, while only 2 (5.1%) participants with typical speech (χ2 = 4.13, p < 0.05) (Figure 3(a)). Arms/hands were emphasized by only 1 (2.6%) participant with SSD, compared to 9 (23.1%) participants with typical speech accentuated arms/hands (χ2 = 7.34, p < 0.01) (Figure 3(b)).
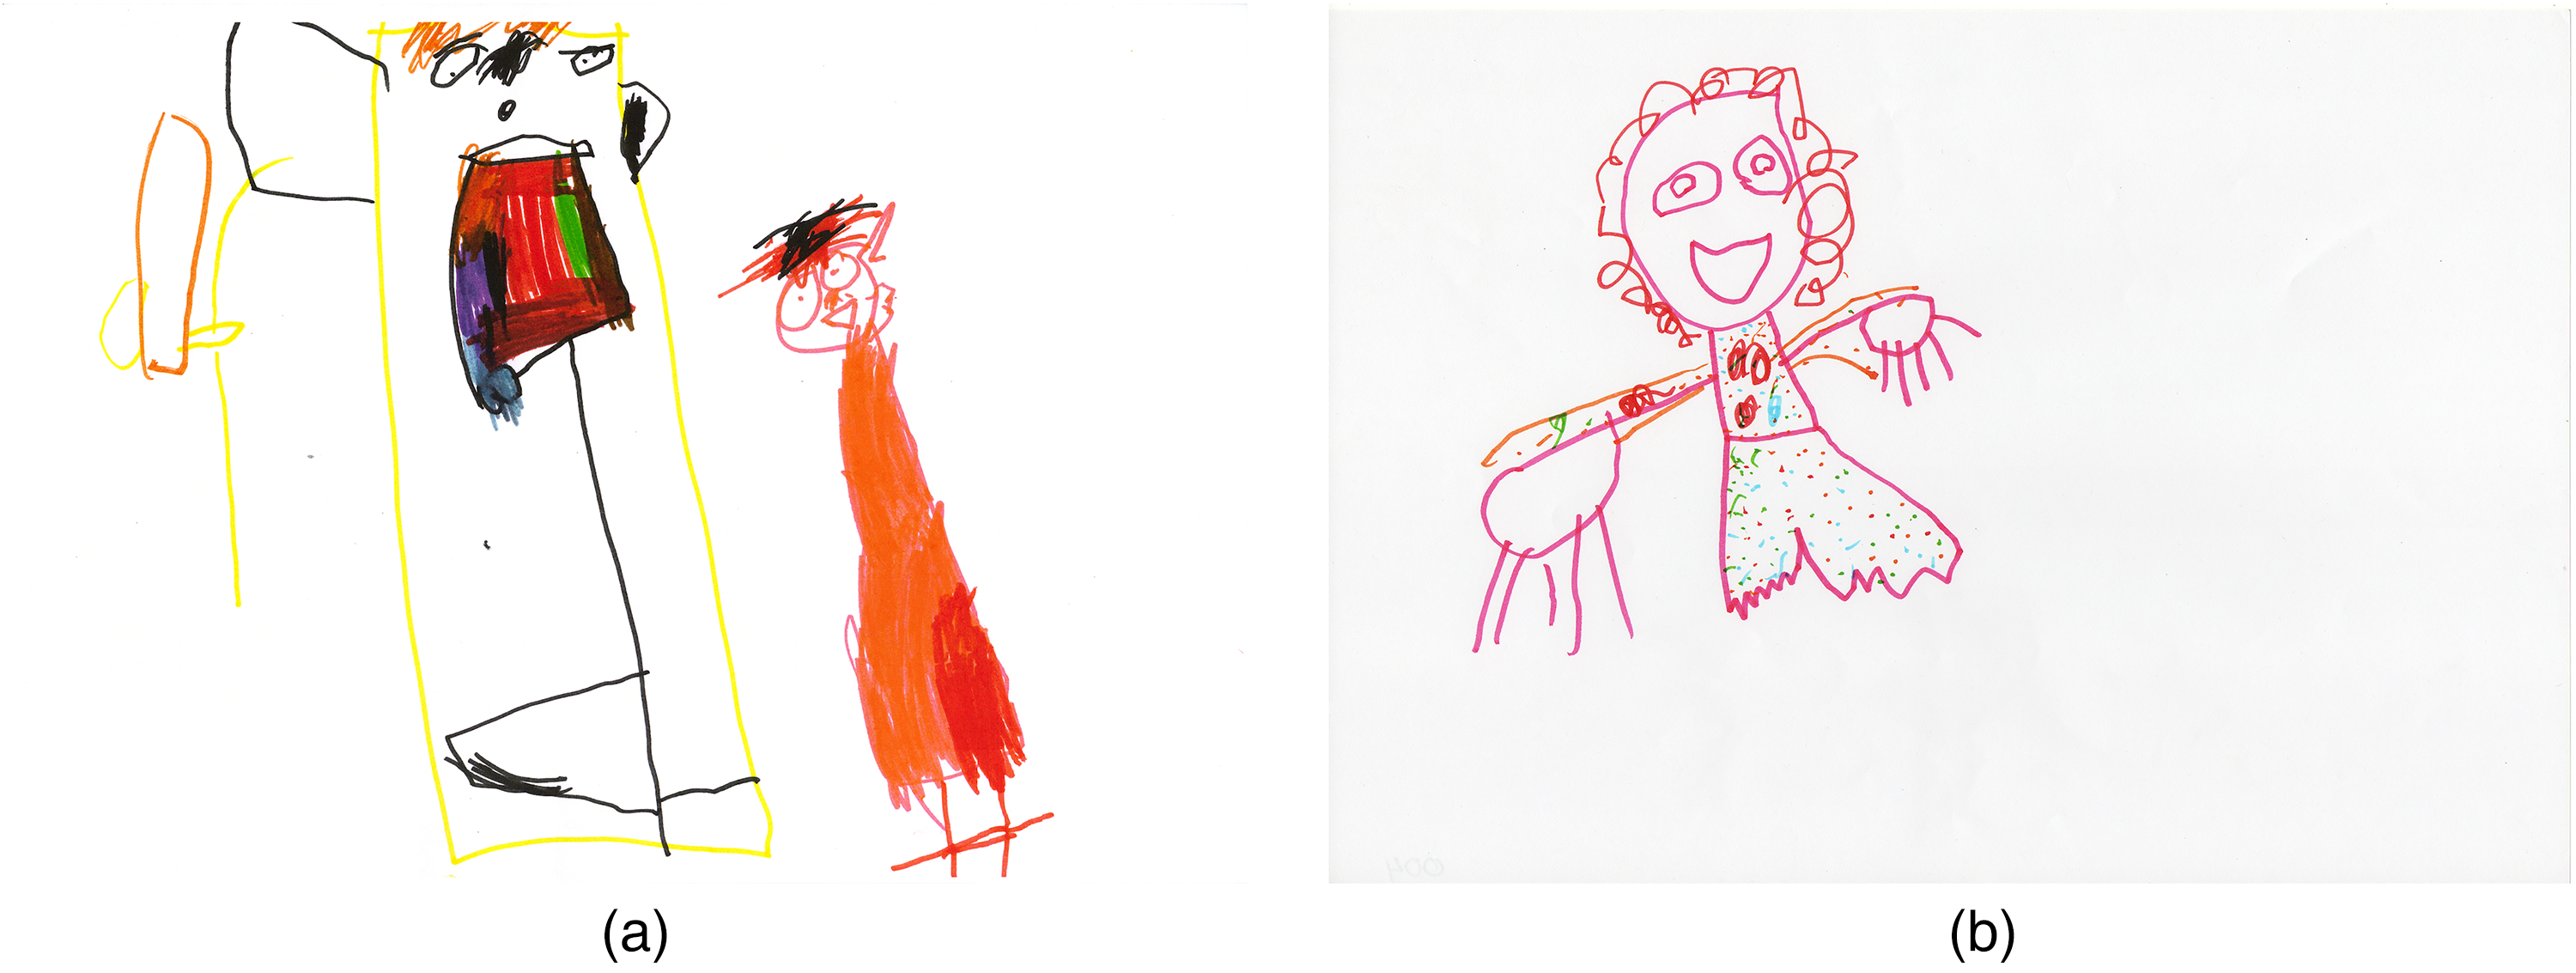
Examples of participants’ drawings that accentuated body parts: (a) Candice (SSD 4;2) on right depicting accentuated ears on her conversational partner, and (b) Amanda (Typical, 4;8) depicting accentuated arms/hands. © Permission to reproduce drawings is provided by Sharynne McLeod (2025).
Comparisons between accentuated body parts drawn by participants with speech sound disorder (SSD) (n = 39) and participants with typically developing speech (n = 39).
* p ≤ 0.05, ** p ≤ 0.01.
Facial expressions
Of the 57 valid drawings that could be coded in this category, participants in both groups were more likely to draw happy facial expressions (SSD n = 21, 53.8%; Typical n = 25, 64.1%), than sad facial expressions (SSD n = 3, 7.7%; Typical n = 1, 2.6%), or other facial expressions (SSD n = 2, 5.1%; Typical n = 5, 12.8%). There were no significant differences between the two groups on a chi-square test.
Talking and listening
Some participants portrayed talking and listening using sound waves (SSD n = 1, 2.6%; Typical n = 2, 5.1%) while 1 (2.6%) child with SSD used speech bubbles and words. Some participants portrayed talking and listening demonstrating close proximity of the people in the drawing (SSD n = 6, 15.4%; Typical n = 10, 25.6%). There were no significant differences between the two groups on a chi-square test.
Relationships and connection: number of people
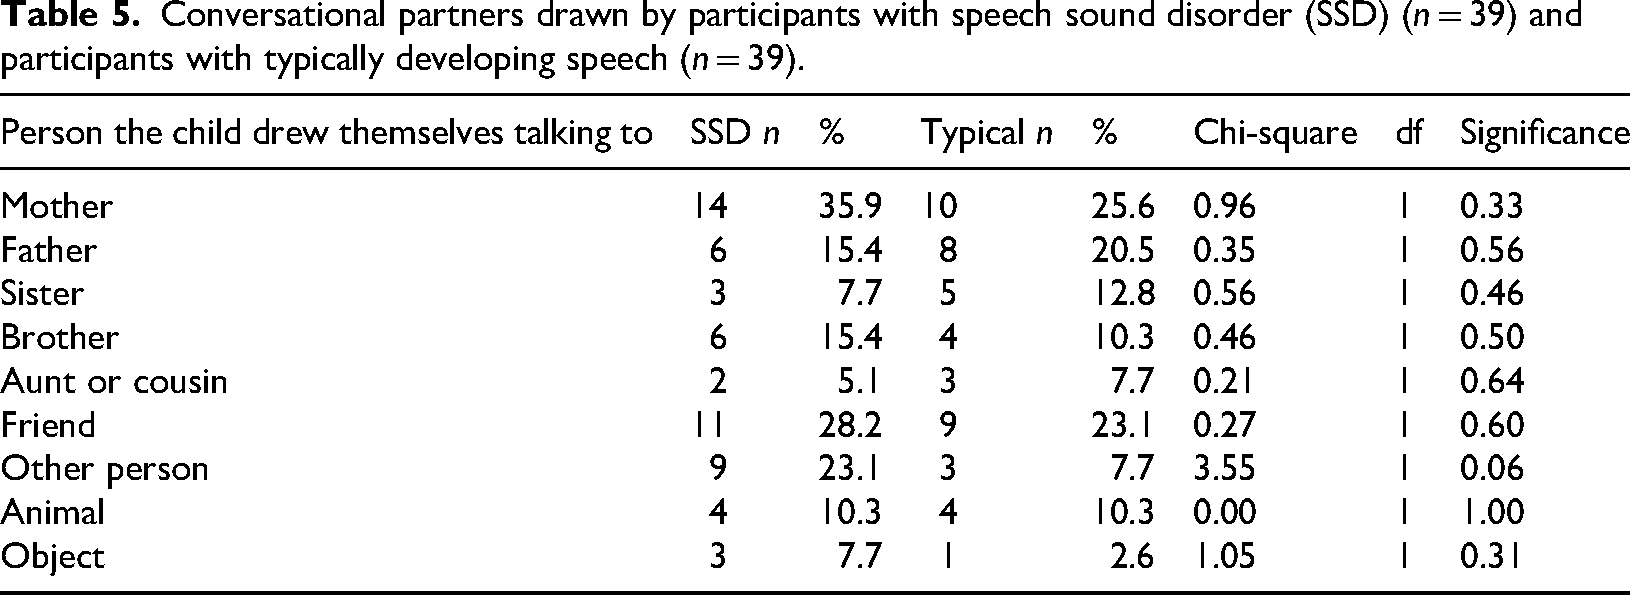
The number of people included in each drawing were counted. On average, a similar number of people were drawn by participants with SSD (M = 2.90, SD = .759) and those with typically developing speech (M = 2.95, SD = .912), with no significant difference between the two groups t(78) = −.270. The majority of the group fell in the category of “two people (including self),” with 25 (64.1%) children with SSD and 29 (74.4%) children with typical speech drawing a picture of themselves and one other person. There were no significant differences between the two groups on a chi-square test for the number of people drawn (Table 4).
Comparisons between the number of conversational partners drawn by participants with speech sound disorder (SSD) (n = 39) and participants with typically developing speech (n = 39).
Relationships and connection: conversational partners
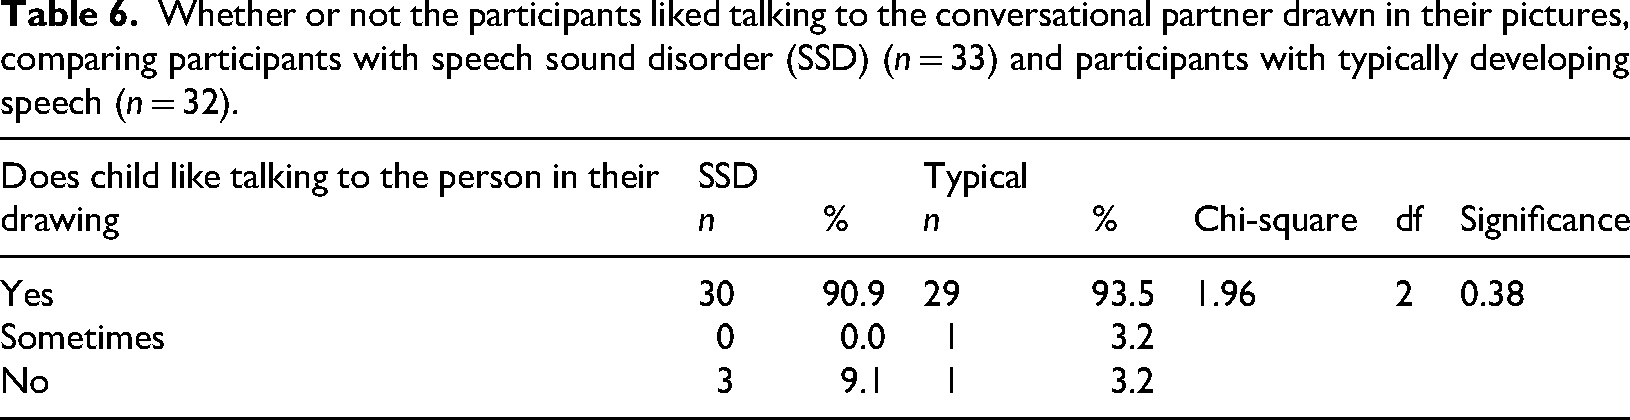
The participants drew themselves talking with a variety of conversational partners (Table 5). The most common conversational partner for both groups was their mother (SSD n = 10, 25.6%; Typical n = 14, 35.9%), followed by friend/s (SSD n = 9, 23.1%; Typical n = 11, 28.2%). At the conclusion of the drawing task, the participants were asked if they liked talking to the person/s in their drawing, on a 3-point scale (yes, sometimes, no) (Table 6). From 64 valid responses to this question, the majority of participants indicated that yes they did like talking to the person/s (SSD n = 30, 90.9%; Typical n = 29, 93.5%). Only four children gave a no response (SSD n = 3, 9.1%; Typical n = 1, 3.1%). Results presented in Table 6 showed there were no significant differences in the distribution of responses for the two groups.
Conversational partners drawn by participants with speech sound disorder (SSD) (n = 39) and participants with typically developing speech (n = 39).
Whether or not the participants liked talking to the conversational partner drawn in their pictures, comparing participants with speech sound disorder (SSD) (n = 33) and participants with typically developing speech (n = 32).
Sense of self
From 58 valid drawings most participants from the sample (SSD n = 16, 41.0%; Typical n = 17, 43.6%) drew themselves the same size as their conversational partner. A higher number of participants with typically developing speech (n = 20, 62.5%) drew images which conveyed a positive sense of self, compared to participants with SSD (n = 14, 53.8%), who were more likely to present an unclear or neutral sense of self; however, there was no significant differences between the two groups on a chi-square test.
Discussion
The current study is unique as it is the only known study that has systematically compared perceptions of talking, through self-report, drawings of talking to someone, and explanations of preschool children with SSD and children with typically developing speech. Participants were 78 4- to 5-year-old children matched for age and sex and differentiated into two groups by whether they had SSD or typically developing speech, based on their percentage of consonants produced correctly on the DEAP (Dodd et al., 2002). The two groups of participants had different perceptions about how difficult it was to talk on the KiddyCAT, with the SSD group indicating that they had some difficulty talking (Table 1). When asked “How do you feel about the way you talk?” on the SPAA-C (McLeod, 2004), there was no significant difference between groups with most participants indicating that they felt happy (Table 1). Therefore, the two groups differed on clinical assessment (PCC) and self-perception of communication difficulty (cf. McCormack et al., 2019). Both participant groups could express talking through their drawings and their drawings were not significantly different in terms of developmental maturity, indicating that any differences between the two groups’ drawings could not be attributed to their drawing capacity.
Drawings and their descriptions were an “active, meaning-making experience” (Wright, 2010: 6) that allowed the participants to share details of their everyday lives. Overall, there were few significant differences between the drawings and explanations for the two groups. The two groups of participants’ drawings and explanations did not significantly differ regarding portrayal of facial expressions, talking and listening, or relationships and connection (number of people, conversational partners, sense of self). Participants drew a wide variety of conversational partners from family, friends, with the majority (SSD 90.9%; Typical 93.5%) indicating that they liked talking to the person in their drawing. Participants typically drew familiar people who understood them (cf. McLeod et al., 2013).
Participants in the SSD and Typical groups similarly accentuated most body parts (mouths, eyes, legs/feet, hair); however, the SSD group were more likely to accentuate ears and the Typical group were more likely to accentuate hands. The accentuation of body features aligns with Eisner's (2002) research that indicates that children will exaggerate features they deem the most important. Children with communication difficulties have emphasized “listening ears” in other studies (Dealtry and McFarland, 2024; McCormack et al., 2010; McLeod et al., 2006, 2013). For example, in a study of 13 children with SSD and 21 significant others (McCormack et al., 2010), some children described their communication partner's inability to “listen properly” rather than the intelligibility of their own message and children recommended strategies to “improve the listener's understanding” (p. 379) to reduce frustration. This insight may provide clues for why children with SSD were more likely to accentuate ears. There is less insight for why Typically developing participants were more likely to accentuate arms/hands than the SSD group. Further replication is required to provide empirical support for differences between groups’ accentuated ears and hands.
Implications
While drawings of talking with someone showed few differences between children with SSD and children with typically developing speech, this study provides support for the usefulness of children's drawings in research, clinical, and educational settings. The findings indicate that drawing cannot be used to differentiate children with SSD from typically developing children; however, educators and communication professionals can use children's drawings and their descriptions of these drawings to better understand how children conceptualize and represent communication and use these perspectives to inform their practice. Drawing offers children an alternative way to communicate their thoughts and feelings about talking. Drawing talking may provide children with SSD a way of conveying their perspectives to educators and SLPs without reliance on verbal communication. The findings that participants were happy about their talking suggest that children with SSD may be more positive about themselves and their communication than may be expected, possibly indicating that the adult view may differ from children's own perceptions (cf. McCormack et al., 2019).
Limitations and future directions
While the majority of findings from this research indicate little or no difference between the two groups of preschool-aged children, research using an older cohort or a larger sample size may find differing results. For example, other studies have reported that older children with SSD may feel frustrated about their speech (e.g. McLeod et al., 2006, 2013). Dockett and Perry (2007) suggest that when working with children, it is best to collect data over a longer period of time as children tend to draw what is important to them at that particular moment in their life. When analyzing content and descriptive measures in the participants’ drawings, it was difficult to determine the intent behind the choice of conversational partners. Several additional questions could be asked of the participants at the conclusion of the drawing task. “Do you like drawing?” (This question would contribute to literature regarding drawing as a natural and enjoyable means for children to share their perspectives and allowing comparisons to be drawn between groups), “Who do you enjoy talking to?” and “Who don’t you enjoy talking to?” (These questions would provide further information on participants’ choice of conversational partners in their drawings).
Summary and conclusions
Overall, this study found few significant differences between the drawings and explanations about talking created by children with SSD and children with typically developing speech. Taking into consideration the size of the participant sample (n = 78) and that the groups were matched for age, sex, and had similar drawing abilities, the findings suggest that drawings may not be used to differentiate perspectives of talking by children with SSD and typically developing children. However, the fact that few differences were found, indicates that drawing talking may be a valid tool to gain an insight into individual children's perspectives on communication, in particular for children with SSD who have difficulty communicating verbally. The resulting drawings showed the individualistic nature of drawing. By listening respectfully to the views of children through the means of drawing, adults can glean insights into the individual ideas of children at a particular point in their lives.
Footnotes
Acknowledgements
The authors acknowledge support with data collection and analysis by Jane McCormack, Elissa Shand, and Erin Holliday, and thank the teachers, parents, and children who facilitated and participated in the data collection.
Ethical approval and informed consent
Ethical approval was received from the Charles Sturt University Ethics in Human Research Committee (2007/211, 2007/212, 2011/181).
Funding
The author(s) received no financial support for the research, authorship, and/or publication of this article.
Declaration of conflicting interests
Hannah Deehan and Linda Harrison declared no potential conflicts of interest with respect to the research, authorship, and/or publication of this article. Sharynne McLeod is guest editor of the special issue, so the editors-in-chief managed the review process (blinded to the authors).
Data availability statement
Data are available from the authors on reasonable request.