
Abstract
In this study, we examined the effect of visual cues in a second language listening test on test takers’ viewing behaviours and their test performance. Fifty-seven learners of English in Korea took a video-based listening test, with their eye movements recorded, and 23 of them were interviewed individually after the test. The participants viewed the visual cues longer than the items in the multiple-choice questions. Looking at the correct answer choice was related to a higher test score, while looking at the speaker(s) in the video and the distractors of the test items to a lower test score. Viewing the PowerPoint slides showed mixed effects on test performance, depending on different eye-movement measures. Stimulated-recall interviews shed further light on the possible reasons for the different patterns of the participants’ eye movements. Overall, the participants held the positive view that the visual cues aided them in comprehending the aural input and in completing the listening tasks more successfully. We discuss these findings in relation to the authenticity of tasks and the construct relevance of video-based listening tests.
Keywords
Introduction
As digital technology continues to advance, people are becoming more and more accustomed to utilizing videos as a means of accessing and creating information. Videos have also been widely used in language classrooms as learning resources. Videos can facilitate and bring to life a “text of some complexity,” as the multimodal nature makes the moving image a “rich medium” (Goldstein & Driver, 2015, p. 19). Different types of visual cues, such as photographs, graphic organizers, and presentation materials, can be used as visual aids to effectively deliver knowledge and information (Wagner & Ockey, 2018). While video is now a prevalent learning resource in classrooms, its use in the language assessment field has remained tentative (Goodwin-Jones, 2007; Wagner, 2010). To date, the inclusion of visual cues in listening comprehension tests has been considered a means to improve the authenticity of listening tests (Field, 2008; Ginther, 2002). Although there has not been any consensus on whether multimodal input could disperse or direct test takers’ attention to specific content within the input (Guichon & McLornan, 2008), a number of researchers have called for including visuals in listening tests to better reflect real-world language learning tasks and provide a “more realistic replication of real-world listening” (Buck, 2001, p. 123).
In the past, it was not easy to include visual cues in listening tests due to technological barriers. With the advance of technology, however, the use of visuals, such as figures, tables, photographs, and online videos, has become a common teaching and learning practice in language classrooms today. A few second language (L2) tests (e.g., Test Of English as a Foreign Language iBT, International English Language Testing System, and Pearson Test of English-Academic) currently include visuals (still images or graphs) in their listening tests (Kwon, 2019; Yu, 2021). A number of researchers have investigated the effect of visuals in a listening test, mainly by examining the effects of speaker(s) or contextual information in the videos or still images. However, little is known regarding to what extent other types of visuals—such as figures, graphic organizers, and PowerPoint presentation (PPT) slides—that are presented in conjunction with the aural input affect listening comprehension (Suvorov, 2015; Suvorov & He, 2022; Wagner, 2007, 2010, 2013). It is important to understand what types of visuals test takers attend to and how they use visual cues to complete the listening tasks (Suvorov, 2018b). Most researchers have primarily focused on examining the impact of video stimuli per se, or the distinctions between content visuals and contextual visual cues, with the distinction, as viewed within the language testing literature, explained well by Suvorov (2009), who wrote and described that “context visuals provide information about the context of the verbal exchanges,” including the setting and background, while content visuals provide “important content of the verbal interaction” (p. 52), such as a photo displaying, and thus supplementing, the object of a conversation or talk.
Little attention has been given to what specific visual cues test takers view and process during video-mediated listening tests. Moreover, researchers of previous studies have not closely investigated the effect of visual cues in a wide range of listening situations. Most studies focused on testing English for Academic Purpose in the higher education context, which mainly included academic lectures (Cubilo & Winke, 2013; Suvorov, 2009, 2013, 2015). No study, to our knowledge, has examined the effect of viewing PPT slides in videos on test-taking processes or test performances. More research that investigates the effect of various visual cues, particularly those that are widely used in target language use domains, is much needed to better understand the construct of video-based listening tests (Goodwin-Jones, 2007; Suvorov & He, 2022; Tschirner, 2001; Wagner, 2010). The present study is innovative in that we aim to enhance language testers’ and our understanding of the cognitive processes that test takers engage in during video-mediated listening tests. We additionally aim to provide more specific guidance for the development of the next generation of video-based listening comprehension tests.
Literature review
Multimodality in listening comprehension and its effect on test performance
Most studies investigating the effects of visual cues compared test takers’ performance between audio-only and video-based listening test and yielded mixed results. These studies demonstrated that the presence of visuals in a listening test had either a facilitating effect (Cubilo & Winke, 2013; Karimi & Biria, 2014; Shin, 1998; Wagner, 2007, 2008, 2010, 2013; Wilberschied & Berman, 2004) or a debilitating effect on test taker’s test performance (Ginther, 2002; Li, 2013; Suvorov, 2008, 2009). A number of research also revealed that visuals had no significant influence on L2 test takers’ listening performance (Batty, 2015; Coniam, 2001; Gruba, 1993; Londe, 2009; Suvorov, 2013). It should be noted that the findings can be attributed to different variables, such as types of task prompts (dialogue vs lecture), the format of visual materials (still image vs video), and the proficiency of test takers. According to Suvorov and He’s (2022) recent methodological synthesis of research on visuals in L2 listening assessment, the dominant research domain of the 45 primary studies they investigated has explored the main effect of video (k = 40). Clearly, more research is needed that looks further into what specific visual cues L2 learners attend to, how learners use them to improve their listening performance, and how they perceive the helpfulness of such visual support.
Test-taking processes in video-mediated listening tests
In sum, there is an ongoing debate on whether visuals should be included in listening comprehension tests. Existing studies have shown inconsistent findings. While most of the studies reviewed above focused on identifying listening performance differences between audio-only and video conditions, little attention has been directed into specific aspects of the cognitive processes of test takers interacting with visual cues in video-mediated listening tests. There are a limited number of studies that have investigated the cognitive processes involved in video-based listening tests, and researchers of these studies have only focused on some particular features of video-based listening tests. For example, Suvorov (2015) looked at the difference between context and content visuals, and Cubilo and Winke (2013) examined the effect of note-taking in a video-based test.
Only a small number of studies have investigated test takers’ viewing behaviours and how they engaged with visual cues in a listening comprehension test (e.g., Lesnov, 2018; Ockey, 2007; Suvorov, 2018b; Wagner, 2007, 2008, 2010). Wagner (2007) used a video camera to record test takers’ attention to the screen and measured how much the test takers viewed the videos in the test. He found a positive relationship between test takers’ attitudes towards the use of video texts and the test takers’ viewing rate, and a negative relationship between viewing rate and test scores. However, Wagner did not identify to which particular visual cues test takers attended, nor did Wagner explicitly explore the underlying reasons for their viewing behaviours. Ockey (2007) used retrospective verbal protocols to ask test takers whether the videos and still images in the listening test were helpful or distracting to them. Ockey showed that L2 test takers engaged more with the video than the still images, but also warned that the inclusion of videos in a listening test has a risk of altering the construct of a test due to large individual variabilities. Wagner (2008) also used verbal report protocols to check whether test takers understood the listening input better with the help of the visual cues. He found that gestures, body language, and visual contextual information aided candidates in processing the listening texts successfully. However, questions remained as to why and how different types of visual cues exerted different effects on test takers’ listening performances. Through retrospective interviews with participants, Suvorov (2018b) asserted that test takers’ individual differences in viewing different visual cues should be considered as a construct-relevant variance. Lesnov (2018) found that listening items with content-related visual cues that were semantically congruent with the aural input were easier and favoured by test takers. To understand test takers’ test-taking processes more precisely, however, it is essential to examine how test takers view different types of visual cues at different points of time, as well as the rationales behind their viewing behaviours, using research methods (e.g., eye-tracking) that can better capture test-taking processes.
Eye-tracking studies on test takers’ viewing behaviours in a listening test
In recent studies, researchers have used eye-tracking methods to investigate test takers’ specific viewing behaviours during a listening test. Suvorov (2015) measured test takers’ viewing behaviours in a video-based, listening comprehension test to investigate the effect of content (semantically relevant) and context (setting and background; see Suvorov, 2009) visual cues on test takers’ listening comprehension. Suvorov (2015) revealed that speaker-related, contextual visual cues were less helpful than content visual cues in lecture videos. He claimed that further research is needed to examine the role of specific visual cues that are beyond the context–content distinctions. In this present study, we intend to look beyond such distinction because there are no pure content visuals without any contextual information and vice versa. Hence, more specific types of visual information, such as speaker-based or PPT slides in lecture videos, should be examined. Batty (2021) employed a similar approach and found that test takers spent most of the test time (81%) directly viewing the faces of the speakers, while the hands and body gestures or background setting received only a small amount of direct visual time. However, Batty had a small sample (n = 12), and only measured dwell time as a relative eye-movement measure, which may have restricted the study from being used to robustly examine the interactions between test takers and visual cues. Therefore, despite several recent attempts to examine test takers’ viewing behaviours, little is known about how different visual cues may affect test takers’ viewing behaviours and why.
In summary, it is evident that there are gaps in understanding what specific viewing behaviours are used by L2 test takers in video-based listening comprehension tests. We acknowledge that most existing studies have corroborated meaningful implications on the effect of video in listening tests, and several different approaches were made to fill the gaps recently. However, most of these works have not yet touched upon what specific visual cues test takers used (except Batty, 2021, albeit with a small sample size in the study), how they interacted with visual cues, and why they found a particular visual cue useful or not. Recently, Suvorov and He (2022) conducted a synthetic review to investigate the methodological characteristics of 45 studies on video-based listening tests and argued that a shift from “comparative product-oriented studies” to “process-oriented studies” to inquire more about test taker’s interactions with specific visual cues is urgently needed (p. 94). They also found that 20 of 45 studies included qualitative elements, and stressed that more of such work is needed.
Responding to the calls to examine whether visual cues in a listening test should be considered as part of the listening construct (Batty, 2015; Ockey, 2007; Suvorov, 2015; Suvorov & He, 2022; Wagner, 2008), we investigated how test takers attended to specific visual cues and item components (stem, key, and distractors) in a video-based, multiple-choice listening test, how the test takers’ viewing behaviours affected their test scores, and why. We aimed to reveal empirical evidence about which specific types of visual cues significantly affect candidates’ listening comprehension processes and performances, and how these may vary by different prompt types and the test takers’ levels of listening proficiency. For this, we formulated the following research questions:
Method
The present study follows one of the three core mixed-methods research designs: convergent design (Creswell & Creswell, 2022). We collected both quantitative and qualitative data concurrently and analysed them separately. We then merged the findings from the quantitative and qualitative data by comparing and relating them, with an aim to achieve a more comprehensive understanding and an overall interpretation of the findings (Creswell & Creswell, 2022). Integration in this convergent-design, mixed-method study allowed us to gain a more complete understanding of the findings to answer each research question.
Participants
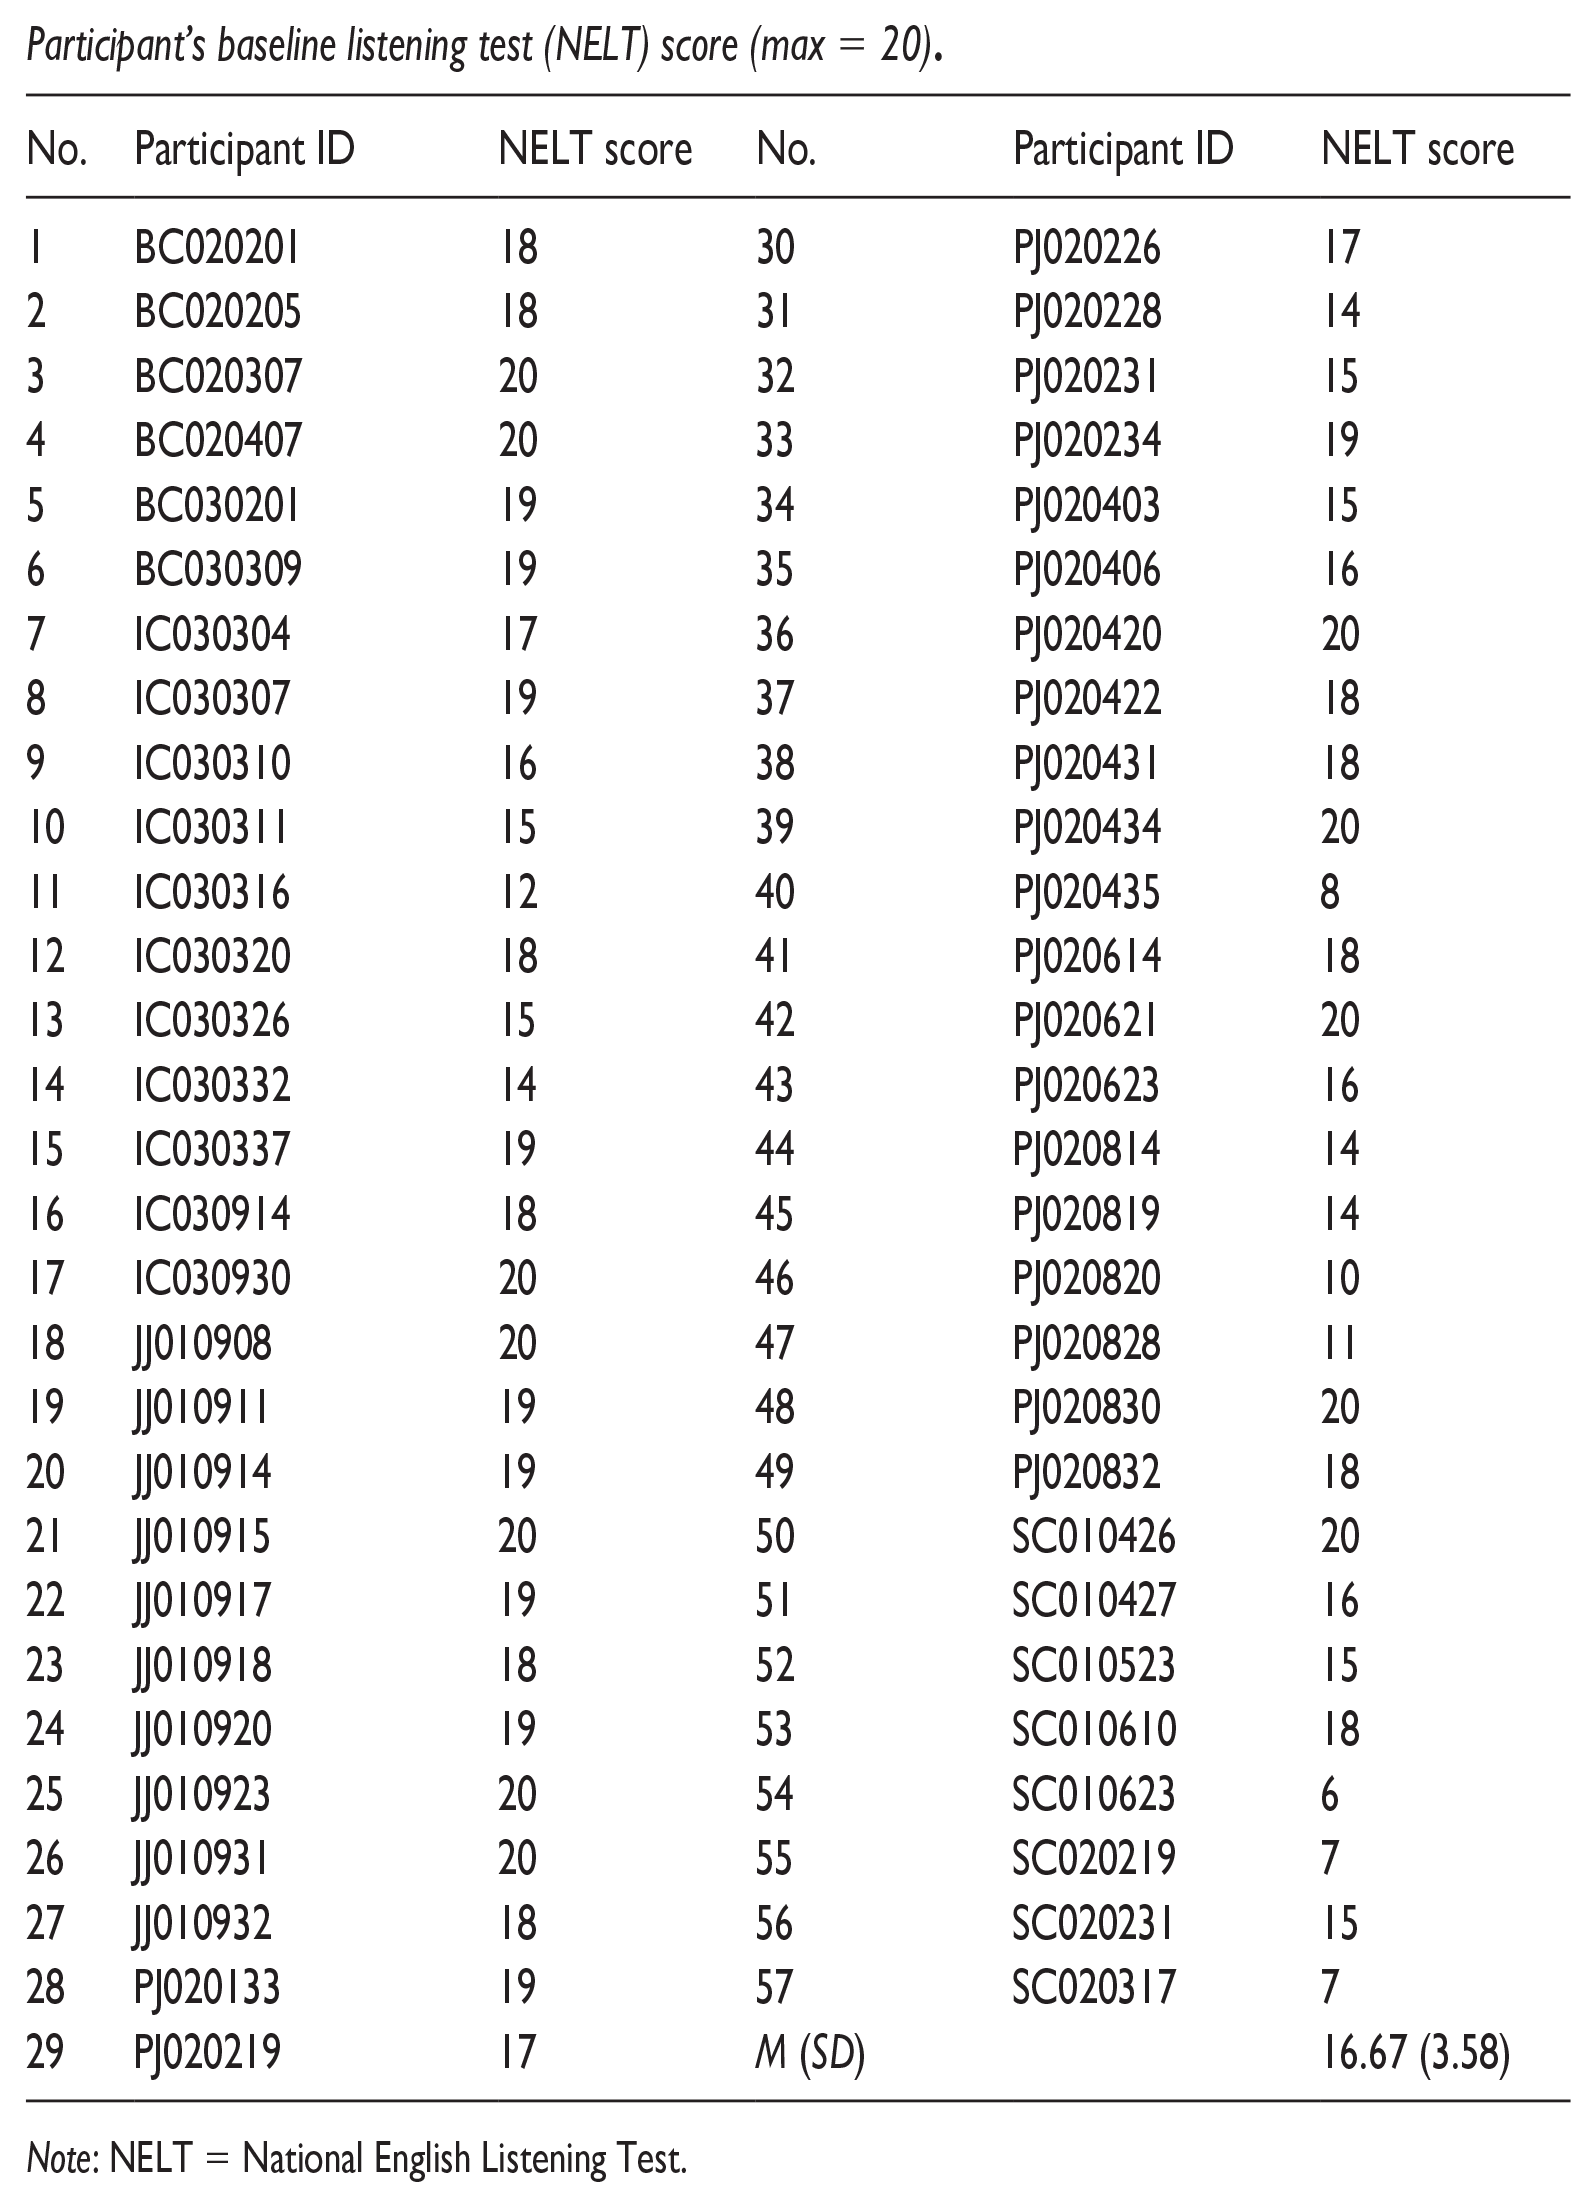
A total of 57 high school students, 27 male and 30 female, from five public high schools in the Republic of Korea participated in the study. English is a mandatory subject taught at schools in Korea, but most participants hardly have any opportunity to use English outside the classroom. The majority of the participants had studied English for approximately 10 years, but their language proficiency level was estimated at approximately Common European Framework of Reference for Languages B1–B2 levels (J. E. Choi et al., 2022; Y. Choi, 2023). No students had lived in an English-speaking country. The level of their listening proficiency was identified through a baseline proficiency listening test (National English Listening Test [NELT]) a few weeks prior to the experiment (see Appendix 4 for the results). Consent was obtained from the participants (all were 18 and above) at the start of the study.
The video-based listening test
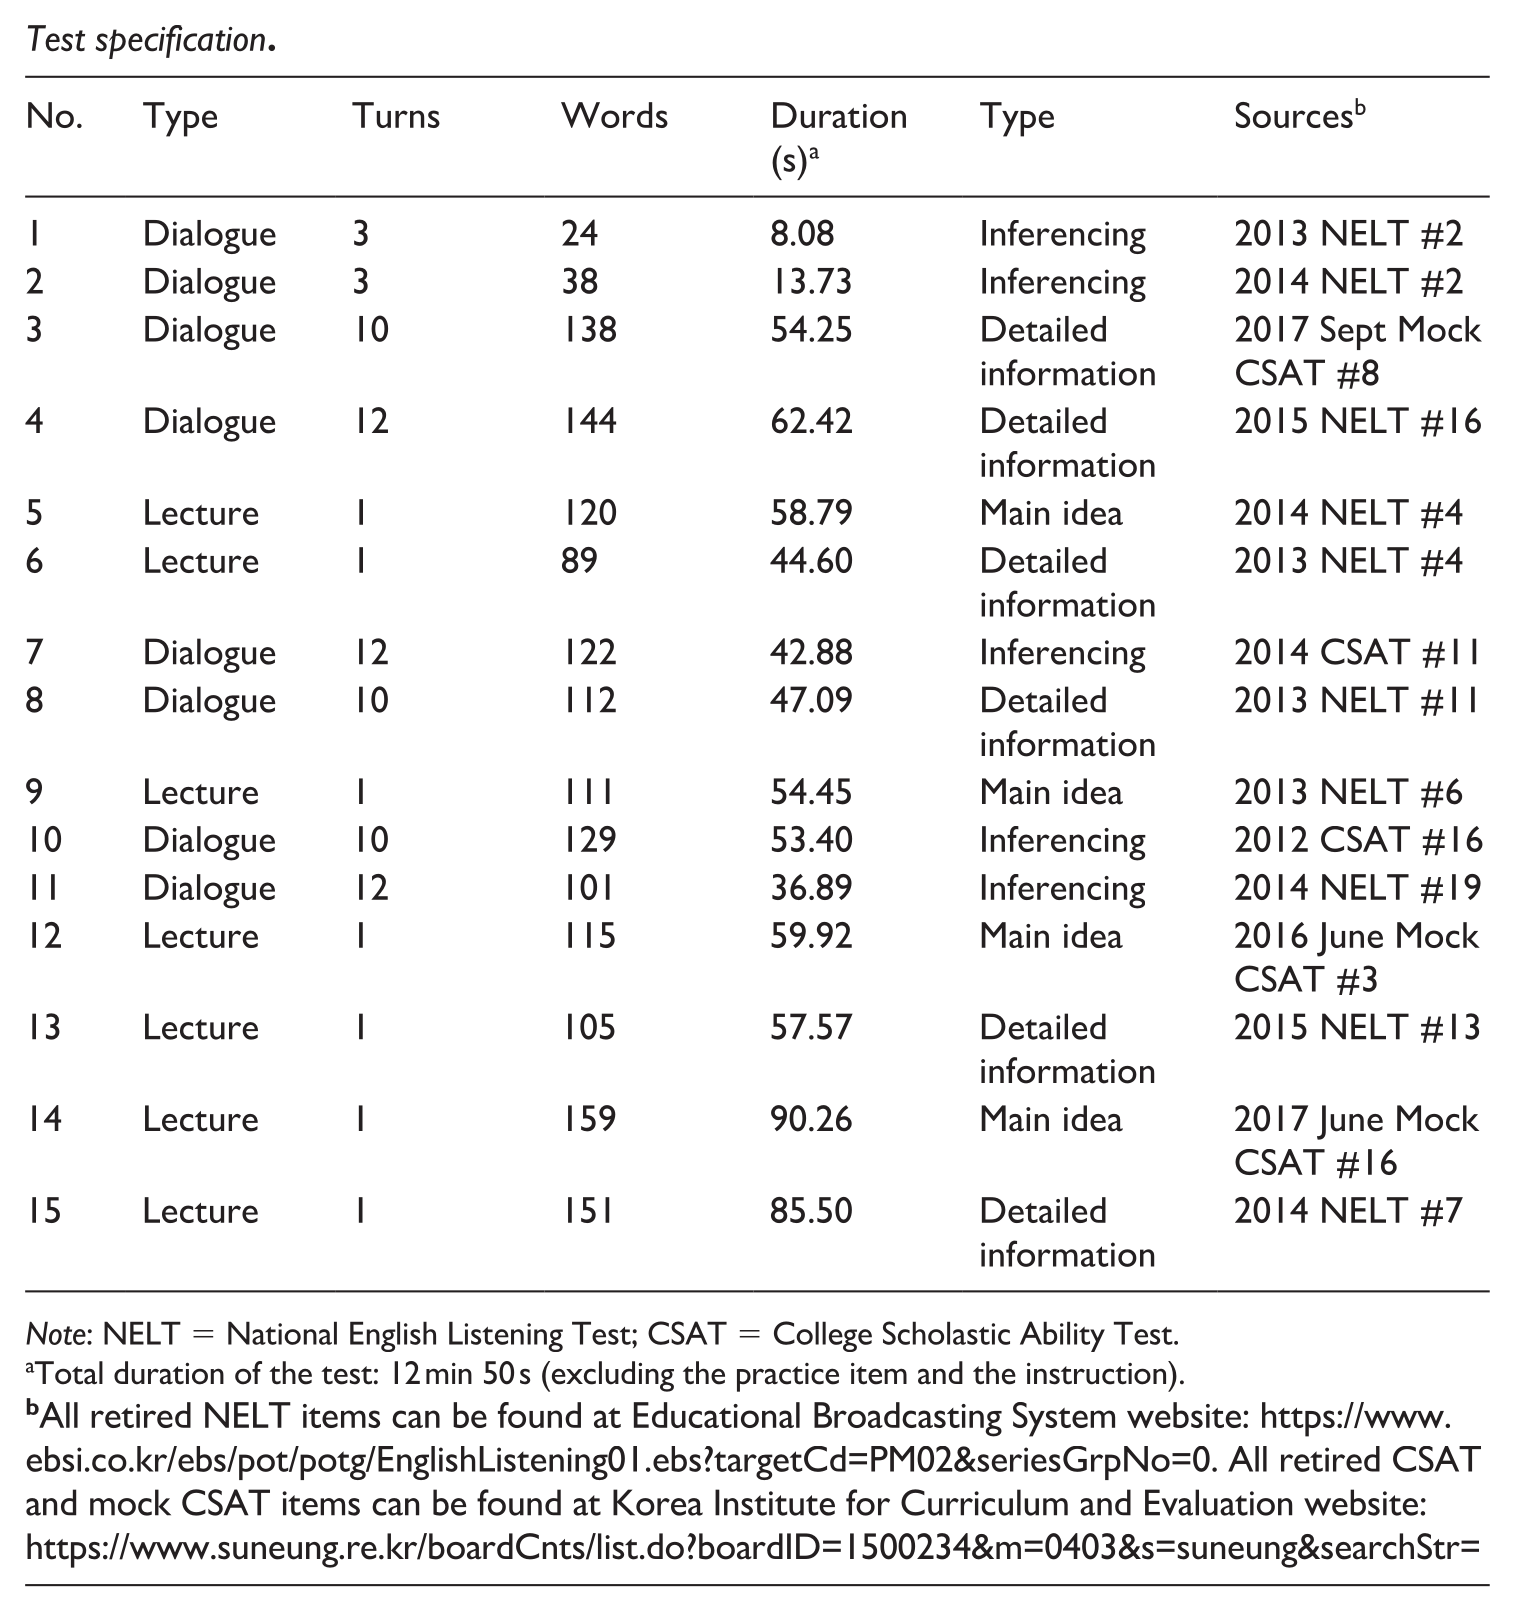
A set of 15 listening items were selected from retired papers of the College Scholastic Ability Test (CSAT) and the NELT. The CSAT is a university entrance exam in Korea, and the NELT is an English listening test for secondary school students (Grades 7–12) administered nationwide twice a year. Following the structure of the Listening section of CSAT and NELT, the test used in this study had five-option multiple-choice questions with one correct answer. The test consisted of eight dialogues and seven lectures as listening stimuli (see Appendix 1). There was one item per listening prompt. The total duration of the test was 13 min excluding the time for task instructions and one practice item. Participants had access to the stem and answer choices (i.e., key and distractors) throughout the test. The test format and languages of presentation were equivalent to the original CSAT and NELT with which the participants were familiar.
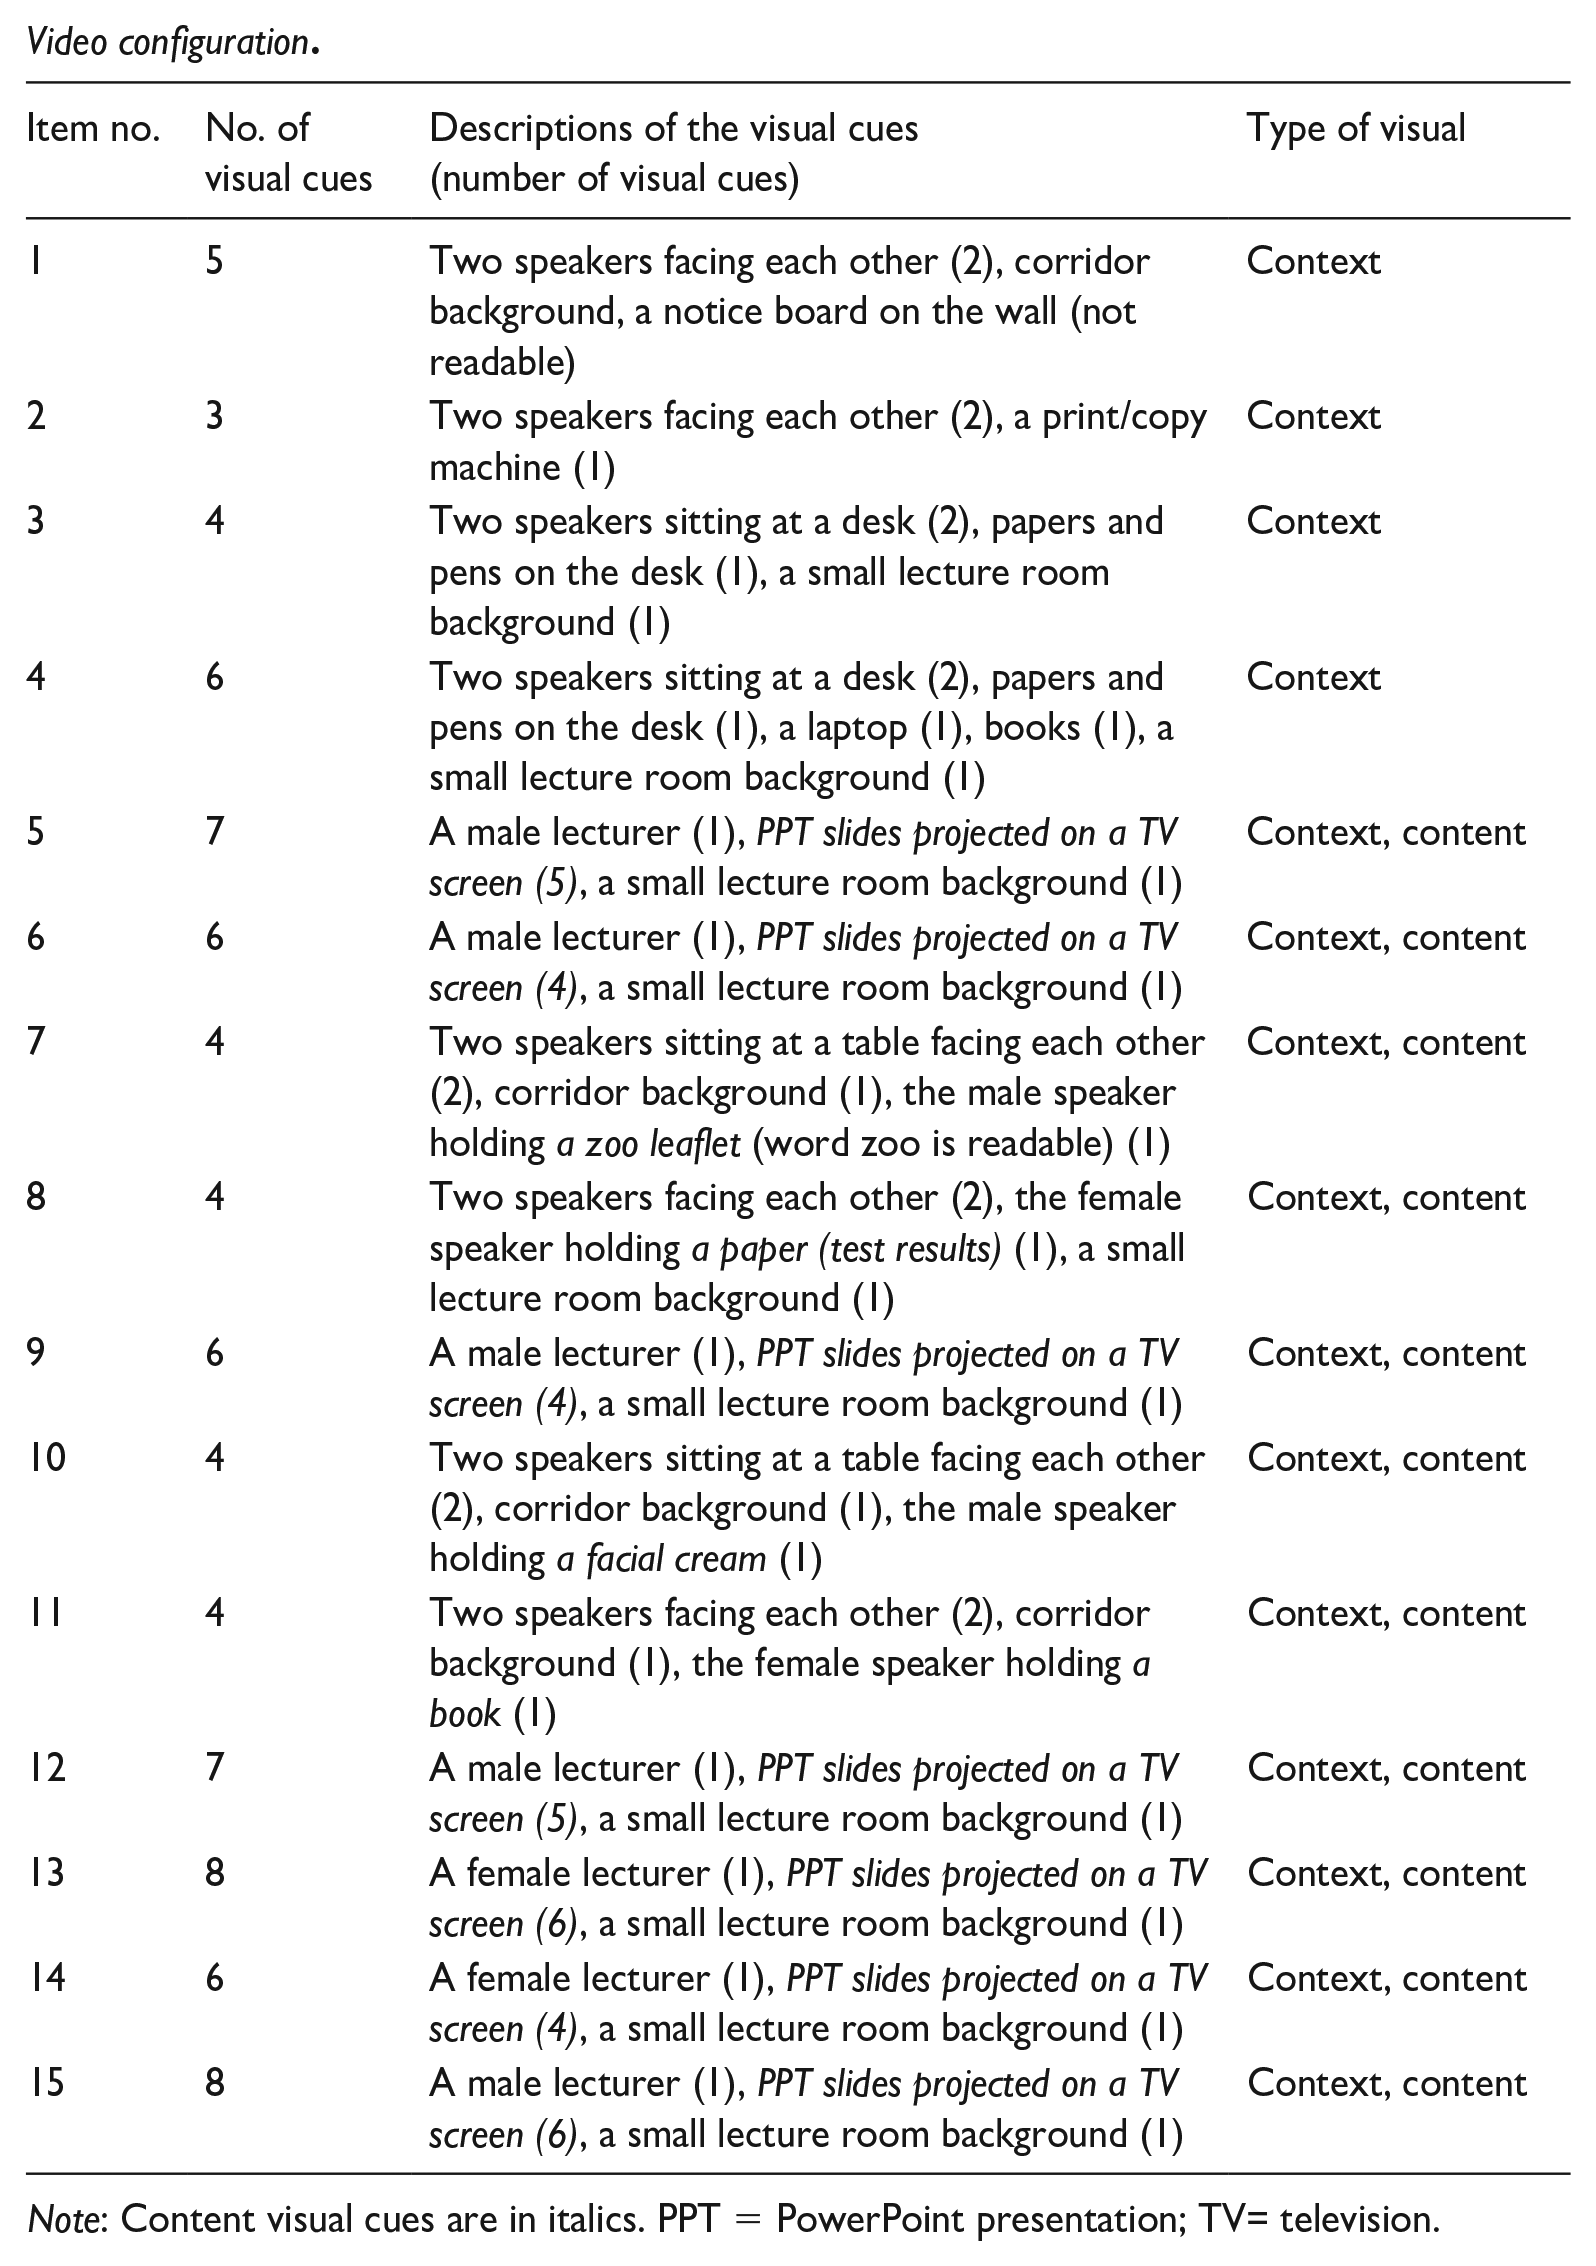
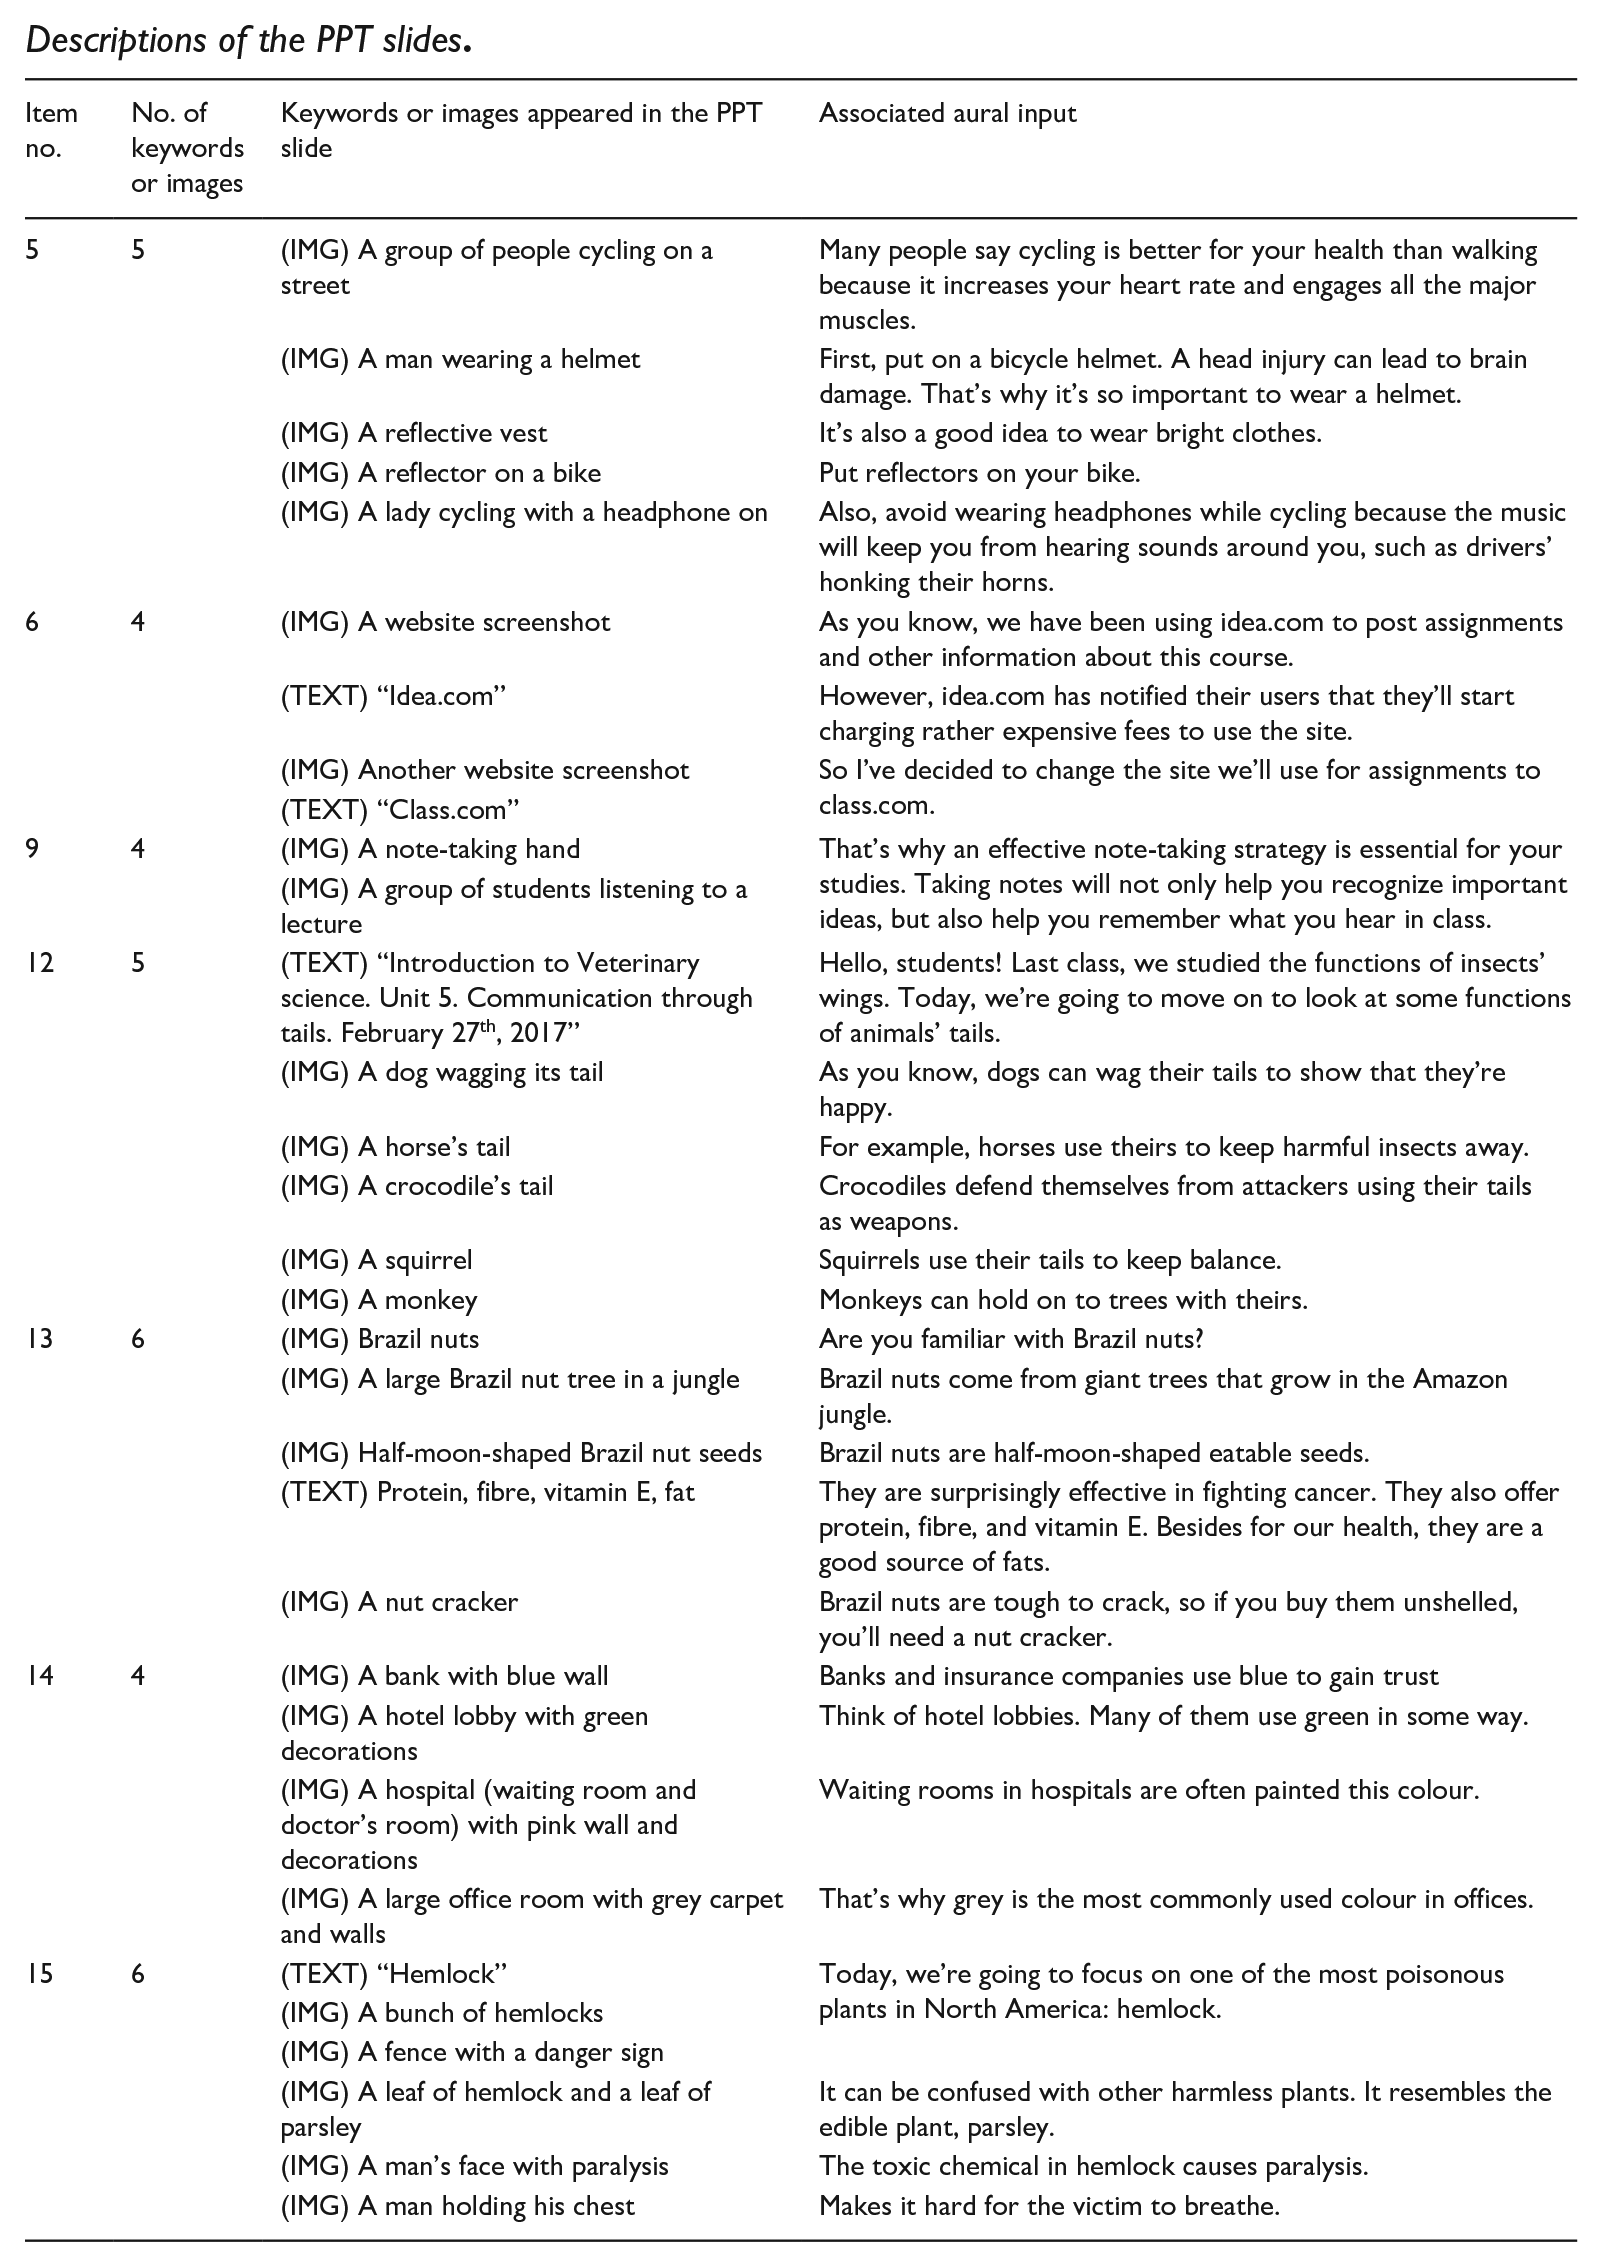
For each item, we created a video version with scripts identical to the audio version. In the dialogue videos, two speakers appeared at a waist-up angle. In the lecture videos, one speaker appeared at a full-body angle with PPT slides projected on a TV screen behind the speaker (see Figure 1). All speakers who appeared in the video spoke with British accents. The PPT slides included keywords and images that are semantically congruent with the audio input. On each PPT slide, the video clip was placed at the top centre of the screen with the size of 10.5 cm height by 14 cm width, a typical 4:3 ratio for high-definition videos (720p). The background colour of the top half of the screen behind the video was set to black for the video to stand out. The stem and answer choices were provided in font Calibri of size 24 and placed on the bottom half of the slide below the video. Appendices 2 and 3 provide specific information about the visual cues presented in each item as well as detailed descriptions of the images and texts used in the PPT slides for each item.
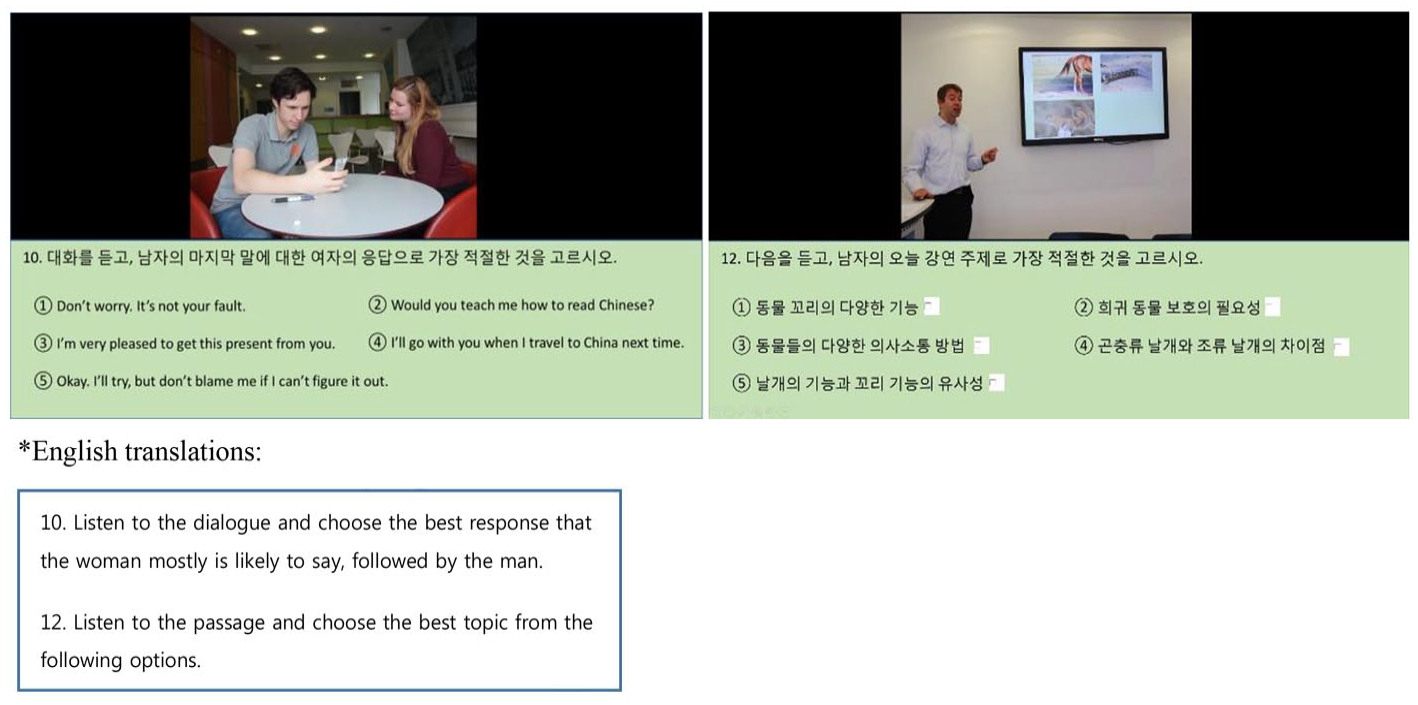
Screenshot of the video-mediated listening test.
The test administration process was fully controlled using PPT’s advance slide function which helped to prevent test takers from skipping or moving between items. Each listening prompt was played only once. The total duration of the test was 19 min.
Data collection procedure
The participants were tested individually. A Tobii X2-60 eye tracker with a 60-Hz sampling rate was mounted to a 17.3-inch Dell Precision mobile workstation (M6800) to record their eye movements and responses to the questions. The operating distance between the eye tracker and participants was between 45 and 90 cm, and freedom of head movement at 70 cm is 50 × 36 cm (width × height). Prior to the test, a nine-point calibration was conducted with each test taker individually to ensure the quality and accuracy of the recording. After the calibration, we followed Godfroid’s (2020) advice to instruct the participants to “limit head movement” and focus only on the screen to reduce temporal sampling error as much as possible (p. 360). During the test, the participants had access to the stem and answer choices from the beginning of each item. For each item, there was a 15 s limit to choose an answer, and the system automatically advanced to the next question after the 15 s. We used Tobii Studio’s default fixation filter, velocity-threshold identification, with the following settings (see Tobii AB, 2016):
30°/second threshold,
minimum fixation duration 60 ms (to discard short fixations),
maximum time between fixations 75 ms, and maximum angle between fixations 0.5° (to merge adjacent fixations), and
average of both eyes.
The mean of gaze samples of the recorded eye movements was 76.42% with a standard deviation of 15.34%. Gaze sample 1 rate (percentage) is calculated by determining the usable gaze data (Tobii, 2023). The reported figure of 76.42% indicates that on average both eyes were accurately identified in the recordings.
During the test, the first author wrote field notes concerning the participants’ test-taking processes, such as when and how they selected an answer, whether they changed the answer, and how many items they answered correctly. Immediately after the test was finished, we conducted retrospective stimulated-recall interviews. For practical reasons, we selected 23 participants with a balanced profile in terms of gender (10 male, 13 female) and test performance (mean test score = 11.96, SD = 2.42) for the interviews.
The recorded eye movements were used as stimuli to activate test takers’ memories and to obtain more accurate reports of their perceptions and thought processes (Van Gog et al., 2005). All the interviewees were asked semi-structured questions regarding: (1) their rationales for viewing the visual cues (the speaker and the PPT slide); (2) the extent to which they found particular visual components helpful or distracting; (3) their test-taking processes in terms of viewing the visual cues and the different components of the test item (e.g., switching their attention between different components of the item); and (4) how they decided their answer to the question. Each interviewee was asked similar questions on each specific type of visuals (speakers/PPT slides) and the item components (stem/key/distractors). In addition, we asked a few additional questions based on what we observed during the test (e.g., Why did you change your answer?). All interviews were carried out in Korean, the first language (L1) of the participants, and were recorded using a digital voice recorder, Sony ICD-PX333. The mean duration of the interviews was 10 min 17 s.
Data analysis
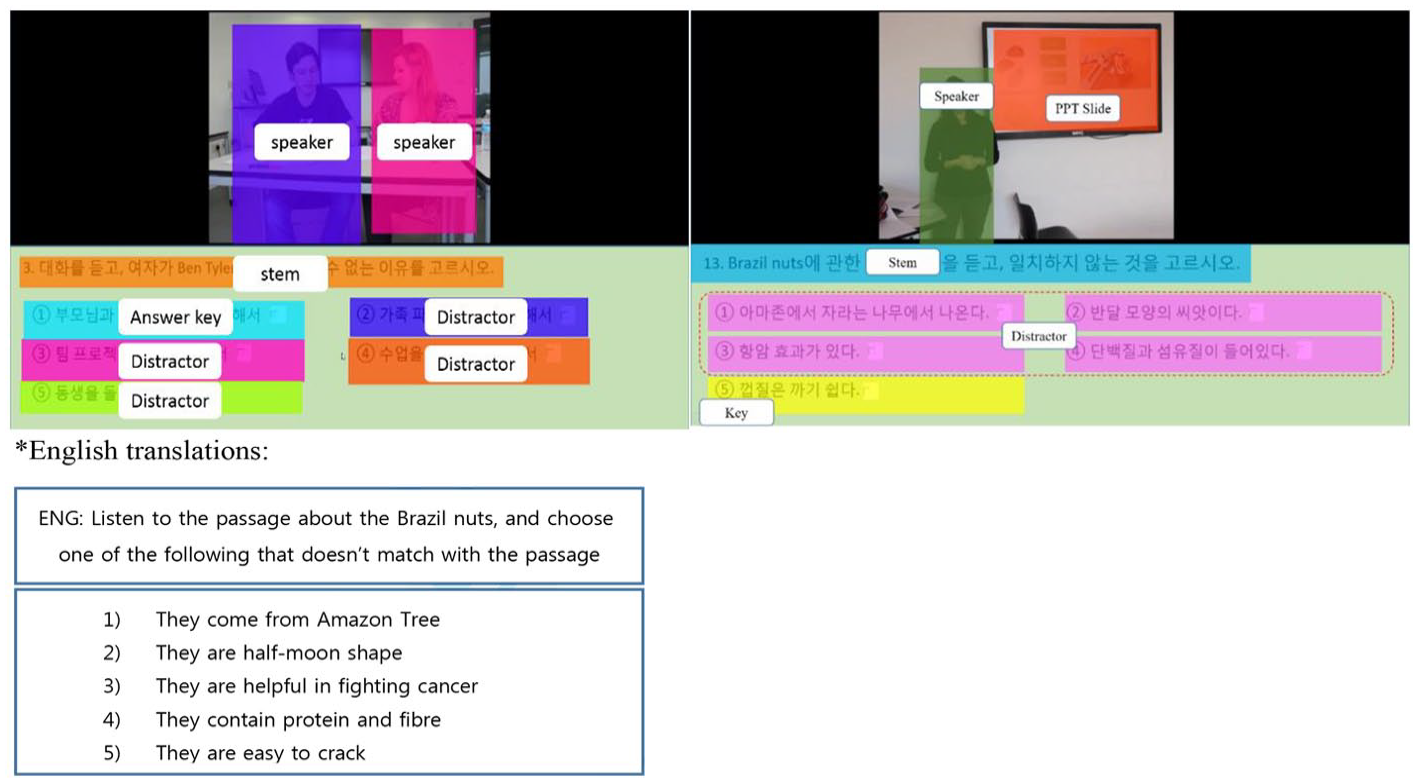
First, we defined five areas of interests (AOIs), which is an essential procedure in eye-tracking studies (Holmqvist et al., 2011). The AOIs in the video area were specified as (1) speaker (both speakers combined in the dialogue) and (2) PPT slide, and the AOIs in the item area were specified as (3) stem, (4) answer key, and (5) distractors (see Figure 2). Table 1 presents specific descriptions of each AOI.
Pre-defined areas of interests (left: dialogue, right: lecture).
AOI descriptions.
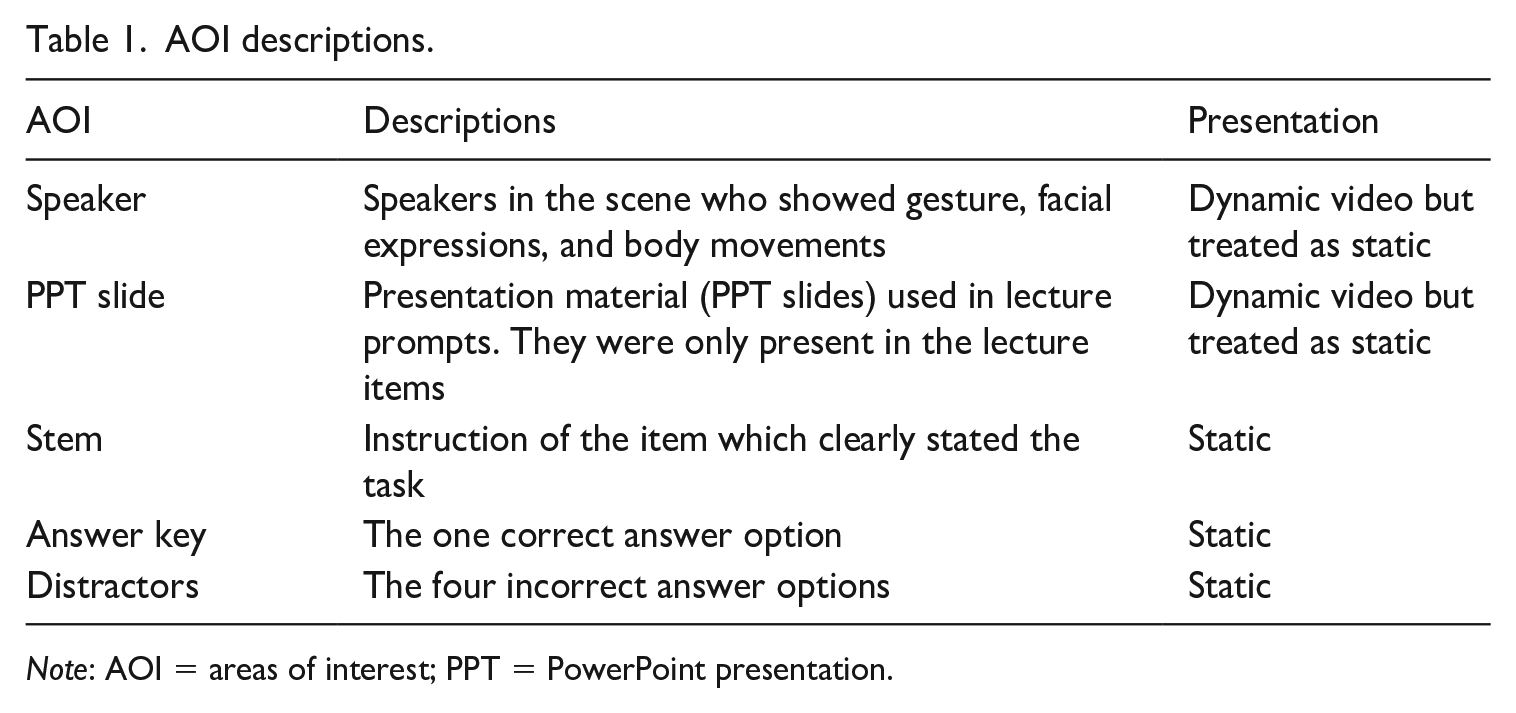
Note: AOI = areas of interest; PPT = PowerPoint presentation.
The speakers and PPT slides were dynamic visual cues because they moved during the test (i.e., body movements or hand gestures, and animation features of the text and images). However, they were treated as static for the purpose of analysis in this study because the speaker(s) and the PPT slides did not move outside the identified AOI area. In addition, the speaker and the PPT slide’s AOIs did not overlap, so the variables were measured as independent from each other.
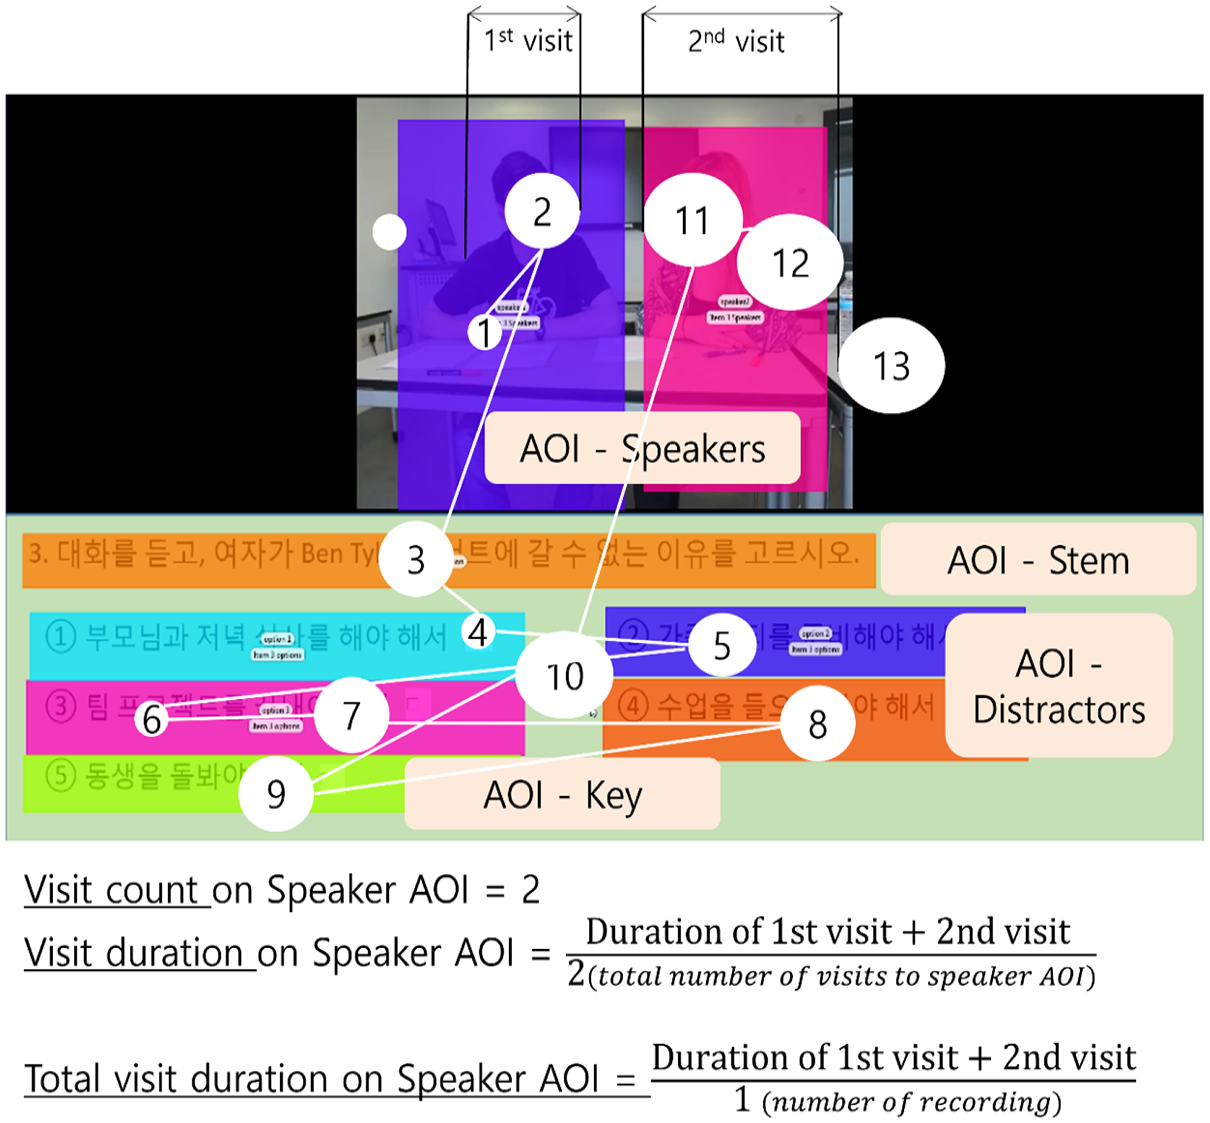
Three eye-movement measures were used in the analysis: (1) proportion of visit count, (2) visit duration, and (3) proportion of total visit duration (see Figure 3). Instead of raw eye-movement data (visit count, total visit duration), we used the proportion (percentage) of visit count and total visit duration on each AOI to reveal test takers’ attention to an AOI with reference to their attention to other AOIs, because of (1) the varying gaze samples (see the “Data collection procedure” section) and (2) the fact that some test takers had substantially higher visit counts and total visit duration than others. The proportions (percentages) were calculated by using the raw data as the numerators and the sum of visit counts and total visit duration on all AOIs as the denominators. The visit duration data were used as extracted from Tobii Studio without any transformation because visit duration on an AOI is an average of the durations of several visits on the AOI. The direct comparison of visit duration between AOIs is meaningful in its own right (see Tobii AB, 2016). Descriptions of these measures are presented in Table 2.
Calculation of eye-movement metrics.
Eye-movement measures.
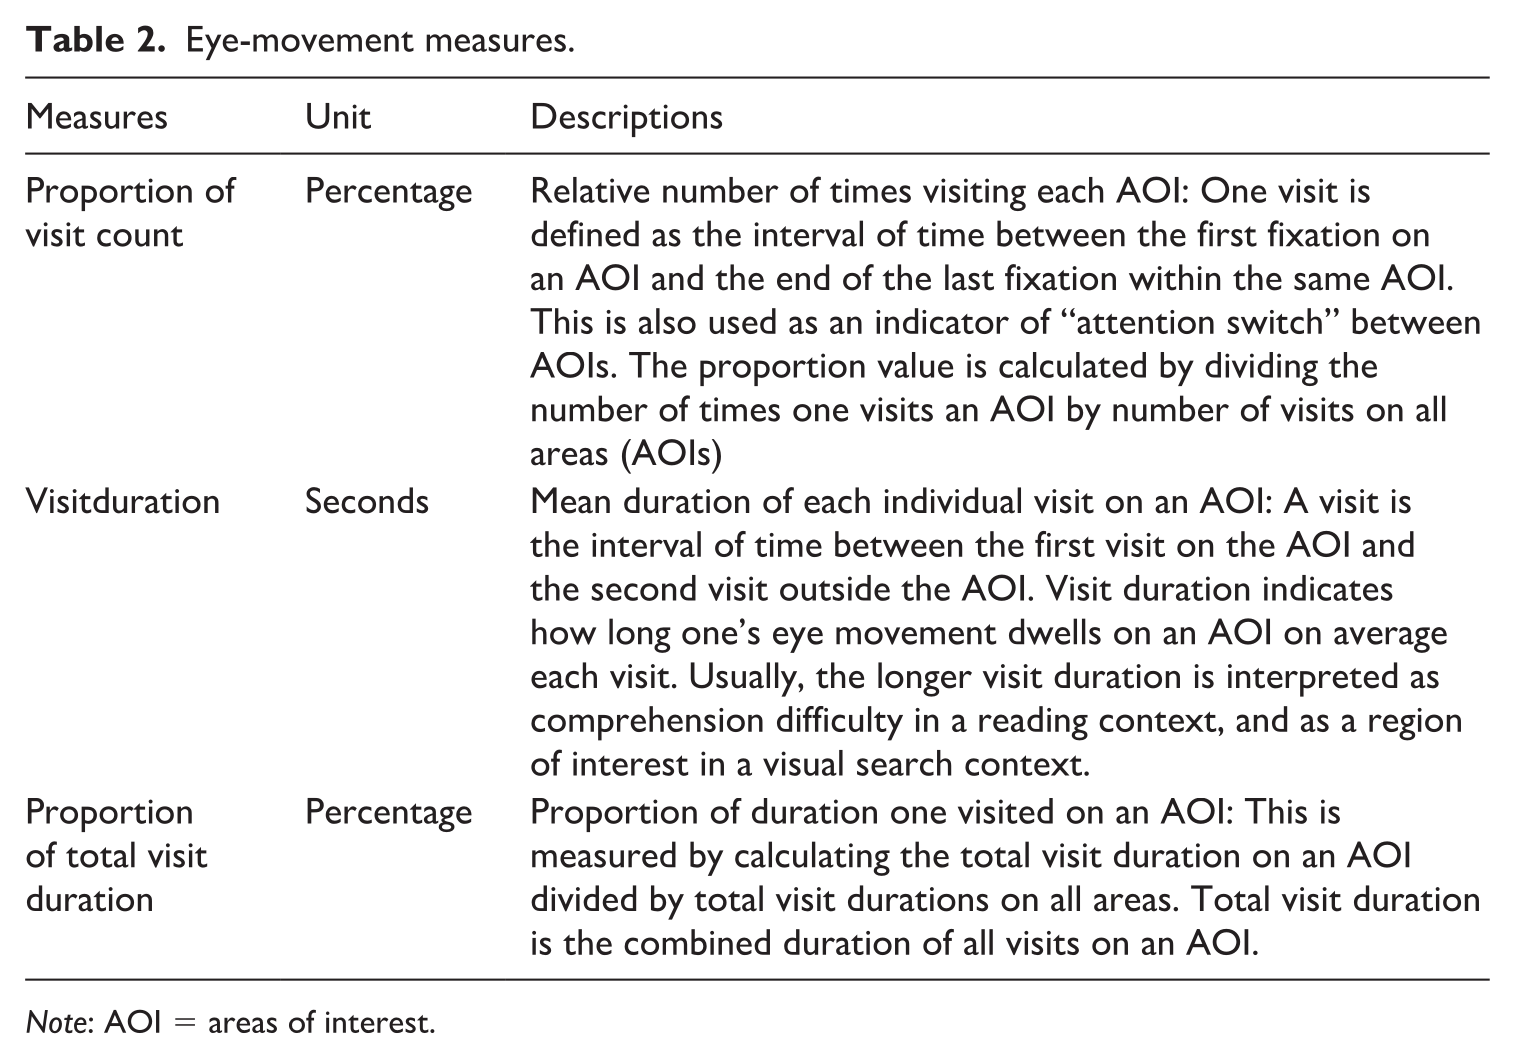
Note: AOI = areas of interest.
We conducted linear regression analysis with the eye-movement measures as independent variables and the total listening test score as the dependent variable. 2 It should be acknowledged that one of the parameters, stem, was excluded in the models that are fitted with proportion of total visit duration and proportion of visit count data (see Models 1 and 2 in Table 3, and Models 5 and 6 in Table 4). This was essential, as fitting all variables in any regression model would result in collinearity issues because the sum of all AOIs’ proportion rounds up to 100%. The model fitted with raw visit duration data included all parameters (see Models 3 and 4 in Table 5).
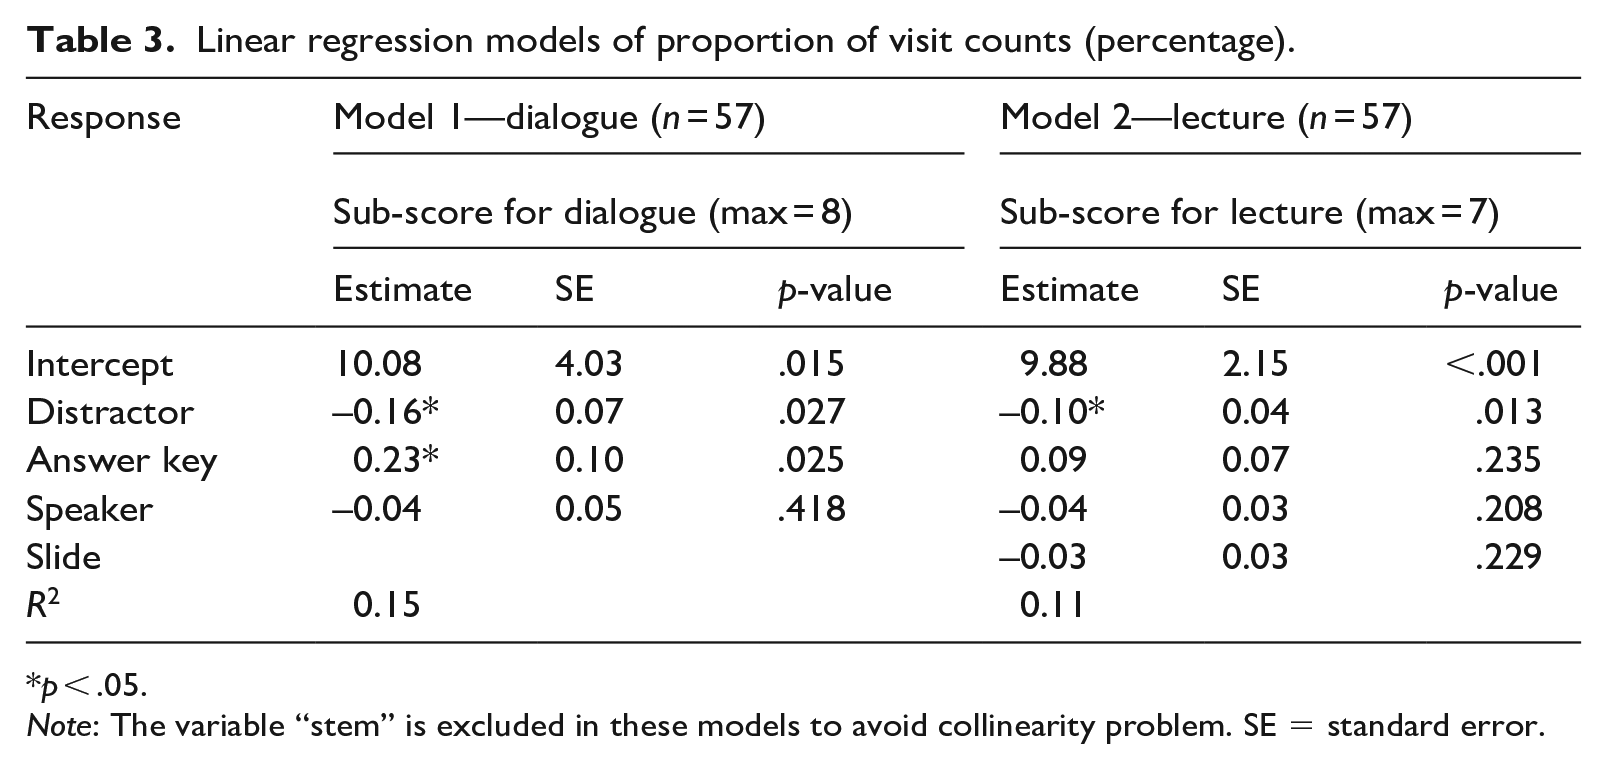
Linear regression models of proportion of visit counts (percentage).
p < .05.
Note: The variable “stem” is excluded in these models to avoid collinearity problem. SE = standard error.
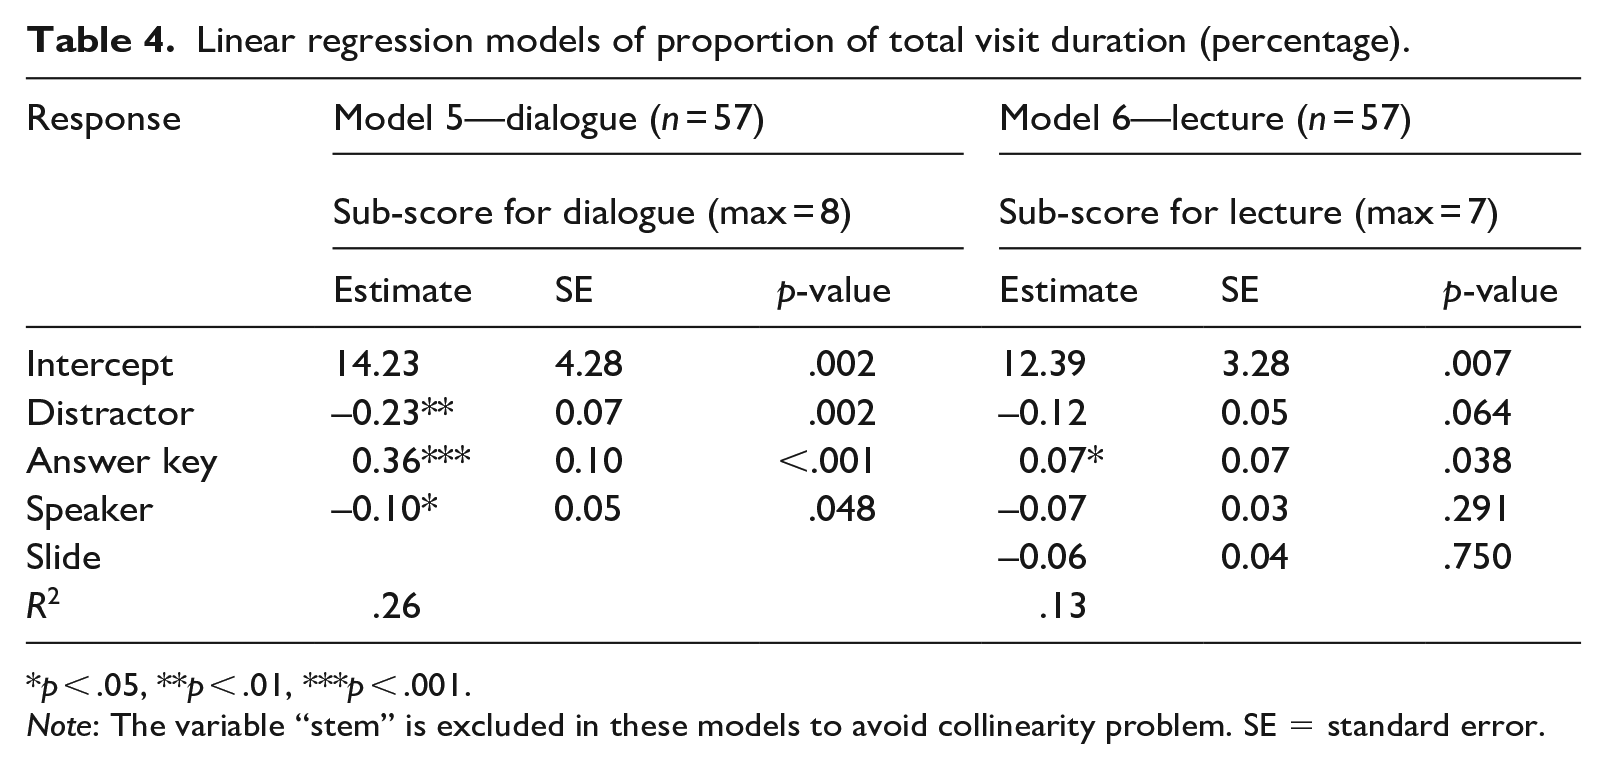
Linear regression models of proportion of total visit duration (percentage).
p < .05, **p < .01, ***p < .001.
Note: The variable “stem” is excluded in these models to avoid collinearity problem. SE = standard error.
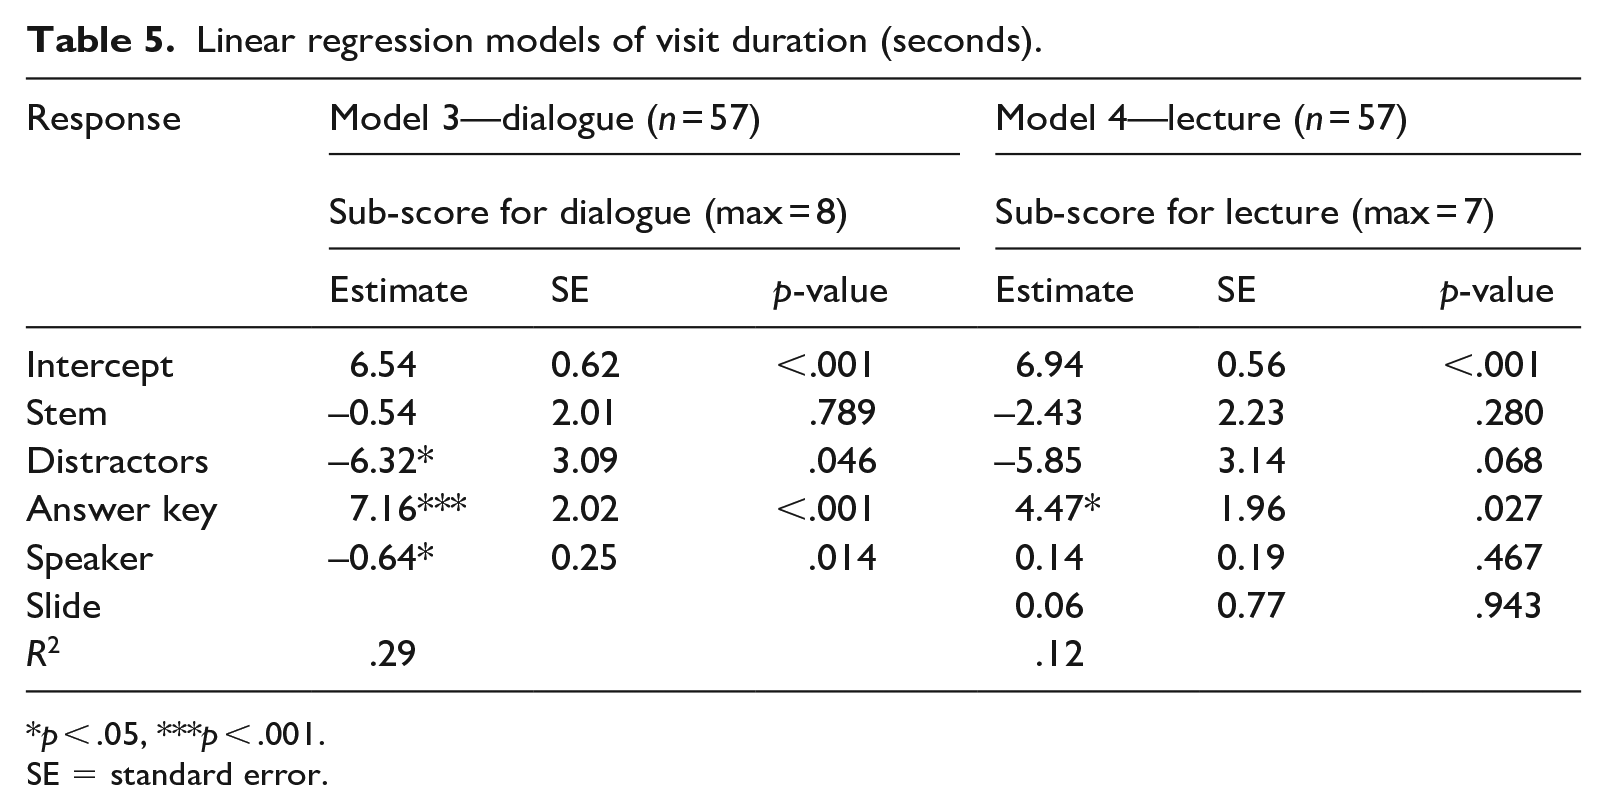
Linear regression models of visit duration (seconds).
p < .05, ***p < .001.
SE = standard error.
The stimulated-recall interview data were analysed thematically, to detect the general patterns and regularities in test-taking processes and the rationales behind them as reported by the participants (Braun & Clarke, 2006). Data reduction processes were carried out which included “selecting, focusing, simplifying,” and labelling the data with unique codes (Miles et al., 2013, p. 12). Through the coding process, the important chunks of data were labelled with descriptive codes and inferential codes for analysis (Punch & Oancea, 2014). To minimize subjective bias, the interviews were coded by two independent coders, and inter-coder reliability (ICR) was computed using Cohen’s Kappa coefficient for each theme and sub-theme. NVivo 11 was used for coding, structuring themes, and running coding comparison queries. Following the coding processes, the first researcher captured recurring patterns that were found within and across the participants and labelled them with a few tentative themes and sub-themes “to form an overarching theme” (Braun & Clarke, p. 89). The tentative themes were carefully reviewed and finalized following Patton’s (1990) internal homogeneity and external heterogeneity criteria. When several instances of coding disagreements were found on certain themes or sub-themes, the two coders discussed the segments and established a consensus, and a re-coding process was carried out. The average ICR of all six themes and sub-themes were calculated, resulting in a 92% agreement with a Cohen’s Kappa ICR of .61, which is an acceptable level (Everitt, 1996).
Results
Our aim with the present study is to investigate how test takers view different components of video-based listening comprehension tests, and their potential associations with their listening test performance. For this reason, we analysed test takers’ eye movements to identify the extent to which test takers viewed different visual cues and item components. Followed by the descriptive statistics of the test takers’ eye-movement data, linear regression analyses were carried out to understand the relationships between the eye movements and the listening test performance. To further explain the rationales behind test takers’ viewing behaviours, we thematically analysed stimulated-recall interviews.
RQ1: To what extent does viewing visual cues (speaker, PPT slides) and item components (stem, key, distractors) in a video-based listening test influence test performance?
The Cronbach’s alpha test on the 15 items showed that the reliability coefficient was .71, which was deemed acceptable in the context of the current study. The mean test score of the 57 participants was 11.50 (SD = 2.50; range: 3.0–15.0).
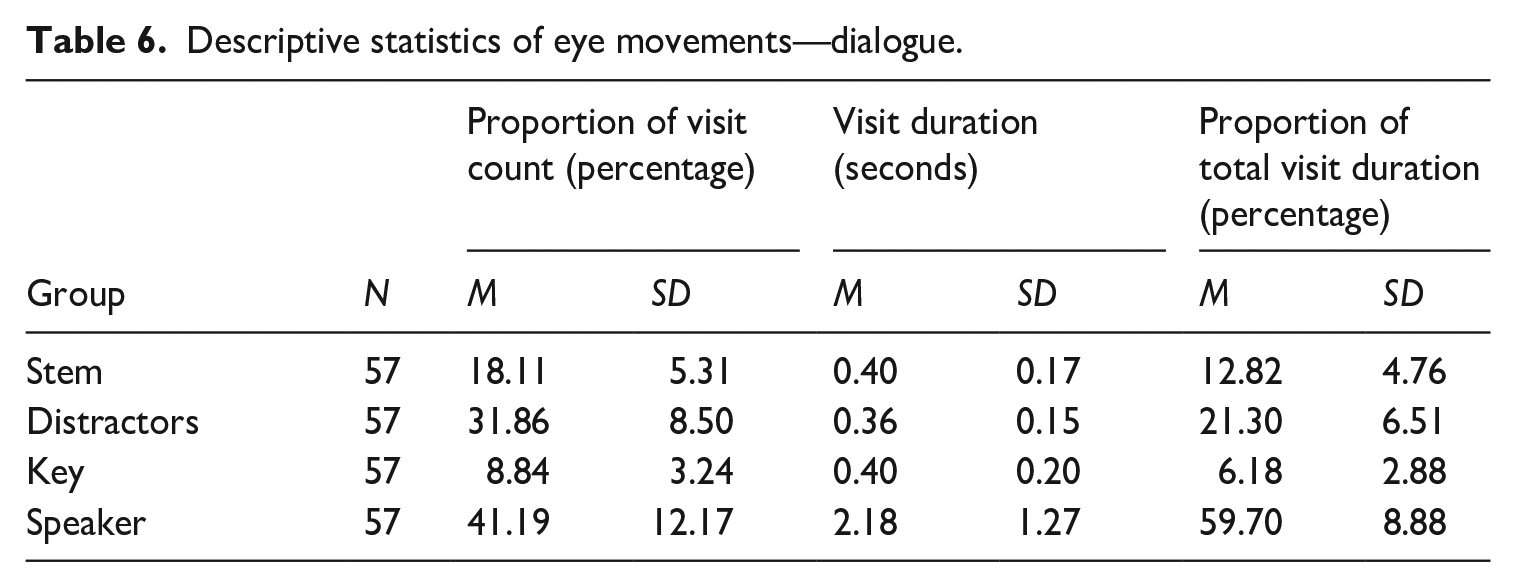
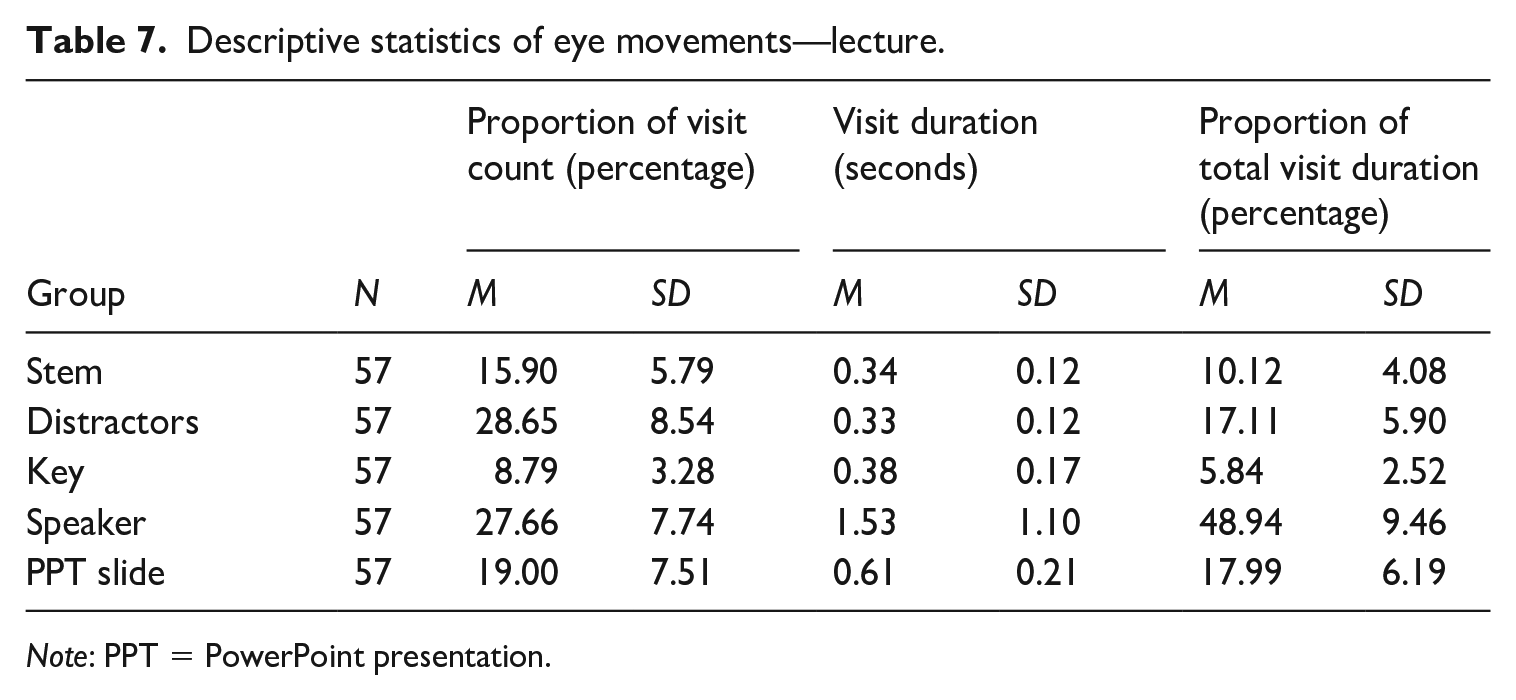
Tables 6 and 7 present the descriptive statistics of the eye-movement measures. Descriptive statistics of all three measures show that test takers in general viewed the visual AOIs (speaker and PPT slides) longer and more frequently than the stem and the answer choices (key and distractors) in both dialogue and lecture items. Descriptive statistics of the proportion of visit count variable show that test takers visited the speaker(s) for 41% in the dialogue items, and 28% in the lecture items. In addition, test takers visited at the PPT slides in the lectures for 19%, which makes a total of 47% of visits on the two visual AOIs combined. They visited at the distractors 32% in the dialogues and 29% in the lectures. Stem and key were visited relatively less frequently (stem 18%, key 9% in the dialogues; stem 16%, key 9% in the lectures).
Descriptive statistics of eye movements—dialogue.
Descriptive statistics of eye movements—lecture.
Note: PPT = PowerPoint presentation.
Descriptive statistics of visit duration show that test takers spent a longer time in each visit on average on the visual AOIs (i.e., speaker and PPT slide) than item AOIs (i.e., stem, distractors, and key). Test takers spent 2.18 s on average on speakers in the dialogues while they made shorter visits on the stem (0.4 s), distractors (0.36 s), and key (0.4 s). In the lecture items, test takers also showed the longest visit duration on speakers (1.53 s), and much shorter durations of visit on the stem (0.34 s), distractors (0.33 s), and key (0.38 s). They spent on average 0.61 s on the PPT slide in the lecture items.
The proportion of total visit duration showed that test takers spent approximately 60% of the total test time viewing the speakers in the dialogue items, and 49% viewing the speaker in the lectures. They viewed the PPT slides in the lectures for 18% of the test time. They spent 12% on the stem, 21% on the distractors, and 6% on the key in the dialogue items. Similarly, they spent 10% of the time on the stem, 17% on the distractors, and 6% on the key in the lecture items.
Linear regression analyses were conducted to examine the causal relationships between test score and eye-movement metrics. The results are presented in Table 3.
Model 1 on dialogue items shows that a one percentage-point increase in the proportion of visit counts on the key is associated with an increase of the score by 0.23. The same increase in the distractor led to the reduction of test score by 0.16. One percentage-point increase in the proportion of visit count on the speaker also predicts a decrease of the score by 0.04, but this was not statistically significant.
Model 2 on lecture items shows that one percentage-point increase in the proportion of visit counts on the distractor, speaker, and the PPT slide predicted a decrease of the scores by 0.1, 0.04, and 0.03, respectively. However, only the estimate on the distractor was statistically significant. The larger proportion of visit counts on the answer key predicted an improvement in the scores but this was not statistically significant either.
In total, 15% of the variance is explained by the variables in Model 1, and 11% of the variance by the variables in Model 2. Both models suggest that the more frequently a participant looked at the distractors, the more likely they would have received a lower score.
Model 3 on the dialogue items shows that an increase of 1 s in visit duration on the distractor and the speaker AOIs predicts a decrease in test scores by 6.32 and 0.64, respectively. A 1s increase in visit duration on the stem predicts a decrease of the scores by 0.54, but this was not statistically significant. On the other hand, an increase of 1 s in the visit duration on the key is associated with an improvement of the scores by 7.16. Model 4 on lecture items shows that an increase of 1 s in visit duration on the key predicts an improvement in the scores by 4.47. The longer visit duration on the stem and the distractor predicts a decrease in the scores, while the longer visit duration on the speaker and the PPT slide predicts an improvement of the scores of the lecture items; however, neither of these was statistically significant. In total, 29% of the variance is explained by the variables in Model 3, and 12% of the variance by the variables in Model 4.
Model 5 on dialogue items suggests that a one percentage-point increase in the proportion of total visit duration on the distractor and the speaker leads to a decrease of the scores by 0.23 and 0.10, respectively. The same one percentage-point increase in the proportion of total visit duration for the answer key leads to an increase of test scores by 0.36. A similar direction but a smaller magnitude of the estimates was found in Model 6, but only the estimate of the answer key AOI was statistically significant. In total, 26% of the variance is explained by the variables in Model 5, and 13% of the variance by the variables in Model 6.
RQ2: What are the underlying reasons behind test takers’ viewing behaviours and use of strategies?
We analysed the stimulated-recall interviews thematically to explore the rationales for the participants’ viewing behaviours. We reviewed the entire transcripts to pull out meaningful segments that are directly associated with the pre-established questions given to the participants.
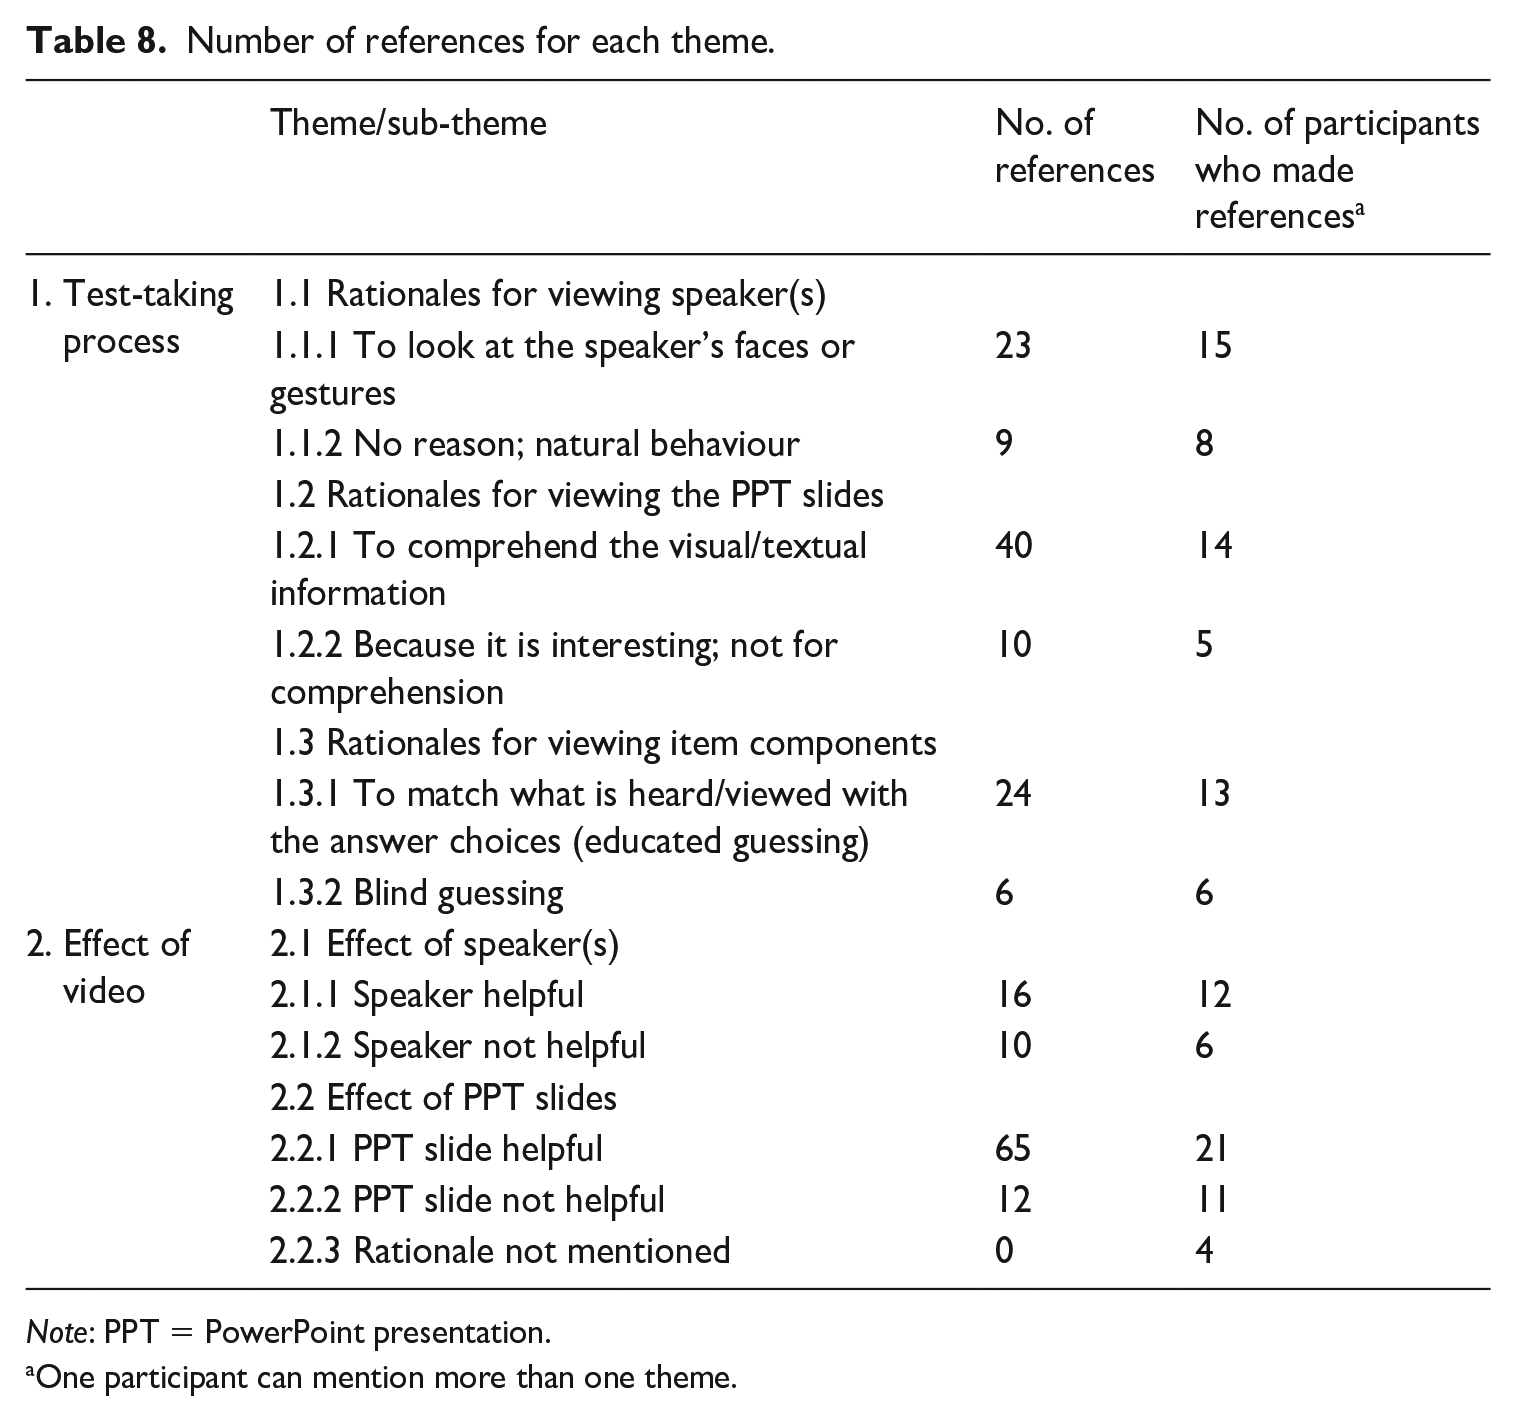
Table 8 presents the number of references that were selected and allocated to each theme/sub-theme and the number of participants who made the references.
Number of references for each theme.
Note: PPT = PowerPoint presentation.
One participant can mention more than one theme.
Among the 23 interviewees, 15 participants (65%) mentioned that they viewed the speakers to look at the speakers’ faces or gestures, while 8 of them (35%) reported that they looked at the speakers for no reason. In terms of viewing the PPT slides, 14 participants (61%) reported that they referred to the PPT slides to comprehend the visual or textual information in them, and 5 participants (22%) explained that they looked at the PPT slides simply because they seemed interesting. On the rationales for viewing the different components of the items (stem, key, distractors), 6 participants (26%) commented that they guessed the answer without fully understanding the aural input, and 13 participants (57%) reported that they matched what they heard or had seen through the video with the answer choices.
The participants made a substantial number of references to the effect of the visual cues, reporting the degree to which the speaker(s) or the PPT slides in the videos helped or not. On the effect of the speaker, 12 participants (52%) reported that viewing the speakers was helpful (16 times), while 6 participants (26%) reported that viewing the speakers was not helpful (10 times). On the effect of the PPT slides, most of those interviewed (91%) reported how the visual cues from the PPT slides were helpful in at least one item, and this was commented 65 times in total on different items. On the other hand, 11 participants (48%) also reported that the PPT slides were not helpful (12 times).
It should be noted that several participants reported PPT slides and speaker(s) were helpful in one item, but not in another, and this perception was affected by specific features of the visuals. They reported that the effect of PPT slides varied due to different semantic meanings disseminated by different visuals or textual information contained in the PPT slides. It should be noted that the references about the speakers and the PPT slides being “not helpful” do not necessarily indicate that they were “distracting.” Instead, the participants who felt the visual cues were “not helpful” commented that they did not need the visual cues to comprehend the input to find an answer.
Theme 1: Rationales for viewing each AOI
Research Question 2a: Why do test-takers look at the visual cues and the item components during the video-based listening test?
Rationales for viewing the speaker(s)
The rationales for viewing the speakers were twofold: to look at the faces or gestures of the speakers or as a natural viewing behaviour, with no explicit reason being articulated by the participants. The following excerpts are from 2 of the 15 participants who reported that they looked at the “speaker(s)” to look at their faces and gestures.
For this one, I looked at the man’s gesture. [. . .] I looked at the gesture and heard the word “breath” and chose this as my final answer because this [the key] was definitely mentioned in the prompt. (Peter. Note: pseudonym of interviewee; the extracts were translated from Korean to English.) I looked at the face of the lecturer in the video as if he is an actual teacher giving a lecture in the classroom. In real life, I normally look at the faces of my teachers as well. (Richard)
As shown in the excerpts above, the participants looked at the speakers’ faces or gestures to extract contextually relevant information from the speakers’ facial expressions or gestures, which aided them to comprehend the input and find an answer.
The following excerpts are from two of the eight participants who reported that they looked at the speaker(s) with no explicit reason or as a natural viewing behaviour.
I normally don’t look at anything when completing a listening test [traditional audio-only test]. But for this one, since there was the video with the speakers in it, I just looked at them because I didn’t know where to look. (Irene) I have a habit of looking at people’s eyes when having a conversation with others, so I looked at the eyes of the speakers in the video when taking this test. (Vanessa)
It seems that they viewed the speaker(s) in the videos rather unconsciously as a natural behaviour. They used expressions such as “habit” (Vanessa) or “normally” (Irene) which show that they performed similarly as they do in a real-life listening situations.
Rationales for viewing the PPT slides
The test takers looked at the PPT slides to find clues to help comprehend the aural input. The following examples are from 2 of the 14 participants who reported how they viewed the PPT slides to aid listening comprehension:
For this one, the images were shown as I listen to the talk. Half-moon shape, fighting cancer . . . and it also showed the text “protein,” “fibre,” [in the PPT slides]. And then at the end when it showed the picture of that nutcracker, it was the decisive clue.
(Dave) I just returned to the images in the video [PPT] simply to check whether the answer I chose was correct. [. . .] I looked back and forth at the text in the PPT slide and the answer choices because I thought those words [in the PPT] might be in the options as well. (Lisa)
On the other hand, five participants looked at the PPT slides simply because they found them novel and interesting. The following is an example from one of the interviewees: I found the monkey’s tail in the PPT slide interesting. That’s why I looked at it for so long. (Amy)
Rationales for viewing the item components
A total of 13 test takers reported that they viewed the stem and answer choices as part of their strategies to complete the tasks successfully. Often, these strategies were used intentionally. The followings are examples from 2 of the 13 participants: I looked at the choices before the prompt begins because by doing so, I can briefly figure out what the prompt would be about. (Katie) I heard the word “China,” so I looked at these two options first, but the stem said “best response of the woman,” so I eliminated number 2 here, and then I read through all the other options . . . (Walter)
According to the excerpt, Katie reported that she looked at the stem and the answer choices before the video was played to “figure out” the content of the prompt. Walter also linked what he heard from the input with the answer choices and eliminated distractors to arrive at an answer.
The following two quotes demonstrate the underlying reasons for switching attention between the visual cues and the item components: I was just watching the lecturer in the video and when I heard something that is relevant to the topic of this lecture, I then quickly moved down to look at the choices. (Richard) By moving back and forth [between the video and options], I was able to eliminate the distractors. (Gil)
It was found that the participants moved their attention from the video to the answer choices to “check” and “eliminate” answer choices as part of their test-taking strategies. It seems that using both the pictorial and the auditory information to successfully answer the items was a frequently used strategy in a video-mediated listening test condition.
On the other hand, six participants reported that they guessed the answer when they were unable to fully comprehend the listening input. For example: So I tried to use the pictures in the PPT slide to answer the item but I wasn’t sure if that picture refers to paralysis or hard to breathe. So I guessed the answer. (Oliver) I heard he mentioned the memory on interesting or important things . . . something like that. Anyway, I just chose #1. I felt the answer was #1. I used the words that I heard to guess the meaning. (Tina)
As shown above, some participants used the part of the aural and visual information to guess the meaning and find an answer. It should be noted that there were only six references of such guessing strategy from six participants only.
Theme 2: Effect of video
This second theme reports to what extent the participants thought viewing the visual cues (the speakers and the PPT slides) influenced their test-taking processes and performance. Ultimately, it answers Research Question 2b: To what extent do test takers find viewing the visual cues in the listening test useful?
Perceptions on the helpfulness of viewing the speakers
Test takers showed clear differences in their perceptions of viewing the speaker(s) in the videos as being either helpful or distracting. The following quotes are from 2 of the 12 participants who reported that they found the speakers helpful: Looking at the speakers gives me a feeling that I am eavesdropping on a conversation of my friends, which makes me look at them more. It wasn’t a direct help in answering the item but made me feel that I was am taking a part in the conversation. (Tina)
By looking at the lady’s facial expression, whether she is sad or happy, I can guess the answer and narrow down the possibility of the correct answer.
(Nick)
Both Tina and Nick reported that looking at the speakers in the videos was helpful as they were able to receive clues by reading the speakers’ facial expressions (Nick). Although Tina said the speaker was not a “direct help” in finding an answer, she reported that she felt as if she was eavesdropping on a real conversation which resembled a real-life listening situation.
On the other hand, some participants reported that the speaker in the video was not helpful or partially distracting. A few examples are as follows: I looked at the lecturer because his movements were a little distracting. Because this video dragged my attention, I missed [the answer] (Zoe) The actor’s motion [movement] of getting the book for her . . . I was kind of lost there because I lost attention. So this element [speaker’s movement] was a little distracting to me. [. . .] It was distracting because he moved so suddenly. (Walter)
The two test takers above reported that they lost attention because the movements of the speaker(s) were not meaningful or were too sudden (Zoe and Walter). One other test taker reported that the helpfulness of the speakers varied by item type: Unlike the dialogue items which helped me understand better by looking at the speakers, looking at the speaker in the lecture wasn’t as helpful. I only glanced at the lecturer because he was talking. (Lisa)
As presented above, Lisa only found the speakers in the dialogue items helpful in understanding the listening input, but not the lecturer in the video. Given that all four test takers above were relatively highly proficient in the sample, it could be speculated that they did not find the visual support very helpful in completing the tasks. In other words, the four test takers could perhaps have comprehended the listening input without the visual aids.
Reasons why viewing the PPT slides is helpful or not helpful
Most of those interviewed (21 out of 23) reported that the clues they received from the PPT slides were helpful in finding an answer. For example: For this one, I found the answer by watching the video. When I saw the images here [PPT slides], I had a feeling that this lecture iwas about animal tails. (Katie) To understand the content of the prompt, the monitor [PPT slides] was more helpful [than the speakers]. (Michelle)
The above two participants indicated that the PPT slides presented in the lectures were sometimes decisive clues to choose the answer. For example, some of them used the expression “I became sure” when they explained the effect of PPT slides on their decision-making process. In many cases, test takers reported that images and words in the PPT slides helped them find an answer, especially as some words in the PPT slides were mentioned by the speakers.
On the other hand, 11 participants also mentioned that the PPT slides were not helpful in some items. The following are two examples: For this one [Item 13], the PPT slide wasn’t a big help . . . I understood the content [without the PPT slide] [. . .] but when I saw the image of the nutcracker, I became sure of my answer. (Gil) I didn’t look at the PPT slides carefully. I just had a quick meaningless look at them because I had already chosen the answer. (Vanessa)
The above two participants reported that they did not find the PPT slide helpful, but this varied across different items. Most of them reported that the PPT slides were not “a big help” rather than distracting, often because they had already chosen the answer from hearing the aural input only (Vanessa). It should be also noted that there were only 12 references from the 11 participants who considered the PPT slides had a negative effect on their test performance, in sharp contrast to a much larger number of participants who mentioned the positive effect of the PPT slides (65 references from 21 participants).
Discussion
Key findings of this study are as follows: (1) Test takers viewed the visual cues longer and more frequently than the stem and answer choices. (2) The longer and more frequent visits on the key and PPT slides are associated with an increase in test scores, while an opposite trend was found on the visits to the distractor and speaker AOIs. (3) Participants used both the aural and visual inputs to comprehend the listening prompt, and they associated what they looked at and heard with the answer choices as one of their test-taking strategies. (4) Participants generally found the visual cues helpful in finding an answer, but mostly attributed this to the help they received from the PPT slides. (5) Finally, we found that there were considerable individual differences in how test takers utilized visuals. We speculate that this individual variability in utilizing visuals was associated with the test takers’ proficiency and the types of visual cues.
These mixed findings found across different AOIs of the video-mediated listening test might be explained by the different amount of information disseminated from each different variable. For instance, the longer and more frequent visits to the visual cues might be linked to the longer processing times, as compared to the visits to the text (i.e., stem and answer choices). However, this does not necessarily mean that the test takers found the most decisive clues from the visual cues to answer the questions. Instead, different types of visual cues might have yielded different amounts of help in answering the questions. For example, the negative relationship between looking at the speakers in the video and test performance might be attributable to various reasons. First, it is possible that test takers of lower language ability viewed the speakers more to find clues that they could not work out from the aural input alone. This echoes Wagner’s (2010) finding, which showed that test takers of lower language proficiency attended the video more. Such phenomenon can be explained by Mayer’s (2009, 2022) cognitive theory of multimedia learning and Paivio’s (1990) dual-coding theory, which both posit that verbal and non-verbal components are triggered and supported by each other to facilitate learning. These theories assume that the listeners need to have sufficient linguistic knowledge for visual cues to play positive roles. Second, the speaker-related visual cues lack direct semantic association with the aural input in the listening prompt. Six participants reported that they did not find the speaker-related visuals helpful largely because the visuals did not contain salient clues to answer the questions. Nevertheless, a greater number of test takers (12) reported that looking at the speaker’s facial expressions or gestures was beneficial to understand the context of the listening prompt. This finding resonates with what Kellerman (1992) claimed: that kinetic behaviours (i.e., body movements) play a significant role in human communication, and video-based listening materials which contain such kinetic behaviours can facilitate better listening comprehension.
The PPT slides in the lecture videos were considered by most test takers helpful in arriving at an answer. The regression analyses, however, showed rather mixed findings: viewing the PPT slides had both a weak negative association (proportion of total visit count and visit duration) and a positive association (visit duration) with test performance. Moreover, these results were not statistically significant. However, the qualitative findings show that the PPT slides generally helped the test takers comprehend the aural input better. This finding was similar to that reported in Suvorov’s (2018b) qualitative study, which showed that the most helpful visual cues for test takers were the visual and textual information used in lectures. Echoing Suvorov, we think that the positive effect of the visual cues in lecture videos may be attributable to the semantic congruence between the aural and visual input. This also aligns with Lesnov’s (2018) finding that content-rich visuals made listening comprehension tasks easier. Thus, careful interpretation is required in interpreting the weak negative effect of PPT slides as shown in the regression models. Although a weak positive effect of the PPT slides was found in the visit duration measure, it was not statistically significant. These mixed results might be attributed to reduced statistical power because of the use of sub-scores for either lecture or dialogue as dependent variables.
In the present study, we found that the presence of videos affected what test-taking strategies the participants used. Most test takers reported that they matched what they had seen in the PPT slides to the answer choices to find clues to an answer. In audio-only listening tests, matching aural input with answer choices without truly understanding the spoken texts to eliminate distractors is one of the most frequently used and effective test-wiseness strategies (Cohen, 2022; Lee & Winke, 2013). It is debatable whether or not to consider test-taking processes, such as matching visual information in a PPT slide with the answer options, as part of the listening test construct. If test takers used the visual information to match what they heard with a true understanding of the spoken text, it could be considered a valid test-management strategy (Cohen, 2007). However, if test takers simply matched the visual information to only “guess” the most seemingly relevant answer, it should be considered a test-wiseness strategy and a construct-irrelevant variance (Cohen, 2022). Based on this principle, we found that there were more participants (57%) who used test-management strategies, than those who used test-wiseness strategies (26%). Similarly, Suvorov (2018a) demonstrated how the design of the test (preview of questions and options) affected test takers’ use of test-management and test-wiseness strategies. Suvorov argued that test takers’ use of test-wiseness strategies introduced construct-irrelevant variance which had a significant impact on their test performance. On the other hand, Winke and Lim (2014) found no significant effect of the instruction of test-wiseness strategies on test takers’ listening performance. Whether test takers would employ test-wiseness strategies in a listening test, however, would depend on many factors, including the number of times the recordings are played and response types, for example, multiple choices, summary-cloze, and gap-filling (Winke & Lim). The inclusion of visual cues in a listening comprehension test would add further complexity to test takers’ decision-making. Extending the findings of Suvorov (2018a) and Winke and Lim (2014), the present study has provided novel evidence on what test-taking strategies are used by L2 learners and how effective they are.
Researchers of a few existing studies have warned that visual cues in a listening test can increase construct-irrelevant variance due to the increased chance of test takers using test-wiseness strategies (Buck, 2001; Ockey, 2007; Taylor & Geranpayeh, 2011). However, we demonstrated that test-wiseness strategies, for example, making random guessing based on the visual input, were hardly used by the test takers. Instead, we found that many test takers used the aural and visual channels in conjunction to achieve a better comprehension of the listening input.
We argue that processing multimodal input is an essential listening skill required in most real-life listening contexts and, therefore, video-based listening tasks are more authentic. However, we must acknowledge that individuals do not all have the same ability in processing multimodal input. As found in our study, some test takers viewed certain visual cues more often and longer than others, and the extent to which they benefitted from viewing the visual input also varied. Some learners are better than others at receiving and processing information from both aural and visual channels for better comprehension (see Mayer, 2009, 2022; Paivio, 1990). Audio-only listening tests restrict test takers who can process multimodal inputs from demonstrating fully their listening ability, while test takers who are less capable of multitasking or easily distracted by movements of visuals could be disadvantaged in video-based listening tests. It remains debatable whether an individual’s ability to engage with multimodal input should be considered as part of the construct or not in video-based listening tests (Suvorov, 2018b; Wagner, 2008). We believe that the positive comments from the participants about the benefits of processing both aural and visual information together for better test performance are plausible evidence to support the move toward video-based listening tests (Wagner, 2013). In an authentic listening situation, everyone uses visual information differently, and we found that this is also the case in a testing situation. In short, we believe that test takers’ abilities to process information presented in dual channels should be assessed in video-based listening comprehension tests (Field, 2011; Kellerman, 1992; Suvorov, 2018b; Wagner, 2013). Such abilities to use and process visual information can be considered one of the sociolinguistic competences because visuals provide social meaning and “rules of language use in context” (Canale & Swain, 1980, p. 16).
Limitations of the study
This study is not without limitations. The eye-movement data only provided information about test takers’ foveal vision (the visual area where test takers’ eyes are directed at), not their peripheral vision (the area surrounding the main foveal vision), mental attention, or perception (Bax, 2013; Suvorov, 2015; Yu et al., 2017). Although this was recommended, the size and location of the components of an item, such as the text and the images, were not precisely the same across different items and were not counterbalanced for practical reasons (Conklin & Pellicer-Sánchez, 2016). It should also be noted that the eye tracker operates with a sampling rate of 60 Hz, which might not provide the highest level of precision and accuracy of eye-movement metrics, especially at the adjacency of two AOIs. We also did not use any head stabilization device, which might have impacted the accuracy of recording the eye movements of some participants. To improve the quality of the eye-movement data, we instructed the participants to limit their head movement, following Godfroid’s guidance (2020), and used a relatively large computer screen (17.3 inches) to create a reasonably spatial distance between the sentences of answer choices. The distance between two adjacent sentences of answer choices is 15–20 mm on screen. However, it should be noted that we added margins to the sentences to draw the associated AOIs to compensate potential imprecision and inaccuracy in recording eye movements due to the low frequency of the eye tracker (TX2-60) we used. The smallest gap between these AOIs is 3 mm, and it was therefore possible that a small amount of fixations might have ended up on the gaps between AOIs. That said, the vast majority of fixations were, we believe, accurately recorded on the sentences of answer choices because the distance between sentences was sufficiently big. We would also like to point out that we did not look at gender and age as variables in our analysis. The participants in the present study were relatively younger than those in other similar studies; therefore, our findings may not be generalizable to other age groups.
Finally, we were not able to interview all participants due to time limitations. For practical reasons, we selected the interviewees immediately after the test at the field. This decision was made to maximize both the quantity and quality of data that we could collect immediately after the test while the participants could still remember what they did more clearly. If we had selected interviewees based on systematic analyses of their eye movements, there would have been a substantial delay in conducting the interviews because it takes a long time to process and analyse eye-movement data.
Suggestions for future research
Nevertheless, a video-based listening test should be carefully designed not to introduce unintended, construct-irrelevant variables. For example, Li (2013) warned that too much use of the texts in the PPT slides can turn the listening tasks into a “reading comprehension task” if the textual information in the PPT slides is too similar to the aural input (p. 117). It is also possible that providing too much textual information in a video prompt might be rather debilitating to test takers due to potential semantic overload.
Employing videos in listening tests can have a significant micro effect on individual candidate’s test preparation, and also a macro effect on language learning curricula. Findings of this study have shown that the introduction of videos in a listening test provides a more realistic listening experience that closely resembles the target language use domain and assesses candidates’ ability to perform more authentic listening tasks at the same time. Follow-up studies are required to investigate the feasibility of introducing new video-mediated listening item types, in addition to the more traditional multiple-choice or short answer format, to increase authenticity not only in task input but also in test methods.
Future studies also need to investigate how varying amounts of visual input in a video-based listening test might have differing effects on test-taking processes and performance. We propose that an updated construct of listening comprehension should include skills of interacting with visual and verbal cues. This proposal is in line with similar previous studies which called for a new “visual listening” construct (Batty, 2015, p. 18; Li, 2013; Suvorov, 2009, 2013, 2015; Suvorov & He, 2022). The interactive nature of computer technology today can help create more interactive “video-based listening comprehension” tests.
As alluded to in this paper’s introduction, we would also suggest that future studies on video-based listening comprehension tests would benefit from acknowledging the fact that multimodality is now a “concomitant of human communication” (Lotherington & Ronda, 2012, p. 107), and it is widely incorporated in language teaching and learning. Future studies on video-based listening comprehension tests would also benefit from acknowledging that visual modes, as one of the essential components of multimodal communication, can achieve three different types of interactions with linguistic modes: concurrence, when the visual modes convey the same meaning as the other modes; complementarity, when visual modes support other modes but also fill in gaps in meaning; and divergence, when meanings presented in visual modes are different from other modes. This kind of acknowledgement would help language testing specialists and educators not only broaden the theoretical framework and construct of video-based listening comprehension, but also bridge the gaps in the different attitudes towards the use of visual cues between L2 teaching, learning, and assessment.
Footnotes
Appendix 1
Test specification.
| No. | Type | Turns | Words | Duration (s) a | Type | Sources b |
|---|---|---|---|---|---|---|
| 1 | Dialogue | 3 | 24 | 8.08 | Inferencing | 2013 NELT #2 |
| 2 | Dialogue | 3 | 38 | 13.73 | Inferencing | 2014 NELT #2 |
| 3 | Dialogue | 10 | 138 | 54.25 | Detailed information | 2017 Sept Mock CSAT #8 |
| 4 | Dialogue | 12 | 144 | 62.42 | Detailed information | 2015 NELT #16 |
| 5 | Lecture | 1 | 120 | 58.79 | Main idea | 2014 NELT #4 |
| 6 | Lecture | 1 | 89 | 44.60 | Detailed information | 2013 NELT #4 |
| 7 | Dialogue | 12 | 122 | 42.88 | Inferencing | 2014 CSAT #11 |
| 8 | Dialogue | 10 | 112 | 47.09 | Detailed information | 2013 NELT #11 |
| 9 | Lecture | 1 | 111 | 54.45 | Main idea | 2013 NELT #6 |
| 10 | Dialogue | 10 | 129 | 53.40 | Inferencing | 2012 CSAT #16 |
| 11 | Dialogue | 12 | 101 | 36.89 | Inferencing | 2014 NELT #19 |
| 12 | Lecture | 1 | 115 | 59.92 | Main idea | 2016 June Mock CSAT #3 |
| 13 | Lecture | 1 | 105 | 57.57 | Detailed information | 2015 NELT #13 |
| 14 | Lecture | 1 | 159 | 90.26 | Main idea | 2017 June Mock CSAT #16 |
| 15 | Lecture | 1 | 151 | 85.50 | Detailed information | 2014 NELT #7 |
Note: NELT = National English Listening Test; CSAT = College Scholastic Ability Test.
Total duration of the test: 12 min 50 s (excluding the practice item and the instruction).
All retired NELT items can be found at Educational Broadcasting System website: https://www.ebsi.co.kr/ebs/pot/potg/EnglishListening01.ebs?targetCd=PM02&seriesGrpNo=0. All retired CSAT and mock CSAT items can be found at Korea Institute for Curriculum and Evaluation website: https://www.suneung.re.kr/boardCnts/list.do?boardID=1500234&m=0403&s=suneung&searchStr=
Appendix 2
Video configuration.
| Item no. | No. of visual cues | Descriptions of the visual cues (number of visual cues) | Type of visual |
|---|---|---|---|
| 1 | 5 | Two speakers facing each other (2), corridor background, a notice board on the wall (not readable) | Context |
| 2 | 3 | Two speakers facing each other (2), a print/copy machine (1) | Context |
| 3 | 4 | Two speakers sitting at a desk (2), papers and pens on the desk (1), a small lecture room background (1) | Context |
| 4 | 6 | Two speakers sitting at a desk (2), papers and pens on the desk (1), a laptop (1), books (1), a small lecture room background (1) | Context |
| 5 | 7 | A male lecturer (1), PPT slides projected on a TV screen (5), a small lecture room background (1) | Context, content |
| 6 | 6 | A male lecturer (1), PPT slides projected on a TV screen (4), a small lecture room background (1) | Context, content |
| 7 | 4 | Two speakers sitting at a table facing each other (2), corridor background (1), the male speaker holding a zoo leaflet (word zoo is readable) (1) | Context, content |
| 8 | 4 | Two speakers facing each other (2), the female speaker holding a paper (test results) (1), a small lecture room background (1) | Context, content |
| 9 | 6 | A male lecturer (1), PPT slides projected on a TV screen (4), a small lecture room background (1) | Context, content |
| 10 | 4 | Two speakers sitting at a table facing each other (2), corridor background (1), the male speaker holding a facial cream (1) | Context, content |
| 11 | 4 | Two speakers facing each other (2), corridor background (1), the female speaker holding a book (1) | Context, content |
| 12 | 7 | A male lecturer (1), PPT slides projected on a TV screen (5), a small lecture room background (1) | Context, content |
| 13 | 8 | A female lecturer (1), PPT slides projected on a TV screen (6), a small lecture room background (1) | Context, content |
| 14 | 6 | A female lecturer (1), PPT slides projected on a TV screen (4), a small lecture room background (1) | Context, content |
| 15 | 8 | A male lecturer (1), PPT slides projected on a TV screen (6), a small lecture room background (1) | Context, content |
Note: Content visual cues are in italics. PPT = PowerPoint presentation; TV= television.
Appendix 3
Descriptions of the PPT slides.
| Item no. | No. of keywords or images | Keywords or images appeared in the PPT slide | Associated aural input |
|---|---|---|---|
| 5 | 5 | (IMG) A group of people cycling on a street | Many people say cycling is better for your health than walking because it increases your heart rate and engages all the major muscles. |
| (IMG) A man wearing a helmet | First, put on a bicycle helmet. A head injury can lead to brain damage. That’s why it’s so important to wear a helmet. | ||
| (IMG) A reflective vest | It’s also a good idea to wear bright clothes. | ||
| (IMG) A reflector on a bike | Put reflectors on your bike. | ||
| (IMG) A lady cycling with a headphone on | Also, avoid wearing headphones while cycling because the music will keep you from hearing sounds around you, such as drivers’ honking their horns. | ||
| 6 | 4 | (IMG) A website screenshot | As you know, we have been using idea.com to post assignments and other information about this course. |
| (TEXT) “Idea.com” | However, idea.com has notified their users that they’ll start charging rather expensive fees to use the site. | ||
| (IMG) Another website screenshot | So I’ve decided to change the site we’ll use for assignments to class.com. | ||
| (TEXT) “Class.com” | |||
| 9 | 4 | (IMG) A note-taking hand | That’s why an effective note-taking strategy is essential for your studies. Taking notes will not only help you recognize important ideas, but also help you remember what you hear in class. |
| (IMG) A group of students listening to a lecture | |||
| 12 | 5 | (TEXT) “Introduction to Veterinary science. Unit 5. Communication through tails. February 27th, 2017” | Hello, students! Last class, we studied the functions of insects’ wings. Today, we’re going to move on to look at some functions of animals’ tails. |
| (IMG) A dog wagging its tail | As you know, dogs can wag their tails to show that they’re happy. | ||
| (IMG) A horse’s tail | For example, horses use theirs to keep harmful insects away. | ||
| (IMG) A crocodile’s tail | Crocodiles defend themselves from attackers using their tails as weapons. | ||
| (IMG) A squirrel | Squirrels use their tails to keep balance. | ||
| (IMG) A monkey | Monkeys can hold on to trees with theirs. | ||
| 13 | 6 | (IMG) Brazil nuts | Are you familiar with Brazil nuts? |
| (IMG) A large Brazil nut tree in a jungle | Brazil nuts come from giant trees that grow in the Amazon jungle. | ||
| (IMG) Half-moon-shaped Brazil nut seeds | Brazil nuts are half-moon-shaped eatable seeds. | ||
| (TEXT) Protein, fibre, vitamin E, fat | They are surprisingly effective in fighting cancer. They also offer protein, fibre, and vitamin E. Besides for our health, they are a good source of fats. | ||
| (IMG) A nut cracker | Brazil nuts are tough to crack, so if you buy them unshelled, you’ll need a nut cracker. | ||
| 14 | 4 | (IMG) A bank with blue wall | Banks and insurance companies use blue to gain trust |
| (IMG) A hotel lobby with green decorations | Think of hotel lobbies. Many of them use green in some way. | ||
| (IMG) A hospital (waiting room and doctor’s room) with pink wall and decorations | Waiting rooms in hospitals are often painted this colour. | ||
| (IMG) A large office room with grey carpet and walls | That’s why grey is the most commonly used colour in offices. | ||
| 15 | 6 | (TEXT) “Hemlock” | Today, we’re going to focus on one of the most poisonous plants in North America: hemlock. |
| (IMG) A bunch of hemlocks | |||
| (IMG) A fence with a danger sign | |||
| (IMG) A leaf of hemlock and a leaf of parsley | It can be confused with other harmless plants. It resembles the edible plant, parsley. | ||
| (IMG) A man’s face with paralysis | The toxic chemical in hemlock causes paralysis. | ||
| (IMG) A man holding his chest | Makes it hard for the victim to breathe. |
Appendix 4
Participant’s baseline listening test (NELT) score (max = 20).
| No. | Participant ID | NELT score | No. | Participant ID | NELT score |
|---|---|---|---|---|---|
| 1 | BC020201 | 18 | 30 | PJ020226 | 17 |
| 2 | BC020205 | 18 | 31 | PJ020228 | 14 |
| 3 | BC020307 | 20 | 32 | PJ020231 | 15 |
| 4 | BC020407 | 20 | 33 | PJ020234 | 19 |
| 5 | BC030201 | 19 | 34 | PJ020403 | 15 |
| 6 | BC030309 | 19 | 35 | PJ020406 | 16 |
| 7 | IC030304 | 17 | 36 | PJ020420 | 20 |
| 8 | IC030307 | 19 | 37 | PJ020422 | 18 |
| 9 | IC030310 | 16 | 38 | PJ020431 | 18 |
| 10 | IC030311 | 15 | 39 | PJ020434 | 20 |
| 11 | IC030316 | 12 | 40 | PJ020435 | 8 |
| 12 | IC030320 | 18 | 41 | PJ020614 | 18 |
| 13 | IC030326 | 15 | 42 | PJ020621 | 20 |
| 14 | IC030332 | 14 | 43 | PJ020623 | 16 |
| 15 | IC030337 | 19 | 44 | PJ020814 | 14 |
| 16 | IC030914 | 18 | 45 | PJ020819 | 14 |
| 17 | IC030930 | 20 | 46 | PJ020820 | 10 |
| 18 | JJ010908 | 20 | 47 | PJ020828 | 11 |
| 19 | JJ010911 | 19 | 48 | PJ020830 | 20 |
| 20 | JJ010914 | 19 | 49 | PJ020832 | 18 |
| 21 | JJ010915 | 20 | 50 | SC010426 | 20 |
| 22 | JJ010917 | 19 | 51 | SC010427 | 16 |
| 23 | JJ010918 | 18 | 52 | SC010523 | 15 |
| 24 | JJ010920 | 19 | 53 | SC010610 | 18 |
| 25 | JJ010923 | 20 | 54 | SC010623 | 6 |
| 26 | JJ010931 | 20 | 55 | SC020219 | 7 |
| 27 | JJ010932 | 18 | 56 | SC020231 | 15 |
| 28 | PJ020133 | 19 | 57 | SC020317 | 7 |
| 29 | PJ020219 | 17 | M (SD) | 16.67 (3.58) | |
Note: NELT = National English Listening Test.
Acknowledgements
This paper was based on the first author’s unpublished PhD dissertation at University of Bristol. The second author was the lead supervisor of the dissertation project. The authors would like to thank British Council for its Assessment Research Award, which allowed them to complete this project in a timely manner, the anonymous reviewers, and Professor Paula Winke for their insightful feedback and suggestions, which have significantly contributed to enhancing the quality of this article. They also thank Professor William Browne for his invaluable support and encouragement throughout this project.
Author contributions
Declaration of conflicting interests
The authors declared no potential conflicts of interest with respect to the research, authorship, and/or publication of this article.
Funding
The authors disclosed receipt of the following financial support for the research, authorship, and/or publication of this article: This dissertation project was supported by a British Council Assessment Research Award to the first author in 2016.