
Abstract
This controlled experimental study investigated the interaction of variables associated with rating the pronunciation component of high-stakes English-language-speaking tests such as IELTS and TOEFL iBT. One hundred experienced raters who were all either familiar or unfamiliar with Brazilian-accented English or Papua New Guinean Tok Pisin-accented English, respectively, were presented with speech samples in audio-only or audio-visual mode. Two-way ordinal regression with post hoc pairwise comparisons found that the presentation mode interacted significantly with accent familiarity to increase comprehensibility ratings (χ² = 88.005, df = 3, p < .0001), with presentation mode having a stronger effect in the interaction than accent familiarity (χ² = 59.328, df = 1, p < .0001). Based on odds ratios, raters were significantly more likely to score comprehensibility higher when the presentation mode was audio-visual (compared to audio-only) for both the unfamiliar (91% more likely) and familiar speakers (92.3% more likely). The results suggest that semi-direct speaking tests using audio-only or audio-visual modes of presentation should be evaluated through research to ascertain how accent familiarity and presentation mode interact to variably affect comprehensibility ratings. Such research may be beneficial to investigate the virtual modes of speaking test delivery that have emerged post-COVID-19.
Keywords
Introduction
Research in applied linguistics, speech science and neurolinguistics suggests that a foreign accent is easier to comprehend if the listener is familiar with that accent, and increased exposure to foreign accents increases accent familiarity over time (Adank et al., 2009; Bent & Bradlow, 2003; Bradlow & Bent, 2008; Gass & Varonis, 1984; Kraut & Wulff, 2013; Kuhl, 1991; Perry et al., 2018). Within English language-speaking testing contexts, some behavioural studies have provided evidence that the degree to which raters are familiar with the test-taker’s accent could influence their pronunciation rating scores (K. C. Browne, 2016; K. Browne & Fulcher, 2016; Carey et al., 2011; Carey & Mannell, 2009; Winke et al., 2013; Winke & Gass, 2013). This potential construct-irrelevant variable in speaking test ratings has been referred to in prior studies as accent familiarity bias.
Another variable which could affect the rating process is the Presentation Mode of the speaking test (audio-only versus audio-visual presentation of test-takers’ speaking performance to raters) (Nakatsuhara et al., 2021). Presentation mode can potentially interact with accent familiarity bias in two formats of speaking tests: face-to-face direct tests (in-person and virtual) and asynchronous semi-direct tests (audio-only). In the current study, we reference two widely used international standardised tests of English proficiency: IELTS and TOEFL iBT. The IELTS speaking test format is an (audio-visual) face-to-face interview, rated synchronously by an interlocutor during the interview (in-person, or by real-time videoconferencing), and TOEFL iBT is rated asynchronously by multiple raters listening to audio files (audio-only).
The impact of accent familiarity on comprehensibility rating
Several studies have tested the assumption that rater familiarity with a test-taker’s accent has the potential to bias speaking test ratings. The studies vary by the adopted familiarity scales, research methods, and focus language skill (speaking or listening), creating a general impression of mixed findings. Some prior speaking test studies constructed accent familiarity based on the raters and speakers sharing their first language (L1), also known as the shared L1 advantage (e.g., A. Brown, 1995; Xi & Mollaun, 2009), whereas in other studies, accent familiarity was based on the raters previously studying the speakers’ L1 as a second language L2, for example, Winke et al. (2013).
Assuming accent familiarity requires exposure to L2 speech, a rater who shares a test-takers’ L1, or, alternatively, has learned their language as an L2 has not necessarily had extensive exposure to the test-taker’s variety of L2-accented English because communication could occur solely in the test-taker’s L1, not English. Miao (2023) examined this relationship between accent familiarity, a shared L1, and comprehensibility in a path analysis study involving 302 L2 English listeners. Shared L1 had a direct effect on accent familiarity, and accent familiarity had a direct effect on comprehensibility, but a shared L1 did not predict comprehensibility when accent familiarity was controlled for. This suggests that the two constructs are related but should be treated as separate constructs. The findings also suggest that accent familiarity is a predictor of comprehensibility but shared L1 is not. Therefore, in the current study, it is appropriate that the measurement of accent familiarity is based on the rater’s exposure to the speaker’s accent. The shared L1 advantage is assumed to be a different construct, and one that has a smaller effect than accent familiarity on comprehensibility (e.g., Winke et al., 2013) so is not investigated in the current study.
Although the current study investigates raters’ comprehensibility ratings of L2 speech with a speaking test-like rubric, test-takers’ comprehension of various accents presented in listening comprehension tests also have relatable findings. Some studies have found that unfamiliar L2 accents have a negative effect on listening comprehension. For example, Harding’s (2012) Differential Item Functioning analyses found a shared L1 bias effect for 70 Mandarin Chinese L1 participants across several items on the UTESL (University Test of English as a second language) listening sub-test. The UTESL is an academic English proficiency test developed by the Language Testing Research Centre at the University of Melbourne, Australia. Other studies found no significant effects of accent familiarity on listeners’ comprehension (e.g., Kennedy & Trofimovich, 2008).
Kang et al. (2019) examined the effect of presenting listening test participants with international English accents (6 inner, 6 outer, and 6 expanding circle accents) in a simulated TOEFL listening comprehension test. Results pertaining to a shared L1 advantage were inconclusive, but significantly higher comprehension scores were associated with listening to the more comprehensible speakers within the three accent groups. In another study, Kang et al. (2023) recruited speakers from four English accent varieties (Chinese, Spanish, Indian English [Hindi], and Korean) that produced speech samples for “yes/no” vocabulary (Harrington & Carey, 2009) and Duolingo dictation listening tasks. This time the findings revealed a shared L1 advantage, comparable test scores between shared-L1 and inner-circle L1 accents, and no significant differences in listening performance scores across highly intelligible accent varieties.
To focus our review on the studies most comparable to our present study, we limited the review criteria to L2 speech familiarity studies that used simulated speaking test tasks and employed quantitative or mixed methods. Supplemental Appendix 1 1 summarises nine studies published between 2000 and 2023 that investigate accent familiarity as a predictor of comprehensibility ratings in speaking tests (some also investigate intelligibility). Like our present study, most of these prior studies, except for K. Browne and Fulcher (2016) and Xu et al. (2023), adopted Derwing and Munro’s (1997) or Munro and Derwing’s (2015) comprehensibility definition: “[a] perceived degree of difficulty experienced by the listener in understanding speech” (p. 14). The complementary construct of intelligibility, again based on Munro and Derwing’s definition, is the “extent to which listeners’ perceptions match speakers’ intentions (actual understanding)” (p. 14). Comprehensibility is operationalised by measuring listeners’ understanding of speakers’ utterances on a scale; intelligibility is operationalised by measuring listeners’ accuracy in performing a transcription task after listening to L2 speakers’ utterances.
Some L2 speech familiarity studies have found that accent familiarity is significantly associated with comprehensibility ratings, whereas others have detected no such relationship. However, some of the studies that found no significant relationship have substantial design issues or clear differences in their design compared to the ones reviewed more fully in this section. For example, three of the studies that found no significant main effect or interaction between accent familiarity and comprehensibility used ordinal rating scale scores as a dependent variable in an ANOVA analysis; however, the ANOVA assumption requires a ratio or interval scale as the dependent variable. The rater sample sizes in these studies were also small, ranging from 38 to 66 raters, making the results prone to type II error (false-negative result), unless the effect size is substantial and the variability is low.
The studies that did find a significant relationship between accent familiarity and comprehensibility used many-facet Rasch measurement (MFRM) or logistic regression with an ordinal scale and descriptors at each level (i.e., a rubric). These methods do not face the same issue encountered as when using an ordinal scale with an ANOVA, because they are designed to accommodate the ordinal nature of the data through the utilization of log transformations and appropriate statistical frameworks.
We now elaborate on three quantitative studies investigating the effects of accent familiarity on ratings of speaking, involving the use of high-stakes proficiency tests and raters who had been exposed to a variety of accents; in one study the raters were also accredited examiners. Carey et al.’s (2009, 2011) early study, involved 99 accredited IELTS examiners and officially pre-rated Indian, Korean, and Chinese test-takers’ IELTS speaking performances with a pronunciation score of 6 on IELTS 4-level speaking subscale used pre-2008. Two rater groups were in predominantly English-speaking countries (Australia and New Zealand) and the other three were in India, Korea, and Hong Kong. The raters in the Indian centre were all Indian-born, while the other test centres had predominantly (91%) native speaker (NS) raters. The raters’ accent familiarity with Indian-, Korean-, and Chinese-accented English test-takers was defined on the basis of exposure and experience in two ways: the raters residing in the same country as the test-takers; the raters’ self-identification of prolonged versus no prolonged exposure to the three English as an L2 accents. Odds ratios calculated using logistic regression indicated that raters located at the same site as the test-takers, and those with prolonged exposure, were significantly more likely to assign higher scores for pronunciation (i.e., scores of 6 or 8 were more likely than 2 or 4).
In a similar study on TOEFL iBT, Winke et al. (2013) recruited 107 raters with experience of studying an L2. Most were undergraduate students at a US university who completed a four-hour online rater training course provided by Educational Testing Service (ETS) as part of the study. They then rated 72 audio recordings of 72 test-takers provided by ETS. The classification of accent familiarity was that the speaking test raters had learned the test-taker’s L1 (Spanish, Korean, or Chinese) in contrast to those who had not. Rater bias analysis conducted with MFRM showed that the raters with L2 backgrounds in Spanish or Chinese were significantly more lenient with test-takers whose L1s were familiar (p = .01), based on the raters having studied their language as an L2. However, effect sizes only accounted for one percent of variance. Significant biases were not found for the L2 Korean raters for L1 Korean test-takers, but the researchers noted that the absence of evidence of bias may have been due to the small size of the Korean L2 rater subgroup (n = 11). The researchers concluded that although the raters’ language learning background did not have a large impact on the scores, accent familiarity is a potential threat to the validity of the test.
Another study (K. C. Browne, 2016; K. Browne & Fulcher, 2016) used MFRM with Spanish, Korean, and Dhivehi-accented English; Dhivehi is spoken in the Maldives. The raters (n = 190), who were recruited online, were either English language teachers or professionals working in the field of applied linguistics from 35 different countries. Most were native speakers of English (n = 137), and some were from Spain (n = 5) and the Maldives (n = 6), thus the nonnative speaker raters’ accent familiarity was established with the test-takers’ accent based on their shared L1. Raters’ accent familiarity significantly correlated with pronunciation scores, with effect sizes accounting for 15 percent of variance. Raters who were very familiar with the test-takers’ accent showed a high level of positive bias, and the researchers concluded that accent familiarity is a serious threat to pronunciation assessment.
These accent familiarity studies investigated the effect of accent familiarity on rating by presenting raters with multiple accents as stimuli, some of which were familiar to the raters, while others were unfamiliar. Using multiple accents extends the generalisability of the study; however, in designs that use multiple accents as stimuli, it is possible that accent familiarity may be unequally represented, making accent familiarity difficult to measure reliably (Carey et al., 2011). That is, some raters might be familiar with most of the accents presented and some might be unfamiliar with only a few of them. An alternative to using multiple stimulus speakers, with whom raters have varying levels of accent familiarity, is to make the accent familiarity variable a fixed factor comprised of two categories represented by one speaker who is familiar to all raters, and another speaker who is unfamiliar to all raters. The present study adopted this controlled approach.
The next section will overview the other variable of interest which could affect the rating process in speaking tests: the presentation mode of the test-takers’ speaking performance (audio-only versus audio-visual).
Presentation mode as a potential source of bias
It is well-established in the speech science literature that speech perception is more than an auditory exercise; the human brain processes multisensory input through a process called multisensory integration (Belin et al., 2004). Multisensory integration refers to the process by which information from different sensory modalities, such as vision, hearing, touch, taste, and smell, is combined and coordinated by the brain to create a unified perceptual experience.
The integration of the auditory and visual modalities, when manipulated, can create variability in speech perception. A growing body of research has shown that the absence or presence and the type of visual cues provided to a listener can affect speech perception. For example, Tsunemoto et al. (2021) investigated how the presentation or non-presentation of visual cues, such as facial movements and hand gestures, affect the assessment of L2 speech. The researchers recruited 60 university students, who rated 20 L2 English speakers’ (10 Chinese, 10 Spanish) personal story narrations using a 1000-point sliding scale for each of comprehensibility, accentedness, and fluency. The raters were randomly assigned group (a) watched the video with only the speaker’s still image, (b) saw a still image of the speaker’s torso with a dynamic face, and (c) watched the dynamic torso and face of the speaker. Linear mixed-effects modelling showed that raters who had access to the dynamic torso and face of the speaker tended to rate the speaker as more comprehensible and significantly less accented than those who had access to less visually informative conditions.
Burton (2023) highlights that test constructs primarily focus on linguistic and verbalised aspects of speech, with little consideration given to nonverbal behaviour in the test construct or scoring criteria. As nonverbal behaviour, such as gestures and expressions, can convey important socio-cognitive states and traits during speech interactions (McNeill, 2005), ignoring the nonverbal components of communication in tests could lead to construct underrepresentation in speaking tests (Plough, 2021).
With the impost of COVID-19 on language testing, stakeholders are now using or considering various alternatives to conventional audio-only, or face-to-face test delivery modes such as videoconferencing (Zhang & Isaacs, 2022). Studies are emerging that investigate their construct validity. Choi (2022), for example, investigated 110 test-takers with eight raters using three modes: audio-only, synchronous video with an interlocutor on Zoom, and asynchronous video recorded without an interlocutor. MFRM results showed that audio-only scores were lower than both video formats; video modes were similar in difficulty.
Various listener background factors, aside from accent familiarity, are thought to contribute to a negative comprehensibility or intelligibility response, including educational background, prior language teaching experience, and attitudes or beliefs concerning racial identity or social class (Lindemann & Subtirelu, 2013; Mohammadreza & Kang, 2019). Using the matched guise technique, Rubin (1992) found that college students in the United States perceived an American English L1 speaker presenting a lecture as significantly more unintelligible when the audio was played with an accompanying photograph of an Asian lecturer, as opposed to another group which was shown a picture of a Caucasian lecturer with the same audio. This effect, wherein listeners “hear” the pronunciation they expect to hear, seemingly disregarding the properties of the acoustic signal, has been termed reverse linguistic stereotyping (RLS). The RLS effect has been identified in subsequent studies (e.g., Rubin, 2012), but few have emulated the speech testing context; a rare example is Gilchrist and Chevrot (2017).
In addition to methodological differences across studies (e.g., operationalisation of comprehensibility and intelligibility, which can limit comparability; Lindemann & Subtirelu, 2013), one limitation of RLS studies is that the experimental condition of static image cues to identity, and using naive listeners, is not generalisable to other contexts. Listeners may not always draw upon attitudes and beliefs to prime their perception of the speech signal, especially when the listener is a trained speaking test rater. The findings may also not be generalisable to contexts whereby the visual cues are dynamic facial movements and hand gestures and not static images.
A large body of research suggests that integrating auditory cues and visual cues can enhance speech perception, especially in challenging listening conditions (Ross et al., 2007) or when the speech is accented (McLaughlin et al., 2022). There is evidence that both seeing and hearing the talker improves speech perception at the level of syllables (Sommers et al., 2005) and continuous speech (Tye-Murray et al., 2016). In the speech perception literature, the perceptual advantage of hearing and seeing a talker is called the audiovisual benefit. Most speech perception research into the audiovisual benefit has been conducted on native speech perception; comparatively little has been done on L2 speech (McLaughlin et al., 2022). One study has found that NS listeners benefit less from visual information when it accompanies L2 speech than when it accompanies L1 speech (Yi et al., 2013). Yi et al. (2013) found a reduced audiovisual benefit for comprehension of Korean-accented English relative to NS-accented American English (for NS listeners), concluding that this difference in benefit was related to the monolingual NS participants’ implicit racial biases.
In a meta-analysis of 122 studies (Greenwald et al., 2009), the Yi et al. (2013) study was criticised because the implicit association test method used to measure bias had poor test-retest reliability and yielded a small average effect size of r = .27. Yi et al. had a small sample size (n = 19) and claimed an effect size for the implicit racial bias in the audiovisual integration of speech of r = .48. McLaughlin et al. (2022) replicated Yi’s study design with a greater number of participants (n = 291) (based on an estimate of 90% power to detect an effect size of r = .20) and mixed racial composition, including Asian (n = 25), Black or African American (n = 33), Hispanic/Latinx (n = 6), mixed race (n = 25) and “White” (n = 170). McLaughlin et al. found that audiovisual benefit was smaller for L2 relative to L1 speech, but the results did not support Yi et al.’s (2013) conclusion that implicit racial biases were related to differences in audiovisual benefit between L1 and L2 speech. Alternative accounts the researchers reported for the reduced audiovisual benefit for L2 speakers were: 1) the increased cognitive demands (V. A. Brown et al., 2020; McLaughlin & Van Engen, 2020) associated with a slower processing rate (Adank et al., 2009) of nonnative speech negatively affected audiovisual integration; 2) possible misalignment of visual cues and the sounds the listeners expected to hear in the L2 speech (their L1 phonetic prototypes), leading to difficulties in audiovisual integration, or 3) listeners with greater racial biases likely have less exposure to L2 speakers; therefore, a lack of accent familiarity, not necessarily racial bias, may have limited their ability to process the audiovisual speech.
Considering these alternative accounts for the reduced audiovisual benefit for L2 speech, we hypothesised that the audio-visual Presentation Mode in our study would likely have a positive influence on raters’ comprehensibility judgements. This is because, according to Rubin (2012), the experienced teachers we recruited are likely to be more lenient in rating decisions than naive listeners: [Reverse linguistic stereotyping] works in two directions; distorted expectations of [nonnative] speech performance can be positive as well as negative. Thus, those of us who spend a great deal of our time interacting with [nonnative speakers] as colleagues or students may be liable to exercise rather lenient criteria for what is comprehensible and what is not, relative to criteria utilized by a preponderance of speakers of the mainstream variety (p.14).
Audiovisual cues and background information in speech testing
Notably, the high-stakes tests IELTS and TOEFL iBT diverge regarding the effect that facial cues and sociocultural background information may have on rater cognition. The traditional IELTS is a direct speaking test with an accredited examiner who confirms the candidate’s name, age, sex, and nationality at the beginning of the test. Conversely, the TOEFL iBT is a semi-direct test rated asynchronously using digital audio recordings of candidates’ speaking performances, with no identifying information about test-takers’ background provided to the raters.
The TOEFL iBT speaking test controls inter-rater variability by using multiple raters to assess each speech sample. In the current version of the website, Educational Testing Service (ETS, 2022) states: The Speaking . . . sections are scored by a combination of automated AI scoring and multiple, highly trained human raters to. . .minimize the rater bias that can occur with face-to-face interviews; ensure consistency and the highest quality.
However, while multiple raters could minimise rater bias, this might not eliminate the risk of accent familiarity bias if some accents are vastly more familiar to raters than others. In addition, regarding face-to-face (audio-visual) versus asynchronous (audio-only) modes of presentation, more research is required to determine if the presence or absence of speaker visual cues influences rating decisions.
The effect of the presence or absence of visual cues was investigated in Nakatsuhara et al.’s (2021) IELTS-funded study exploring different rating conditions following the COVID-19 pandemic: live, audio-only and audio-visual. Six accredited examiners assessed 36 test-takers from five language backgrounds with varying proficiency (range: bands 3 to 8). An MFRM analysis revealed that audio-only ratings yielded significantly lower scores than live and audio-visual ratings for all IELTS speaking subscales, including pronunciation, suggesting a positive rating bias for the live and audio-visual modes. No differences between audio-visual and live rating modes were detected for pronunciation. This is the only IELTS study to date that has explicitly examined the audio-visual presentation mode. The TOEFL iBT studies (K. C. Browne, 2016; K. Browne & Fulcher, 2016; Winke et al., 2013) examined the audio-only mode of test candidate speech presentation used in that test. Our present study fills this gap and extends prior accent familiarity research by investigating the interaction between accent familiarity and audio-only versus audio-visual presentation modes.
As we have constructed a novel comprehensibility rating scale to investigate rater behaviour in this experimental study, we first evaluated rating quality with a Rasch analysis (Linacre, 2022a). Our research questions were the following:
Is there an interaction between Accent Familiarity (unfamiliar/familiar) and Presentation Mode (audio-only/audio-visual)?
If an interaction is found, what is the relative contribution of the variables to the Comprehensibility rating?
Methodology
Study design considerations
This controlled, experimental study investigates the effects of two previously but separately identified sources of potential rater bias in speaking tests: Accent Familiarity and Presentation Mode in relation to Comprehensibility (dependent variable). Accent Familiarity (independent variable) was controlled by making it a fixed factor (i.e., a controlled variable for which the levels are set by the experimenter). This involved pre-selecting raters who were familiar with one representative L2 English accent and unfamiliar with the other. In addition to the Accent Familiarity fixed factor, Presentation Mode was a fixed factor; half of the stimulus recordings were created and presented in audio-visual mode and half in audio-only mode. Four facets were created by combining an Accent Familiarity factor (familiar/unfamiliar) with a Presentation Mode factor (audio-only/audio-visual), resulting in familiar/audio-only; familiar/audio-visual; unfamiliar/audio-only; unfamiliar/audio-visual. Therefore, this study examined rater behaviour when assessing the comprehensibility of speakers whose accent is familiar or unfamiliar, in two presentation modes: audio-only (with no speaker background information) and audio-visual (with speaker background information). Accent Familiarity was operationalised as raters’ perceived level of exposure to the test-taker’s L2-accented version of English following (Carey et al., 2011; Carey & Mannell, 2009) and K. C. Browne (2016). In our binary familiarity factor, exposure-based design, categorising accent unfamiliarity is a simpler task than categorising accent familiarity. If a listener has never been exposed to a particular L2-accented version of English, they are (due to their lack of exposure) unfamiliar with it.
Rater sampling and recruitment
A post hoc estimation of the required sample size for the ordinal logistic regression procedure used in this study was calculated by estimating the minimum sample size to avoid overfitting. We did this by applying Peduzzi et al.’s (1996) rule-of-thumb that the sample size should be at least 10 times larger than the number of predictor variables (n = 2), multiplied by the number of categories in the outcome variable (n = 5), to ensure that there are sufficient cases for each combination of predictor variables (10 × 2 × 5 = 100). Note that other studies suggest this rule of thumb is too conservative and the minimum required sample size may be less (Vittinghoff & McCulloch, 2007). Therefore, the conservative estimated required sample size used in this study was 100 raters.
We used purposive and criterion-referenced rater sampling. Therefore, generalisability of findings to authentic test environments was not an expectation. We focused solely on the Australian context, rather than sampling from different international contexts, to maintain greater control of rater characteristics. To elaborate, one geographical context constrains variation in exposure to L2 speech, which makes the Accent Familiarity variable more consistent between raters.
The rater recruitment survey (Supplemental Appendix 2) screened prospective raters against initial selection criteria: native English speaker, ELICOS and speaking assessment experience. The final number of raters who accepted the invitation to participate met our target sample size of 100 participants (female = 61; male = 39). The participants were either Australian-born native speakers (n = 64) or were from other inner-circle (n = 34) or outer circle (n = 2) English-speaking countries, but all were native speakers, answering “yes” to survey question 1) “Did you acquire English in early childhood? (Before the age of 3).” Raters who were not Australian-born had more than two years of experience teaching English in Australia, so the raters’ perceptual phonetic prototypes (Johnson, 1997) were either exclusively Australian English, or included Australian English. Perceptual phonetic prototype is the linguistic term widely used to refer to the central or most representative exemplar within a category of speech sounds. All 100 raters self-reported over two years of ELICOS teaching and had experience conducting test preparation courses and speaking tests (35% in high-stakes testing), so they were experienced with using speaking test rubrics. The raters were recruited via email invitations sent to Australian English language schools. Prospective raters without recent teaching experience were not included as participants in this study, as familiarity with accents, stored in memory as perceptual phonetic prototypes, lost their strength over time (Johnson, 1997).
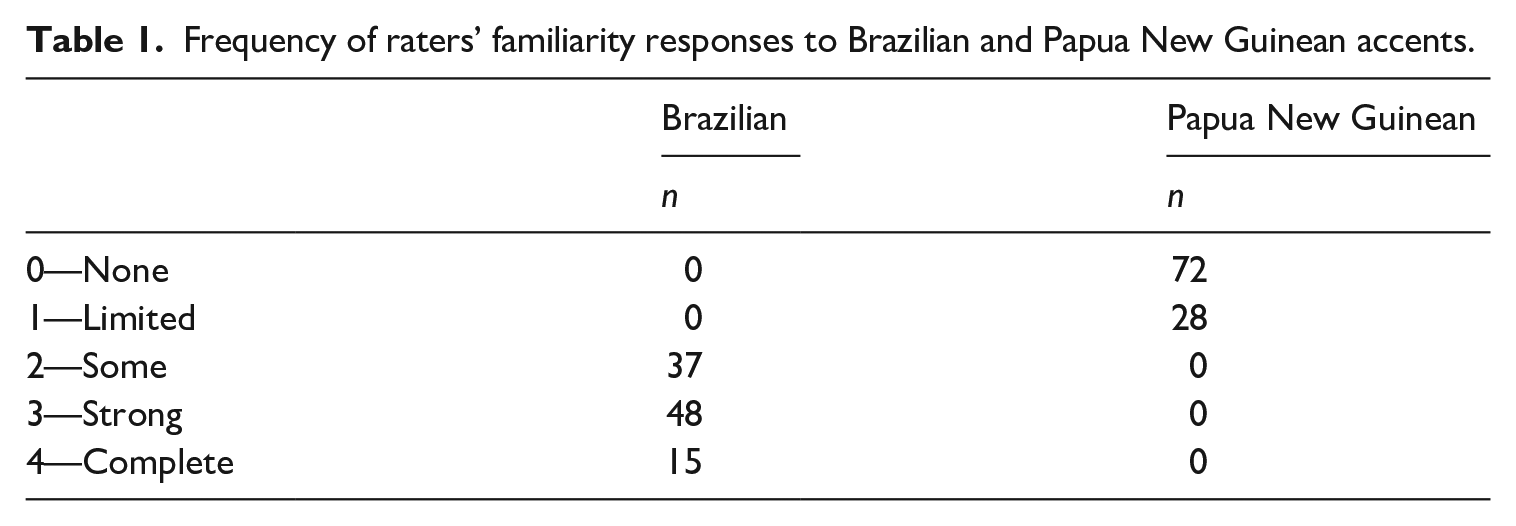
A five-point survey scale (Supplemental Appendix 3) was used to measure raters’ Accent Familiarity in response to the question, “How would you [rater] describe your overall familiarity with the following accents?” Responses of “2” (some familiarity), “3” (strong), or “4” (complete) were required for a designation of being familiar with an interlanguage. Responses of “0” (none) or “1” (limited) “you have heard speakers of this accent but cannot recall its features” were designated unfamiliar. Eight raters were excluded based on their familiarity scores being below 2 for Brazilian Portuguese-accented English. Frequency of raters’ familiarity responses to Brazilian and PNG accents is presented in Table 1.
Frequency of raters’ familiarity responses to Brazilian and Papua New Guinean accents.
Materials
Speech sample stimuli development
To create speech sample stimuli, we used low predictability read sentences from the L2-ARCTIC database, a corpus of L2 English speech used for research into speech synthesis and speech recognition applications (e.g., voice conversion, mispronunciation detection; Zhao et al., 2008). We chose low predictability sentences (Supplemental Appendix 4) such as “We must achieve our own salvation” (the Papua New Guinean speaker pronounced /əˈtʃiːv/ as [əˈtʃiv]) because high-predictability sentences such as “Please take a seat next to me” could introduce unwanted variability, whereby some but not all raters use semantic cues present in the utterances to perceptually repair mispronunciations (i.e., “seat” is recoverable from context if the speaker said “sit”).
Initially, three potentially unfamiliar speakers born in the Philippines, Mongolia, and Papua New Guinea were identified. In the pre-recording procedure, they provided a short recording on their phones by audio recording read-aloud sentences. These recordings helped to identify that one of the speakers was below and one was above the desired proficiency level; only the Papua New Guinean speaker (L1 Tok Pisin) was selected as suitable for recording speech stimuli. This speaker was then matched with potential familiar speakers based mainly on the equivalence of their IELTS speaking scores and an auditory assessment of their L2 pronunciation proficiency determined by the first author, an accredited IELTS examiner and phonetician. Subsequently, six familiar speakers were recruited to participate in the final recordings following screening. The familiar speakers (age M = 28, SD = 3) provided IELTS certificates as evidence of their IELTS speaking scores (range: 6.5–7) (Supplemental Appendix 5). Their nationality, gender, and age were the following: Arabic, M, 29; Japanese, F, 25; Mandarin, F, 32; Korean, F, 24; Brazilian, F, 31; Colombian, M, 28.
Recording sessions were conducted in a sound-treated audiovisual studio using a Sony PMW350 XDCAM EX HD camera and a Sony UWP-D26/CE42 Bodypack TX Wireless microphone. In these 30-minute sessions, each participant was given a list of 100 sentences which contained lexical items that could prove challenging to pronounce for each individual interlanguage based on a desktop review of the phonological inventories of the languages. After reviewing the stimulus sentences to check for unfamiliar lexical items, they were told to read the sentences aloud at a normal speed in a natural manner and they could repeat their reading of each sentence as many times as they wished. If participants misread, or their intonation was not natural, they were prompted to reread the sentence. The audio-visual files were edited with Adobe Premiere Pro 2020 and the volume levels for both the audio-only and audio-visual files were normalised using Audacity 2.4.2 sound editing software (Audacity, 2021).
The speakers’ IELTS speaking scores were 6.5 or 7, but they exhibited non-standard features in their pronunciation. The speakers’ speech samples were selected by the first author to match the IELTS band 6 pronunciation descriptor “Can generally be understood throughout, though mispronunciation of individual words or sounds reduces clarity at times” (IELTS Speaking band scores, 2023). This choice aligns with a previous study showing that IELTS examiners found rating the IELTS Pronunciation subscale using band 6 to be more straightforward than the adjacent bands (5 and 7), which lack elaborated, self-contained descriptors (Isaacs et al., 2015).
As intonation was relatively normalised across speakers in that they read the same text, segmentals (vowel quality and vowel quantity) were the features most-often mispronounced by both speakers. Vowel quality is defined here as the acoustic properties of vowel sounds produced by tongue positioning and the resultant shape of the vocal tract. Vowel quantity refers to vowel sound duration produced by a tense or lax posturing of muscles surrounding the vocal cords.
Mispronunciation was operationalised using Johnson’s (1997) exemplar theory: the individual vowel/consonant sound produced by the speaker does not map onto the perceptual phonetic prototype (exemplar sound) stored in the listener’s (rater’s) memory. The framework used to predict whether the vowels produced in each speaker’s speech samples were mispronounced was Best’s (1995) perceptual assimilation model (PAM). See Tyler et al. (2014) for a recent similar application of Best’s PAM and Carey et al. (2011) for an outline of PAM and other models of cross-language speech perception. First, the speakers’ L2 pronunciation features were determined impressionistically through the first author’s broad (phonemic) and narrow (phonetic) transcription of the utterances (Supplemental Appendix 4). The features were then categorised by applying PAM to predict how well the contrasting L2 phones were likely to be assimilated to L1 phonological categories as either: (1) categorised or (2) uncategorised within the listener’s native phonological system. A goodness rating was applied to a comparison of the speech sample vowels, using the speaker’s L1 vowel inventory to make a comparison with the rater’s Australian English vowel inventory (Supplemental Appendix 6). This analysis was then audited by the second author.
A minimum of four speakers, matched for pronunciation features and IELTS 6 pronunciation level, were required to present raters with familiar and unfamiliar accented speakers in the two different presentation modes (audio-only; audio-visual). After six sentences containing mispronunciations were identified per speaker, the two speakers were divided into two groups (creating four speaker groups out of the two). Then four sentences, containing no mispronunciation, were added to three sentences that contained mispronunciation to create the seven sample sentences for each speaker (Supplemental Appendix 4). Finally, one group of seven Papua New Guinean sample sentences and one group of Brazilian sample sentences were sex/gender-shifted, as described below (Supplemental Appendix 7).
Procedures
Presentation of the speech rating stimulus
A novel procedure developed in this study involved only one familiar speaker and one unfamiliar speaker being presented to all raters to control for variation between raters’ familiarity with multiple speakers. A (familiar) Brazilian speaker was selected to be matched with a (unfamiliar) Papua New Guinean speaker based on English proficiency. However, stimuli from four speakers were required to match the four conditions. To make four speakers from the two we had recorded, some of the (familiar) female Brazilian speaker recordings and the (unfamiliar) male Papua New Guinean speaker recordings were duplicated by creating sex/gender-altered versions of each of the two speakers using the change gender command in Praat (Boersma & Weenink, 2020). This command is a resynthesis algorithm that allows the independent raising and lowering of the fundamental frequency (voice pitch) while keeping the speech rate and amplitude constant (Cartei & Reby, 2013). At the end of the survey, the raters were asked if they noticed anything unusual about the four speakers to ascertain if they realised they were listening to samples produced by the same sex/gender-shifted speakers. None of the raters noticed the sex/gender-shifted samples were the same speakers.
Ratings were presented in counterbalanced order (Szocs, 2022). Two reference speakers were added to the rating session (to provide a reference point), so that contrasting proficiency levels could be provided to mitigate the potential development of raters’ patterned response. One of the reference speakers who was audio-visually recorded was a lower-proficiency Mandarin English speaker with an overall IELTS score of 5.5. The other reference speaker was a high-proficiency Korean English speaker with an overall IELTS score of 8.5 who was presented as audio-only. The seven sentences read by the lower-proficiency speaker contained mispronunciations, while the seven sentences spoken by the higher-proficiency speaker were close to native-like.
Developing the rating scale
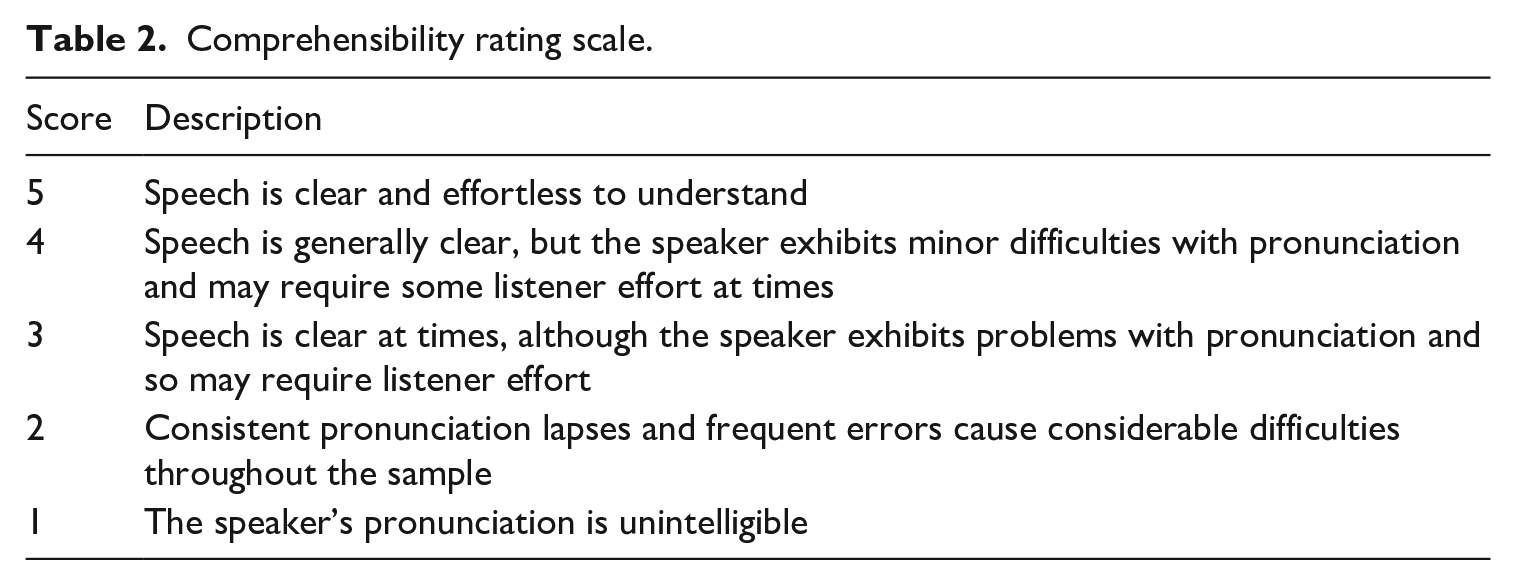
In this study, a Comprehensibility rating scale was intuitively developed from IELTS and TOEFL scale features (Table 2). Adopting the IELTS or TOEFL iBT rating rubric would not have been ideal for this study, as our rating stimulus was not based on IELTS or TOEFL iBT test tasks or prompts. Further, some raters’ experience with one of these standard scales may have affected their ability to apply the scale.
Comprehensibility rating scale.
Administering the rating scale
Raters were instructed to find a quiet place to complete the survey and were reminded to use a laptop or desktop, not a tablet or a mobile phone, to use headphones, earbuds, or good quality external speakers, and to adjust the volume to a comfortable listening level.
The survey was distributed through the Qualtrics online survey tool. After completing informed consent, the rating procedure commenced with a practice speaker used to train the raters in the rating procedure. The practice speaker, an L1 Arabic male, was selected from the initially recorded speakers, based on his Comprehensibility level approximating that of the selected familiar Brazilian and unfamiliar Papua New Guinean speakers. The practice attempt was not a norming exercise. Rather, the raters familiarised themselves with applying the rating scale, cut points and criteria descriptors.
Raters were reminded that the rating task solely focused on pronunciation, but they were told not to assess the speakers’ intonation. This was because the scripted sentences mostly had a level tone and did not display the dynamic characteristic intonation contours of spontaneous speech. Their level of intonation was therefore an artefact of the reading process that needed to be held as a constant phonological feature to improve rater consistency in the interpretation of the rubric (Table 2). Note that intonation is not a feature of the IELTS band 6 pronunciation descriptor, which was the description applied when selecting the speech samples.
The raters were informed that they would watch/hear a short recording of 42 unrelated sentences with a one-second interstimulus interval and that they would rate the speech after one listening. To emulate the effect of providing, versus not providing sociocultural and linguistic background information about the test-takers to test examiners in the IELTS and TOEFL iBT speaking tests, in the current study, no demographic information about speakers was provided with the audio-only speech samples. Conversely, the following demographic information was presented to raters alongside the audio-visual samples: home country, L1, sex, and age. Therefore, the audio-visual condition comprised audio and video of the speaker, including facial cues and written demographic information. Conversely, the audio-only condition did not include facial cues, nor was written demographic information provided.
Summary of statistical methods
Rasch analysis was conducted using Winsteps Version 5.2.1.0 (Linacre, 2022a) to assess the construct validity and measurement precision of the rating scale. The analysis examined the fit of the data to the Rasch model, providing person (rater) and item (Accent Familiarity/Presentation Mode) reliability measures, standard error of measurement, and the separation index. Item and person reliability are indices of precision and reproducibility of items/person measures. The separation index gauges the number of statistically different levels of item difficulty or person ability in the data (Linacre, 2019), that is, it quantifies how reliably facets are distinguished across the latent trait (Comprehensibility).
Next, we examined the interaction between Accent Familiarity (unfamiliar/familiar) and Presentation Mode (audio-only/audio-visual) and the relative contribution of these variables to the variance in Comprehensibility ratings. To do so, we fitted a two-way ordinal logistic regression model to the data using the “ordinal” package in R (Christensen, 2022), with five-point ordinal Comprehensibility ratings as the response variable and Accent Familiarity (henceforth Familiarity) and Presentation Mode as predictors. The model was tested for an interaction between the two predictors, and post hoc pairwise comparisons were conducted to determine the direction, significance, and strength of the interaction. Odds ratios were calculated from the log odds (logits) of the pairwise comparisons and interpreted, after converting the logits to probabilities, to determine the percentage likelihood of one facet within each contrast receiving a higher Comprehensibility rating.
Results
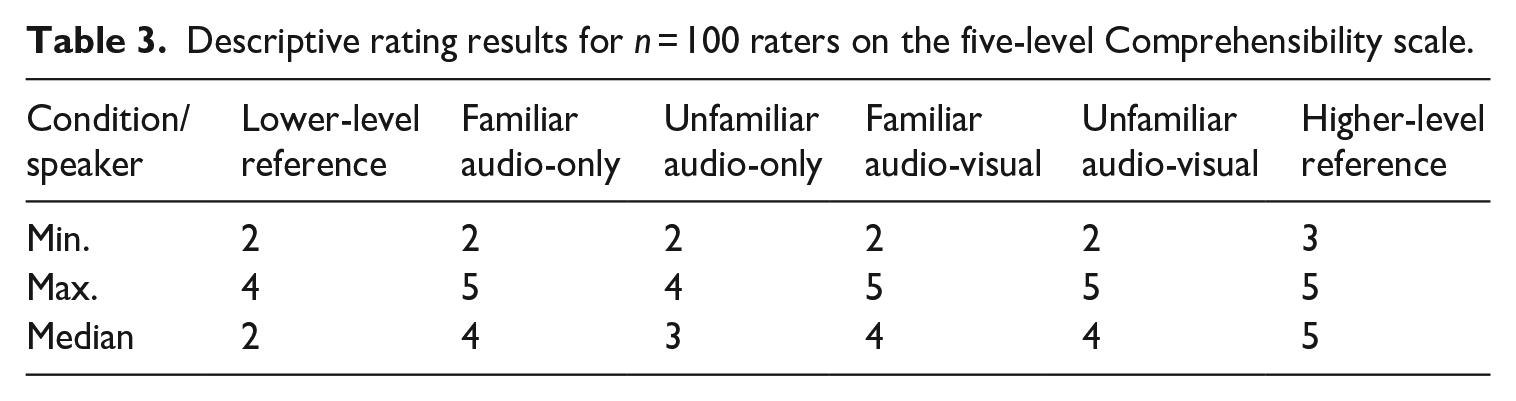
Descriptive statistics (Table 3) show the distribution of raters’ scores on the five-level Comprehensibility scale for the two familiar and two unfamiliar test group speakers and the two reference speakers. The two familiar and two unfamiliar test group speakers were rated with scores ranging from 2 to 4. The familiar test speakers presented in the audio-visual and audio-only modes were rated with equivalent median scores of 4. The unfamiliar test speakers presented in the audio-visual mode were rated with a higher median score (Med. = 4) than speakers presented in the audio-only mode (Med. = 3). The lower median of 1 for the lower proficiency reference group speaker and the higher median of 5 for the higher-proficiency reference group speaker provided confidence that the raters were generally rating as expected.
Descriptive rating results for n = 100 raters on the five-level Comprehensibility scale.
Tables 4 and 5 show the results of Rasch analysis for the person (rater) and item (Familiarity/Presentation Mode) fit (infit and outfit), person and item separation, and person and item reliability See Rasch analysis code and associated data in Appendix 8. Person fit ascertains whether the raters’ scores fit within a range of expected responses. Item fit identifies whether the Familiarity/Presentation mode facets align with the Rasch model. An infit or outfit mean square (MNSQ) statistic between 0.5 and 1.5 is a productive fit for measurement, but for high-stakes rating on a polytomous scale, evidence from a meta-analysis suggests that the fit should be between .8 and 1.4 (Aryadoust et al., 2021). The results show MNSQ statistics ≈ 1.00, falling within this expected .8–1.4 range for person (rater) and items (Familiarity/Presentation Mode).
Rasch analysis tests of person (rater) reliability (n = 100).
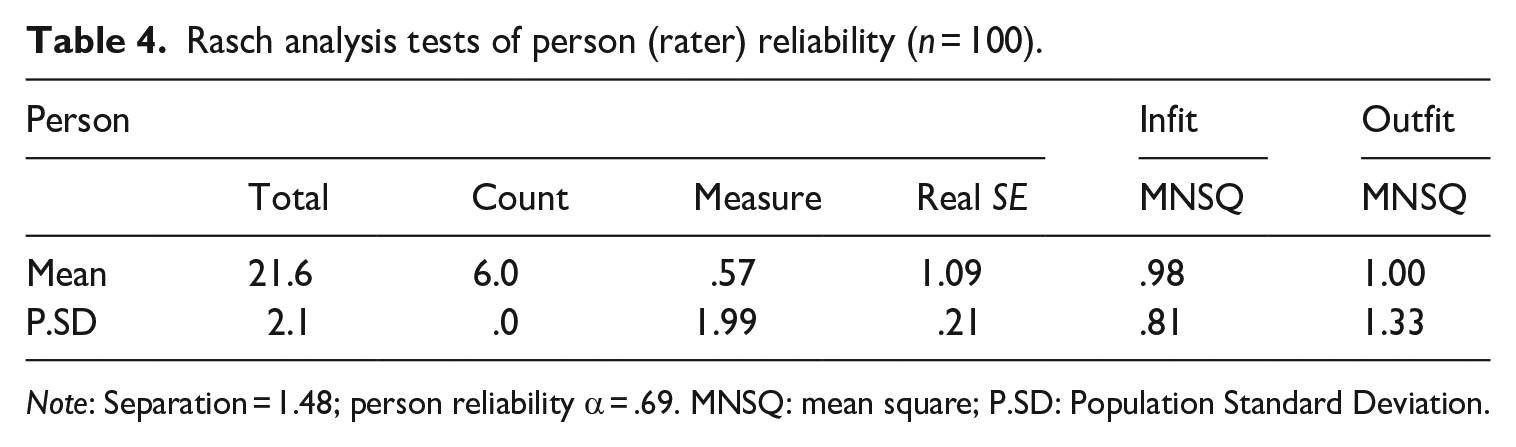
Note: Separation = 1.48; person reliability α = .69. MNSQ: mean square; P.SD: Population Standard Deviation.
Rasch analysis tests of item (Familiarity/Presentation Mode) reliability (n = 6).
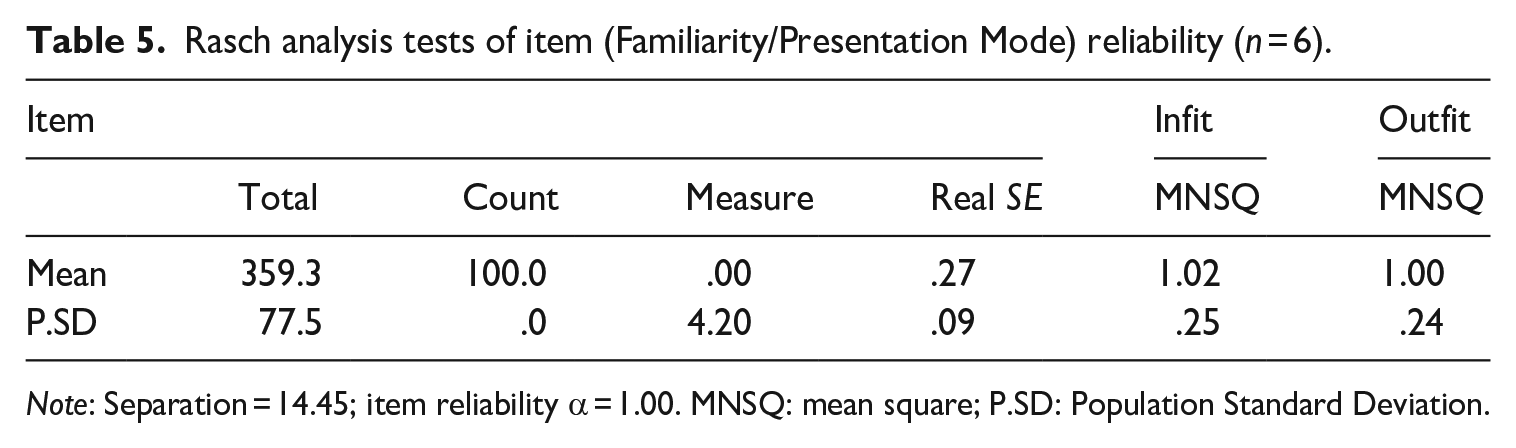
Note: Separation = 14.45; item reliability α = 1.00. MNSQ: mean square; P.SD: Population Standard Deviation.
Regarding rater (person) reliability, the rater separation index was 1.48. Low separation reliability is preferable (Linacre, 2022b), because raters need to be reliably the same, not reliably different. Linacre’s (2019) suggested cut score for a low person separation index is <2, indicating the raters were rating in a reliably similar way. The Cronbach’s alpha measure for the internal consistency of the raters’ scoring of each condition was α = .69. This result borders the acceptable range of ⩾.7 (George & Mallery, 2003). In the context of this study, where an interaction effect between the Familiarity and Presentation Mode factors is hypothesised, there was minimal rater training, and the rubric was not previously validated, a moderate rater reliability coefficient was expected.
The Familiarity/Presentation Mode facet (item) separation index = 14.5 levels of difficulty, indicating that the items could be distinguished at 14 levels of difficulty. The Cronbach’s alpha (α) of 1.00 for item reliability means all the rating conditions measure the Comprehensibility construct accurately, as α > .9 is the item reliability threshold (Linacre, 2022b).
The Wright map (Figure 1) is a graphical representation of the item difficulty and person ability estimates in the Rasch analysis for the four Familiarity/Presentation Mode facets. Figure 1 shows that the mean person (rater) ability estimate, and the mean item (Familiarity/Presentation Mode) difficulty estimate are equal (M + M are aligned on the latent variable line), which indicates that the rating scale is well-balanced. Overall, the Rasch analysis results suggest that the rating scale used in the study was reliable for measuring the raters’ responses. The acceptable infit and outfit MNSQ values suggest that the rating scale was functioning correctly, with no significant deviation from expected responses.
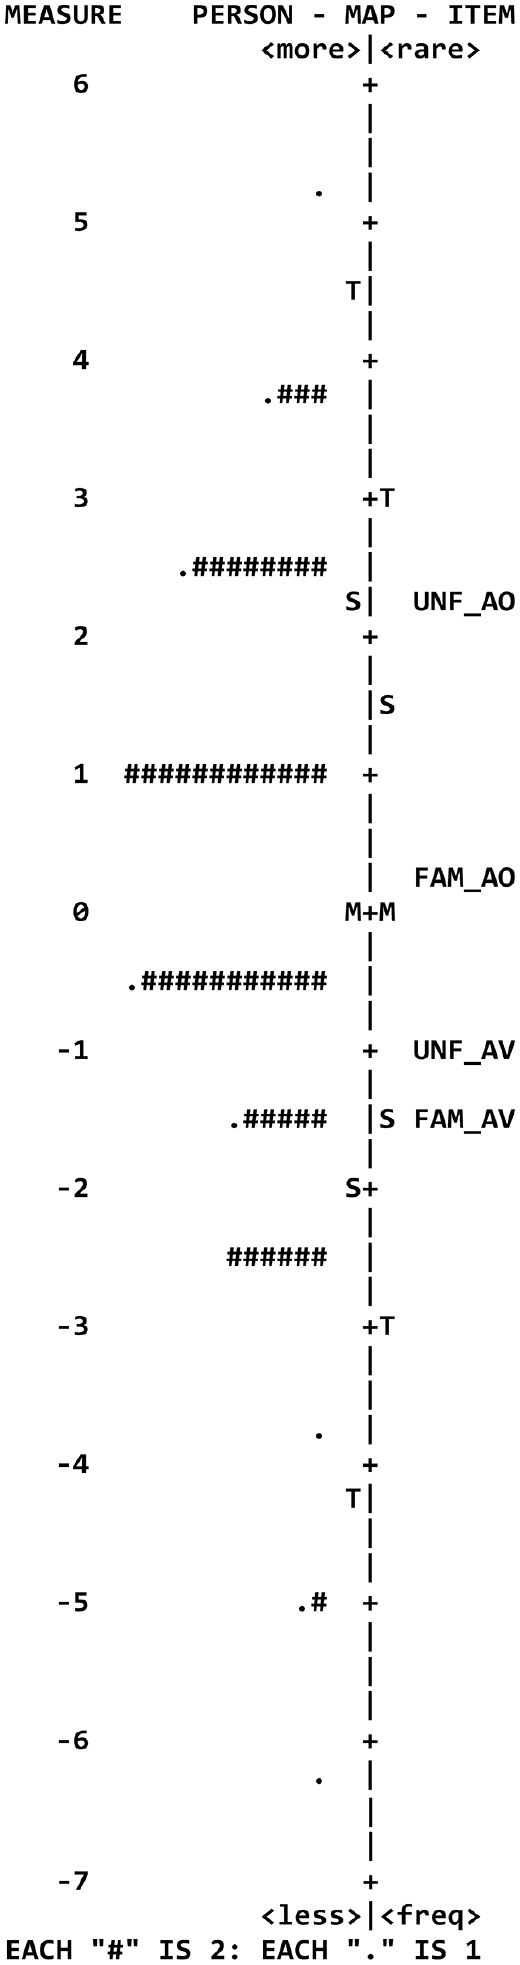
Wright map depicting the person (rater) ability and item (Familiarity/Presentation Mode) difficulty estimates in the Rasch analysis.
A two-way ordinal logistic regression model was fitted using the statistical program R to examine the interaction between Familiarity and Presentation Mode and the relative contribution of the variables to predict the Comprehensibility response variable. The R code and data are available in Supplemental Appendix 9. Residual analysis was performed to test for the assumptions of the ordinal logistic regression procedure. The assumption of proportional odds was met, as assessed by a full likelihood ratio test comparing the fit of the proportional odds location model to a model with varying location parameters, χ2(6) = 6.337, p = .386. The Pearson goodness-of-fit test indicated that the model was a good fit to the observed data, χ2(6) = 5.819, p = .444. The eta-squared effect size was η2 = .208, meaning that 21% of the total variance can be accounted for by group membership (a medium effect size, i.e., .08 to <.26; Cohen, 1988). The final model statistically significantly predicted the dependent variable over and above the intercept-only model, χ2(6) = 91.485, p < .001.
The estimated marginal means were calculated using the emmeans package in R, and an interaction plot was generated to visualise the interaction effect (Figure 2). This plot of the estimated marginal means showed the lines are not parallel, suggesting that there was an interaction; the relationship between Familiarity and Comprehensibility varied depending on the mode of presentation. A likelihood ratio test confirmed a significant interaction between Familiarity (unfamiliar/familiar) and Presentation Mode (audio-only/audio-visual) (χ² = 88.005, df = 3, p < .0001). This means that the effect of Familiarity on ratings varies, depending on the Presentation Mode.
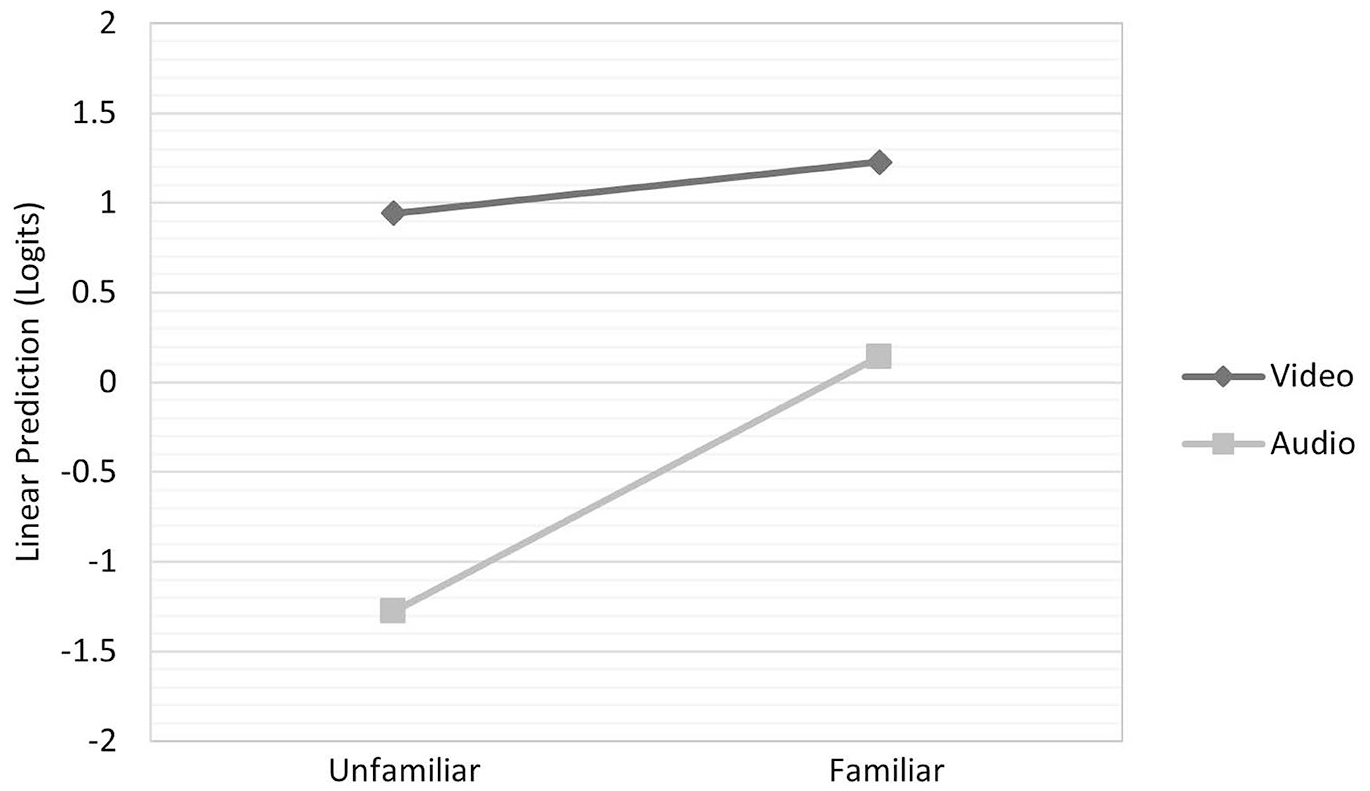
Profile plot of the estimated marginal means for the level of Familiarity × Presentation Mode.
The analysis of deviance (Table 6) provides additional information on the statistical significance of each variable and the interaction.
Analysis of deviance with Wald chi-square tests.
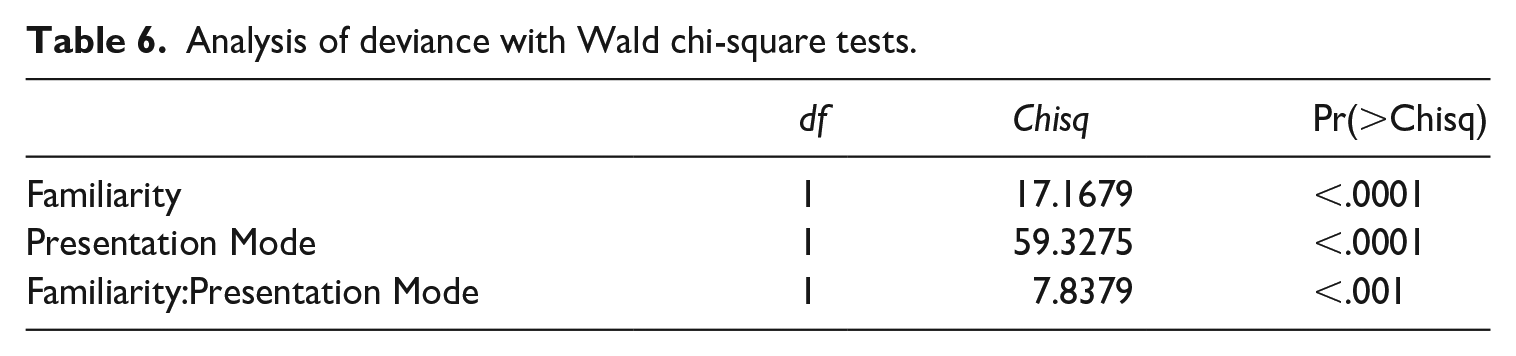
Overall, the findings suggest that both Familiarity and Presentation Mode are important predictors of Comprehensibility, and that the relationship between Familiarity and Comprehensibility is moderated by the Presentation Mode (χ² = 59.328, df = 1, p < .0001). The higher Wald chi-square value for Presentation Mode in Table 6 indicates that this independent variable has a stronger effect on the dependent variable compared to Familiarity and their interaction.
As the interaction term in the model was significant, the group separation for the interaction effect was explored with post hoc pairwise comparisons to examine the source of the interaction (Table 7). Pairwise comparisons were run with 95% confidence intervals and p values were adjusted by the Tukey method to control for Type 1 error when comparing the four groups.
Post hoc pairwise comparisons between Familiarity and Presentation Mode.
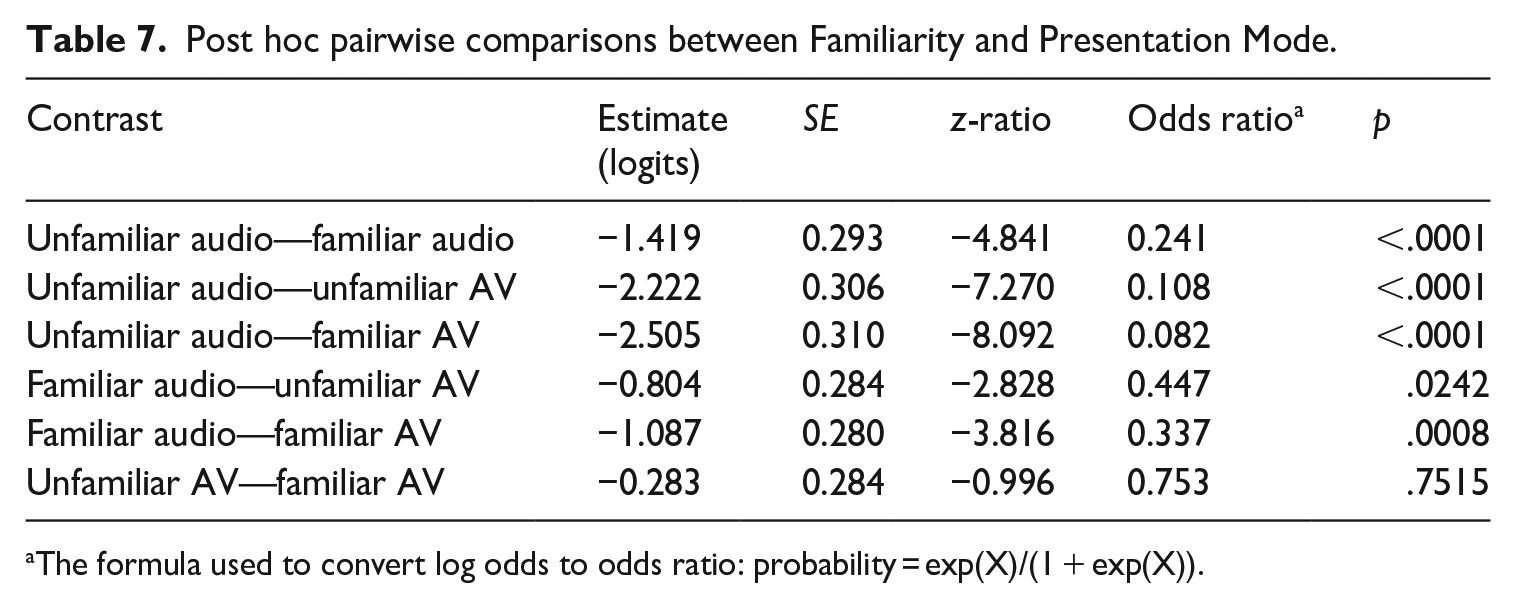
The formula used to convert log odds to odds ratio: probability = exp(X)/(1 + exp(X)).
Table 7 shows a significant difference between all pairs of groups, except for the unfamiliar audio-visual and familiar audio-visual conditions where no statistical significance was detected (p = .7515). The Estimate column shows the difference in the log odds (logits) between the two levels of the factor being compared. The logits indicate the magnitude and direction of the effect of each comparison on Comprehensibility, with negative values indicating a decrease in the odds of Comprehensibility for the first group compared to the second group. The logits in Table 7 were then converted to probability percentages, using the formula: probability = (logits/(1 + logits)) × 100, to obtain the following results:
Raters were 23.8% more likely to rate Comprehensibility higher under the familiar audio-only condition than under the unfamiliar audio-only condition.
Raters were 91.0% more likely to rate Comprehensibility higher under the unfamiliar audio-visual condition than under the unfamiliar audio-only condition.
Raters were 92.3% more likely to rate Comprehensibility higher under the familiar audio-visual condition than under the unfamiliar audio-only condition.
Raters were 44.6% more likely to rate Comprehensibility higher under the unfamiliar audio-visual condition than under the familiar audio-only condition.
Raters were 66.4% more likely to rate Comprehensibility higher under the familiar audio-visual condition than under the familiar audio-only condition.
Raters were 23.8% more likely to rate Comprehensibility higher under the unfamiliar audio-visual condition than under the familiar audio-visual condition, but this comparison was not significant.
Discussion
This study investigated the potential of accent familiarity (raters being familiar with an accent versus raters not being familiar), combined with the Presentation Mode variable (audio-only versus audio-visual) to influence rater scoring of Comprehensibility. The speech stimuli were rated by 100 L1 English-speaking raters who were experienced ELICOS teachers and speaking test assessors. Raters were selected based on them being familiar with Brazilian-accented English and unfamiliar with Papua New Guinean-accented English. The rating procedure used an analytic pronunciation rating scale that measured Comprehensibility.
This was the first study of its kind to investigate the interaction of Familiarity and Presentation Mode in a language-testing context. To our knowledge, this interaction has not been investigated in pedagogical contexts, nor in aligned speech science and neuroscience areas. In line with prior research findings from IELTS (Carey et al., 2011; Carey & Mannell, 2009) and TOEFL iBT (K. Browne & Fulcher, 2016; Winke et al., 2013), which adopted the audio-only mode of presentation, odds ratios derived from the ordinal regression procedure confirmed an increased likelihood of higher Comprehensibility ratings for familiar speakers. The main finding from the current study was that the Presentation Mode significantly interacted with Familiarity to increase Comprehensibility ratings (χ² = 88.005, df = 3, p < .0001), with Presentation Mode having a stronger effect in the interaction than familiarity (χ² = 59.328, df = 1, p < .0001). Based on odds ratios, raters were significantly more likely to score Comprehensibility of pronunciation higher when the Presentation Mode was audio-visual, as compared to audio-only, for both the unfamiliar (91% more likely) and familiar speakers (92.3% more likely).
These results align with Nakatsuhara et al. (2021), who found that accredited raters (n = 6) when re-rating recorded authentic IELTS speaking tests, rated the candidates significantly higher in the audio-visual mode than the audio-only mode in all rating criteria, including pronunciation. One possible explanation for this difference in pronunciation ratings between the audio-visual and audio-only modes could be that the visual cues and the additional background information assist raters to perceptually adapt (McGowan, 2015; Vaughn, 2019). In line with previous findings from speech perception research (Adank et al., 2009; V. A. Brown et al., 2020; McLaughlin & Van Engen, 2020), it is not unreasonable to expect that the extra cognitive load which raters must exert when listening to unfamiliar accents is lessened by providing them with audio-visual and other background information about the speaker. To test this hypothesis, neuroscience studies, providing measures of cognitive load, could investigate the relationship between the absence or presence of visual cues, familiar and unfamiliar accented speech, and their effect on perceptual adaptation.
This study should be interpreted considering some limitations and constraints. It is not possible to generalise the results of this controlled study to high-stakes testing contexts. The study's generalisability was limited by experimentally controlling aspects of the study when selecting L1 English speaker raters, the speech stimuli, and two speakers to represent familiar and unfamiliar accents. However, based on the results of this experimental study, it has been possible to make qualified comments on the likely effects that the combination of Accent Familiarity and Presentation Mode has on Comprehensibility. We emulated the IELTS face-to-face mode by deliberately conflating the audio-visual Presentation Mode with speaker background information and vice versa to emulate the TOEFL iBT; these variables could not be separated in the analysis. Therefore, the findings of an interaction effect between the factors and the significant effect on the ratings need to be interpreted with the inclusion of this additional speaker background information.
Conclusion
The current study has introduced a novel bivariate method of analysing the combined effect of Accent Familiarity and Presentation Mode on Comprehensibility scores in an experimental speaking test context. The variables were presented as fixed factors that were combined variously to produce four conditions: familiar/audio-only; familiar/audio-visual; unfamiliar/audio-only; and unfamiliar/audio-visual. The method and the rating scale may prove useful for other researchers to apply to the analysis of Accent Familiarity and Presentation Mode in future studies.
The study provides evidence that Accent Familiarity and Presentation Mode interact to potentially impact Comprehensibility ratings. Presentation Mode, as a separate variable, independent of Familiarity, is a unique potential source of variation. The results indicate that the audio-visual Presentation Mode has a stronger effect than Accent Familiarity on Comprehensibility ratings. The results suggest that semi-direct tests with audio-only presentation and audio-visual presentation should be evaluated to ascertain how Accent Familiarity and Presentation Mode affect Comprehensibility ratings.
This study is the first to investigate the interaction between Accent Familiarity and Presentation Mode and its impact on Comprehensibility ratings in an experimental speaking test context. More research is required to advance knowledge on the topic by extending the scope of this controlled study. A larger sample using accredited speaking test examiners would provide the statistical power to conduct multivariate analyses and investigate the interaction of other potential independent variables and covariates with rating scores, such as rater experience, and rater L1/L2 status. Such a study may be beneficial to investigate the virtual modes of delivery that have emerged post-COVID-19 (Isbell & Kremmel, 2020).
Footnotes
Acknowledgements
This paper is based on Stefan Szocs’ (2nd author’s) unpublished PhD thesis at the University of the Sunshine Coast, Australia. We would like to thank Dr Talia Isaacs for her extremely insightful and helpful editorial suggestions, as well as those of the anonymous reviewers who assisted greatly in the completion of this paper.
Author contributions
Declaration of conflicting interests
The authors declared no potential conflicts of interest with respect to the research, authorship, and/or publication of this article.
Funding
The authors received no financial support for the research, authorship, and/or publication of this article.