
Abstract
English-medium universities often accept scores from various English language proficiency (ELP) tests as evidence of ELP from non-English background students. This practice raises the question of how these tests compare in terms of their ability to predict academic achievement. This longitudinal study addresses this question by examining the strength of the associations between total scores on the IELTS Academic and the TOEFL iBT, on one hand, and the academic achievement of 6481 non-English background undergraduate students in the first 10 semesters of their study at a Canadian, English-medium university, on the other. Findings revealed that the association between ELP and academic achievement varied across ELP tests and disciplines. Furthermore, students with different IELTS scores exhibited significantly different grade point average (GPA) trajectories over time. Specifically, students with lower IELTS scores tended to exhibit a more substantial decline in GPA over the 10 semesters compared to students with higher scores who displayed less decline in GPA, suggesting greater resilience. The findings and their implications for research concerning the relationship between ELP and academic achievement over time are discussed.
Keywords
English-medium universities that require evidence of English language proficiency (ELP) from non-English background students often accept scores from various ELP tests as such evidence. The most widely accepted ELP tests are the TOEFL iBT and the IELTS Academic, but many universities also use their own, locally developed ELP tests. Cut scores used for admitting students on these tests are assumed to reflect an equivalent level of ELP. Considering the differences between these tests (Green, 2018; Li, 2018), one may ask whether the relationship between ELP and academic achievement varies depending on the chosen ELP test. Another related question is how students admitted with scores on different ELP tests compare in terms of their academic achievement. This longitudinal study aimed to address these questions by comparing the associations between IELTS-Academic and TOEFL iBT total scores, on one hand, and the academic achievement of non-English background undergraduate students in the first 10 semester of their study at a Canadian, English-medium university, on the other.
The relationship between ELP test scores and academic achievement
Numerous studies have examined the relationship between ELP test scores and academic achievement, often operationalized as grade point average (GPA). Most of these studies focus on the IELTS (e.g., Oliver et al., 2012; Schoepp, 2018; Schoepp & Garinger, 2016; Thorpe et al., 2017) or the TOEFL iBT (e.g., Bridgeman et al., 2016; Cho & Bridgeman, 2012; Harsch et al., 2017; O’Dwyer et al., 2018; Wait & Gressel, 2009). Few studies have examined other ELP tests (e.g., Bo et al., 2022; O’Dwyer et al., 2018). Many of these studies have found significant positive but generally modest correlations between students’ academic achievement and their ELP test scores, while some have found weak to no meaningful associations (e.g., Bridgeman et al., 2016; Ingram & Bayliss, 2007) or even negative associations (e.g., Arcuino, 2013; Lo, 2002). In a recent meta-analysis of 132 effect sizes from 32 studies, Ihlenfeldt and Rios (2022) found that, overall, scores on the IELTS and the TOEFL had a significant positive, but weak correlation with GPA (r = .23) and that the strength of the association did not vary significantly between the two tests.
Researching the association between ELP and academic achievement is fraught with problems that can affect research results (Bridgeman et al., 2016; Cho & Bridgeman, 2012; Murray, 2016; Thorpe et al., 2017). One challenge relates to defining and measuring both ELP and academic achievement. To begin with, different ELP tests define and measure ELP in different ways. Green (2018) and Li (2018), for exmaple, have noted several differences in how the IELTS and the TOEFL define and assess ELP. Moreover, as Murray (2016) cautioned, ELP tests may not cover all the language skills crucial for academic success since ELP tests tend to focus on general academic English rather than the specific language and discourse associated with various academic disciplines. This could explain why many studies have found modest correlations between ELP test scores and academic achievement. In addition, some ELP tests may be more relevant to academic success than others at specific universities. Bo et al. (2022), for example, argued that, compared to international tests, locally developed ELP tests may be better aligned with local curricula and thus have superior ability to predict academic achievement at the universities where these tests are used.
There is consensus that academic achievement is multifaceted and that it is best captured using a variety of measures (Abunawas, 2014; Cho & Bridgeman, 2012). However, most studies use GPA as the sole indicator of academic achievement. As Abunawas (2014) cautioned, GPA suffers from several limitations, including inconsistencies in grading standards across courses, departments and institutions, restriction of range in grades, grade inflation, and the influence of non-achievement factors on grades. Nonetheless, GPA is more convenient and objective than other indicators of acadmic acheievement, such as retention and teacher evaluations. For example, GPA demonstrates high internal consistency and correlates with other important measures of academic achievement (Abunawas, 2014).
Second, a plethora of student-related and contextual factors can affect ELP test scores, academic achievement, and the strength of their relationships, potentially accounting for the mixed results reported in the studies above (Cho & Bridgeman, 2012; Oliver et al., 2012). As Bridgeman et al. (2016) highlight, ELP is just one of the many factors that can affect students’ academic achievement at English-medium universities. Other factors include student demographics (e.g., first language [L1], gender); personal attributes (e.g., goals, persistence); previous academic performance (e.g., in high school); linguistic, cultural and educational background; study level (undergraduate or postgraduate); field of study (e.g., engineering, history); level of social and academic support; teaching quality; and so forth (Cho & Bridgeman, 2012; Murray, 2016; O’Dwyer et al., 2018; Oliver et al., 2012).
Several studies have revealed that the strength and direction (positive or negative) of the association between academic achievement and scores on the TOEFL iBT (e.g., Cho & Bridgeman, 2012; Harsch et al., 2017; O’Dwyer et al., 2018; Wait & Gressel, 2009), the IELTS (e.g., Feast, 2002; Schoepp, 2018), and other ELP tests (e.g., Bo et al., 2022) can vary considerably across study majors. For example, O’Dwyer et al. (2018) found that the correlations between TOEFL iBT total scores and GPA were stronger for technical disciplines than for social sciences, while Schoepp (2018) found that the correlations between IELTS scores and GPA were stronger for English compared to mathematics. Discipline-specific effects could be attributed to the varying linguistic demands of different fields and courses. Some disciplines, such as social sciences, may place a greater emphasis on language proficiency than other fields such as engineering, resulting in differing degrees to which English language skills are essential for academic success across various study majors and courses (Cho & Bridgeman, 2012; Harsch et al., 2017; O’Dwyer et al., 2018; Wait & Gressel, 2009).
Other factors that can impact the strength of the association between ELP test scores and academic achievement include study level (e.g., Johnson & Tweedie, 2017; Oliver et al., 2012) and student-related variables such as student L1 and nationality (e.g., Bridgeman et al., 2016; Feast, 2002; Harsch et al., 2017; Thorpe et al., 2017; Wait & Gressel, 2009). Oliver et al. (2012), for example, found that the correlation between IELTS scores and GPA was significant for graduate but not for undergraduate students, while Johnson and Tweedie (2017) found the opposite pattern. Study-level effects suggest that the nature and/or level of language skills needed for graduate-level studies may differ from those needed for undergraduate studies. On the other hand, student-related variables may be proxies for other factors linked to ELP and academic achievement, such as education system, the role of English in the education system, and student learning skills, experiences, and motivation.
Yet another factor that can affect ELP test scores, academic performance at university, and their relationship is student’s academic performance prior to gaining admission to the university as reflected, for example, in their high-school GPA. Generally, students with higher high-school GPA can be expected to obtain higher scores on tests that measure academic ELP and to perform better in their university studies compared to students with lower high-school GPA. Consequently, when examining the relationship between ELP and academic achievement at university, it becomes important to account for differences in pre-university academic performance. However, this is not common practice in the existing literature, possibly due to the challenges associated with obtaining data on students’ pre-university academic performance and/or the challenges associated with converting grades from different countries and educational systems into a common scale to facilitate comparisons between students.
Two studies controlled for prior academic achievement when examining the association between ELP test scores and academic achievement. Cho and Bridgeman (2012) controlled for academic ability, measured by SAT or GRE/GMAT scores, when examining the correlation between TOEFL iBT scores and GPA for 2594 students from 10 universities. They found that, after adjusting for academic ability, TOEFL scores explained 3%–7% of variability in GPA. Bo et al. (2022) controlled for pre-university academic performance, measured by overall O-Level score, when examining the relationship between scores on a local ELP test and GPA for 514 university students in Singapore. They found that ELP, as measured by ELP test scores, significantly and positively predicted GPA and mediated and strengthened the association between students’ pre-university academic performance and their current academic achievement. Specifically, students’ O-level scores were positively associated with their ELP test scores, which, in turn, significantly predicted their university GPA.
Finally, Cho and Bridgeman (2012) and Bridgeman et al. (2016) have identified several methodological challenges to examining the association between measures of ELP and academic achievement. These challenges include range restriction stemming from selection based on the ELP test and/or GPA, which can result in underestimating the correlation coefficients; limitations inherent in correlation analyses when examining the relationship between any two variables; and the practice of aggregating data across different programs, faculties, and subjects with different grading standards in order to attain an adequate sample size, which can affect both the magnitude and direction of the correlations between ELP test scores and GPA.
Previous studies comparing ELP tests
In contrast to the extensive body of research on individual ELP tests, there are relatively few studies that have compared ELP tests in terms of their ability to predict academic achievement. Some authors (e.g., Green, 2018; Li, 2018) have compared the IELTS and the TOEFL regarding their constructs, content, and assessment tasks. Green (2018), for example, pointed out that scores on different ELP tests, such as the IELTS and the TOEFL, are “far from interchangeable” (p. 69) because these tests are “structured differently, target a different range of levels of proficiency, include different task types, use different approaches to scoring, and have different measurement characteristics” (p. 70; cf. Li, 2018).
In one of the earliest comparison studies, Hill et al. (1999) compared IELTS and TOEFL scores as predictors of 55 students’ GPA. They found that both scores could predict GPA, with IELTS showing a stronger association with GPA (r = .54) than TOEFL (r = .29). Woodrow (2006) found that IELTS scores correlated significantly, but weakly, with GPA (r = .40), whereas the correlation for the TOEFL was not significant. Arcuino (2013) found no significant difference between the TOEFL and IELTS scores in relation to academic success among a sample of 793 graduate international students, although the TOEFL iBT displayed a postive correlation (r = .14), while the IELTS showed a negative one (r = –.14), perhaps due to the small sample for IELTS. O’Dwyer et al. (2018) found that scores on the TOEFL iBT and a local ELP test were significantly correlated with GPA, with the local test showing a slightly higher correlation (r = .46) than the TOEFL (r = .38). Johnson and Tweedie (2017) found that scores on the IELTS and the TOEFL were significant predictors of student achievement, explaining 21% and 26% of GPA variance, respectively. Recently, Isaacs et al. (2023) found that scores on the IELTS and the TOEFL iBT exhibited stronger correlations with first-year credit-weighted academic grades (r = .18 and .15, respectively) compared to scores on the Duolingo English Test (DET, r = .09) at the postgraduate level. At the undergraduate level, the correlations were weak (r = .05 for the TOEFL, −.08 for IELTS, and −.05 for DET), possibly due to a high level of diversity in the sample. Furthermore, students admitted based on TOEFL and IELTS scores outperformed those admitted based on DET scores. Finally, in their meta-analysis, Ihlenfeldt and Rios (2022) found no significant differences in the predictive power of IELTS and TOEFL iBT.
The studies reviewed above offer insights on the relationship between non-English background students’ ELP and their academic achievement and how the strength of this association can vary across ELP tests, student groups, and study majors. However, most of these studies tend to focus on academic achievement in the first semester or year of university study and, as a result, do not address questions concerning the association between ELP and students’ trajectories of academic achievement as they progress in their studies. This lack of longitudinal research contrasts with the findings of some previous studies (e.g., Humphreys et al., 2012; Huong, 2001; Murray, 2016), which suggest that the association between ELP test scores and academic achievement tends to weaken in the second semester when compared to the first, perhaps because ELP is more important at the beginning of the students’ studies and/or because students’ language and academic proficiencies evolve as they progress in their programs of study. Feast (2002) is the only study that has examined the relationships between ELP, as measured by IELTS scores, and changes in academic achievement over time. Feast examined how student GPA changes over time and the factors influencing these changes in GPA for 101 students at an Australian university. She found no significant change in GPA over time, but IELTS scores had a significant positive relationship (.39) with GPA in the first semester. Similarly, the current study adopted a longitudinal approach to examine the relationship between ELP test scores and academic achievement. However, unlike Feast, the current study compares two ELP tests: IELTS and TOEFL iBT.
Study context and purpose
The current study was conducted at a large, Canadian, English-medium university as a part of a larger project aimed at investigating how international undergraduate students admitted to the university through various means of demonstrating their ELP compared to each other and to their domestic peers in terms of their academic achievement throughout their university studies (see Barkaoui, 2024, for a related study and more details of the larger project). The university where this study took place accepts scores on several ELP tests for admission, but most students applying for admission submit scores from the IELTS Academic or the TOEFL iBT. 1 The IELTS Academic and the TOEFL iBT are standardized tests of ELP for academic contexts. Each test consists of four sections that assess listening, reading, speaking, and writing skills. For the IELTS, each section is scored on a scale from 1 to 9, and the overall score is the average of the four section scores. For the TOEFL, each section is scored out of 30, and the total score is the sum of the four section scores, resulting in a total score out of 120.
For most undergraduate programs at the university, the minimum admission score is set at 6.5 for the IELTS and 83 for the TOEFL iBT. However, there are exceptions, with certain programs like education requiring a higher minimum score such as 7.5 on the IELTS or 100 on the TOEFL iBT. Generally, there are no minimum section score requirements on either test, except for a couple of programs that require a minimum score on some or all sections. Note also that students with scores below the minimum required total scores can still be admitted to the university based on other factors such as a strong academic record.
As previously mentioned, the current study aimed to examine and compare the strength of the associations between the scores of undergraduate students on the IELTS or the TOEFL iBT, on one hand, and their academic achievement in the first 10 semesters of their study at university, on the other hand. To this end, the study addressed the following research questions (RQ):
RQ1: What are the associations between undergraduate students’ total scores on the IELTS or the TOEFL iBT, on one hand, and (a) their GPA in the first semester and (b) their GPA trajectory over the first 10 semesters of their study at university, on the other hand?
RQ2: Do these associations vary depending on the chosen ELP test and study major?
Method
Samples and variables
The university provided data for all undergraduate students who submitted either IELTS or TOEFL iBT scores and were granted admission between September 2009 and September 2019. 2 The dataset included the following information for each student: GPA at the end of each semester throughout their university studies, IELTS or TOEFL iBT scores, the GPA from their previous institution (Admit GPA, see below), study major, and demographic information, including age, gender, L1, and immigration status.
Semester GPA, the dependent variable of the study, ranges between 0 and 9 and represents the student’s weighted average grade in all the courses completed in each semester. The weighting of the semester GPA is determined by the number of credits associated with each course; courses with more credits carry greater weight in the calculation. Admit GPA is calculated by the university during the admission process using conversion tables developed by the admissions office. These conversion tables take into account variations in grading practices and scales across different countries and educational institutions. To calculate the Admit GPA, the students’ academic transcripts from their previous institution, such as high school, are assessed. Specifically, the grades earned in academic courses that are related to the student’s intended program of study (e.g., chemistry, sociology) and are prerequisites for the program are converted into a grade on a 9-point scale. This converted grade is then used in making admission decisions. The minimum requirement for admission is an Admit GPA of 6 or higher, but students may still be admitted with lower Admit GPA for various reasons. Admit GPA serves as a covariate in the analyses below to account for differences in students’ academic performance prior to entering the university. However, it is important to highlight the absence of information regarding the reliability and validity of Admit GPA. Therefore, while Admit GPA provides useful information, readers should be aware of its limitations.
For the purposes of this study, a subset of the extensive dataset in the larger project was purposefully selected as follows. Initially, data for all students who had submitted scores on IELTS Academic (n = 7274) or TOEFL iBT (n= 1973) were retrieved. The difference in sample size reflects the popularity of the IELTS among students admitted to this university. Approximately two-thirds of all international students admitted between 2009 and 2019 submitted IELTS scores, while the remaining students submitted scores from other accepted ELP tests, such as the TOEFL iBT and a local ELP test. Subsequently, some students were removed from the dataset for the following reasons. First, students who had submitted scores more than 2 years prior to commencing their university program of study were excluded, as the validity period of scores on both ELP tests is 2 years. Second, students from programs that either require minimum total scores higher than those listed above and/or require minimum scores on some sections of the tests were excluded. Third, to maximize the dataset size while eliminating potential outliers, students were excuded if their total scores were below 5 on the IELTS or below 70 on the TOEFL iBT. In addition, students with no Admit GPA or with an Admit GPA below 5, that is, more than one point below the admission cut-off of 6 out of 9, were also excluded. 3 Finally, because the study aimed to examine students’ academic achievement longitudinally, students with semester GPA for fewer than three semesters were also removed. The final dataset included 6481 undergraduate students: 5215 students admitted with IELTS scores and 1266 with TOEFL iBT scores, as shown in Table 1. The following paragraphs describe the final sample for each ELP test.
Distribution of students by demographic variables and ELP test (n = 6481).
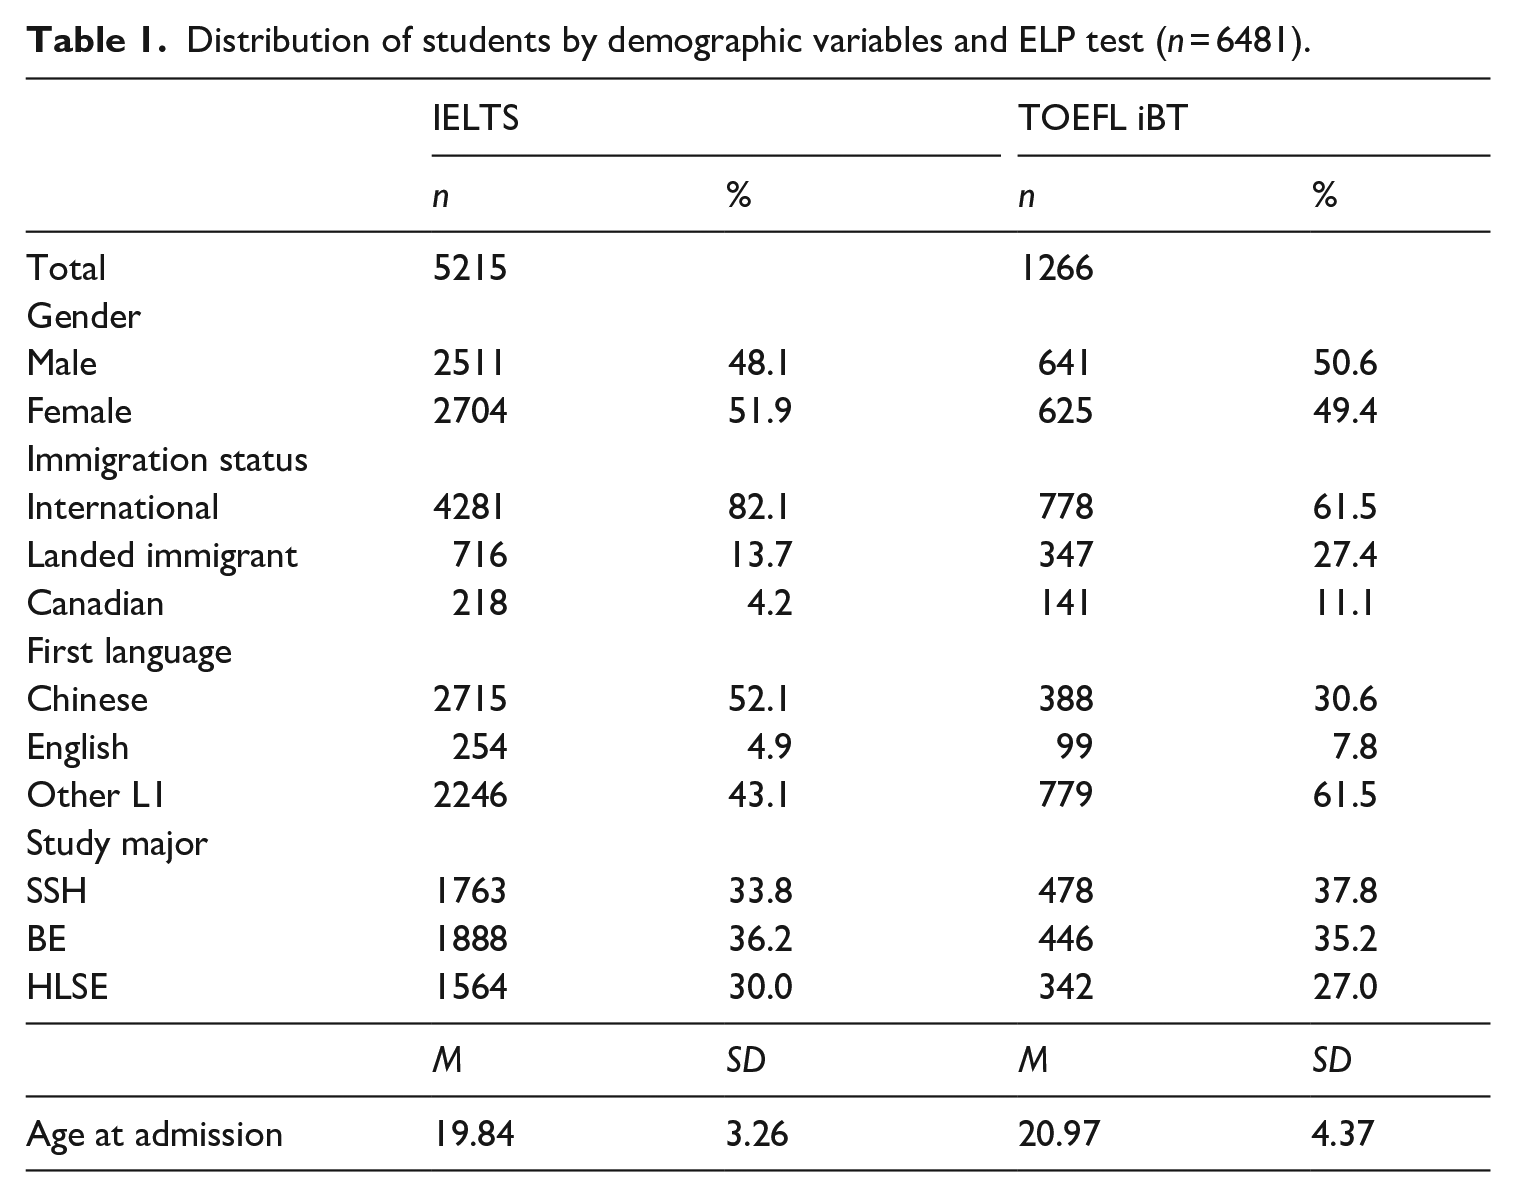
IELTS sample
The students’ age at admission ranged between 16 and 57 years (M = 19.84 years, SD = 3.26). Slightly over half (52%) were female; 48% were male. The majority (82%) were international students and about a seventh (14%) were landed immigrants.4 The students were citizens of 92 countries, with the largest contingents coming from China (62%), India (9%), and Iran (5%). They reported speaking 57 different first languages, with the largest groups being L1 speakers of Chinese (52%), Other L1 (28%), and English (5%). 5 The students were studying 90 distinct majors. As Barkaoui (2024) explained, using the classifications by the National Science Foundation (n.d.) and other studies (e.g., Cho & Bridgeman, 2012; Feast, 2002), study major was coded into three categories: social sciences & humanities (SSH, 34%; e.g., sociology, history), business & economics (BE, 36%; e.g., marketing, finance), and hard and life sciences & engineering (HLSE, 30%; e.g., biology, physics, engineering).
TOEFL sample
The students’ age at admission ranged between 16 and 57 years (M = 20.97 years, SD = 4.37). Half (51%) were female; 49% were male. The majority (62%) were international students, with 27% recorded as being landed immigrants and 11% Canadian citizens. The students were citizens of 85 countries, with the largest contingents coming from China (47%) and Canada (11%). They reported speaking 40 different L1s, with the largest groups consisting of L1 speakers of Chinese (31%), Other L1 (47%), and English (8%). The students were studying 81 majors in SSH (38%), BE (35%), and HLSE (27%).
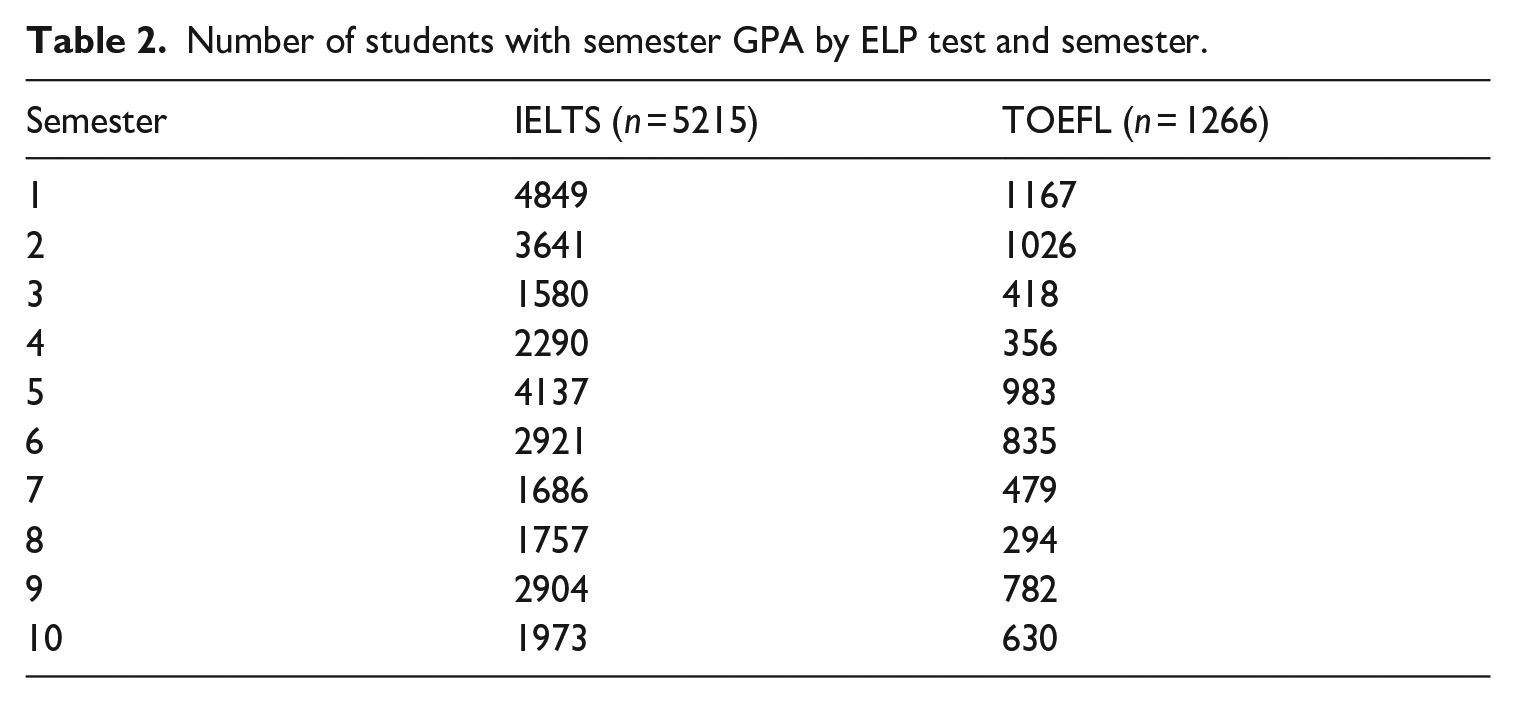
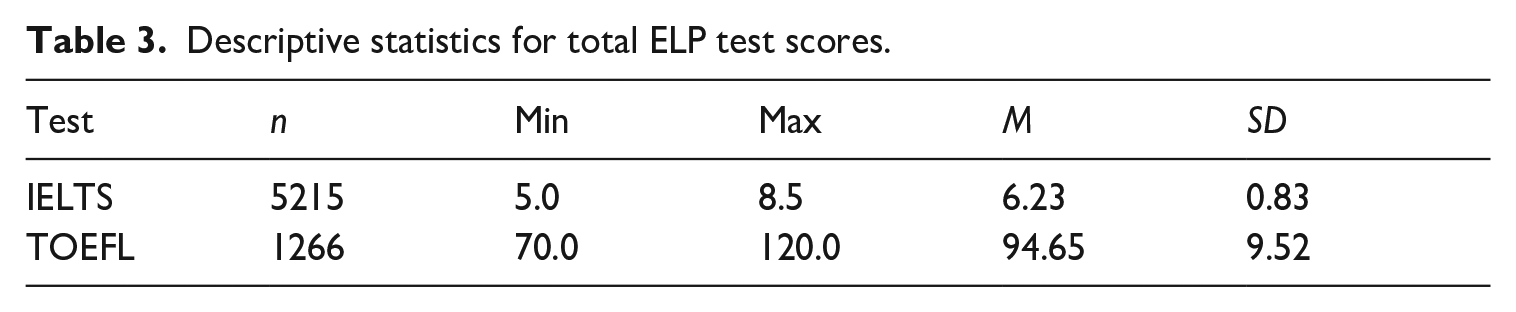
Not all students in the dataset had GPA data for 10 semesters. As Table 2 shows, there are fewer students with GPA data for later semesters, with a noticeable decline in the number of students having GPA data during the spring and summer semesters (semesters 3, 4, 7, and 8) compared to the fall and winter semesters. 6 Table 3 reports descriptive statistics for the total scores for each ELP test. See Appendix 1 for descriptive statistics for Admit GPA and Semester GPA by study major and semester for each sample.
Number of students with semester GPA by ELP test and semester.
Descriptive statistics for total ELP test scores.
Statistical analysis
Multilevel modeling (MLM) was used to examine the relationships between ELP test total scores, on one hand, and Semester 1 GPA and change in semester GPA over time, on the other hand, while controlling for the effects of Admit GPA and study major. In the Level-1 equation, we examined how semester GPA changes over time by estimating two parameters of change for each student: the intercept or their initial status (representing where their GPA trajectory starts) and the slope, representing the rate of change in their semester GPA over time. At level 2, the intercepts and slopes were treated as dependent variables. Student-related variables (i.e., study major) and covariates (i.e., ELP test scores, Admit GPA) were added as predictors of significant variation in students’ intercepts and slopes. In essence, the level-2 equations aimed to examine the factors explaining variation in both Semester 1 GPA and the rate of change in GPA over time across students (see Barkaoui, 2014; Hox, 2002; Singer & Willett, 2003). MLM offers the advantage of handling long time series and unbalanced datasets, where students may have varying numbers of data points (Hox, 2002). These advantages are pertinent to this study because the dataset is hierarchical, with semester nested within student, and includes a long time series (up to 10 time points per student). In addition, the dataset is unbalanced, as some students have GPA data for up to 10 semesters, while others have GPA data for fewer semesters, but not fewer than 3 (see Table 2).
The outcome variable in the MLM analyses was the semester GPA of each student for at least 3 semesters and up to 10 semesters. To examine whether there is a change in the shape (i.e., curvature) of students’ GPA trajectories over time, four terms representing time were included at level 1: Semester, Semester2, Semester3, and Semester4. Semester (ranging from 1 to 10) evaluates a linear change trajectory, which is whether GPA changes at a constant rate over time, which is represented by a straight line. Semester2 evaluates a quadratic change trajectory, determining whether the rate of change in GPA accelerates or decelerates over time. On a graph with time on the x-axis and GPA on the y-axis, this forms a parabola that opens upward (indicating acceleration) or downward (indicating deceleration). Semester3, the cubic term, examines whether the rate of change follows a nonlinear pattern, resulting in a GPA trajectory with inflection points where the direction of curvature changes, producing one peak and one trough. This can create an S-shaped curve on a graph. Finally, Semester4, the quartic term, evaluates if the trajectory has three inflection points, resulting in complex shapes like W-shaped or M-shaped curves, which show multiple turns and bends (e.g., two peaks and one trough or two troughs and one peak), indicating complex dynamics (Singer & Willett, 2003). At the student level (level 2), three predictors were entered in the following order:
Admit GPA, which was included to account for variation in students’ academic performance prior to their university admission.
The total score on either the IELTS or the TOEFL.
Study major, categorized into three groups.
MLM analyses were conducted separately for each ELP test using SPSS version 28.0. REML (Restricted Maximum Likelihood) estimation was used as commonly recommended for Mixed Models. To facilitate the interpretation of the intercept, semester, Admit GPA, study major, and total ELP test score were centered as follows. Semester 1 was set as the reference point with a code of 0; subsequent semesters were incrementally coded (semester 2 as 1 and so on). Admit GPA was centered by subtracting 5 from each student’s Admit GPA. Total ELP test scores were centered by subtracting the minimum required scores for admission to the university for each test: 6.5 for the IELTS and 83 for the TOEFL. For study major, SSH, the largest group, was designated as the reference discipline (coded as 0). This centering approach allows the intercept to be interpreted as the predicted average GPA (out of 9) in Semester 1 for a student majoring in SSH and admitted with an Admit GPA of 5 and an ELP test score at the cut score for the specific ELP test.
In line with recommendations from the literature (e.g., Hox, 2002; Singer & Willett, 2003), three main MLM analyses were conducted for each ELP test. The first analysis aimed to determine which predictors should be retained in the model. The second analysis examined the main effects of each predictor on semester GPA. This analysis examined how semester GPA changes over time and the effects of Admit GPA, ELP test score, and study major on semester GPA. The third analysis introduced interactions between the ELP total test score, on one hand, and time and study major, on the other, to examine whether the relationship between ELP test scores and semester GPA varied across time and study majors (see Appendix 2 for the MLM equations for both tests).
Before conducting the MLM analyses, plots of semester GPA trends over time were examined for a subset of the students to gain insight into the variety of students’ GPA trajectories over time. In addition, model diagnostics, including checking whether the residuals are normally distributed, were conducted. The residuals were found to be reasonably close to a normal distribution, indicating that the data met the normality assumption.
Finally, to cross-validate the MLM models, the dataset for each ELP test was randomly split into two subsets: an exploration subset and a validation subset, each containing approximately 50% of the students. Each MLM model was initially tested using the exploration subset to decide which predictors to keep or discard. Predictors were evaluated based on whether their regression coefficients significantly differed from zero at p < .05. Predictors with the highest p values above .05 were removed sequentially to assess the reduced model. Interaction terms that were statistically significant had their associated individual variables retained to present the interaction term in the proper context. When analyzing higher-order time variables (e.g., Semester4), lower-order time variables were included to ensure accurate interpretation. The models were evaluated using both the validation subset and the full dataset. Consistency of results across the three subsets was closely examined, with a particular focus on the validation subset and the entire sample. In all cases, the results remained consistent across the three subsets. Therefore, only the results for the full sample are reported below (see Table 4).
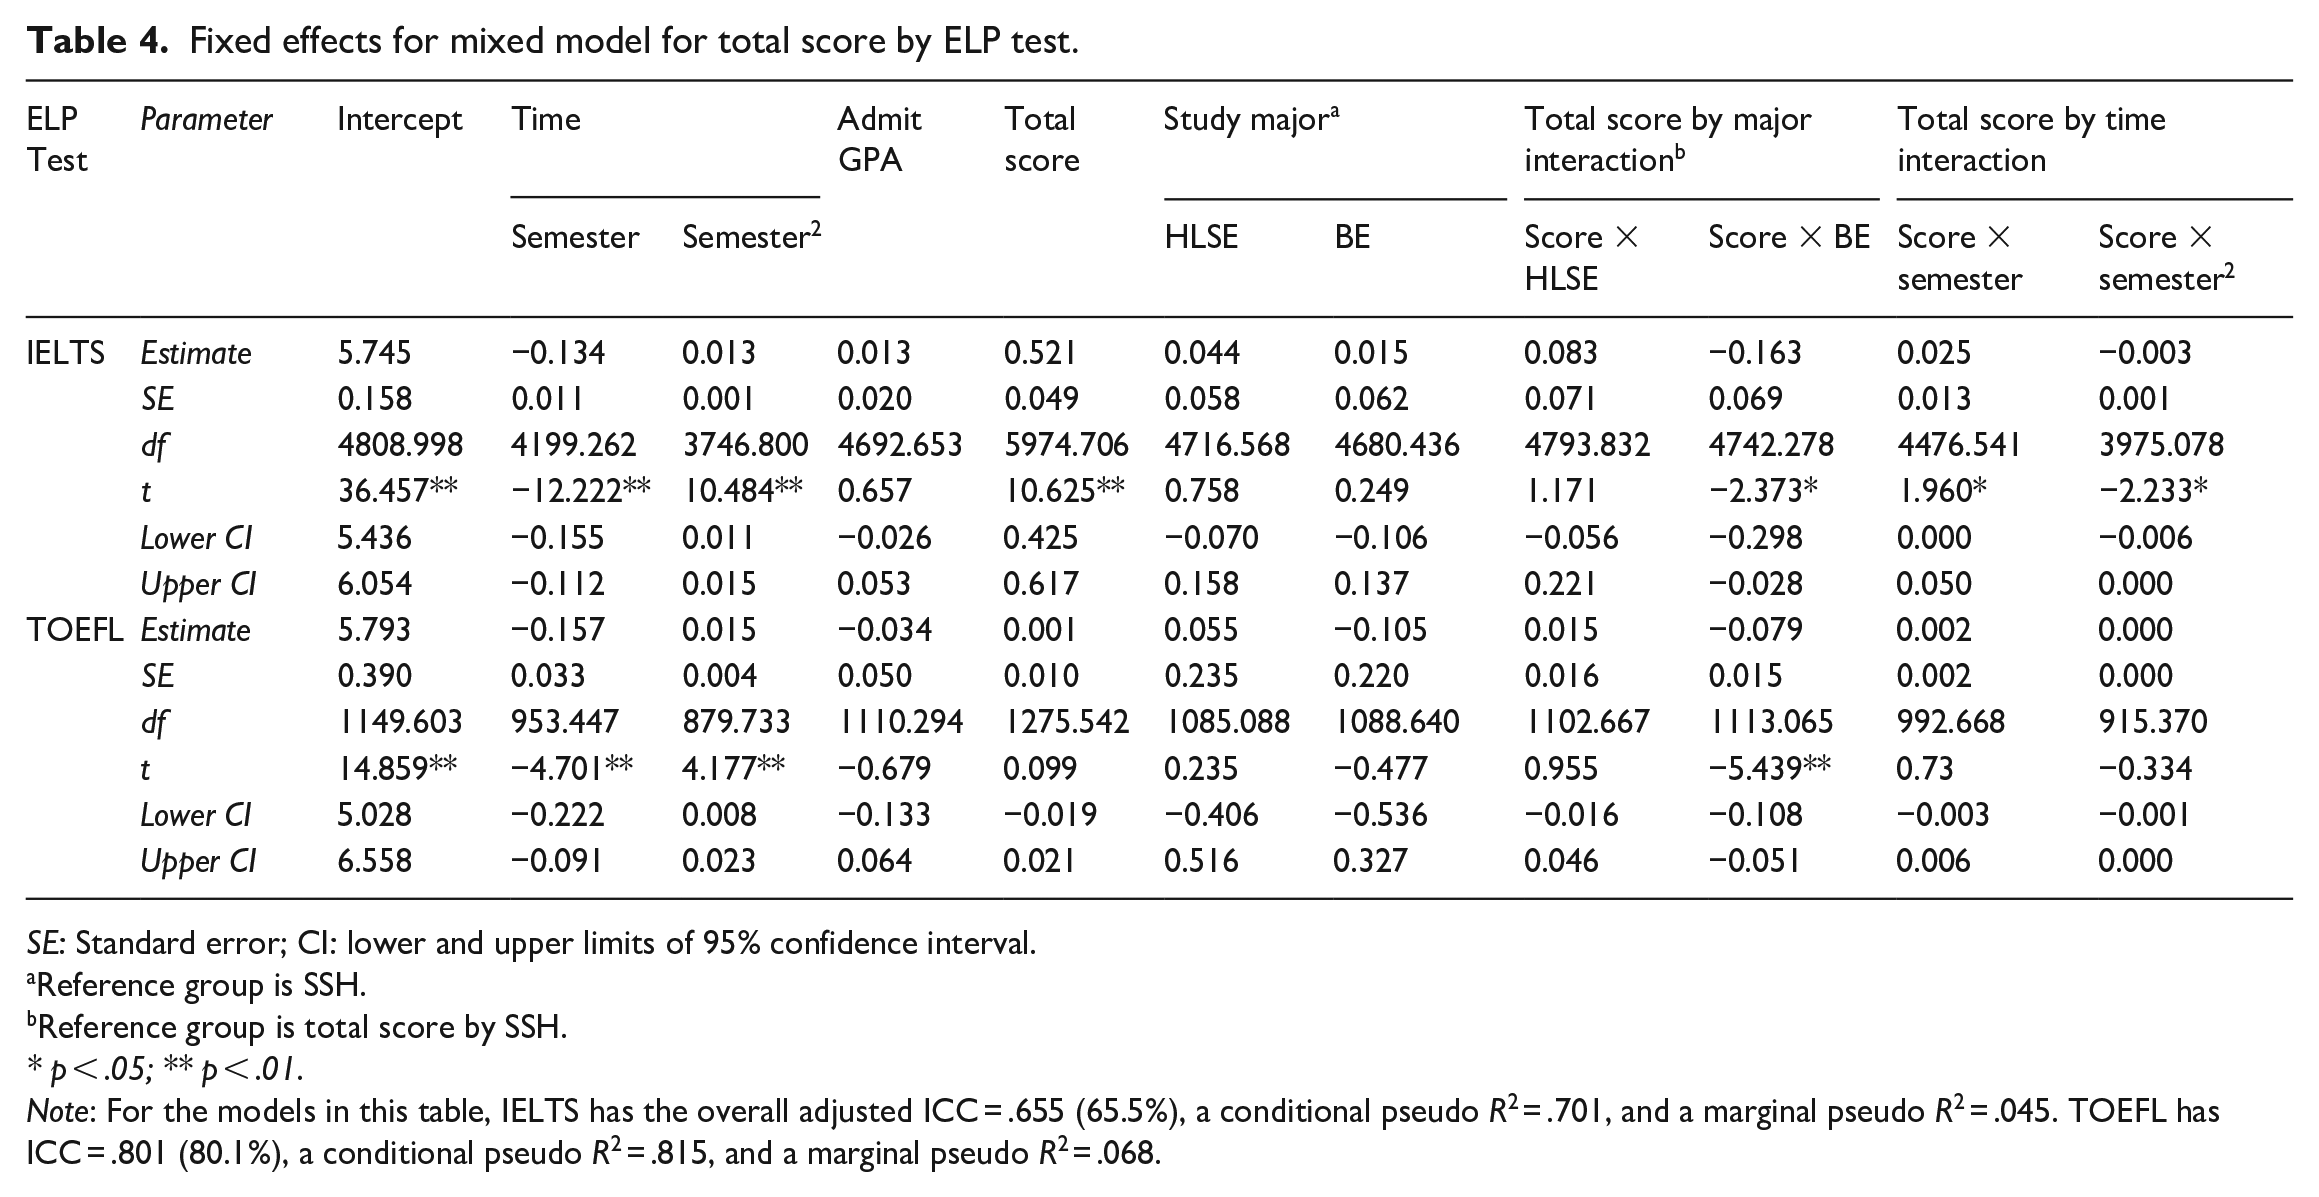
Fixed effects for mixed model for total score by ELP test.
SE: Standard error; CI: lower and upper limits of 95% confidence interval.
Reference group is SSH.
Reference group is total score by SSH.
* p < .05; ** p < .01.
Note: For the models in this table, IELTS has the overall adjusted ICC = .655 (65.5%), a conditional pseudo R2 = .701, and a marginal pseudo R2 = .045. TOEFL has ICC = .801 (80.1%), a conditional pseudo R2 = .815, and a marginal pseudo R2 = .068.
To assess model fit, both the Akaike Information Criterion (AIC) and the Bayesian Information Criterion (BIC) were examined, along with p values and 95% confidence intervals for predictor coefficients and interaction terms, to compare different models, including those with and without specific predictors like Semester3. Generally, models with lower AIC and BIC values indicate a better fit (Barkaoui, 2014; Hox, 2002). The final model (see Table 4) showed a significant improvement in fit over the null model, evidenced by substantial reductions in AIC and BIC for both tests. For IELTS, the null model had AIC = 146,248.96 and BIC = 146,266.07, whereas the final model had AIC = 103,278.89 and BIC = 103,336.50. For TOEFL, the null model had AIC = 41,918.24 and BIC = 41,932.85, while the final model had AIC = 26,163.93 and BIC = 26,211.86 (see note under Table 4 for additional diagnostic statistics).
Results
The initial MLM analyses revealed that while Semester and Semester2 were statistically significant, the additional curvature introduced by Semester3 and Semester4 did not reach statistical significance at p < .05. 7 Furthermore, upon examining interactions among predictors, it was found that some of the interaction terms were not statistically significant. Consequently, these non-significant interaction terms were excluded from subsequent models. The final model for each ELP test included Semester and Semester2 at level 1, and Admit GPA, ELP test total score, and study major at level 2.
Table 4 reports the fixed and interaction effects for the final MLM model for each ELP test. Fixed effects, which include the intercept of the outcome and a slope for each predictor, can be interpreted similarly to Beta coefficients in multiple regression analysis. The slope for each predictor indicates the strength of the association between the predictor and Semester 1 GPA, controlling for the effects of other predictors in the model. The coefficients for Semester and Semester2 in the model reflect the rate and shape (linear, quadratic) of change in GPA over semesters, with the rate of change denoting the amount of change in GPA from one semester to the next.
Results for the IELTS sample
Table 4 shows that the coefficients for Semester and Semester2 for the IELTS sample are both statistically significant, indicating a pattern of declining and then increasing semester GPA over time, as illustrated in Figure 1. The intercept, representing the average Semester 1 GPA for the reference group, is 5.745. This initial GPA shows an average decline of 0.134 points each semester. However, the significant positive Semester2 coefficient (0.013) indicates a decrease in the rate of GPA decline over time. While the trajectory initially declines with an average decrease of 0.134 points in the first semester, the positive Semester2 coefficient indicates that this decline does not persist; with each passing semester, the magnitude of the decline in GPA diminishes or tapers off by 0.013 points. The positive coefficient for Semester2 suggests a concave upward curve with respect to time. As depicted in Figure 1, this leads to a turning point around Semester 8 (coded 7 in Figure 1) where GPA starts to increase over time.
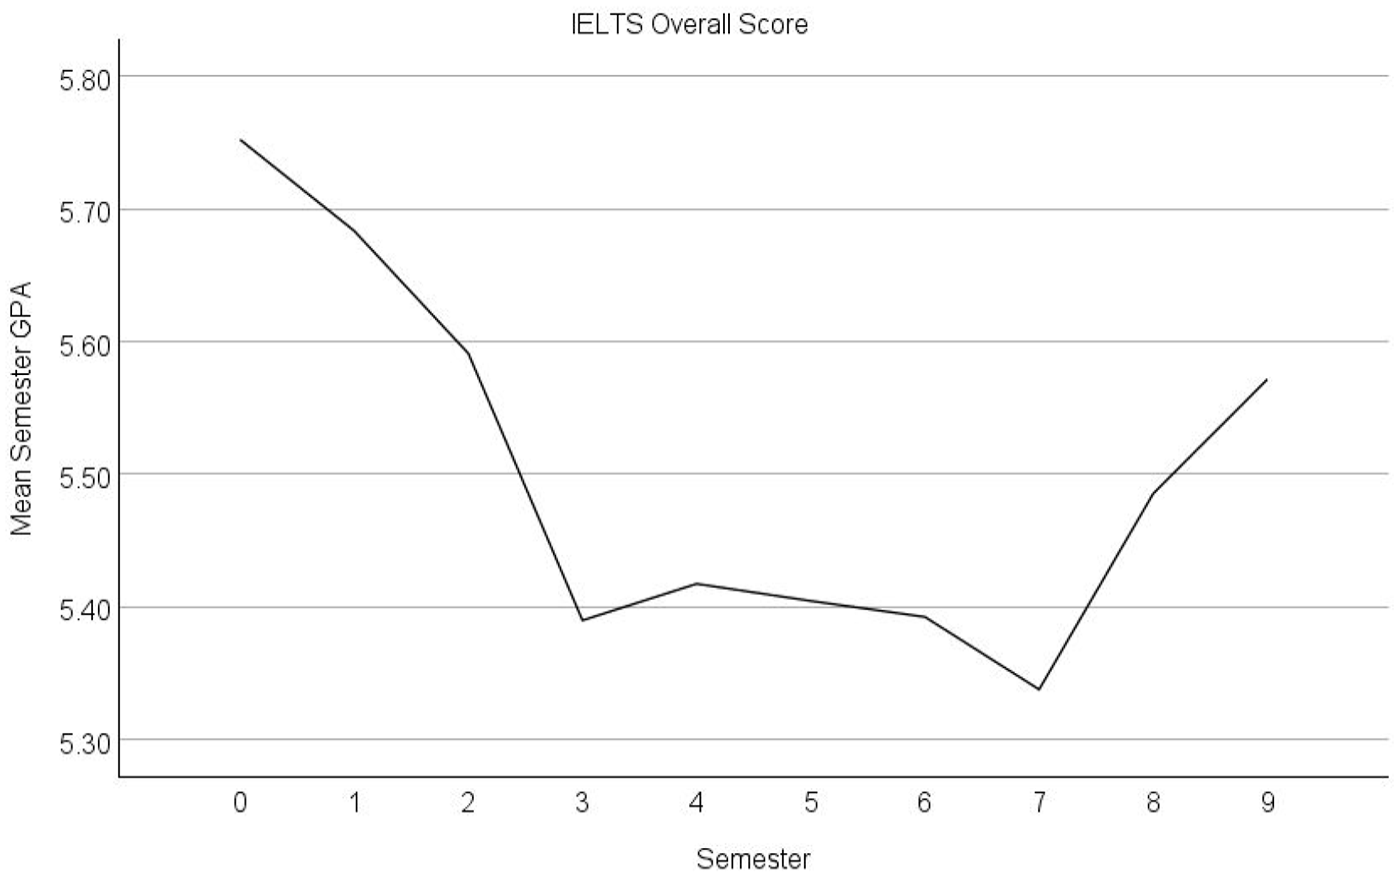
Mean semester GPA over 10 semesters for the IELTS sample (Semester 1 coded as 0).
The coefficients for study major, Admit GPA, and ELP test total score in Table 4 convey the amount of difference in Semester 1 GPA between the different levels of study major and the impact of each one-point increase in Admit GPA and IELTS overall score, as in cross-sectional studies. Admit GPA and study major were not significantly associated with Semester 1 GPA, although, generally, students with higher Admit GPA tended to have slightly higher Semester 1 GPA (by 0.013 points, on average). It is worth noting that Admit GPA had a negative non-significant correlation with IELTS scores (r = −.004), as shown in Table 5. SSH students tended to have a marginally lower Semester 1 GPA compared to their counterparts in BE (by 0.015 points, on average) and in HLSE (by 0.044 points, on average).
Correlations between ELP test score and admit GPA and semester 1 GPA by study major and test.
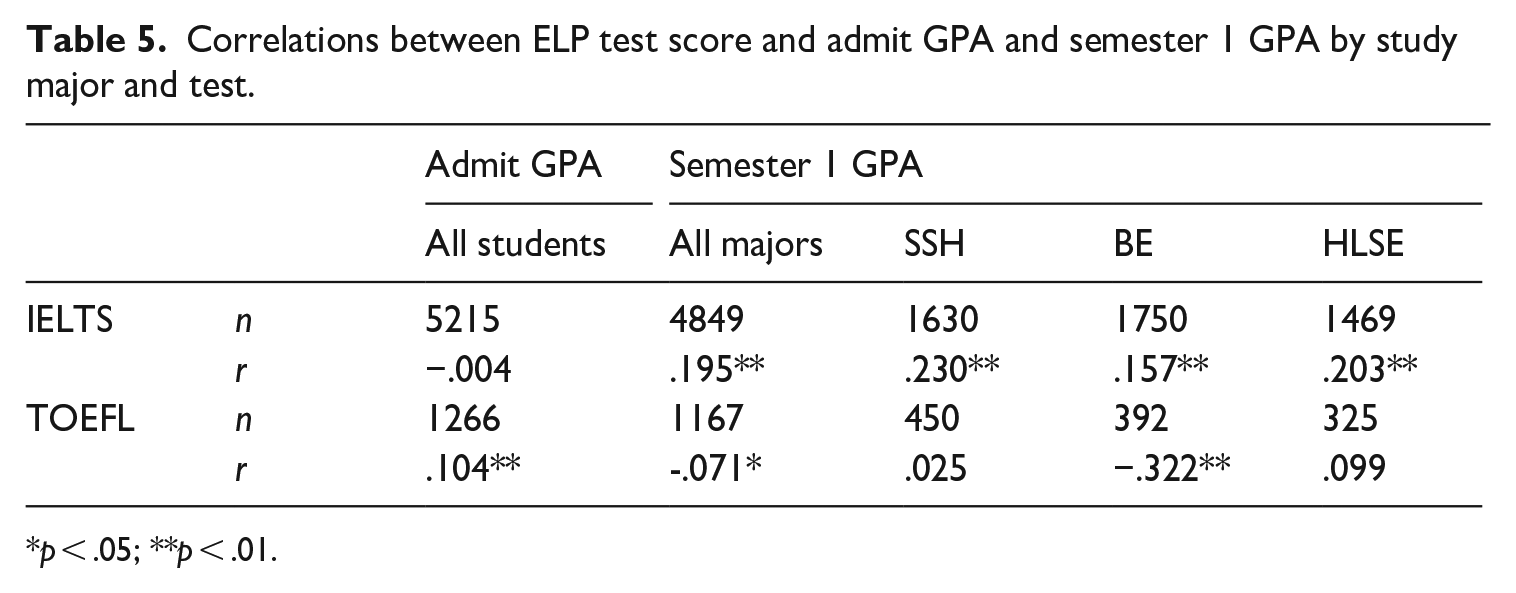
p < .05; **p < .01.
In contrast, the IELTS overall score had significant and positive association with Semester 1 GPA. On average, a one-band increase in IELTS overall score was associated with a half-point increase (0.521) in Semester 1 GPA. This is also reflected in the significant and positive correlation (r = .195) between IELTS overall scores and Semester 1 GPA in Table 5. In other words, students with higher IELTS overall scores can be expected to achieve a higher GPA in Semester 1 than those with lower scores.
The last four columns of Table 4 report results concerning the interactions between study major and time (i.e., Semester and Semester2), on one hand, and ELP test total score, on the other. Significant study major by total score interactions, akin to significant interaction effects in analysis of variance (ANOVA), indicate that the effects of ELP test total score on Semester 1 GPA is contingent on study major. Significant time by total score interactions, on the other hand, indicate the effects of variation in ELP test scores on students’ GPA trajectories over time.
Table 4 shows a significant interaction effect of overall IELTS score and BE, compared to SSH on Semester 1 GPA. This significant interaction effect indicates that, compared to SSH students, the effect size of overall IELTS score on Semester 1 GPA for BE students tended to be lower by 0.163 points for each one-band increase in overall IELTS score. This implies that the impact of the interaction diminishes as the IELTS overall score increases. Consequently, a one-band increase in IELTS overall score would predict a change of, (−0.163 × 1) + 0.015 = −0.148 points in Semester 1 GPA for BE students compared to SSH students. While HLSE students had a small positive coefficient for the interaction compared to SSH students, it was not statistically significant. The impact of these interaction effects on Semester 1 GPA is illustrated in Figure 2. The results of the correlation analyses in Table 5 show this impact as a weaker association between IELTS scores and Semester 1 GPA for BE students (r = .157) compared to SSH (r = .230) and HLSE (r = .203) students.
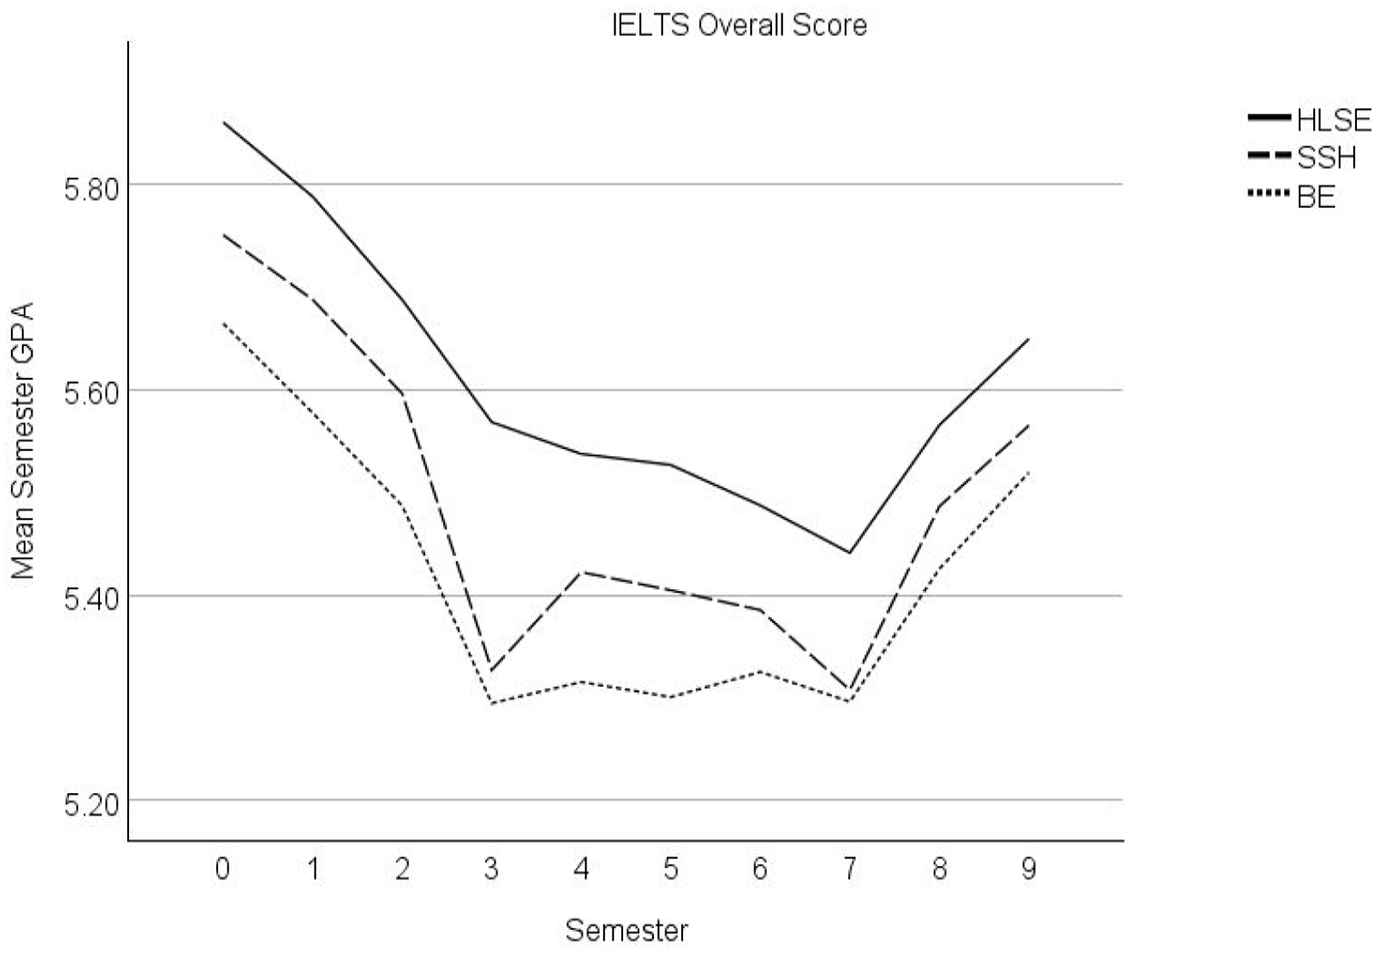
Mean semester GPA over 10 semesters by study major for the IELTS sample (Semester 1 coded as 0).
There were also significant interactions between overall IELTS score, on one hand, and Semester and Semester2, on the other hand. The interaction with Semester is positive whereas that with Semester2 is negative. The net coefficients of Semester and Semester2 are adjusted depending on the magnitude of the IELTS overall score. The observed values of the IELTS overall score range from 5.0 to 8.5. The net coefficient of Semester is calculated as -0.134 + (0.025 × [IETLS overall score − 6.5]), and it remains negative across the observed range of IELTS scores. This result implies that part of the curving down and up in semester GPA, caused by the positive net coefficient of Semester2, occurs over the span of the 10 semesters, as illustrated in Figures 1 and 2. The net coefficient of Semester2 is calculated as 0.0130 + (−0.0032 × [IELTS overall score − 6.5]). The range of values of the net coefficient of Semester2 is then 0.0066 (i.e., 0.0130 + [−0.0032 × 2.0]) to 0.0178 (i.e., 0.0130 + ([−0.0032 × −1.5]]. As a result, the net coefficient of Semester2 remains positive, indicating that semester GPA continues to be concave upward over the 10 semesters. However, the net coefficient of Semester2 decreases as the IELTS overall score increases. In simpler terms, as the IELTS overall score increases, the amount of the curved dip down and up in semester GPA over the semesters diminishes.
This pattern is illustrated in Figure 3 which shows the semester GPA (x-axis) by semester (y-axis) for students with IELTS overall score of 5.00 (solid line), 6.50 (dashed line), and 8.50 (dotted line). Figure 3 shows that although all three students start with similar GPAs in Semester 1 (coded as 0), they exhibit different patterns of decline then increase in their Semester GPA over the 10 semesters. The student with the lowest IELTS score (5.00, solid line) exhibits the largest decline, while the student with the highest score (8.5, dotted line) undergoes the least amount of decline over time, suggesting a higher level of resilience.
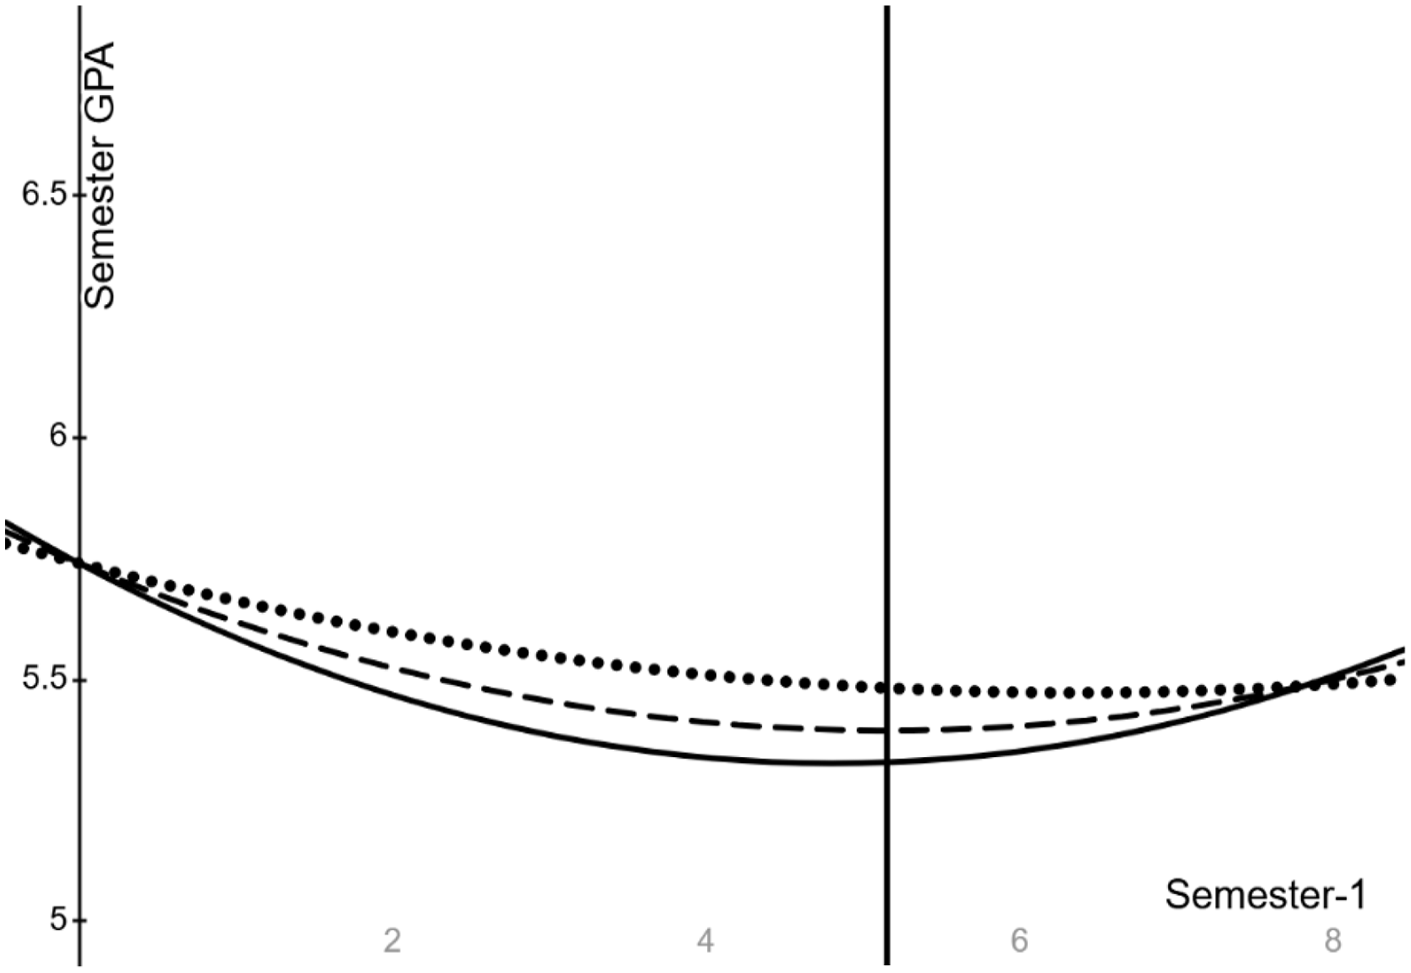
Semester GPA (x-axis) by Semester-1 (y-axis) for students with IELTS overall score of 5.00 (solid line), 6.50 (dashed line, at cut score), and 8.50 (dotted line).
Results for the TOEFL iBT sample
The significant coefficients for both Semester and Semester2 for the TOEFL sample in Table 4 suggest a pattern of declining and then increasing semester GPA over time, as illustrated in Figure 4. The average Semester 1 GPA for the reference group is 5.793. This initial GPA shows an average decline of 0.157 points each semester. However, the magnitude of this decline diminishes by 0.015 points each subsequent semester. Consequently, GPA begins to increase over time after semester 4 (coded 3 in Figure 4).
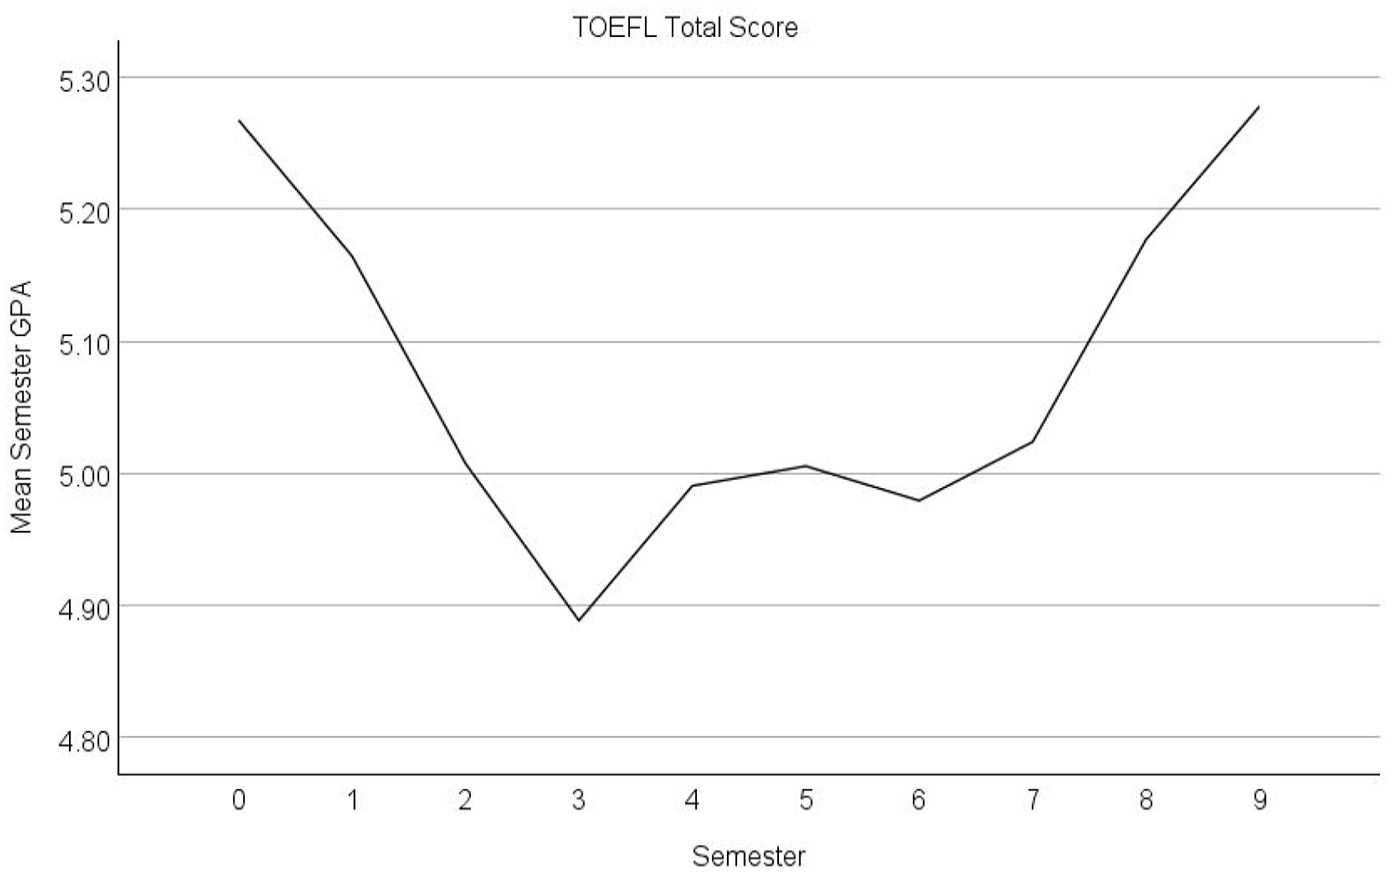
Mean semester GPA over 10 semesters for the TOEFL sample (Semester 1 coded as 0).
Admit GPA, study major, and the TOEFL overall score were not significantly associated with Semester 1 GPA. As indicated in Table 4, a one-point increase in Admit GPA was associated with a small decline of 0.034 points in Semester 1 GPA. As Table 5 shows, however, Admit GPA had a positive and significant correlation with TOEFL scores (r = .104). These patterns suggest that, as student pre-university academic achievement increases, their TOEFL scores tend to increase, but their academic achievement at university seems to decline. Generally, students in SSH tended to have slightly higher Semester 1 GPA compared to students in BE (by 0.105 points, on average) and slightly lower Semester 1 GPA compared to students in HLSE (by 0.055 points, on average), but these differences were not statistically significant. Finally, Table 4 shows that a one-point increase in the TOEFL total score was associated with a 0.001-point increase in Semester 1 GPA. Simple correlation analyses (Table 5) indicated that TOEFL scores correlated weakly and negatively with Semester 1 GPA (r = −.071).
As shown in Table 4, there were significant interactions for total TOEFL score with study major, but not with time. The significant interaction between the overall TOEFL score and BE suggests that for BE students, compared to SSH students, the effect size of the overall TOEFL score on Semester 1 GPA tended to be lower by 0.079 points per one-point increase in TOEFL overall score. Although HLSE students had a small positive coefficient for the interaction compared to students in SSH, it did not reach statistical significance. The impact of these interaction effects is visually shown in Figure 5. The results of the correlation analyses in Table 5 show this impact as a stronger but negative correlation between TOEFL scores and Semester 1 GPA for BE students (r = −.322) compared to the positive but non-significant correlations for SSH (r = .025) and HSE (r = .099) students. Last, because there were no significant interactions between TOEFL score and time, indicating that GPA trajectories did not vary significantly by the TOEFL total score, Figure 6 shows the semester GPA (x-axis) by semester (y-axis) for only a student with a TOEFL overall score at the cut score of 83 (solid line).
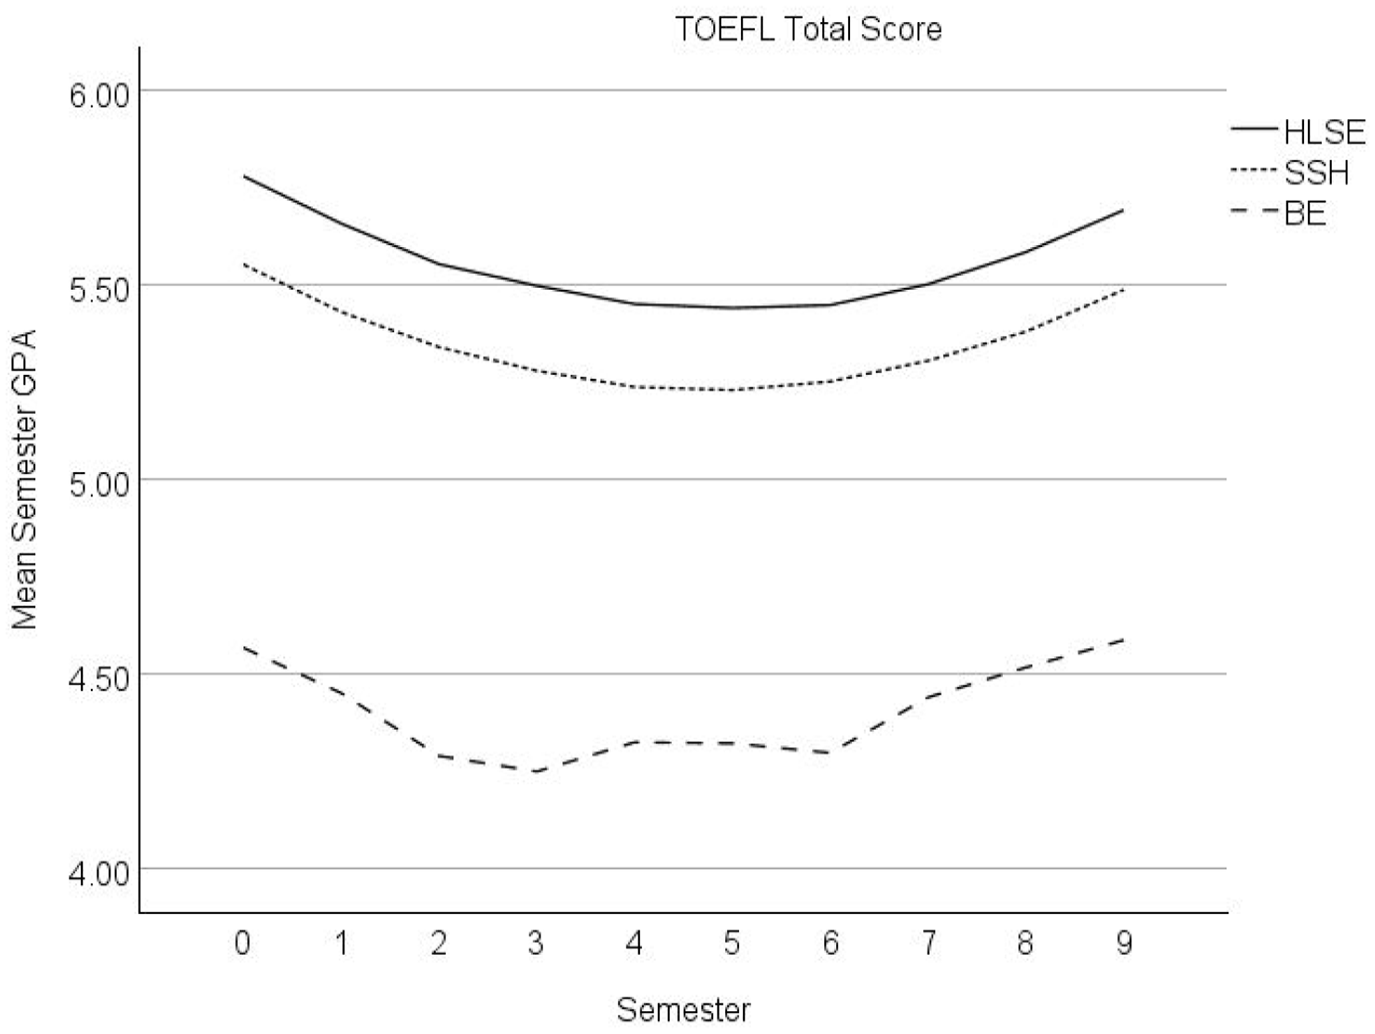
Mean semester GPA over 10 semesters by study major for TOEFL sample (Semester 1 coded as 0).
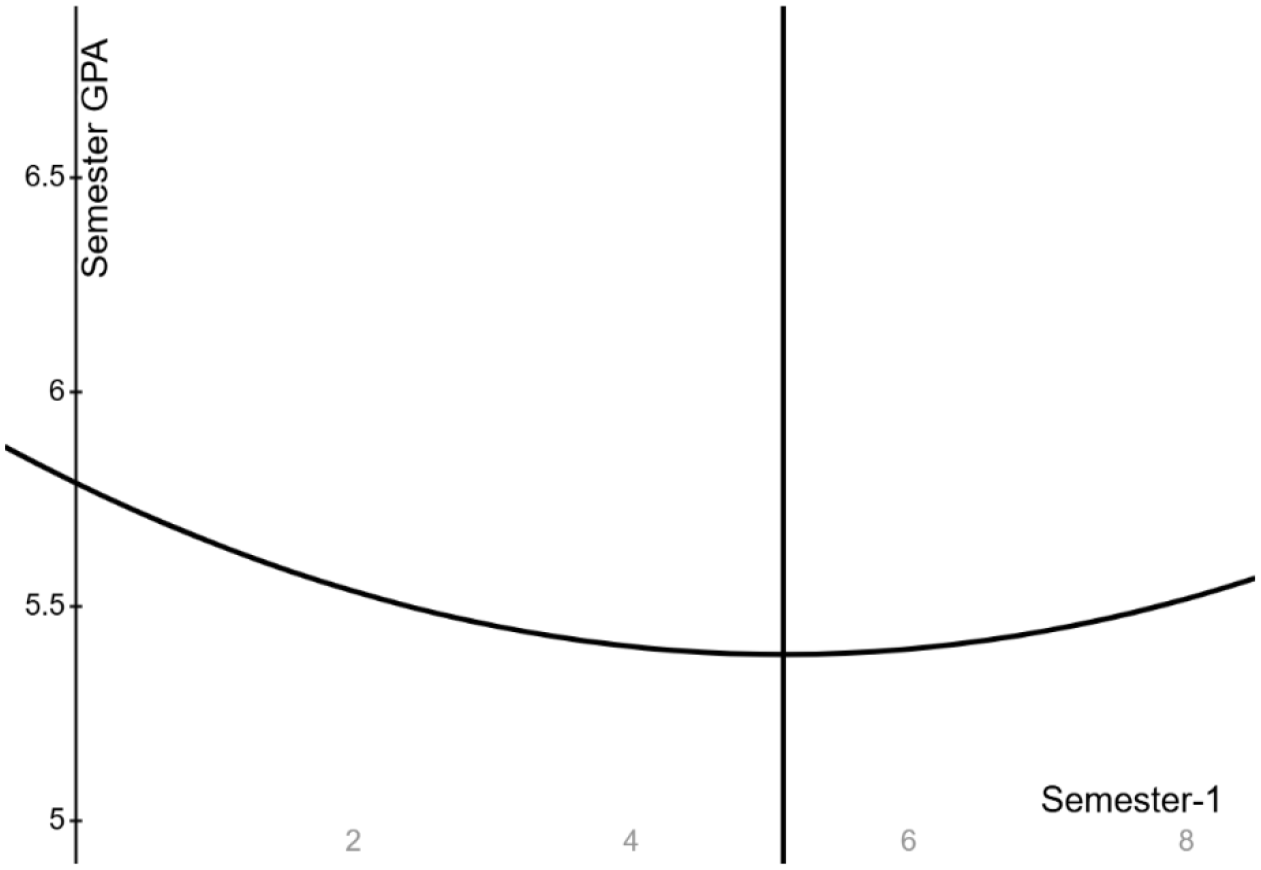
Semester GPA (x-axis) by semester-1 (y-axis) for students with TOEFL total score of 83 (solid line, at cut score).
Finally, to estimate the explanatory contribution of each predictor in the MLM models, the predictors were fit in a pre-selected order successively one at a time. Table 6 reports the percentage of variance in Semester 1 GPA that each predictor explained in the final MLM model without the interaction effects for each ELP test. The five predictors in the models collectively accounted for approximately 4% of the variation in students’ Semester 1 GPA for the IELTS sample and 3.37% for the TOEFL iBT sample. The results in Table 6 indicate that each predictor made a modest contribution to explaining the variation in Semester 1 GPA, with ELP test score explaining the largest portion of variance (3.93%) for the IELTS sample, but only 0.06% for the TOEFL iBT sample.
Percent variance in semester 1 GPA explained by predictors in the final MLM model.
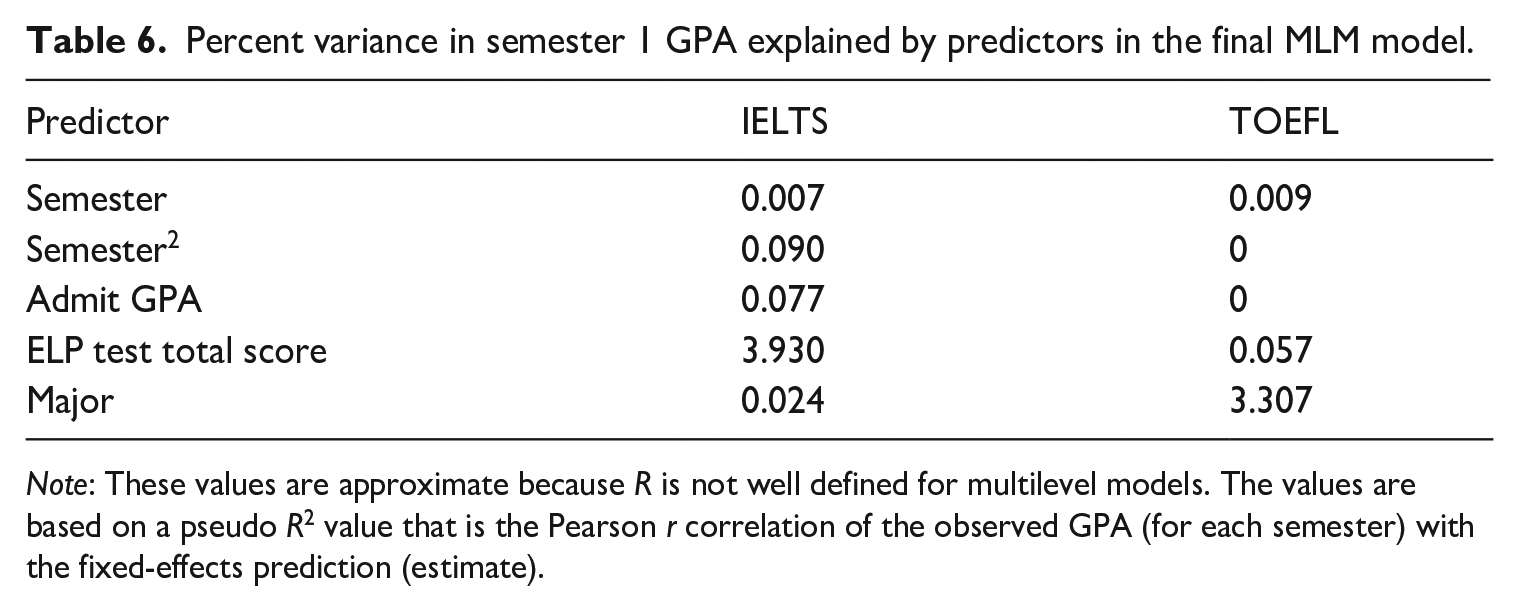
Note: These values are approximate because R is not well defined for multilevel models. The values are based on a pseudo R2 value that is the Pearson r correlation of the observed GPA (for each semester) with the fixed-effects prediction (estimate).
Discussion and implications
The present longitudinal study set out to examine and compare the strength of the associations between scores on the IELTS-Academic and the TOEFL iBT and the academic achievement of non-English background undergraduate students during the first 10 semesters of their study at a Canadian, English-medium university. The findings suggest that the association between ELP and academic achievement in the first semester, as measured by Semester 1 GPA, is test dependent. MLM results indicated that IELTS overall scores exhibited a significant and positive association with Semester 1 GPA, whereas the TOEFL total score did not. Correlation analyses also indicated that IELTS scores exhibited stronger associations with Semester 1 GPA compared to the TOEFL iBT, irrespective of study major. The correlation between TOEFL scores and Semester 1 GPA was negative and weak. On average, a one-band increase in IELTS total score was associated with a half-point rise (0.521) in Semester 1 GPA, while a 10-point 8 increase in TOEFL total score was, on average, associated with a hundredth point (0.01) increase in Semester 1 GPA.
These findings align with previous studies suggesting that the strength of the association between ELP and academic achievement varies depending on the chosen ELP test (e.g., Arcuino, 2013; Hill et al., 1999; Isaacs et al., 2023; Johnson & Tweedie, 2017; O’Dwyer et al., 2018; Woodrow, 2006). However, this contrasts with Ihlenfeldt and Rios’s (2022) meta-analysis, which found no differences in the predictive powers of the TOEFL and the IELTS. Ihlenfeldt and Rios concluded that there is no need for admissions decision-makers to assign different weights to different ELP tests. In the current study, the IELTS appears to exhibit a stronger predictive power. However, it is not clear why the IELTS has a stronger association with Semester 1 GPA compared to the TOEFL iBT. This might be due to the degree of alignment between the content of the tests and the nature of the language skills and tasks required in the university where this study was conducted. To test this hypothesis, future studies can analyze and compare representative samples of the language tasks and skills required in the university and those assessed by the two ELP tests. Another possible explanation for the variation in the strength of the association between ELP test scores and academic achievement across the two tests may stem from differences in the composition of the TOEFL and IELTS test-taker groups (see below).
Second, the study confirmed the impact of students’ fields of study on the strength of the association between ELP and academic achievement. Specifically, in comparison to SSH students, the impact of ELP test total score on Semester 1 GPA tended to be lower for BE students. This impact is reflected in the correlation analyses results too. Specifically, for the IELTS, the correlations between test scores and Semester 1 GPA were stronger for SSH and HLSE students than that for BE students. TOEFL iBT scores tended to correlate strongly but negatively with Semester 1 GPA for BE majors and positively and weakly with Semester 1 GPA for SSH majors. These patterns seem to suggest that the association between ELP and Semester 1 GPA is stronger and positive for SSH students but weaker or negative for BE students. One possible explanation for this finding is that BE studies may involve content that higher language proficiency does not necessarily help master, such as mathematics.
In addition, there were some differences in Semester 1 GPA across study majors. Generally, SSH students tended to achieve slightly lower Semester 1 GPA compared to HLSE students. Moreover, in the IELTS sample, SSH students tended to have lower Semester 1 GPA than their BE counterparts. In contrast, in the TOEFL sample, SSH students generally tended to achieve higher Semester 1 GPA than BE students. Several previous studies have found significant variation in academic achievement across study majors, significant differences in ELP test scores among students in different majors, and significant variation in the strength of the association between ELP test scores and academic achievement across study majors (e.g., Bo et al., 2022; Cho & Bridgeman, 2012; Feast, 2002; Harsch et al., 2017; Isaacs et al., 2023; O’Dwyer et al., 2018; Schoepp, 2018; Wait & Gressel, 2009). These findings suggest that students who choose different ELP tests may perform differently in various academic disciplines, perhaps because they have different academic abilities. Another possible reason for the variation in GPA across different majors could be the variability in course requirements and grading criteria across study majors.
Understanding the field-specific effects of ELP on academic achievement is crucial for tailoring targeted support and academic interventions to meet the diverse needs of students across various academic disciplines. For example, the findings above suggest that the academic achievement of BE students seems to be less affected by ELP compared to their counterparts in SSH. This may be attributed to the higher linguistic demands associated with SSH majors and courses compared to BE ones as some previous studies have found (e.g., Bo et al., 2022; Harsch et al., 2017; Isaacs et al., 2023; Schoepp, 2018). Consequently, one implication is that students in SSH majors need more language support both before and during their university studies (cf. Bo et al., 2022).
Third, pre-university academic performance, as measured by Admit GPA, had weak and mostly non-significant associations with both ELP test scores and academic achievement at university (i.e., Semester 1 GPA). Only TOEFL scores correlated significantly with Admit GPA, suggesting that students who had higher academic achievement before admission to the university tended to obtain higher TOEFL scores. However, the association between Admit GPA and Semester 1 GPA was negative for the TOEFL sample. For the IELTS sample, Admit GPA was not significantly associated with Semester 1 GPA, although, students with higher Admit GPA generally tended to have higher Semester 1 GPA. The weak associations observed between pre-university academic performance and ELP test scores, as well as academic achievement, in this study may be attributed to issues with the validity and reliability of Admit GPA as a measure of pre-university academic performance.
Fourth, the study’s longitudinal approach revealed a consistent pattern of initial decline followed by an increase in semester GPA over time, regardless of the chosen ELP test and study major. As highlighted by a reviewer of an earlier version of this paper, the U-shaped trajectory of academic achievement is well-documented in higher education and is due to various factors. However, the slight differences observed between the trajectories of the two groups suggest that ELP and the distinct characteristics of students who choose different ELP tests may influence the trajectories of students’ academic achievement. Specifically, the average Semester 1 GPA differed across the two samples, with the average Semester 1 GPA for the reference group (i.e., the intercept) being slightly higher for those students who took the TOEFL iBT (5.793) compared to those who took the IELTS (5.745). However, students opting for the TOEFL exhibited a slightly larger average initial decline in semester GPA (by 0.157 points) than the IELTS takers (0.134 points), while the latter exhibited a slightly smaller reduction in the magnitude of the decline in their semester GPA (by 0.013 points) than the TOEFL takers (by 0.015 points). Consequently, GPA began to rise over time around semester 8 for the IELTS sample but after semester 4 for the TOEFL sample. These differences in trajectories between the two groups may be attributed to variations in ELP and other characteristics of the students who choose to take each ELP test.
Differences in academic achievement in the first semester and over time among the two samples may stem from differences in the characteristics of students opting for the two ELP tests, characteristics that may be associated with academic achievement but were not considered in this study. For example, as Table 1 shows, the IELTS sample included a larger percentage of international students (82%) compared to the TOEFL sample, which included a larger proportion of landed immigrants (27%) and Canadian citizens (9%). In addition, only 31% of the TOEFL takers reported Chinese as their L1, whereas over half of the IELTS takers were Chinese L1 speakers. Immigration status and L1 might be proxies for other factors linked to ELP and academic achievement, such as education system and nature and length of experience with the English language and familiarity with the Canadian context. L1 and immigration status may also influence the strength of the association between ELP test scores and academic achievement (cf. Bridgeman et al., 2016). This potential mediating effect was not explored in this study, but it could be a valuable area for future research. Another plausible explanation could be that the two tests measure distinct aspects of academic English and/or that scores on these tests are not equivalent (cf. Green, 2018). Further research is needed to uncover the factors contributing to variation in the academic achievement trajectories of students opting for either ELP test. Such research can enhance our understanding of these trends and differences among the two ELP test samples and offer important insights for developing targeted interventions to support students during different phases of their academic journey.
Fifth, a finding to underscore in this study is the significant interactions between the IELTS scores and time. TOEFL scores did not exhibit such a significant interaction with time. The significant IELTS score by time interactions suggest that students with varying ELP levels, as measured by IELTS scores, may follow different academic achievement trajectories, even if they initially attain the same GPA in the first semester. Specifically, students with lower IELTS scores tend to exhibit a more pronounced decline in semester GPA over time compared to those with higher scores, who tend to exhibit a more resilient pattern with less decline in semester GPA over time. This finding shows that limiting research on the relationship between ELP test scores and GPA solely to the first semester or year (i.e., adopting a cross sectional approach) fails to provide a complete picture of this relationship and may overlook significant effects of ELP on academic achievement over time. For example, some studies found weak to no associations between ELP test scores and academic achievement in the first semeseter or year (e.g., Bridgeman et al., 2016; Ingram & Bayliss, 2007). This could lead one to conclude that low ELP is not a significant deterrent to academic success and to question the use of ELP test scores in admission decisions. However, such a conclusion overlooks the potential cumulative impact of ELP on GPA trajectory over an extended period of university study.
The finding that ELP can continue to excert a significant effect on students’ academic achievement trajectories, with those possessing low ELP continuing to underachieve throughout their studies compared to their peers, underscores the importance of providing continuous English language support for these students at Englih-medium universities. This support should extend throughout their entire academic journey, rather than being confined to the initial year of their studies, to ensure sustained academic success. These students should also be encouraged and provided with opportunities to continue to work on and improve their ELP after admission and throughout their university studies.
Taken together, these results suggest that IELTS is not only more effective at predicting academic achievement at the start of university studies (i.e., Semester 1), but can also provide insight into the trajectory of academic achievement over time. This predictive ability can be used to offer students targeted support throughout their academic journey. In contrast, TOEFL iBT scores do not appear to offer similar predictive information in the context of the university where the current study was conducted. This suggests that IELTS scores can be a more useful tool for planning English language support for international students.
Finally, the study highlights the limited predictive power of ELP test scores. Collectively, the two tests only explained a modest percentage of the variance in Semester 1 GPA. IELTS scores exhibited the highest explanatory power, while the TOEFL explained a very small portion of GPA variance. This finding does not mean that ELP plays a negligible or no role in university academic achievement; rather, it underscores that factors beyond language proficiency, such as student motivation, social and academic support, and teaching quality, play a more substantial role in determining academic achievement (cf. Hill et al., 1999). Consequently, universities and researchers should take these factors into consideration when making admission decisions and examining the relationships between ELP and academic achievement.
Limitations and future research
Several limitations of the current study warrant acknowledgment. First, the study was limited to examining one indicator of academic achievement, semester GPA. While GPA is a widely used metric of university academic achievement due to its convenience, it suffers from several drawbacks, as noted above (Abunawas, 2014). Second, the study relied on archival data, which poses constraints in terms of the variables available for analysis and the presence of missing data for some students. Third, this study employed a between-subject design, comparing different groups of students admitted through different ELP tests. While this is a natural consequence of students choosing which ELP test to take, it can lead to sustantial variations between the groups on variables not examined in the study, which could potentially account for the observed differences in academic achievement among these groups. Fourth, the study did not consider the effects of student-related variables, such as L1, country (e.g., as a proxy of education system), and gender, on ELP test scores, academic achievement, and their relationships, although evidence from previous studies suggests that these effects can be substantial (e.g., Bridgeman et al., 2016; Feast, 2002; Harsch et al., 2017; Thorpe et al., 2017). Fifth, as noted above, the measure of pre-university academic achievement used in this study, Admit GPA, may lack robustness. Sixth, the study examined only the outcomes of ELP and academic acheievement and not the processes involved in shaping both. As a result, while significant differences and relationships were identified between these measures and across disciplines and time, the reasons for these differences and associations could not be identified. Seventh, variations in samle sizes 9 and compositions (e.g., L1, age) between the two tests, which reflect broader trends in university admissions, might have influenced the results. The differences in sample composition could potentially explain some of the disparities in academic achievement trajectories between the two groups. Finally, the study included only undergraduate students, and therefore, the findings may not be applicable to graduate students.
Despite these limitations, the study has offered insights into the long-term relationship between ELP and academic achievement and has important implications for future research. First, research on the relationship between ELP and academic achievement at university needs to recognize the influence of the chosen ELP measure on estimates of this relationship. Second, the finding that ELP can continue to exert a significant effect on students’ academic achievement trajectories challenges the conventional focus on short-term correlations between ELP and GPA. Thus, there is a need for replication studies that examine the relationship between ELP and academic achievement longitudinally in diverse universities. These studies should use more robust and reliable measures of pre-university academic achievement as well as alternative metrics to capture academic achievement at university. In addition, they should include factors beyond language proficiency, such as students’ motivation, academic skills, social and academic support, and teaching quality, to explore their effects on ELP test scores, academic achievement, and their relationships. Furthermore, future studies could match students who took different ELP tests on relevant characteristics before comparing their academic achievement. Alternatively, these studies could examine the relationships between academic achievement and ELP test scores among students who have taken both ELP tests. To complement quantitative findings from such studies, longitudinal qualitative studies should be conducted to identify the reasons behind the patterns of change in academic achievement across disciplines and students groups and how ELP both influences and is influenced by academic achievement over time. Such research could provide valuable insights into the longitudinal relationship between ELP and academic achievement and shed light on the various factors influencing this relationship in order to inform decisions regarding the form, amount and timing of English language support for non-English background students at English-medium universities.
Footnotes
Appendix 1
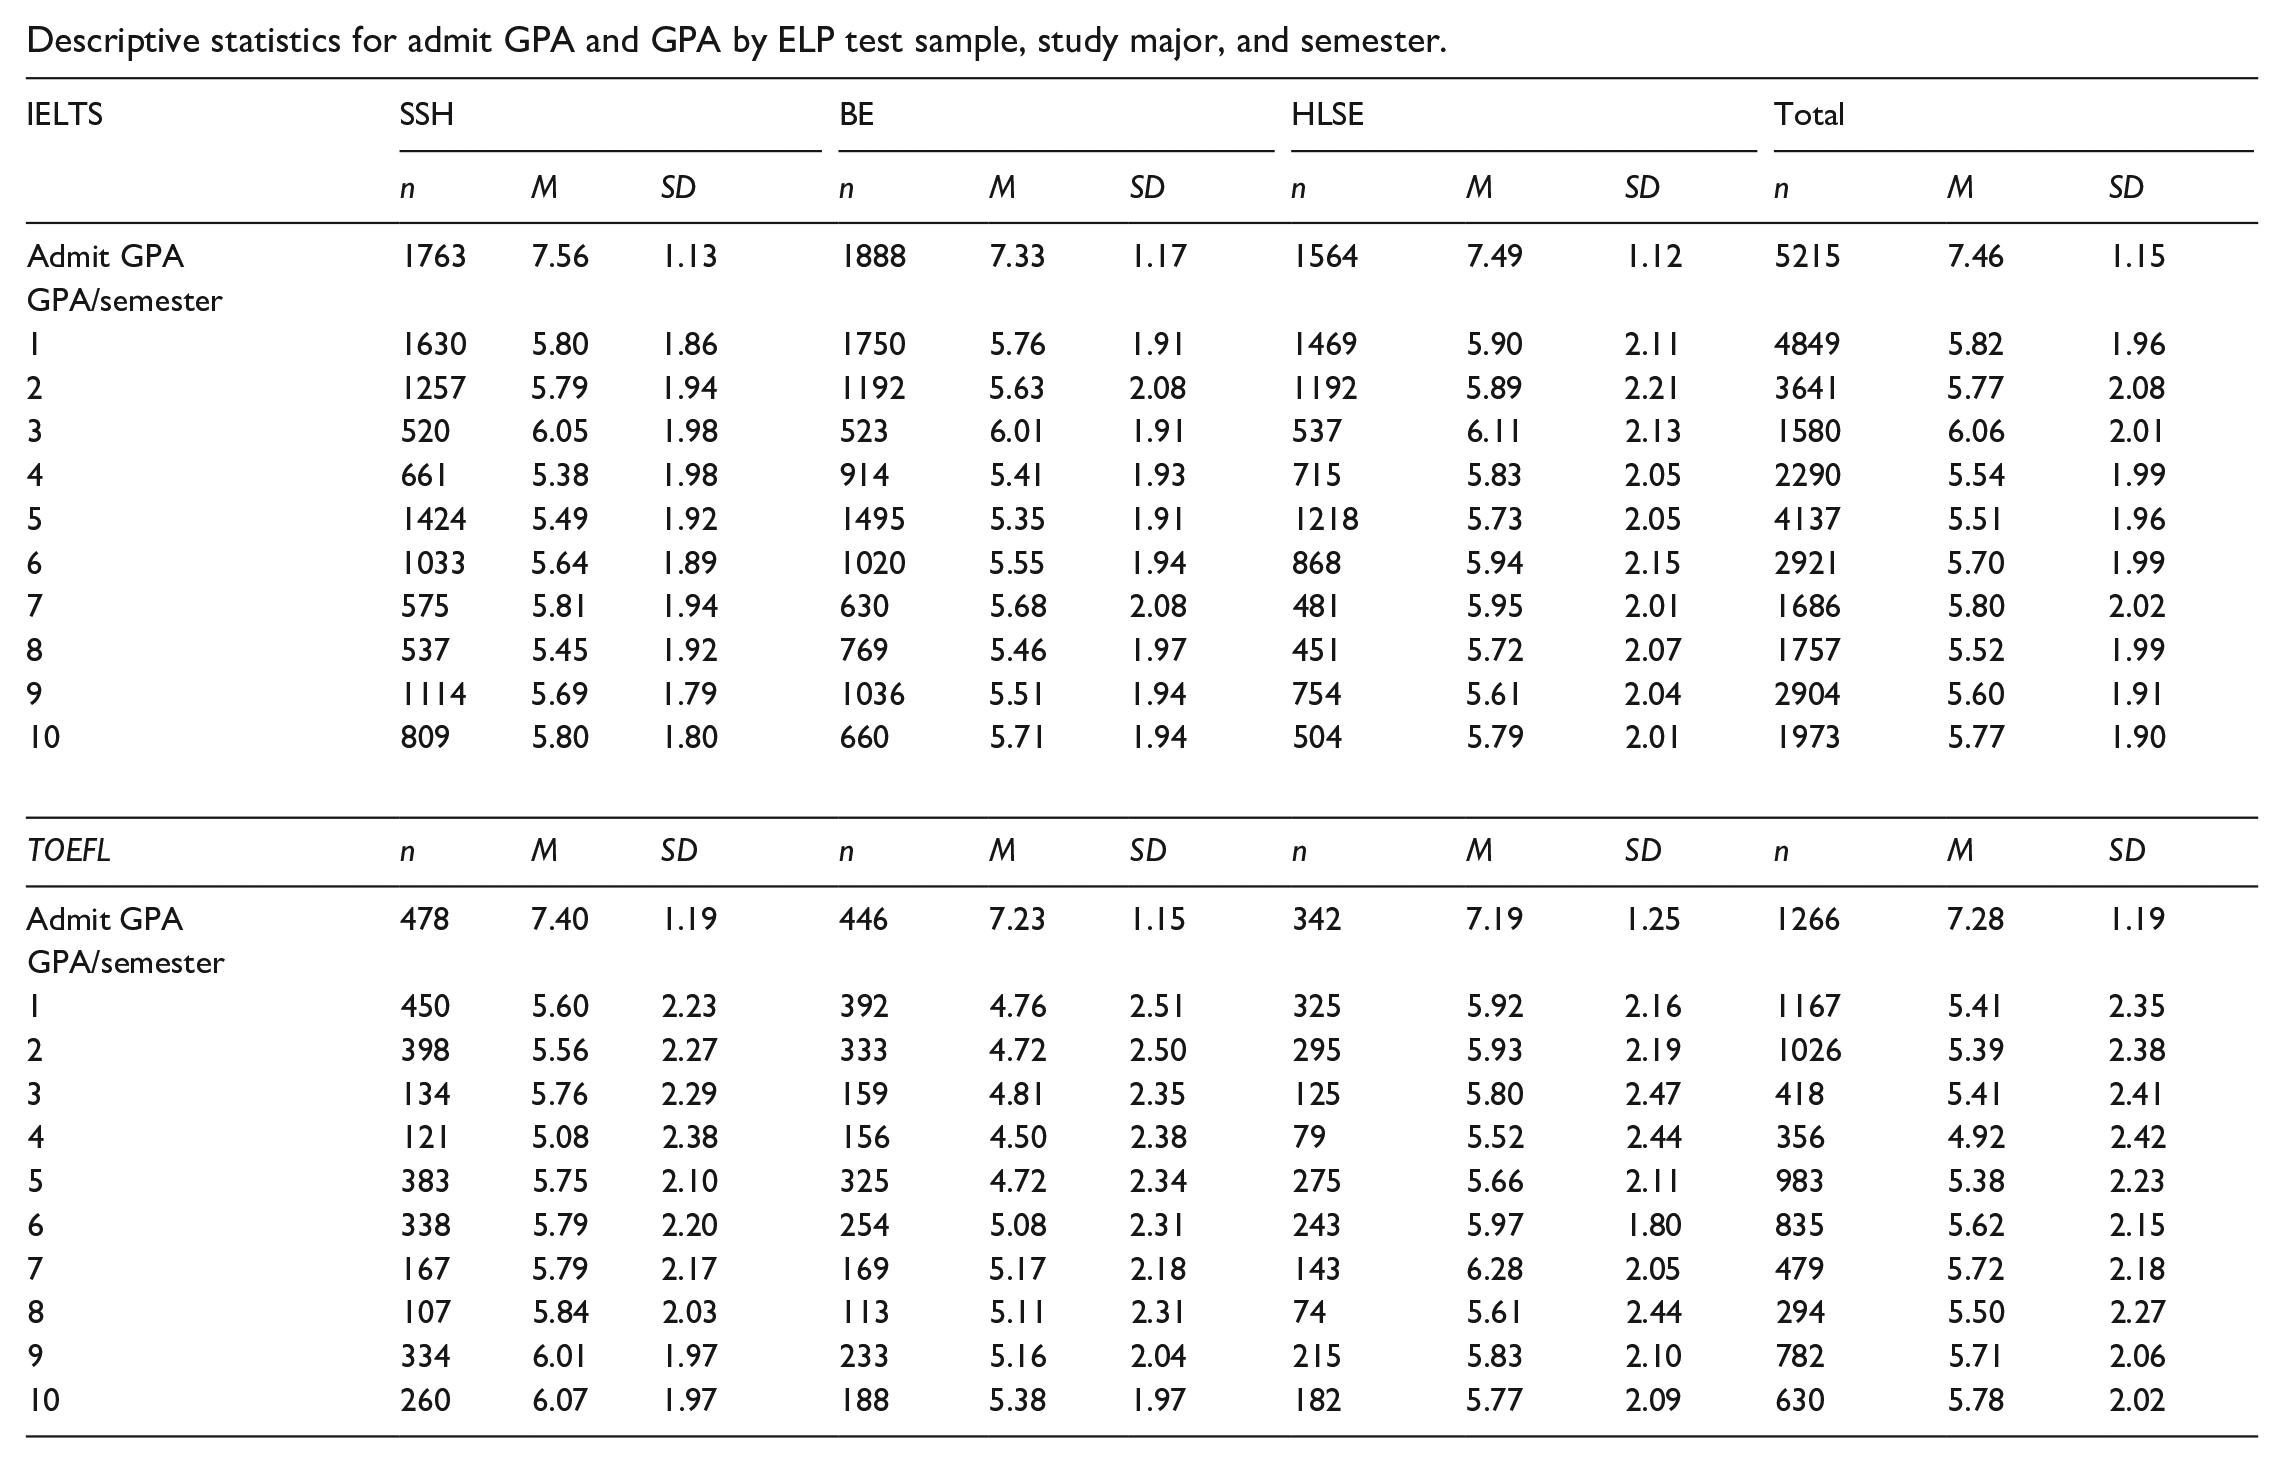
Descriptive statistics for admit GPA and GPA by ELP test sample, study major, and semester.
| IELTS | SSH | BE | HLSE | Total | ||||||||
|---|---|---|---|---|---|---|---|---|---|---|---|---|
| n | M | SD | n | M | SD | n | M | SD | n | M | SD | |
| Admit GPA | 1763 | 7.56 | 1.13 | 1888 | 7.33 | 1.17 | 1564 | 7.49 | 1.12 | 5215 | 7.46 | 1.15 |
| GPA/semester | ||||||||||||
| 1 | 1630 | 5.80 | 1.86 | 1750 | 5.76 | 1.91 | 1469 | 5.90 | 2.11 | 4849 | 5.82 | 1.96 |
| 2 | 1257 | 5.79 | 1.94 | 1192 | 5.63 | 2.08 | 1192 | 5.89 | 2.21 | 3641 | 5.77 | 2.08 |
| 3 | 520 | 6.05 | 1.98 | 523 | 6.01 | 1.91 | 537 | 6.11 | 2.13 | 1580 | 6.06 | 2.01 |
| 4 | 661 | 5.38 | 1.98 | 914 | 5.41 | 1.93 | 715 | 5.83 | 2.05 | 2290 | 5.54 | 1.99 |
| 5 | 1424 | 5.49 | 1.92 | 1495 | 5.35 | 1.91 | 1218 | 5.73 | 2.05 | 4137 | 5.51 | 1.96 |
| 6 | 1033 | 5.64 | 1.89 | 1020 | 5.55 | 1.94 | 868 | 5.94 | 2.15 | 2921 | 5.70 | 1.99 |
| 7 | 575 | 5.81 | 1.94 | 630 | 5.68 | 2.08 | 481 | 5.95 | 2.01 | 1686 | 5.80 | 2.02 |
| 8 | 537 | 5.45 | 1.92 | 769 | 5.46 | 1.97 | 451 | 5.72 | 2.07 | 1757 | 5.52 | 1.99 |
| 9 | 1114 | 5.69 | 1.79 | 1036 | 5.51 | 1.94 | 754 | 5.61 | 2.04 | 2904 | 5.60 | 1.91 |
| 10 | 809 | 5.80 | 1.80 | 660 | 5.71 | 1.94 | 504 | 5.79 | 2.01 | 1973 | 5.77 | 1.90 |
| TOEFL | n | M | SD | n | M | SD | n | M | SD | n | M | SD |
| Admit GPA | 478 | 7.40 | 1.19 | 446 | 7.23 | 1.15 | 342 | 7.19 | 1.25 | 1266 | 7.28 | 1.19 |
| GPA/semester | ||||||||||||
| 1 | 450 | 5.60 | 2.23 | 392 | 4.76 | 2.51 | 325 | 5.92 | 2.16 | 1167 | 5.41 | 2.35 |
| 2 | 398 | 5.56 | 2.27 | 333 | 4.72 | 2.50 | 295 | 5.93 | 2.19 | 1026 | 5.39 | 2.38 |
| 3 | 134 | 5.76 | 2.29 | 159 | 4.81 | 2.35 | 125 | 5.80 | 2.47 | 418 | 5.41 | 2.41 |
| 4 | 121 | 5.08 | 2.38 | 156 | 4.50 | 2.38 | 79 | 5.52 | 2.44 | 356 | 4.92 | 2.42 |
| 5 | 383 | 5.75 | 2.10 | 325 | 4.72 | 2.34 | 275 | 5.66 | 2.11 | 983 | 5.38 | 2.23 |
| 6 | 338 | 5.79 | 2.20 | 254 | 5.08 | 2.31 | 243 | 5.97 | 1.80 | 835 | 5.62 | 2.15 |
| 7 | 167 | 5.79 | 2.17 | 169 | 5.17 | 2.18 | 143 | 6.28 | 2.05 | 479 | 5.72 | 2.18 |
| 8 | 107 | 5.84 | 2.03 | 113 | 5.11 | 2.31 | 74 | 5.61 | 2.44 | 294 | 5.50 | 2.27 |
| 9 | 334 | 6.01 | 1.97 | 233 | 5.16 | 2.04 | 215 | 5.83 | 2.10 | 782 | 5.71 | 2.06 |
| 10 | 260 | 6.07 | 1.97 | 188 | 5.38 | 1.97 | 182 | 5.77 | 2.09 | 630 | 5.78 | 2.02 |
Appendix 2
Acknowledgements
The author thanks York University for funding this study; Jonathan Schneider for help with retrieving data for the study; Jason Holmes for cleaning and organizing the data; Hugh McCague for conducting the multilevel modeling analyses; and Saskia Van Viegen and Jason Holmes for comments on earlier versions of the paper. The opinions expressed in the paper are those of the author.
Author contributions
Declaration of conflicting interests
The author declared no potential conflicts of interest with respect to the research, authorship, and/or publication of this article.
Funding
The author(s) disclosed receipt of the following financial support for the research, authorship, and/or publication of this article: This study was funded by York University, Canada.