
Abstract
Applicants must often demonstrate adequate English proficiency when applying to postsecondary institutions by taking an English language proficiency test, such as the TOEFL iBT, IELTS Academic, or Duolingo English Test (DET). Concordance tables aim to provide equivalent scores across multiple assessments, helping admissions officers to make fair decisions regardless of the test that an applicant took. We present our approaches to addressing practical (i.e., data collection and analysis) challenges in the context of building concordance tables between overall scores from the DET and those from the TOEFL iBT and IELTS Academic tests. We summarize a novel method for combining self-reported and official scores to meet recommended minimum sample sizes for concordance studies. We also evaluate sensitivity of estimated concordances to choices about how to (a) weight the observed data to the target population; (b) define outliers; (c) select appropriate pairs of test scores for repeat test takers; and (d) compute equating functions between pairs of scores. We find that estimated concordance functions are largely robust to different combinations of these choices in the regions of the proficiency distribution most relevant to admissions decisions. We discuss implications of our results for both test users and language testers.
Keywords
Inter-test concordances are one of many resources that support fair decision-making across different high-stakes assessments used for similar purposes. For example, the TOEFL iBT (ETS, 2023; henceforth “TOEFL”), IELTS Academic (IELTS, 2023; henceforth “IELTS”), and the Duolingo English Test (DET, 2023; henceforth “DET”) are widely accepted by postsecondary institutions to satisfy English language proficiency (ELP) admissions requirements (Isbell & Kremmel, 2020). Concordance tables among TOEFL, IELTS, and DET help institutions make more equitable admissions decisions among international applicants who may be equally qualified but take different ELP tests for logistical or economic reasons. Given the recent emergence of new ELP tests and the introduction of at-home versions of legacy center-based tests, it is increasingly important for test score users to understand concordances and test comparability, and for test developers to have scalable processes for producing and updating concordance tables.
Because concordance tables influence high-stakes decisions, they must be robust to methodological decisions; how the data set is constructed and concordance tables computed may substantively impact the results. Prior ELP concordance studies (e.g., Clesham & Hughes, 2020; ETS, 2010) contain limited information about the methodological choices made, such as adjustments to the data, the particular form of log-linear presmoothing, or justification for the chosen equating methods. This paper presents the primary data-gathering and methodological challenges, and our approaches to addressing them, encountered when building concordance tables between DET overall scores and those of TOEFL and IELTS.
Context
While the IELTS, TOEFL, and DET differ in task design and test administration, all three tests purport to measure ELP and to be suitable for use in postsecondary (Isbell & Kremmel, 2020; LaFlair et al., 2022; Powers et al., 2017). Furthermore, previous studies have demonstrated strong total-score correlations for TOEFL–IELTS (
The DET previously produced total-score concordances with TOEFL
Methods
A concordance requires collecting data, specifying the target population, and choosing equating methods.
Data collection
Obtaining individuals’ scores on tests developed by different organizations is challenging because few people attempt multiple tests, and data from other organizations are not readily available. To obtain official DET–TOEFL and DET–IELTS paired score data, we contacted DET test takers who had taken the test since late March 2022 and invited them to submit official IELTS or TOEFL score reports (from tests taken within 90 days of the DET) in exchange for compensation. This provided sample sizes of 1,643 (IELTS) and 328 (TOEFL).
In order to meet recommended minimum sample sizes (e.g., 1500 suggested by Kolen & Brennan, 2014, p. 304), we also included self-reported IELTS/TOEFL scores in analyses. These scores are requested during the DET exit survey. Potential reporting error was investigated using a subset of test takers who submitted both an official score report and self-reported their scores (the “paired sample”). Figure 1 shows that average self-reported scores are slightly higher than average official scores for each of TOEFL and IELTS across the DET score range.
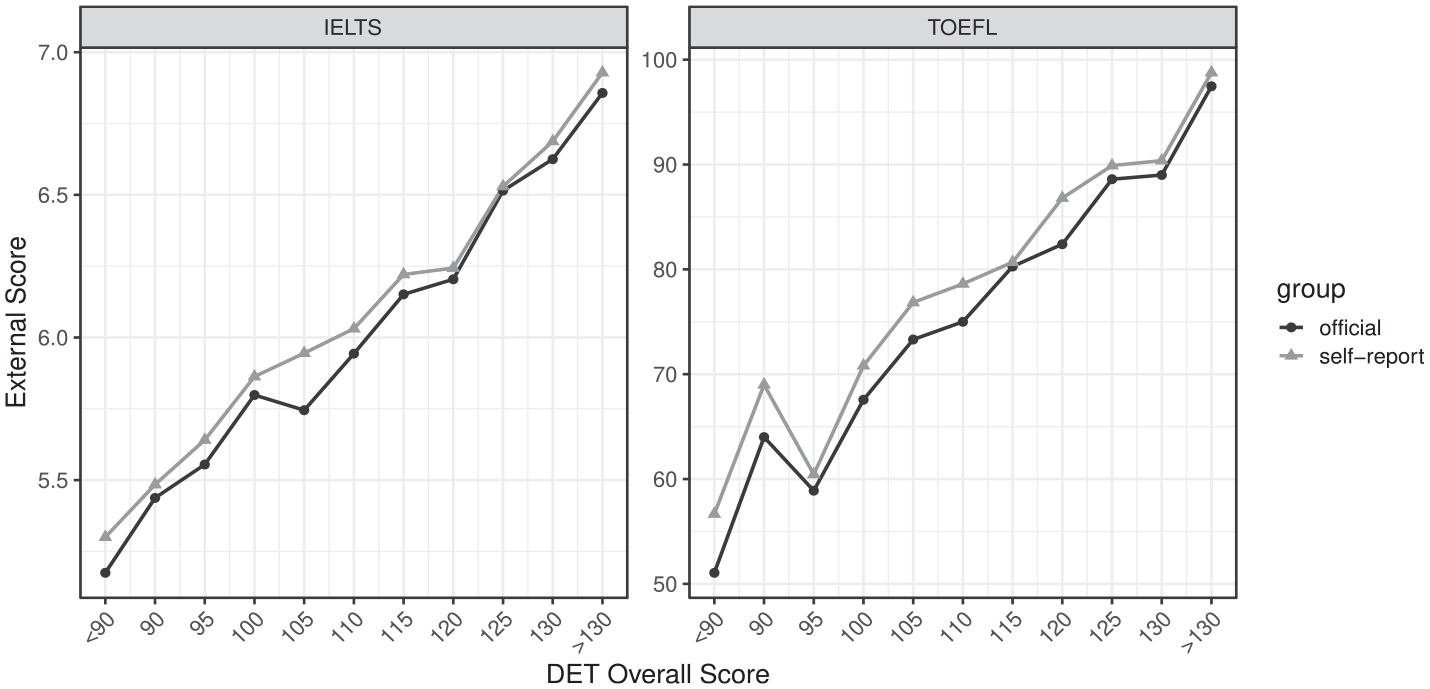
Estimated average self-reporting bias for test takers with different DET scaled scores. The sample sizes for paired score data are
We adjusted the self-reported scores to account for the mean reporting bias as follows. For each of IELTS and TOEFL at a given DET scale score point (10–160 in 5-point increments), we identified the test takers in the paired sample whose DET score equaled the score or one scale point above or below.
1
We computed the average reporting bias
Weighting to target population
We define the target population as the DET test-taker population. However, not all DET test takers also take TOEFL or IELTS, and few of those who do submitted score reports. We thus used weighting to adjust our analysis sample to match the marginal distribution of DET scores in the target population. Specifically, we adjusted the joint distribution of DET and IELTS/TOEFL scores to weight data points more (or less) if the DET score was underrepresented (or overrepresented) for those who reported TOEFL/IELTS scores. This process ensured that statistics of the weighted distribution (e.g., marginal mean and variance) matched statistics of the target DET population.
Concordance process
Although equating and concordance differ in assumptions (e.g., Pommerich, 2007), they employ the same methods. An equating analysis entails multiple decisions, which could impact the resulting concordance. We conducted sensitivity analyses to guide selection of the final concordance. Sensitivity analysis entails repeating a data analysis multiple times while varying aspects of the data and/or method to see how these decisions impact results. The five varied factors were (1) disambiguating multiple scores for individual test takers (highest or most recent); (2) removing bivariate outliers (
We evaluated results by comparing candidate concordances and examining the conditional standard errors of equating (SEE). Given that the concordance process included adjusting self-reported data, reweighting the analysis sample, and smoothing, analytical SEE formulas (e.g., von Davier et al., 2004) potentially underestimate the uncertainty in this analysis. We thus computed SEEs by bootstrapping the entire estimation procedure (see Online Supplemental for details).
Score disambiguation
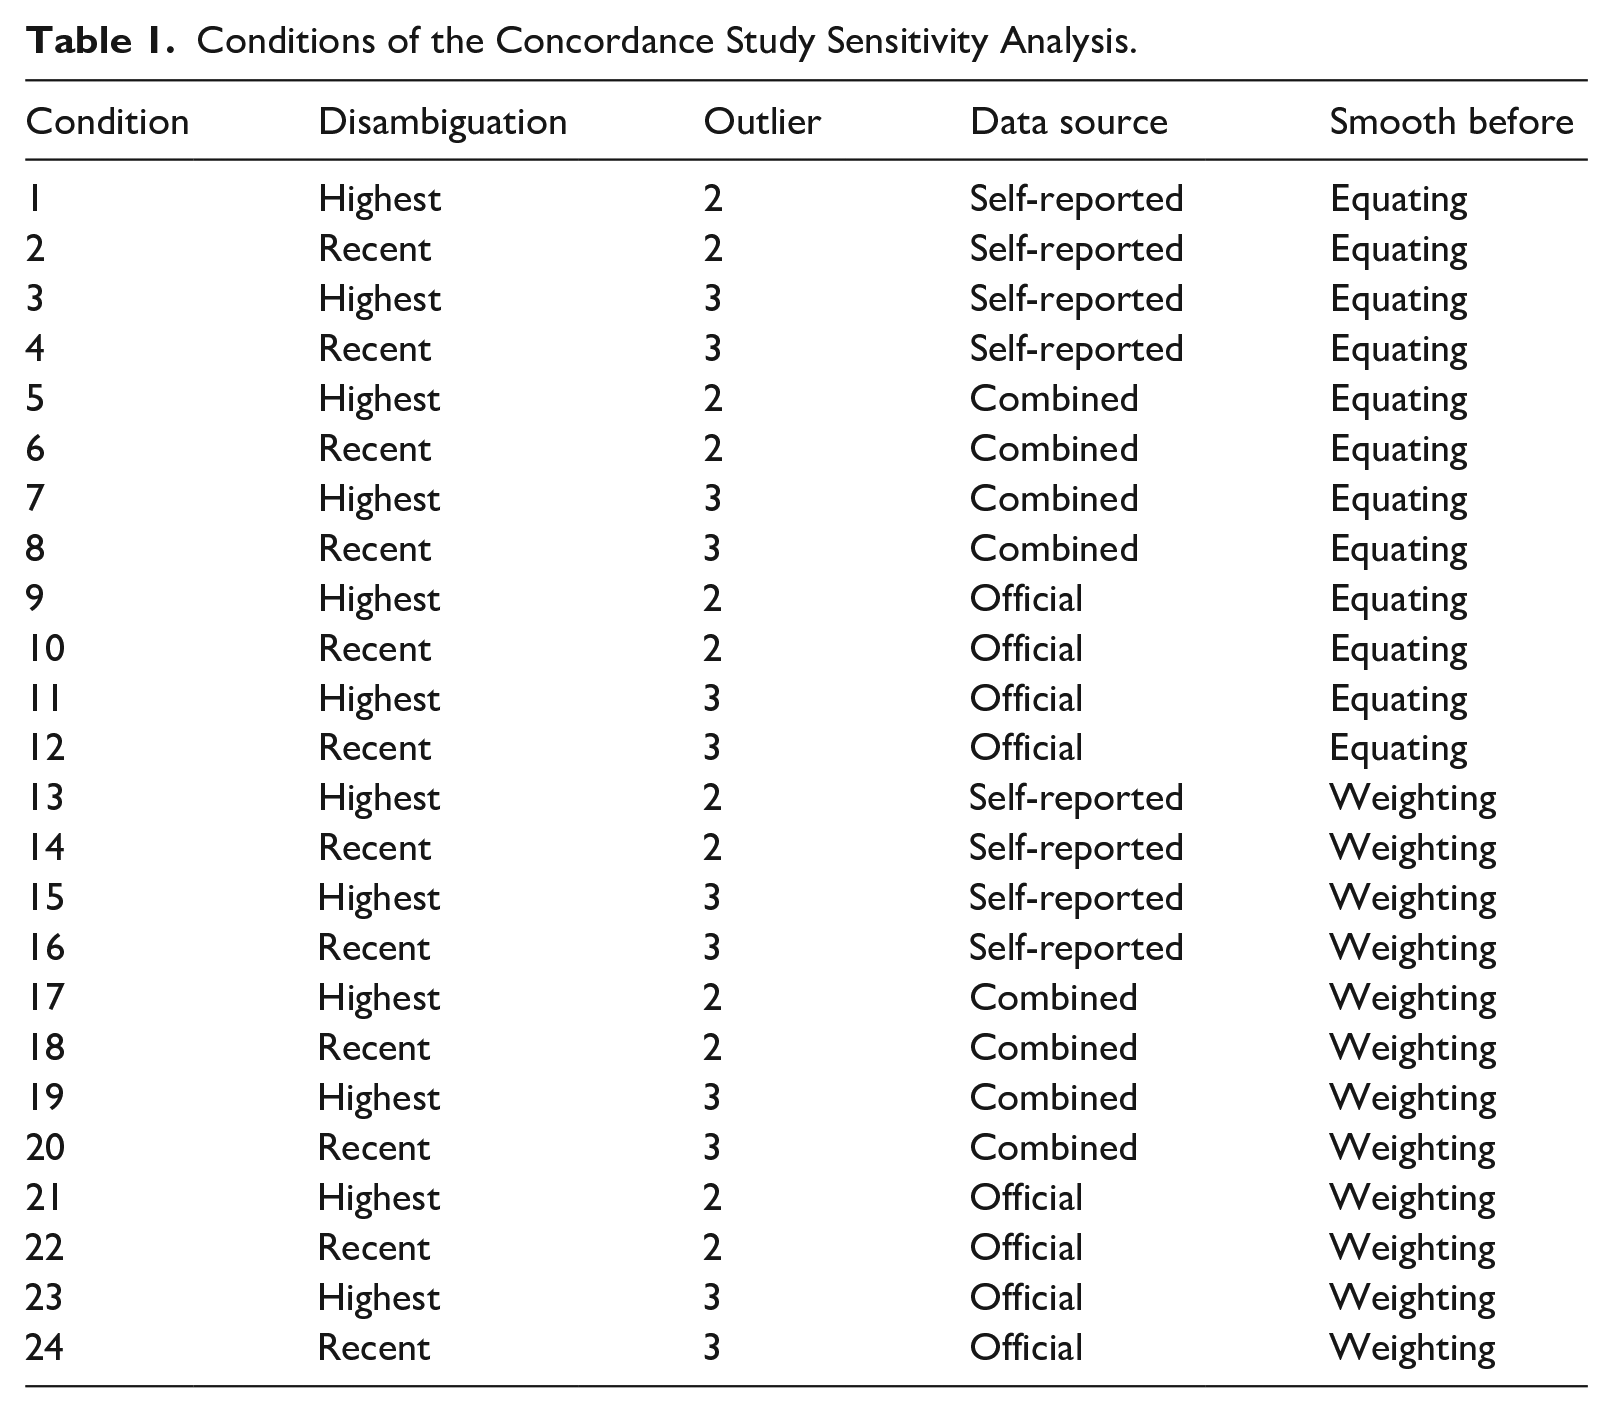
An individual might take the DET multiple times and/or self-report multiple TOEFL/IELTS scores. To uniquely identify DET scores, we first kept only the first seven DET attempts (including sessions not certified due to equipment error or minor rule violations); only 1.1% of test takers attempted the DET more than seven times between January 2019 and July 2022. We then excluded all attempts prior to March 28, 2022, coinciding with the launch of a new item type on the test. We finally chose a test taker’s highest or most recent DET score, depending on the condition in the sensitivity analysis (see Table 1). These disambiguation rules arguably produce scores that are representative of the scores that institutions receive from applicants. To uniquely identify the IELTS/TOEFL self-report score, we chose a test taker’s highest or most recent score depending on condition, and then ensured that the corresponding assessment date was at most 4 months 2 before or after the DET assessment date.
Conditions of the Concordance Study Sensitivity Analysis.
Outlier removal
It is reasonable to expect that a small proportion of test scores reflect a large measurement error (e.g., due to illness), and therefore do not accurately represent a test taker’s ability. As shown in Figure 2, some data points appear to deviate noticeably from the bivariate relationship. We wanted to remove such score pairs that might unduly influence the final concordance, making it less accurate for the majority of test takers. We eliminated pairs of scores if the DET
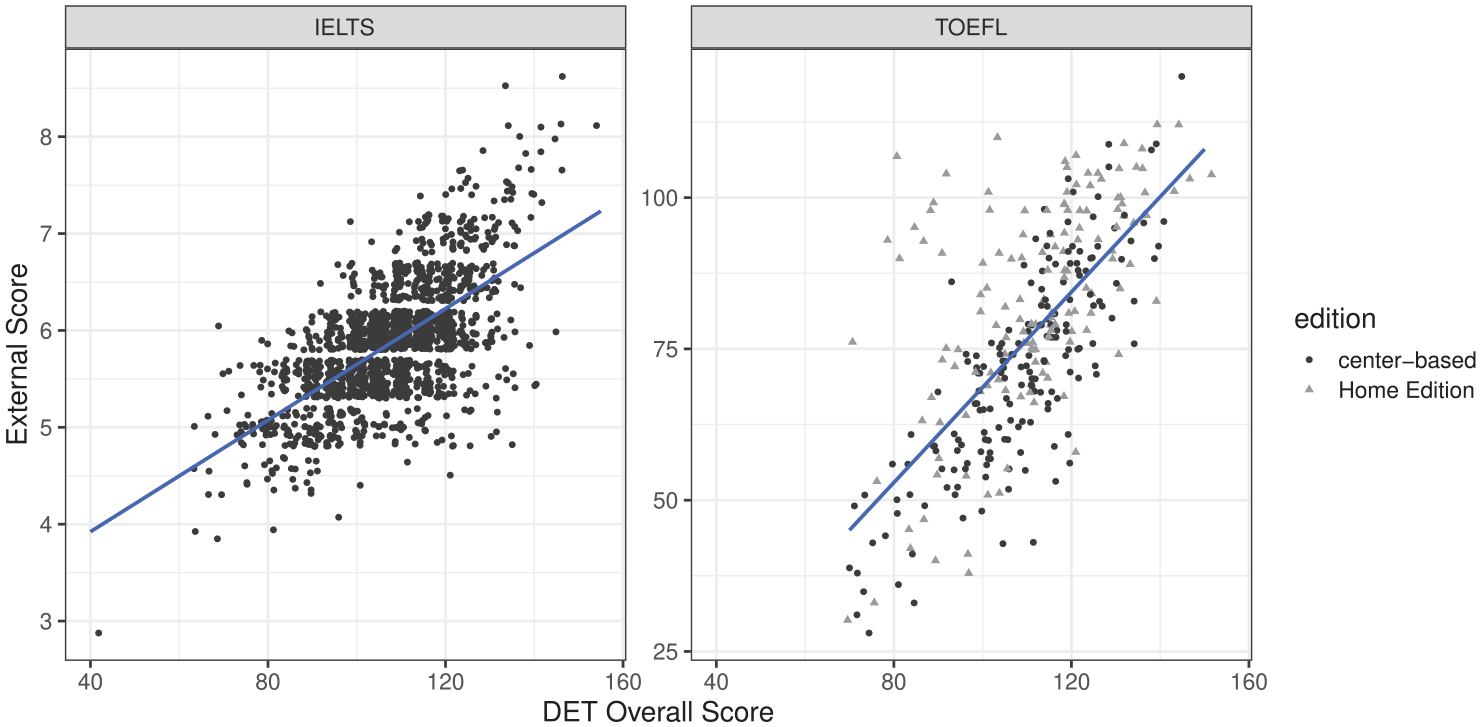
Scatterplots between DET scaled scores and official TOEFL/IELTS scores.
Data source
Even after adjusting for reporting bias, official and self-report data sources might yield different concordance outcomes. We thus estimated concordances using only official data, only self-report data, and the combined data.
Smoothing order
Log-linear pre-smoothing (von Davier et al., 2004) could be applied before or after the data-weighting step. The order of weighting and pre-smoothing could impact the results. We thus evaluated both orders (weighting first and pre-smoothing first).
Equating method
We compared two standard equating methods: equipercentile (Kolen & Brennan, 2014) and kernel equating (von Davier et al., 2004). Due to highly similar results from both methods, only kernel-based results are reported. (See the Online Supplemental for details on equipercentile and kernel equating and the rationale for choosing kernel.)
Table 1 summarizes the 24 conditions of the sensitivity analysis resulting from fully crossing all manipulated factors except equating method.
Results
Figure 3 displays concordance results across studied conditions using kernel equating. The
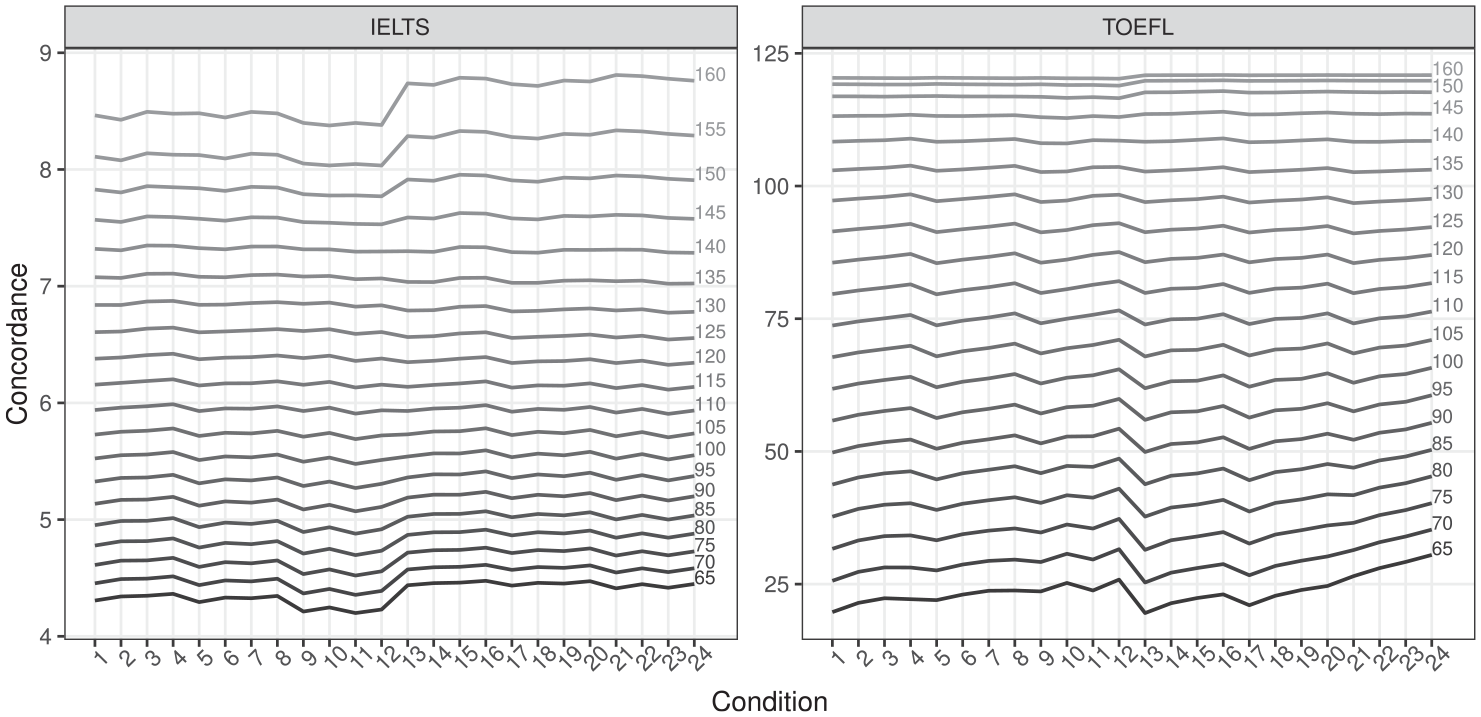
Results across all conditions, with the
Although there was evidence of a small bias in self-report data, combining the official and adjusted self-report data sources had minimal impact on concordance estimates, particularly at score points most relevant to postsecondary admissions decisions (e.g., IELTS 6–7.5 and TOEFL 80–110). At lower score points, especially for TOEFL given the smaller sample, the concordance results are less stable. Supplementing the official data with self-report data thus allowed for a more accurate concordance across a wider score range.
Concordance method selection
We chose a final concordance from the candidate concordances to ensure that it made logical sense given score usage. In addition to combining official and self-report data, we decided the following. For disambiguation rule, we picked recent to ensure the data were as current as possible and to minimize the time between tests. For outlier threshold, we chose a
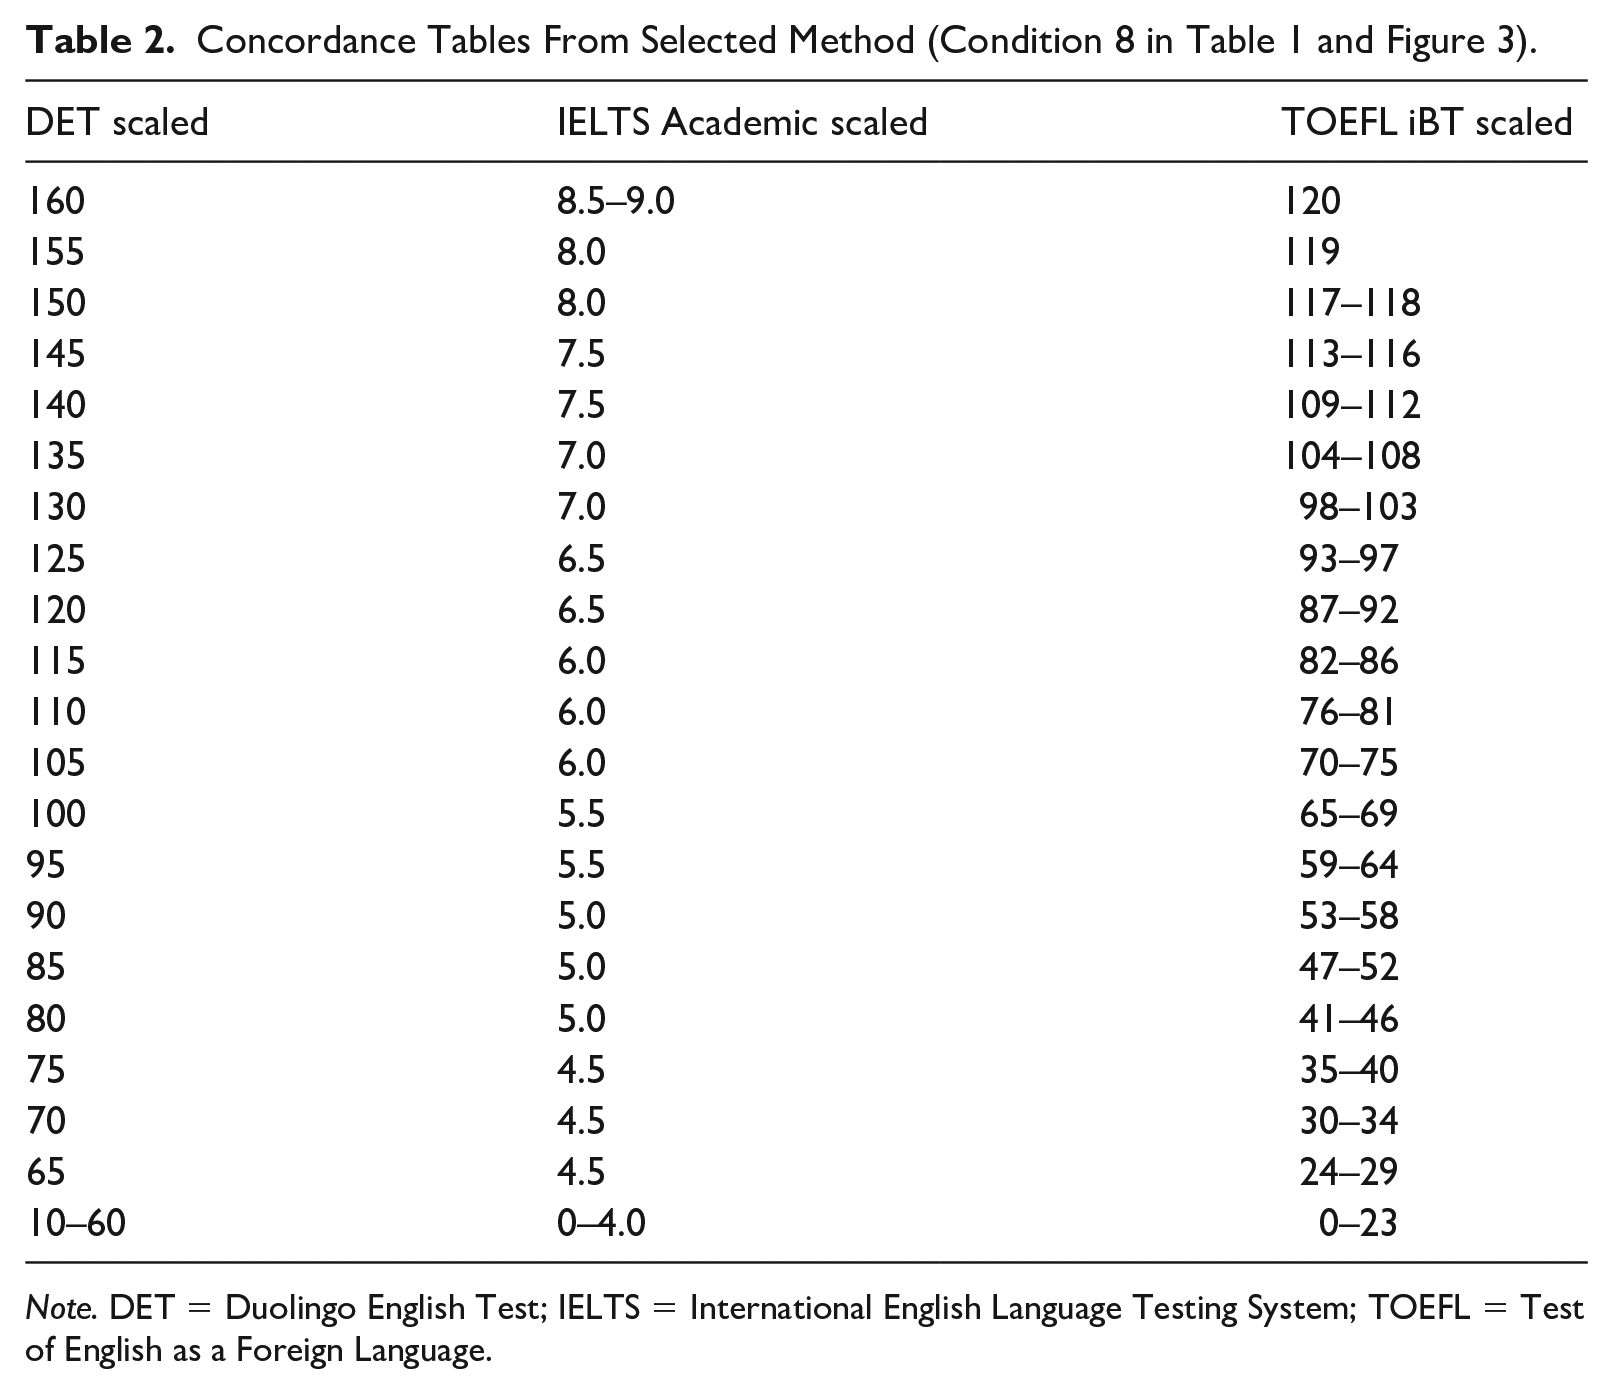
Note. DET = Duolingo English Test; IELTS = International English Language Testing System; TOEFL = Test of English as a Foreign Language.
Conclusion
Building concordances between high-stakes language tests is intrinsically difficult. Obtaining official data for the same individuals is challenging without institutional collaboration, and the pool of individuals who have taken both tests is often modest. Our data set of official scores was not large, particularly for TOEFL, but not atypical: the most recent TOEFL–IELTS concordance is based on a sample of 1,153 test takers (ETS, 2010). (Conversely, a concordance between ACT and SAT was based on
Our results provide two reasons for optimism. First, despite the intrinsic limitations of self-reported scores, they can usefully contribute to concordance studies, particularly if paired self-reported–official data are available. Our paired sample indicated that test takers tend to over-report their scores. But the magnitude of reporting bias was modest, and a standard adjustment can mitigate the impact of this bias. We found little sensitivity to whether the concordance tables were constructed using adjusted self-reported data alone, official data alone, or combined data. While this finding may not generalize, it warrants evaluation in other contexts because it mitigates the difficulty of collecting data for concordance studies. This methodological innovation is useful for language test developers, given that trends of institutions accepting multiple tests, at-home and center-based versions of tests, and frequent changes to test structure and content imply the need for more frequent concordance studies.
Another reason for optimism is the general robustness to different methodological choices, particularly in the scaled-score regions most relevant to institutional decision-making. This is somewhat surprising given the modest sample sizes, particularly DET–TOEFL, but is welcome given the role of concordance tables in supporting fair evaluations of applicants. This finding is useful for test score users and admissions policymakers, who must evaluate and interpret multiple tests used for the same purpose. However, it cannot be assumed that all concordance studies would be equally robust to methodological decisions. Thus, a clear accounting of decisions regarding data acquisition and analysis, and a demonstration of robustness to such decisions, should be best practice for concordance studies. Such methodological transparency would allow stakeholders to understand the origin and limitations of concordances.
A limitation of this study is that it considers only overall scores. The DET, TOEFL, and IELTS all report an overall score and four subscores. The DET reports integrated subscores (i.e., each subscore reflects a combination of two of speaking, writing, reading, and listening; Cardwell et al., 2023). There is thus no one-to-one correspondence between DET subscores and those of TOEFL/IELTS, and so the methods used here do not apply. As stakeholders use subscores in decision-making, future research should employ alternative methods to compare the tests’ subscores.
While there is no guarantee that our findings will generalize to other concordance analyses between language tests, we expect that the challenges in data acquisition and synthesis and methodological choices will exist in other applications. Thus, our inventory of practical issues and approaches to addressing them may provide useful guidance for conducting sensitivity analyses in concordance studies.
Supplemental Material
sj-pdf-1-ltj-10.1177_02655322231195027 – Supplemental material for Practical considerations when building concordances between English tests
Supplemental material, sj-pdf-1-ltj-10.1177_02655322231195027 for Practical considerations when building concordances between English tests by Ramsey L. Cardwell, Steven W. Nydick, J.R. Lockwood and Alina A. von Davier in Language Testing
Footnotes
Acknowledgements
We are grateful to Rogelio Alvarez, Kevin Hao, Shawn Jones, and Anthony Verardi for their indispensable roles in implementing the study. We also thank Paula Winke, Dylan Burton, Ruslan Suvorov, and the Language Testing reviewers for their valuable comments on previous versions and editorial guidance.
Author contributions
R.L.C.: Conceptualization; Data curation; Methodology; Project administration; Writing—original draft; Writing—review & editing.
S.W.N.: Conceptualization; Data curation; Formal analysis; Methodology; Validation; Visualization; Writing—original draft; Writing—review & editing.
J.R.L.: Conceptualization; Formal analysis; Methodology; Supervision; Validation; Writing—original draft; Writing—review & editing.
A.A.v.D.: Methodology; Resources; Supervision; Writing—review & editing.
Declaration of conflicting interests
The authors declared the following potential conflicts of interest with respect to the research, authorship, and/or publication of this article: All authors are employees of Duolingo, the developer of the Duolingo English Test.
Funding
The authors received no financial support for the research, authorship, and/or publication of this article.
Supplemental material
Notes
References
Supplementary Material
Please find the following supplemental material available below.
For Open Access articles published under a Creative Commons License, all supplemental material carries the same license as the article it is associated with.
For non-Open Access articles published, all supplemental material carries a non-exclusive license, and permission requests for re-use of supplemental material or any part of supplemental material shall be sent directly to the copyright owner as specified in the copyright notice associated with the article.